Airline Quality Rating 2012
|
|
|
- Elijah Hopkins
- 10 years ago
- Views:
Transcription

1 Airline Quality Rating 2012 Dr. Brent D. Bowen College of Technology Department of Aviation Technology Purdue University Dr. Dean E. Headley W. Frank Barton School of Business Department of Marketing Wichita State University Our 22 nd year of reporting airline performance April, 2012
2
3 Airline Quality Rating 2012 Dr. Brent D. Bowen Purdue University College of Technology Department of Aviation Technology Dr. Dean E. Headley Wichita State University W. Frank Barton School of Business Department of Marketing April, 2012
4 ABOUT THE AUTHORS Dr. Brent Bowen is Professor and Head, Department of Aviation Technology within the Purdue University College of Technology. Previously, Dr. Bowen served as Professor and Chair, Aviation Science, Parks College of Engineering, Aviation and Technology, and directed the office of Air Transportation Policy and served as Senior Fellow for the National Center for Aviation Safety Research at Saint Louis University. Bowen attained his Doctorate in Aviation Sciences from Oklahoma State University and a Master of Business Administration degree from Oklahoma City University. His Federal Aviation Administration certifications include Airline Transport Pilot (Type-rated Douglas DC-3 SIC), Certified Flight Instructor (SEL, MEL, Instrument) with Gold Seal, Advanced- Instrument Ground Instructor, Aviation Safety Counselor, and Aerospace Education Counselor. Dr. Bowen has authored/co-authored numerous successful grand proposals totaling awards exceeding $25 million and has in excess of 300 publications, papers and professional program appearances to his credit. His research interests focus on aviation applications of public productivity enhancement and marketing channels, specifically in the areas of service quality evaluation, benchmarking, safety and security. Dr. Bowen is an active industry consultant, pilot, and former fixed-base operator and scheduled air carrier operator. Dr. Bowen served on the National Research Council Steering Group on the Small Aircraft Transportation System and was named by the FAA Administrator to a National Academy of Science study group on airspace optimization as a component of the Next Generation Air Transportation System. Additionally, Dr. Bowen was appointed by FAA Administrator to serve on a National Academy of Science panel to examine the need to cultivate a future generation of transportation leaders. Dr. Dean E. Headley is Associate Professor of Marketing in the Department of Marketing at the W. Frank Barton School of Business, Wichita State University. He holds a Doctorate in Marketing and Statistics from Oklahoma State University, a Master of Business Administration degree from Wichita State University, and a Master of Public Health Degree from the University of Oklahoma. Dr. Headley s research interests include methodology development for measurement of service quality, the connection between service quality and consumer behavior, consumer choice processes in service settings, and the effects of marketing activities on consumers and providers of services. Dr. Bowen s and Dr. Headley s research on the development of the national Airline Quality Rating (AQR) is viewed by more than 75 million people each year and is annually featured by national news outlets such as ABC s Good Morning America, The Cable News Network, The Today Show, C-Span, USA Today, The Associated Press, The Wall Street Journal, Aviation Week and Space Technology, the network evening news shows, and in numerous other national and international media. Bowen and/or Headley have served as invited expert witnesses before the U.S. House of Representatives Committee on Government Operations and have served as invited speakers and panelists for such groups as the National Academy of Sciences/Transportation Research Board, Department of Transportation and other Congressional and Executive panels. Their body of research has been recognized with awards from the American Marketing Association, the American Institute of Aeronautics and Astronautics, Embry- Riddle Aeronautical University, the Travel and Transportation Research Association and others.
5 AIRLINE QUALITY RATING 2012 Brent D. Bowen, Purdue University Dean E. Headley, Wichita State University Abstract The Airline Quality Rating (AQR) was developed and first announced in early 1991 as an objective method for assessing airline quality on combined multiple performance criteria. This current report, the Airline Quality Rating 2012, reflects monthly Airline Quality Rating scores for calendar year AQR scores for 2011 are based on 15 elements in four major areas that focus on airline performance aspects important to air travel consumers. The Airline Quality Rating 2012 is a summary of month-by-month quality ratings for U.S. airlines that are required to report performance by virtue of having at least 1% of domestic scheduled-service passenger revenue during Using the Airline Quality Rating system of weighted averages and monthly performance data in the areas of ontime arrivals, involuntary denied boardings, mishandled baggage, and a combination of 12 customer complaint categories, airlines comparative performance for the calendar year of 2011 is reported. This research monograph contains a brief summary of the AQR methodology, detailed data and charts that track comparative quality for domestic airline operations for the 12-month period of 2011, and industry results. Also, comparative Airline Quality Rating data for 2010 are included, where available, to provide historical perspective regarding performance quality in the industry. The Airline Quality Rating (AQR) System The majority of quality ratings available in the past have relied on subjective surveys of consumer opinion that were infrequently collected. This subjective approach yields a quality rating that is essentially non-comparable from survey to survey for any specific airline. Timeliness of survey-based results can be a problem in the fast-paced airline industry as well. Before the Airline Quality Rating, there was effectively no consistent method for monitoring the quality of airlines on a timely, objective, and comparable basis. With the introduction of the AQR, a multi-factor, weighted average approach became available that had not been used before in the airline industry. The method relies on utilizing published, publicly available data that reports actual airline performance on critical quality criteria important to consumers and combines them into a rating system. The final result is a rating for individual airlines with interval scale properties that is comparable across airlines and across time periods. The Airline Quality Rating (AQR) is a weighted average of multiple elements (see Table 1) important to consumers when judging the quality of airline services. Elements considered for inclusion in the rating scale were screened to meet two basic criteria; 1) an element must be obtainable from published data sources for each airline; and 2) an element must have relevance to consumer concerns regarding airline quality. Data for
6 the elements used in calculating the ratings represent performance aspects (on-time arrival, mishandled baggage, involuntary denied boardings, and 12 customer complaint areas) of airlines that are important to consumers. All of the elements are reported in the Air Travel Consumer Report maintained by the U.S. Department of Transportation. Weights were originally established by surveying 65 airline industry experts regarding their opinion as to what consumers would rate as important (on a scale of 0 to 10) in judging airline quality. Each weight and element was assigned a plus or minus sign to reflect the nature of impact for that criterion on a consumer's perception of quality. For instance, the criteria of on-time arrival performance are included as a positive element because it is reported in terms of on-time successes, suggesting that a higher number is favorable to consumers. The weight for this criterion is high due to the importance most consumers place on this aspect of airline service. Conversely, the criteria that includes mishandled baggage is included as a negative element, and is reported in terms of mishandled bags per 1000 passengers served, suggesting that a higher number is unfavorable to consumers. Because having baggage arrive with passengers is important to consumers the weight for this criterion is also high. Weights and positive/negative signs are independent of each other. Weights reflect importance of the criteria in consumer decision-making, while signs reflect the direction of impact that the criteria should have on the consumer's rating of airline quality. When all criteria, weights and impacts are combined for an airline over the year, a single interval scaled value is obtained. This value is comparable across airlines and across time periods. In the spring of 2002, a nationwide survey of frequent flyers was conducted that allowed a revisiting of the weighting for the AQR elements. Analysis of the sample of 766 opinions showed no appreciable difference in the relative weights for the AQR elements. To maintain comparability across the years, the weights have been held constant. The Airline Quality Rating criteria and the weighted average methodology allow a focused comparison of domestic airline performance. Unlike other consumer opinion approaches that have relied on consumer surveys and subjective opinion, the AQR continues to use a mathematical formula that considers multiple weighted objective criteria to arrive at a single, fully comparable rating for airline industry performance. The Airline Quality Rating provides both consumers and industry watchers a means for monitoring comparative quality for each airline on a timely basis, using objective, performance-based data. Over its 22 year history, the Airline Quality Rating has often been cited as an industry standard for comparing airline performance. Currently the AQR stands as the only regularly published rating available for airline performance. With the continued global trend in airline operations alliances, the argument becomes even stronger for the Airline Quality Rating to be used as a standard method for comparing the quality of airline performance for international operations as well.
7 Table 1 AIRLINE QUALITY RATING CRITERIA, WEIGHTS AND IMPACT CRITERIA WEIGHT IMPACT (+/-) OT On-Time DB Denied Boardings MB Mishandled Baggage CC Customer Complaints Flight Problems Oversales Reservations, Ticketing, and Boarding Fares Refunds Baggage Customer Service Disability Advertising Discrimination Animals Other Data for all criteria is drawn from the U.S. Department of Transportation's monthly Air Travel Consumer Report. ( The formula for calculating the AQR score is: (+8.63 x OT) + (-8.03 x DB) + (-7.92 x MB) + (-7.17 x CC) AQR = ( )
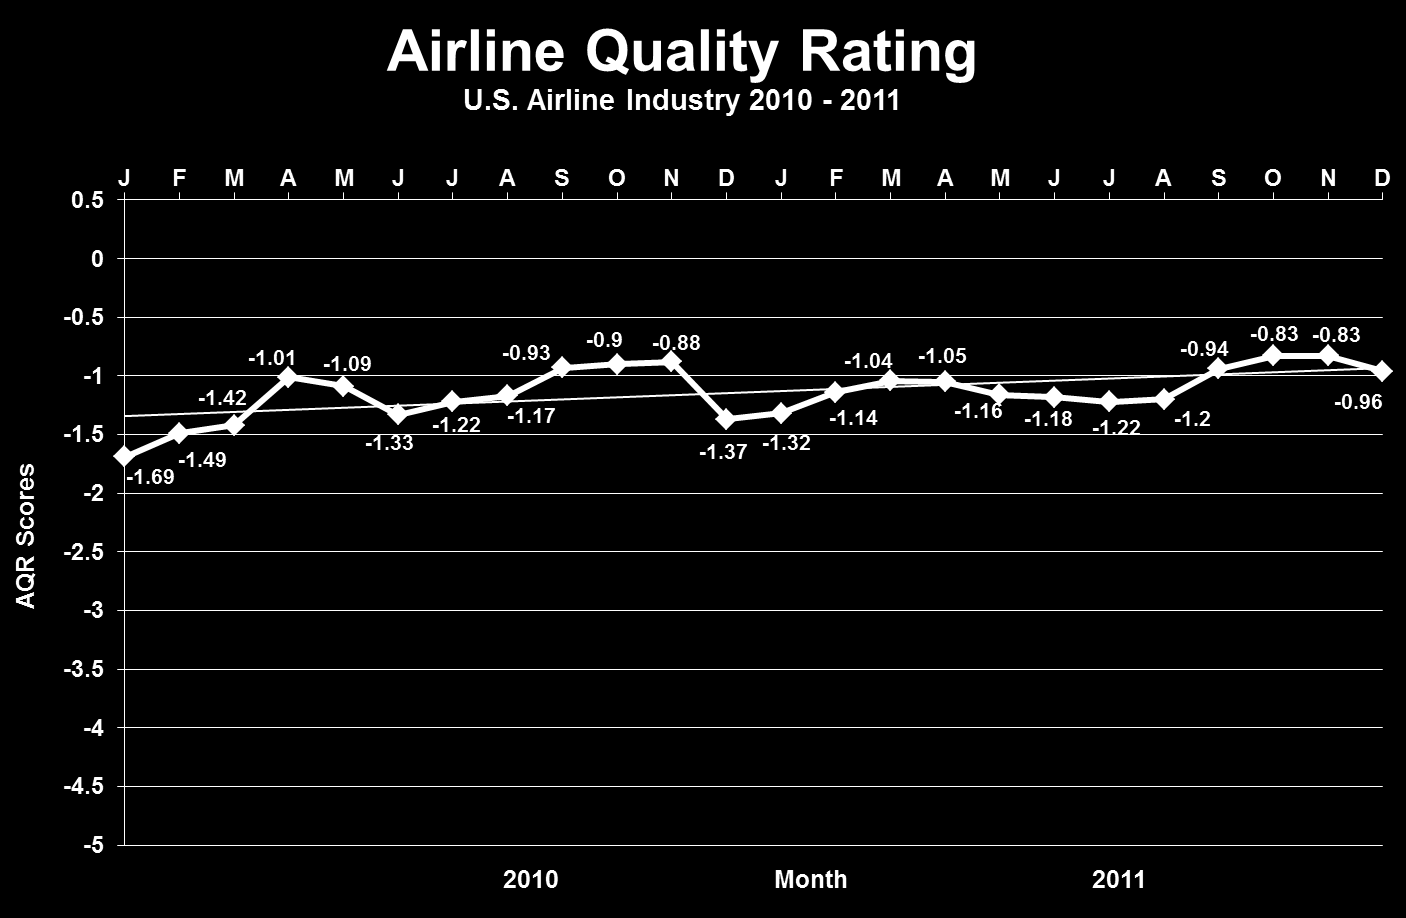
8 What the Airline Quality Rating Tells Us About 2011 The Airline Quality Rating industry score for 2011 shows an industry that has again improved in overall quality over the previous year. As an industry, performance in 2011 was the best in the 21 year history of the Airline Quality Rating. Of the 15 carriers rated in both 2010 and 2011, ten carriers improved in Airline Quality Rating scores. Frontier had the largest improvement in overall score, while Continental and Mesa had the largest decline in AQR score for The overall industry AQR score was better in 2011 than in 2010, due to continued improvement in industry performance in all four areas tracked. As an industry, the AQR criteria shows that on-time arrival percentage was better (80.0% in 2011 compared to 79.8% in 2010), mishandled baggage rates improved to 3.35 per 1,000 passengers in 2011 from 3.49 per 1,000 passengers in 2010, involuntary denied boardings per passenger served decreased to 0.78 per 10,000 passengers in 2011 from 1.08 per 10,000 passengers in 2010, and consumer complaint rates decreased to 1.19 per 100,000 passengers in 2011 from 1.22 per 100,000 passengers in Of the 9,425 complaints registered with DOT regarding all U.S. domestic carriers, 49.2% were for either flight problems or baggage handling problems. Taking all 15 rated airlines together, the AQR score for the industry improved from a level of in 2010 to in With a mixed bag of gains and losses across the 15 carriers rated, the gain in AQR score for the industry is a positive sign. The improvement trend in AQR scores since 2007 speaks well of the industry maintaining in difficult times. AirTran Airways (FL) On-time performance improved in 2011 (82.8% in 2010 compared to 84.4% in 2011). AirTran s denied boardings performance (0.57 per 10,000 passengers in 2011 compared to 0.39 in 2010) was worse. A decrease in customer complaint rate to 0.72 complaints per 100,000 passengers in 2011 was better than their 2010 rate of The mishandled baggage rate of 1.63 per 1,000 passengers in 2011 was the same as For the third year in a row, this was the lowest mishandled baggage rate of all airlines rated. Alaska Airlines (AS) had performance improvement in three of four areas tracked. Better on-time arrival performance (88.2% in 2011 compared to 87.6% in 2010), fewer mishandled bags per 1,000 passengers (2.87 in 2011 compared to 3.13 in 2010), and fewer involuntary denied boardings (0.82 in 2011 compared to 1.18 per 10,000 passengers in 2010). Even with a slightly higher rate of customer complaints (0.48 per 100,000 passengers in 2011 compared to 0.44 in 2010), Alaska Airlines overall AQR score improved for With three of four areas showing gains, the AQR score of for Alaska Airlines for 2010 was improved to for 2011.
9 American Airlines (AA) AQR score for 2011 improved slightly. The slight improvement in AQR score (-1.24 in 2011 compared to for 2010) reflects a combination of poorer performance for on-time arrivals (79.8% in 2010 compared to 77.8% in 2011), denied boardings (0.86 in 2010 compared to 0.92 in 2011), and customer complaints per 100,000 passengers (1.44 in 2010 compared to 1.46 in 2011). Improved mishandled baggage performance (3.55 in 2011 compared to 3.82 in 2010) was the only area of gain for The combination of performance outcome gains and losses produced a slight improvement in the AQR score for American Eagle (MQ) had a denied boarding rate of 2.24 for 2011, much improved from 4.02 per 10,000 passengers in The airline had an increase in the rate of customer complaints (1.03 in 2010 up to 1.45 per 100,000 passengers in 2011). On-time performance was 76.3% in 2011 compared to 77.1% for Their mishandled baggage rate (7.32 per 1,000 passengers in 2011, higher than in 2010 at 7.15) was again well above the industry rate of This combination of performance on the criteria produced an improved AQR score for 2011 (-2.82 in 2010 and for 2011). Even with an improved AQR score, American Eagle has the worst AQR score of all airlines rated for Atlantic Southeast Airlines (EV) On-time performance was 75.2% in 2011, a decline over their 79.2% performance for Atlantic Southeast s denied boarding performance also decline for 2011 (0.91 per 10,000 passengers in 2011 compared to 0.56 in 2010). Their mishandled baggage rate of 5.52 per 1,000 passengers in 2011 was improved over their 6.71 rate in Atlantic Southeast s 2011 customer complaint rate of 0.88 complaints per 100,000 passengers was worse than their 2010 rate of For 2011, Atlantic Southeast showed improvement in their AQR score (-1.60 in 2011 compared to in 2010). Continental Airlines (CO) posted gains in performance for one of the four AQR criteria. Their customer complaint rate was worse (1.81 in 2011 versus 1.48 in 2010), their mishandled baggage per 1,000 passengers increased (3.35 in 2011 compared to 2.65 in 2010), and on-time performance declined (77.1% in 2011 compared to 81.4% in 2010). A denied boardings rate decrease (1.49 in 2011 compared to 1.82 in 2010) was the only criteria posting a positive gain. This combination of performance pushed Continental s AQR score lower to in 2011 (from in 2010). Delta Air Lines (DL) On-time percentage for 2011 shows an improvement over 2010 (82.3% in 2011 and 77.4% in 2010). Their rate of mishandled baggage (2.66 in 2011 improved from 3.49 in 2010) was below the industry average of 3.35 mishandled bags per 1,000 passengers. A decrease in denied boardings (2011 rate of 0.31 per 10,000 passengers compared to 0.41 for 2010) and a reduced rate of customer complaints (1.23 in 2011 compared to 2.00 in 2010) combined to move Delta s AQR score to in 2011 from in With gains in all four criteria, Delta s overall AQR score improved by the second biggest margin of the airlines rated.
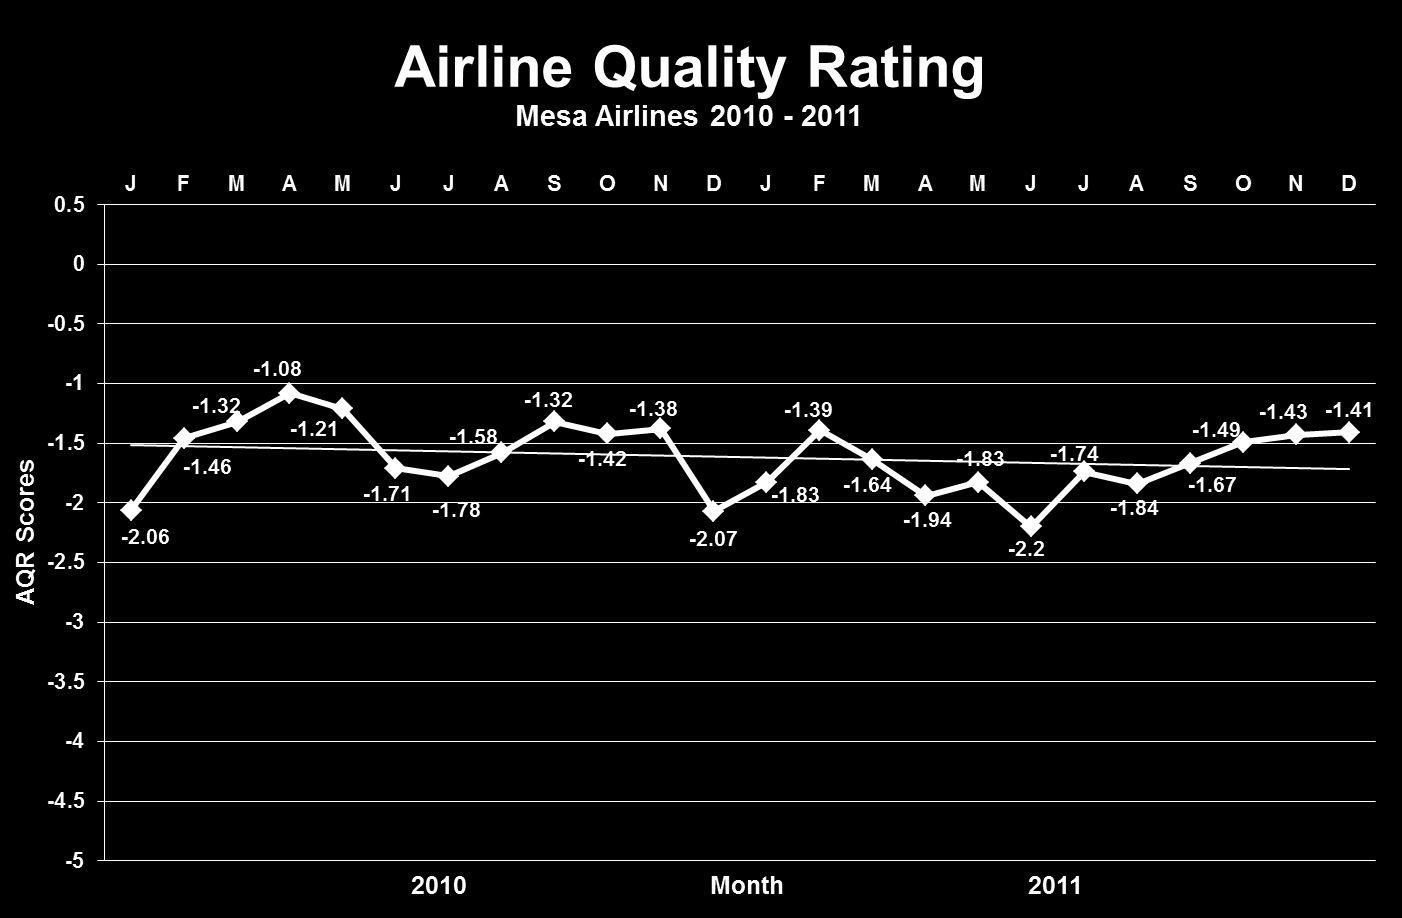
10 Frontier Airlines (F9) On-time performance in 2011 (79.2%) was the only criteria posting a decline over 2010 (81.4%). Frontier s denied boarding performance (0.97 per 10,000 passengers in 2011 compared to 2.26 in 2010) was much better than last year. A customer complaint rate of 0.76 complaints per 100,000 passengers for 2011 was also improved over their 2010 rate of Their mishandled baggage rate of 2.21 per 1,000 passengers was improved over the 2010 rate of Frontier s 2011 AQR score of compared to for 2010 was the largest gain in AQR score of all the airlines rated. Hawaiian Airlines (HA) On-time performance (92.5% in 2010 and 92.8% for 2011) is the best of all airlines rated for 2011 and Hawaiian s denied boarding performance (0.11 per 10,000 passengers in 2011 and 0.04 in 2010) is again the second best of the airlines rated and compares very favorably to the industry average of A customer complaint rate of 0.70 complaints per 100,000 passengers is well below last year s rate of Their mishandled baggage rate of 2.63 per 1,000 passengers is worse than their 2010 rate of Hawaiian had the second best AQR score for 2011 at JetBlue Airways (B6) On-time performance in 2011 dropped to 73.3% from 75.7% in Jet Blue s denied boarding performance (0.01 per 10,000 passengers in 2011 and 2010) is the lowest of the airlines rated. A customer complaint rate of 1.08 complaints per 100,000 passengers was lower in 2011 (1.25 in 2010) and it was below the industry average of 1.19 for Their mishandled baggage rate of 2.21 per 1,000 passengers in 2011 was tied for second best among airlines rated and it was less than their 2010 rate of JetBlue had the third best AQR score (-0.60) of the airlines rated for Mesa Airlines (YV) On-time performance of 83.7% in 2011 is slightly better than their rate of 83.3% in Mesa s denied boarding performance in 2011 (2.27 per 10,000 passengers) was better than their rate of 2.55 in A customer complaint rate of 0.62 complaints per 100,000 passengers shows an increase over the 2010 rate of Their mishandled baggage rate of 4.84 per 1,000 passengers is above the industry rate of 3.35 and is higher than their 2010 rate of Overall, Mesa s AQR score was for 2011, a decline from the score for SkyWest Airlines (OO) On-time performance of 79.3% in 2011, was improved slightly from 79.1% for SkyWest s denied boarding performance (0.68 per 10,000 passengers in 2011 compared to 0.70 in 2010)) was improved and better than the industry average for A customer complaint rate of 0.73 complaints per 100,000 passengers in 2011 compared to the 2010 rate of 0.61 had a negative impact on their 2011 AQR score. Their mishandled baggage rate of 4.13 per 1,000 passengers in 2011 is improved from the 2010 rate of 4.72 bags per 1,000 passengers. SkyWest s AQR score improved in 2011 to from in 2010.
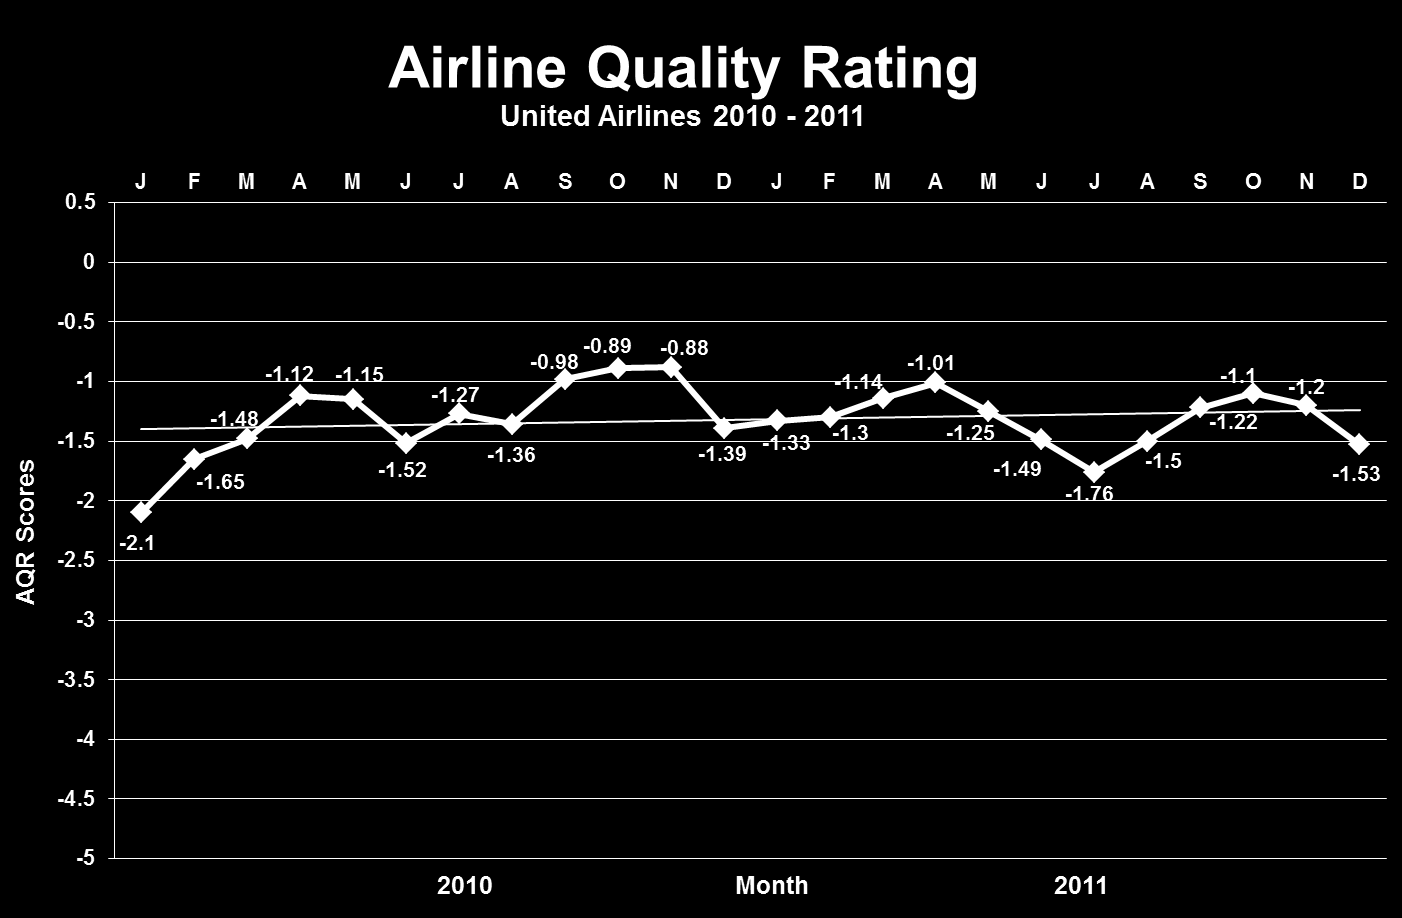
11 Southwest Airlines (WN) On-time arrival percentages of 81.3% in 2011 was improved from 79.5% in A customer complaint rate of 0.32 per 100,000 passengers in 2011 and 0.27 in 2010 are the industry s best. Southwest Airlines is consistently the airline with the lowest customer complaint rate in the industry. An involuntary denied boarding rate of 0.65 per 10,000 passengers in 2011, dropped from 1.24 per 10,000 passengers in Their mishandled baggage rate of 3.65 per 1,000 passengers in 2011 is higher than their rate of 3.43 per 1,000 passengers for Overall, Southwest shows an improved AQR score of for 2011 over their score of in United Airlines (UA) on-time arrival performance declined (from 85.2% in 2010 to 80.2% in 2011) during Their mishandled baggage rate increased (3.66 per 1,000 passengers in 2011 from 3.40 in 2010) for Performance regarding denied boarding rate (1.01 per 10,000 passengers in 2011 compared to 1.27 in 2010) improved. A higher customer complaint rate (2.21 in 2011 compared to 1.64 per 100,000 passengers in 2010) combined with other declines in performance to move United s 2011 AQR score to from in US Airways (US) showed improvement in three of the four performance areas tracked for A closer look reveals that US Airways performed worse in on-time performance (79.8% in 2011 compared to 83.0% in 2010), mishandled baggage (2.70 per 1,000 passengers in 2011 compared to 2.56 in 2010), and in customer complaint rate (1.91 per 100,000 passengers in 2011 compared to 1.53 in 2010). A denied boarding rate of 0.94 per 10,000 passengers in 2011 compared to 1.61 in 2010 was the only area of performance gain for US Airways. Their overall 2011 AQR score (-1.13) reflects slight improvement (-1.17 in 2010) for the year.
12 Previous Airline Quality Reports Bowen, Brent D., Dean E. Headley and Jacqueline R. Luedtke (1991), Airline Quality Rating, National Institute for Aviation Research Report 91-11, Wichita, Kansas. Bowen, Brent D., and Dean E. Headley (1992,1993,1994,1995), Airline Quality Rating Report, National Institute for Aviation Research Report Series, Wichita, Kansas. Bowen, Brent D., and Dean E. Headley (1996, 1997, 1998, 1999, 2000, 2001, 2002, 2003, 2004, 2005, 2006, 2007, 2008, 2009, 2010, 2011), Airline Quality Rating Report, W. Frank Barton School of Business, Wichita, Kansas. For more information contact either: Dr. Dean E. Headley, Associate Professor Dr. Brent D. Bowen, Professor Department of Marketing Department of Aviation Technology W. Frank Barton School of Business College of Technology Wichita State University Purdue University 304 Clinton Hall 1401 Aviation Dr. Wichita, KS West Lafayette, IN Office: (316) Office: (765)
13 Detail of Airline Performance Since the Airline Quality Rating is comparable across airlines and across time, monthly rating results can be examined both individually and collectively. The following pages outline the AQR scores for the industry and for each airline rated by month for For comparison purposes, results are also displayed for 2010 where available. A composite industry chart that combines the airlines tracked is shown at first, with individual airline performance charts following in alphabetical order.
14 Airline Quality Rating Scores 2011 AQR 2010 AQR 2009 AQR 2008 AQR 2007 AQR 2006 AQR 2005 AQR Score Rank Score Rank Score Rank Score Rank Score Rank Score Rank Score Rank Air Tran Alaska American American Eagle Atlantic Southeast Continental Delta Frontier N/A - Hawaiian N/A - N/A - N/A - JetBlue Mesa N/A - SkyWest Southwest United US Airways Industry NOTES: Scores and rankings for 2011 reflect the deletion of Comair from the airlines tracked. As of January 2010, data of the merged operations of Delta Air Lines and Northwest Airlines are combined and appear only as Delta Air Lines. Scores and rankings for 2008 reflect the addition of Hawaiian to the airlines tracked. Scores and rankings for 2006 reflect the addition of Frontier and Mesa to the airlines tracked. As of January 2006, data of the merged operations of US Airways and America West Airlines are combined and appear only as US Airways..
15
16

17
18

19
20
21
22

23
24
25
26
27
28
29
30
31
32
33
34
35
36
37
38
39
40
41
42
43
44
45
46
47 Detail of Frequently Cited Airline Performance Criteria Consumer interest remains high regarding such issues as on-time performance, mishandled baggage, involuntary denied boardings (bumping), and treatment of customers. Since these criteria are central to the AQR calculations, it is important to provide more complete data for individual airlines in these areas. The following data tables provide a detailed look at the performance of each of the 15 U.S. airlines required to report performance in the specific areas of on-time arrivals, mishandled baggage, involuntary denied boardings, and consumer complaints to the Department of Transportation in The requirement is based on the criteria that an airline handled at least 1% or more of the total domestic scheduled-service passenger revenues for Data were drawn from the U.S. Department of Transportation monthly Air Travel Consumer Report. The final pages of this report outline the Airline Quality Rating criteria definitions for reference and clarity in more fully understanding the nature of the data reported.
48 2011 On-Time Arrival Percentage by Month for U.S. Airlines Jan Feb Mar Apr May Jun Jul Aug Sep Oct Nov Dec Annual AirTran (FL) Alaska (AS) American (AA) American Eagle (MQ) Atlantic Southeast (EV) Continental (CO) Delta (DL) Frontier (F9) Hawaiian (HA) JetBlue (B6) Mesa (YV) SkyWest (OO) Southwest (WN) United (UA) US Airways (US) Industry by Month Express Jet (XE) This airline voluntarily reports performance data. Only the 15 airlines required to report all data elements for 2011 are part of the Industry value. Performance statistics for this airline are presented for reference and comparison. Source: Air Travel Consumer Report, U.S. Department of Transportation, Office of Aviation Enforcement and Proceedings.
49 2010 On-Time Arrival Percentage by Month for U.S. Airlines Jan Feb Mar Apr May Jun Jul Aug Sep Oct Nov Dec Annual AirTran (FL) Alaska (AS) American (AA) American Eagle (MQ) Atlantic Southeast (EV) Comair (OH) Continental (CO) Delta (DL) Frontier (F9) Hawaiian (HA) JetBlue (B6) Mesa (YV) SkyWest (OO) Southwest (WN) United (UA) US Airways (US) Industry by Month Express Jet (XE) Pinnacle (9E) This airline is not included in the Industry value. Only 16 airlines that are required to report all data elements for 2010 are part of the Industry value. Performance statistics are presented here for reference and comparison. Source: Air Travel Consumer Report, U.S. Department of Transportation, Office of Aviation Enforcement and Proceedings.
50 2011 Involuntary Denied Boardings by Quarter for U.S. Airlines (per 10,000 passengers) 1st 2nd 3rd 4th Quarter Quarter Quarter Quarter Annual AirTran (FL) Alaska (AS) American (AA) American Eagle (MQ) Atlantic Southeast (EV) Continental (CO) Delta (DL) Frontier (F9) Hawaiian (HA) JetBlue (B6) Mesa (YV) SkyWest (OO) Southwest (WN) United (UA) US Airways (US) Industry by Quarter Express Jet (RU) This airline voluntarily reports performance data. Only the 15 airlines required to report all data elements for 2011 are part of the Industry value. Performance statistics are presented for reference and comparison. Source: Air Travel Consumer Report, U.S. Department of Transportation, Office of Aviation Enforcement and Proceedings
51 2010 Involuntary Denied Boardings by Quarter for U.S. Airlines (per 10,000 passengers) 1st 2nd 3rd 4th Quarter Quarter Quarter Quarter Annual AirTran (FL) Alaska (AS) American (AA) American Eagle (MQ) Atlantic Southeast (EV) Comair (OH) Continental (CO) Delta (DL) Frontier (F9) Hawaiian (HA) JetBlue (B6) Mesa (YV) SkyWest (OO) Southwest (WN) United (UA) US Airways (US) Industry by Quarter Express Jet (XE) Pinnacle (9E) This airline is not included in the Industry value. Only the 16 airlines that are required to report all data elements for 2010 are part of the Industry value. Performance statistics are presented here for reference and comparison. Source: Air Travel Consumer Report, U.S. Department of Transportation, Office of Aviation Enforcement and Proceedings.
52 2011 Mishandled Baggage by Month for U.S. Airlines (per 1,000 passengers) Jan Feb Mar Apr May Jun Jul Aug Sep Oct Nov Dec Annual AirTran (FL) Alaska (AS) American (AA) American Eagle (MQ) Atlantic Southeast (EV) Continental (CO) Delta (DL) Frontier (F9) Hawaiian (HA) JetBlue (B6) Mesa (YV) SkyWest (OO) Southwest (WN) United (UA) US Airways (US) Industry by Month Express Jet (XE) This airline voluntarily reports performance data. Only the 15 airlines required to report all data elements for 2011 are part of the Industry value. Performance statistics are presented here for reference and comparison. Source: Air Travel Consumer Report, U.S. Department of Transportation, Office of Aviation Enforcement and Proceedings.
53 2010 Mishandled Baggage by Month for U.S. Airlines (per 1,000 passengers) Jan Feb Mar Apr May Jun Jul Aug Sep Oct Nov Dec Annual AirTran (FL) Alaska (AS) American (AA) American Eagle (MQ) Atlantic Southeast (EV) Comair (OH) Continental (CO) Delta (DL) Frontier (F9) Hawaiian (HA) JetBlue (B6) Mesa (YV) SkyWest (OO) Southwest (WN) United (UA) US Airways (US) Industry by Month Express Jet (XE) Pinnacle (9E) This airline is not included in the Industry value. Only 16 airlines that are required to report all data elements for 2010 are part of the Industry value. Performance statistics are presented here for reference and comparison. Source: Air Travel Consumer Report, U.S. Department of Transportation, Office of Aviation Enforcement and Proceedings.
54 2011 Total Complaints to Department of Transportation by Month for U.S. Airlines (per 100,000 passengers) Jan Feb Mar Apr May Jun Jul Aug Sep Oct Nov Dec Annual AirTran (FL) Alaska (AS) American (AA) American Eagle (MQ) Atlantic Southeast (EV) Continental (CO) Delta (DL) Frontier (F9) Hawaiian (HA) JetBlue (B6) Mesa (YV) SkyWest (OO) Southwest (WN) United (UA) US Airways (US) Industry by Month Express Jet (XE) This airline voluntarily reports performance data. Only the 15 airlines required to report all data elements for 2011 are part of the Industry value. Performance statistics are presented here for reference and comparison. Source: Air Travel Consumer Report, U.S. Department of Transportation, Office of Aviation Enforcement and Proceedings.
55 2010 Total Complaints to Department of Transportation by Month for U.S. Airlines (per 100,000 passengers) Jan Feb Mar Apr May Jun Jul Aug Sep Oct Nov Dec Annual AirTran (FL) Alaska (AS) American (AA) American Eagle (MQ) Atlantic Southeast (EV) Comair (OH) Continental (CO) Delta (DL) Frontier (F9) Hawaiian (HA) JetBlue (B6) Mesa (YV) SkyWest (OO) Southwest (WN) United (UA) US Airways (US) Industry by Month Express Jet (XE) Pinnacle (9E) This airline is not included in the Industry value. Only 16 airlines that are required to report all data elements for 2010 are part of the Industry value. Performance statistics are presented here for reference and comparison. Source: Air Travel Consumer Report, U.S. Department of Transportation, Office of Aviation Enforcement and Proceedings.
56 Monthly Count of Complaints Received by Department of Transportation Regarding 15 AQR Rated Airlines in 2010 and 2011 Top Four Categories 1 Complaints for 15 of Complaints for 15 AQR AQR Rated Airlines Rated Airlines in Jan FP BG TB CS Feb FP BG TB CS Mar FP BG TB CS Apr FP BG TB CS May FP BG CS TB Jun 1, FP BG TB CS Jul 928 1,071 FP BG TB CS Aug 1,019 1,171 FP BG TB CS Sep FP BG TB RF Oct FP BG TB CS Nov FP BG FA CS Dec FP BG TB CS 1 FP = Flight Problems; CS = Customer Service; BG = Baggage; TB = Reservations, Ticketing, and Boarding; RF = Refunds; FA=Fairs. Details of categories are at the back of this report. Source: Air Travel Consumer Report, U.S. Department of Transportation, Office of Aviation Enforcement and Proceedings.
57 Overview of Complaints Received by Department of Transportation for All U.S. Domestic Airlines for 2010 and 2011 by Complaint Category % of all Complaints Received Number of Complaints Received Flight Problems 32.8% 34.9% 3,000 3,290 Baggage 15.9% 14.3% 1,456 1,350 Customer Service 12.9% 12.1% 1,180 1,138 Reservations, Ticketing, and Boarding 13.1% 11.2% 1,194 1,058 Refunds 5.6% 7.2% Disability 5.5% 6.0% Fares 3.9% 5.0% Oversales 5.2% 4.6% Other 3.1% 2.9% Discrimination 1.3% 1.1% Advertising 0.7% 0.6% Animals 0.0% 0.1% 4 8 Total 100% 100% 9,135 9,425 Source: Air Travel Consumer Report, U.S. Department of Transportation, Office of Aviation Enforcement and Proceedings.
58 Airline Quality Rating Criteria Overview The individual criteria used to calculate the AQR scores are summed up in four basic areas that reflect customer-oriented areas of airline performance. Definitions of the four areas used in this AQR 2009 (2008 data) are outlined below. OT ON-TIME PERFORMANCE (+8.63) Regularly published data regarding on-time arrival performance is obtained from the U.S. Department of Transportation's Air Travel Consumer Report. According to the DOT, a flight is counted "on time" if it is operated within 15 minutes of the scheduled time shown in the carriers' Computerized Reservations Systems. Delays caused by mechanical problems are counted as of January 1, Canceled and diverted operations are counted as late. The AQR calculations use the percentage of flights arriving on time for each airline for each month. DB INVOLUNTARY DENIED BOARDINGS (-8.03) This criterion includes involuntary denied boardings. Data regarding denied boardings can be obtained from the U.S. Department of Transportation's Air Travel Consumer Report. Data includes the number of passengers who hold confirmed reservations and are involuntarily denied boarding on a flight that is oversold. These figures include only passengers whose oversold flight departs without them onboard. The AQR uses the ratio of involuntary denied boardings per 10,000 passengers boarded by month. MB MISHANDLED BAGGAGE REPORTS (-7.92) Regularly published data regarding consumer reports to the carriers of mishandled baggage can be obtained from the U.S. Department of Transportation's Air Travel Consumer Report. According to the DOT, a mishandled bag includes claims for lost, damaged, delayed, or pilfered baggage. Data is reported by carriers as to the rate of mishandled baggage reports per 1,000 passengers and for the industry. The AQR ratio is based on the total number of reports each carrier received from passengers concerning lost, damaged, delayed, or pilfered baggage per 1,000 passengers served. CC CONSUMER COMPLAINTS (-7.17) The criteria of consumer complaints is made up of 12 specific complaint categories (outlined below) monitored by the U. S. Department of Transportation and reported monthly in the Air Travel Consumer Report. Consumers can file complaints with the DOT in writing, by telephone, via , or in person. The AQR uses complaints about the various categories as part of the larger customer complaint criteria and calculates the consumer complaint ratio on the number of complaints received per 100,000 passengers flown for each airline.
59 CONSUMER COMPLAINT CATEGORIES Flight Problems Data is available by the total number of consumer complaints pertaining to cancellations, delays, or any other deviations from schedule, whether planned or unplanned for each airline each month. Oversales This complaint category includes all bumping problems, whether or not the airline complied with DOT oversale regulations. Data is available by the total number of consumer complaints pertaining to oversales for each airline each month. Reservations, Ticketing, and Boarding This category includes airline or travel agent mistakes in reservations and ticketing, problems in making reservations and obtaining tickets due to busy telephone lines, or waiting in line or delays in mailing tickets, and problems boarding the aircraft (except oversales). Data is available by the total number of consumer complaints pertaining to ticketing and boarding for each airline each month. Fares As defined by the DOT, consumer complaints regarding fares include incorrect or incomplete information about fares, discount fare conditions and availability, overcharges, fare increases, and level of fares in general. Data is available for the total number of consumer complaints pertaining to fares for each airline each month. Refunds This category includes customer complaints about problems in obtaining refunds for unused or lost tickets, fare adjustments, or bankruptcies. Data is available by the total number of consumer complaints pertaining to refunds for each airline each month. Baggage Claims for lost, damaged, or delayed baggage, charges for excess baggage, carry-on problems, and difficulties with airline claim procedure are included in this category. Data is available by the total number of consumer complaints pertaining to baggage for each airline each month. Customer Service This category includes complaints about rude or unhelpful employees, inadequate meals or cabin service, and treatment of delayed passengers. Data is available by the total number of consumer complaints pertaining to customer service for each airline each month.
60 Disability This category includes complaints about civil rights complaints by air travelers with disabilities. Data is available by the total number of consumer complaints pertaining to disabilities for each airline each month. Advertising These are complaints concerning advertising that is unfair, misleading or offensive to consumers. Data is available by the total number of consumer complaints regarding advertising for each airline each month. Discrimination Civil rights complaints by air travelers (other than disabilities); for example: complaints based on race, national origin, religion, etc. (this category was first reported in May, 2002). Animals This category tracks customer complaints about loss, injury, or death of an animal during air transport by an air carrier. Data is available by the total number of customer complaints regarding animals for each airline each month. Other Data regarding consumer complaints about frequent flyer programs, smoking, tours credit, cargo problems, security, airport facilities, claims for bodily injury, and other problems not classified above are included in this category. Data is available by the total number of consumer complaints regarding other problems for each airline each month.
The Unfriendly Skies. Five Years of Airline Passenger Complaints to the Department of Transportation
 The Unfriendly Skies Five Years of Airline Passenger Complaints to the Department of Transportation The Unfriendly Skies Five Years of Airline Passenger Complaints to the Department of Transportation Laura
Are low-cost carrier passengers less likely to complain about service quality?
 Are low-cost carrier passengers less likely to complain about service quality? Michael D. Wittman a, a Massachusetts Institute of Technology, International Center for Air Transportation 77 Massachusetts
Airport Performance Measurement
 Airport Performance Measurement Agenda Airport Characteristics Airport Key Performance Indicators The Airport System Approach Departure Runway Taxiway Apron Gate Pier Arrival concourse Passenger & baggage
3rd Annual MIT Airline Industry Conference
 \\NYDFS1\ROOT\LIB\IBD\GCM\PRODUCT TEAMS\GLOBAL STRUCTURED CORPORATES\Equipment Finance Group\Conferences\Other Conferences\MIT\2004-04-19 cap markets overview.ppt\a2xp\19 APR 2004\10:09 AM\1 3rd Annual
Customer Service Plan. (Issued in Compliance with 14 CFR Part 259)
") Customer Service Plan (Issued in Compliance with 14 CFR Part 259) Fiji Airways, in compliance with 14 CFR Part 259, has adopted this customer service plan to monitor the effects of irregular flight operations
Customer Service Plan (Issued in Compliance with 14 CFR Part 259) Fiji Airways, in compliance with 14 CFR Part 259, has adopted this customer service plan to monitor the effects of irregular flight operations
AIRLINE ECONOMIC ANALYSIS
 AIRLINE ECONOMIC ANALYSIS FOR THE RAYMOND JAMES GLOBAL AIRLINE CONFERENCE NOVEMBER 2013 AUTHORS Bob Hazel Peter Otradovec Tom Stalnaker Aaron Taylor TABLE OF CONTENTS SUMMARY 5 US CARRIERS INCLUDED AND
AT&T Global Network Client for Windows Product Support Matrix January 29, 2015
 AT&T Global Network Client for Windows Product Support Matrix January 29, 2015 Product Support Matrix Following is the Product Support Matrix for the AT&T Global Network Client. See the AT&T Global Network
AFRAA AIRLINE PASSENGER SERVICE COMMITMENT
 AFRAA AIRLINE PASSENGER SERVICE COMMITMENT PREAMBLE African Airlines members of African Airlines Association (AFRAA) have developed the Airline Passenger Service Commitment following consultation with
AEROMEXICO: MEXICO S PREMIUM REVENUE CARRIER
 July, 2014 1 1 AEROMEXICO: MEXICO S PREMIUM REVENUE CARRIER Leading airline in Mexico Only Full Service Carrier / Two-class Service and Hub and Spoke Model Strongest position in slot constrained Mexico
SOUTHWEST AIRLINES CO. ANNUAL REPORT PROJECT MICHAEL HSUN BUS 210-00A. http://southwest.investorroom.com/download/2012+annual+report.
 SOUTHWEST AIRLINES CO. ANNUAL REPORT PROJECT MICHAEL HSUN BUS 210-00A http://southwest.investorroom.com/download/2012+annual+report.pdf Introduction CEO: Gary C. Kelly Headquarters: Dallas, TX Ending date
This SAS Plan is adopted for all scheduled flights operated by SAS to and from the US.
 SAS Customer Service Plan - 02-02 2012 Scandinavian Airlines System (SAS) s Customer Service Plan describes SAS s customer service commitments consistent with US Department of Transportation regulations.
Airline Rules for Domestic Non-Refundable Tickets Revised 4/27/09 CL (removed baggage rules)
") Airline Rules for Domestic Non-Refundable Tickets Revised 4/27/09 CL (removed baggage rules) Rules are subject to change at any time without prior airline notification. Use this as a guide only It is always
Airline Rules for Domestic Non-Refundable Tickets Revised 4/27/09 CL (removed baggage rules) Rules are subject to change at any time without prior airline notification. Use this as a guide only It is always
COMPARISON OF FIXED & VARIABLE RATES (25 YEARS) CHARTERED BANK ADMINISTERED INTEREST RATES - PRIME BUSINESS*
 CHARTERED BANK ADMINISTERED INTEREST RATES - PRIME BUSINESS*") COMPARISON OF FIXED & VARIABLE RATES (25 YEARS) 2 Fixed Rates Variable Rates FIXED RATES OF THE PAST 25 YEARS AVERAGE RESIDENTIAL MORTGAGE LENDING RATE - 5 YEAR* (Per cent) Year Jan Feb Mar Apr May Jun
COMPARISON OF FIXED & VARIABLE RATES (25 YEARS) 2 Fixed Rates Variable Rates FIXED RATES OF THE PAST 25 YEARS AVERAGE RESIDENTIAL MORTGAGE LENDING RATE - 5 YEAR* (Per cent) Year Jan Feb Mar Apr May Jun
P/T 2B: 2 nd Half of Term (8 weeks) Start: 25-AUG-2014 End: 19-OCT-2014 Start: 20-OCT-2014 End: 14-DEC-2014
 Start: 25-AUG-2014 End: 19-OCT-2014 Start: 20-OCT-2014 End: 14-DEC-2014") 2014-2015 SPECIAL TERM ACADEMIC CALENDAR FOR SCRANTON EDUCATION ONLINE (SEOL), MBA ONLINE, HUMAN RESOURCES ONLINE, NURSE ANESTHESIA and ERP PROGRAMS SPECIAL FALL 2014 TERM Key: P/T = Part of Term P/T Description
2014-2015 SPECIAL TERM ACADEMIC CALENDAR FOR SCRANTON EDUCATION ONLINE (SEOL), MBA ONLINE, HUMAN RESOURCES ONLINE, NURSE ANESTHESIA and ERP PROGRAMS SPECIAL FALL 2014 TERM Key: P/T = Part of Term P/T Description
P/T 2B: 2 nd Half of Term (8 weeks) Start: 26-AUG-2013 End: 20-OCT-2013 Start: 21-OCT-2013 End: 15-DEC-2013
 Start: 26-AUG-2013 End: 20-OCT-2013 Start: 21-OCT-2013 End: 15-DEC-2013") 2013-2014 SPECIAL TERM ACADEMIC CALENDAR FOR SCRANTON EDUCATION ONLINE (SEOL), MBA ONLINE, HUMAN RESOURCES ONLINE, NURSE ANESTHESIA and ERP PROGRAMS SPECIAL FALL 2013 TERM Key: P/T = Part of Term P/T Description
2013-2014 SPECIAL TERM ACADEMIC CALENDAR FOR SCRANTON EDUCATION ONLINE (SEOL), MBA ONLINE, HUMAN RESOURCES ONLINE, NURSE ANESTHESIA and ERP PROGRAMS SPECIAL FALL 2013 TERM Key: P/T = Part of Term P/T Description
P/T 2B: 2 nd Half of Term (8 weeks) Start: 24-AUG-2015 End: 18-OCT-2015 Start: 19-OCT-2015 End: 13-DEC-2015
 Start: 24-AUG-2015 End: 18-OCT-2015 Start: 19-OCT-2015 End: 13-DEC-2015") 2015-2016 SPECIAL TERM ACADEMIC CALENDAR For Scranton Education Online (SEOL), Masters of Business Administration Online, Masters of Accountancy Online, Health Administration Online, Health Informatics
2015-2016 SPECIAL TERM ACADEMIC CALENDAR For Scranton Education Online (SEOL), Masters of Business Administration Online, Masters of Accountancy Online, Health Administration Online, Health Informatics
AIRLINE PASSENGER SERVICE COMMITMENT 28 March 2001
 AIRLINE PASSENGER SERVICE COMMITMENT 28 March 2001 PREAMBLE Airlines in Europe have developed the Airline Passenger Service Commitment following consultation with representatives of Air Travellers, European
Customer Service Plan
 TAP Portugal s aims to address the key service elements of the new rules put forth by the U.S. Department of Transportation (DOT) that most affect our customers. This Plan applies with respect to TAP Portugal
Analysis One Code Desc. Transaction Amount. Fiscal Period
 Analysis One Code Desc Transaction Amount Fiscal Period 57.63 Oct-12 12.13 Oct-12-38.90 Oct-12-773.00 Oct-12-800.00 Oct-12-187.00 Oct-12-82.00 Oct-12-82.00 Oct-12-110.00 Oct-12-1115.25 Oct-12-71.00 Oct-12-41.00
Case 2:08-cv-02463-ABC-E Document 1-4 Filed 04/15/2008 Page 1 of 138. Exhibit 8
 Case 2:08-cv-02463-ABC-E Document 1-4 Filed 04/15/2008 Page 1 of 138 Exhibit 8 Case 2:08-cv-02463-ABC-E Document 1-4 Filed 04/15/2008 Page 2 of 138 Domain Name: CELLULARVERISON.COM Updated Date: 12-dec-2007
Saudi Arabian Airlines Customer Service Plan
 Saudi Arabian Airlines Customer Service Plan This Plan is adopted for all scheduled and public charter flights operated by Saudi Arabian Airlines. Our goal is to make every flight a safe and pleasant experience
Walt Disney World Walt Disney World Walt Disney World Walt Disney World Walt Disney World Walt Disney World Walt Disney World
 Disney s Magical Express is a complimentary service that includes round-trip motor coach transportation and baggage handling between Orlando International Airport and Walt Disney World Resort for guests
Within online customer support, you will find customer support contact information, a link to e-mail our corporate travel agents and online help.
 Tufts Traveler & Arranger Manual Spring 2006 GETTING HELP Corporate Travel Agents You may contact your custom agent or a corporate travel agent for help with the site, booking assistance or general support
Customer Service Plan
 Customer Service Plan Concesionaria Vuela Compañía de Aviación, S.A.P.I. de C.V., d/b/a Volaris, seeks to reach our Customers satisfaction and offer them a unique flight experience. This is the reason
Enhanced Vessel Traffic Management System Booking Slots Available and Vessels Booked per Day From 12-JAN-2016 To 30-JUN-2017
 From -JAN- To -JUN- -JAN- VIRP Page Period Period Period -JAN- 8 -JAN- 8 9 -JAN- 8 8 -JAN- -JAN- -JAN- 8-JAN- 9-JAN- -JAN- -JAN- -JAN- -JAN- -JAN- -JAN- -JAN- -JAN- 8-JAN- 9-JAN- -JAN- -JAN- -FEB- : days
Flying with a ventilator in the USA
 Flying with a ventilator in the USA International Pompe Association (IPA) www.worldpompe.org August 2005 Content Preparation 1 Getting approval for in-flight use of ventilation 1 Extra time before boarding
AirportInfo. Airline Mergers & Acquisitions
 AirportInfo Airline Mergers & Acquisitions July Airline Mergers & Acquisitions (M&A) In the last few years, the United States has held the lead in airline mergers and acquisitions (M&A). Airlines engage
Accident & Emergency Department Clinical Quality Indicators
 Overview This dashboard presents our performance in the new A&E clinical quality indicators. These 8 indicators will allow you to see the quality of care being delivered by our A&E department, and reflect
FREQUENTLY ASKED QUESTIONS REGARDING CITY NATIONAL REWARDS, POWERED BY THE SCORECARD PROGRAM EFFECTIVE MAY 7, 2012
 FREQUENTLY ASKED QUESTIONS REGARDING CITY NATIONAL REWARDS, POWERED BY THE SCORECARD PROGRAM EFFECTIVE MAY 7, 2012 GENERAL PROGRAM QUESTIONS What is City National Rewards? What is ScoreCard? How do I enroll
FLY AMERICA / OPEN SKIES. Research Administrator Conference April 9, 2014 Clayton Hall
 FLY AMERICA / OPEN SKIES Research Administrator Conference April 9, 2014 Clayton Hall Beth Kuhn, Assistant Director, Procurement Services Cindy Panchisin, Sponsored Research Accountant, Research Office
Consumer ID Theft Total Costs
 Billions Consumer and Business Identity Theft Statistics Business identity (ID) theft is a growing crime and is a growing concern for state filing offices. Similar to consumer ID theft, after initially
MIT ICAT. Airline Revenue Management: Flight Leg and Network Optimization. 1.201 Transportation Systems Analysis: Demand & Economics
 M I T I n t e r n a t i o n a l C e n t e r f o r A i r T r a n s p o r t a t i o n Airline Revenue Management: Flight Leg and Network Optimization 1.201 Transportation Systems Analysis: Demand & Economics
Delta Air Lines, Inc. David Pruchno BUS 210-00A-Su13 - M/W 6-9
 Delta Air Lines, Inc. David Pruchno BUS 210-00A-Su13 - M/W 6-9 http://www.delta.com/content/dam/delta-www/pdfs/about-financial/deltaairlines_10k_2012.pdf Introduction Richard H Anderson, CEO Former UnitedHealth
AIRLINE ECONOMIC ANALYSIS
 AIRLINE ECONOMIC ANALYSIS NOVEMBER 2014 AUTHORS Bob Hazel, Tom Stalnaker Aaron Taylor, Khalid Usman CONTENTS INTRODUCTION 4 US CARRIERS INCLUDED AND METHODOLOGY 6 COST 9 1. System CASM Increase 9 2. Domestic
Coffee Year 2014-15 Futures Trading Analysis
 Lower coffee exports lend support to Robusta prices The coffee market rallied slightly in June, led in most part by a recovery in Robusta prices. For the sixth month in a row exports were lower than last
METRO. Fiscal Year 2013 Monthly Board Report. June 2013 (Third Quarter Fiscal Year-to-Date)
") METRO Fiscal Year 2013 Monthly Board Report Revenue Expense Ridership Performance (Third Quarter Fiscal Year-to-Date) 7/16/2013 Table of Contents Section A Section B Section C Section D Section E Section
METRO Fiscal Year 2013 Monthly Board Report Revenue Expense Ridership Performance (Third Quarter Fiscal Year-to-Date) 7/16/2013 Table of Contents Section A Section B Section C Section D Section E Section
Annual Treasury And Investment Portfolio Update for 2015
 Item No.: 7d_Supp Meeting Date: March 8, 2016 Annual Treasury And Investment Portfolio Update for 2015 Commission Briefing Presented by Diane Campbell March 8, 2016 Treasury Management Update Background
Deploying Regional Jets to Add New Spokes to a Hub. Ian Savage* and Burgess Scott Northwestern University
 Deploying Regional Jets to Add New Spokes to a Hub by Ian Savage* and Burgess Scott Northwestern University Correspondence Address Professor Ian Savage Department of Economics Northwestern University 2001
AIR PASSENGER RIGHTS EU COMPLAINT FORM
 AIR PASSENGER RIGHTS EU COMPLAINT FORM THIS FORM CAN BE USED TO LODGE A COMPLAINT WITH AN AIRLINE AND/OR A NATIONAL ENFORCEMENT BODY. Passenger rights in case of denied boarding, downgrading, cancellation
SkyWest External and Internal Assessment Report U.S. Regional Airline Industry
 SkyWest External and Internal Assessment Report U.S. Regional Airline Industry U.S. REGIONAL AIRLINE INDUSTRY - EXTERNAL ANALYSIS 1) PESTEL Analysis: a. Political Factors Sept. 11 terrorist attacks increased
Singapore Airlines Group Analyst/Media Briefing FY2012-13 13 RESULTS 17 MAY 2013 THE PARENT AIRLINE FY2012/13 RESULTS
 Singapore Airlines Group Analyst/Media Briefing FY2012-13 13 RESULTS 17 MAY 2013 THE PARENT AIRLINE FY2012/13 RESULTS THE PARENT AIRLINE COMPANY RESULTS FY2012/13 4Q/12 $million Better/ (Worse) $million
The Role of Regional Airlines in the U.S. Airline Industry. Silke Januszewski Forbes University of California, San Diego 1. and
 The Role of Regional Airlines in the U.S. Airline Industry by Silke Januszewski Forbes University of California, San Diego 1 and Mara Lederman Rotman School of Management, University of Toronto 2 1 Department
State Annual Report Due Dates for Business Entities page 1 of 10
 State Annual Report Due Dates for Business Entities page 1 of 10 If you form a formal business entity with the state, you may be required to file periodic reports on the status of your entity to preserve
Ch 6 Revenue Management
 6-1 Ch 6 Revenue Management 6.1 History 6.2 Levels of Revenue Management 6.3 Revenue Management Strategy 6.4 The System Context 6.5 Booking Control 6.6 Tactical Revenue Management 6.7 Net Contribution
A Report on Federal Student Loans in Arkansas August 2015. Presented by: Tony Williams, ASLA Executive Director
 A Report on Federal Student Loans in Arkansas August 2015 Presented by: Tony Williams, ASLA Executive Director Total Student Loan Debt NATIONAL: $ 1.19 Trillion Source: Federal Reserve Bank of New York
2010 AIRLINE HULL & LIABILITY INSURANCE MARKET REVIEW MARCH 2011
 2010 AIRLINE HULL & LIABILITY INSURANCE MARKET REVIEW MARCH 2011 Algeria - Brazil - Colombia - Dubai - Germany - India - Japan - Korea - Malaysia - Mexico - Romania - Singapore - Sweden - Switzerland -
Easter Seals Central Texas Programs Outcome Profiles Monthly and Year to Date FY 2011 85% 87% 80% 80% 84% 84% 83%
 I. Outcomes Indicators for individuals receiving services: (Service Delivery Effectiveness) 85% 87% 80% 80% 84% 84% 83% A. Access Sep 10 Oct 10 Nov 10 YTD Dec 10 Jan 11 Feb 11 YTD Mar 11 Apr 11 May 11
Performance Measures. First Quarter 2012
 Performance Measures First Quarter 2012 1Q2012 Earn & Retain Community Trust 6 Performance Measures: Ridership Cost Efficiency (Cost per Revenue Hour) Cost Effectiveness (Cost per Passenger) Service Effectiveness
JETS. A Smart Beta ETF from U.S. Global Investors
 JETS A Smart Beta ETF from U.S. Global Investors ABOUT U.S. GLOBAL ETFS Investment adviser to the U.S. Global ETFs, U.S. Global Investors, Inc. is an innovative investment manager with vast experience
AVIATION GRADUATES WORK FOR MAJOR AIRLINE COMPANIES LIKE:
 a a AERONAUTICS Do you love to travel? Perhaps you enjoy the freedom of flying. Do you have a passion for airplanes? Are you talented with the ability to make things work? Do you want a real-world experience?
History of the Slot Exchange Market in the US and Some Implications
 History of the Slot Exchange Market in the US and Some Implications Presented to: Nextor Workshop on Allocation and Exchange of Airport Access Rights 6 June 2007 Frank Berardino 115 West Avenue Jenkintown,
2015-16 BCOE Payroll Calendar. Monday Tuesday Wednesday Thursday Friday Jun 29 30 Jul 1 2 3. Full Force Calc
 July 2015 CM Period 1501075 July 2015 1 2 3 4 5 6 7 8 9 10 11 12 13 14 15 16 17 18 19 20 21 22 23 24 25 26 27 28 29 30 31 August 2015 1 2 3 4 5 6 7 8 9 10 11 12 13 14 15 16 17 18 19 20 21 22 23 24 25 26
Product Development and Quality Control System
 Upgrade in R&D Capacity As a global ODM/OEM company and a technology services provider, Wistron strives to provide its customers with products and services needed for development of enhanced competitiveness.
MEMBERSHIP, ENTERING INTO AN AGREEMENT AND RESPONSIBILITIES OF THE COMPANY
 GENERAL These terms and conditions shall apply to the Finnair Corporate Programme (hereinafter Programme ). Apart from these terms and conditions, no other rules are applicable. The Programme is designed
Baggage must be checked at least 30 minutes prior to departure for domestic flights and 1 hour prior to departure for international flights.
 My Itineraries https://www.delta.com/myitinerary/servlet/myitineraryservlet?cmd=getitindetails Page 1 of 1 My Itineraries Baggage must be checked at least 30 minutes prior to departure for domestic flights
The Power of Revenue Management
 The Power of Revenue Management Presented By Judy Capko Capko & Company www.capko.com The Power of Revenue Management 6/13/07 1 About the Speaker The Power of Revenue Management 6/13/07 2 The Speaker:
Architectural Services Data Summary March 2011
 Firms Typically Small in Size According to the latest U.S. Census Survey of Business Owners, majority of the firms under the description Architectural Services are less than 500 in staff size (99.78%).
Detailed guidance for employers
 April 2015 3 Detailed guidance for employers Appendix A: Pay reference periods This document accompanies: Detailed guidance no. 3 Assessing the workforce Pay reference period calendars where the definition
Cargo Training International
 Cargo Training International Program of Courses for 2015 USA PDF Edition UNITED STATES AND INTERNATIONALLY APPROVED TRAINING PROGRAMS FOR INDUSTRY: CARGO TRAINING INTERNATIONAL LIMITED P O Box 580026,
Ashley Institute of Training Schedule of VET Tuition Fees 2015
 Ashley Institute of Training Schedule of VET Fees Year of Study Group ID:DECE15G1 Total Course Fees $ 12,000 29-Aug- 17-Oct- 50 14-Sep- 0.167 blended various $2,000 CHC02 Best practice 24-Oct- 12-Dec-
Proposal to Reduce Opening Hours at the Revenues & Benefits Coventry Call Centre
 Proposal to Reduce Opening Hours at the Revenues & Benefits Coventry Call Centre Proposal To change the opening hours of the Revenues & Benefits Call Centre to 9am until 5pm Monday to Friday with effect
Analysts and Investors conference call Q1 2014 results 15 May 2014
 Analysts and Investors conference call Q1 2014 results 15 May 2014 DISCLAIMER This presentation has been prepared by Air Berlin PLC. No representation, warranty or undertaking, express or implied, is made
Using Futures Markets to Manage Price Risk for Feeder Cattle (AEC 2013-01) February 2013
 February 2013") Using Futures Markets to Manage Price Risk for Feeder Cattle (AEC 2013-01) February 2013 Kenny Burdine 1 Introduction: Price volatility in feeder cattle markets has greatly increased since 2007. While
Using Futures Markets to Manage Price Risk for Feeder Cattle (AEC 2013-01) February 2013 Kenny Burdine 1 Introduction: Price volatility in feeder cattle markets has greatly increased since 2007. While
The New Workers Compensation Experience Mod. Billy Smith EVP, Risk Management Pete Bellnier, Sr. Underwriter, Workers Compensation
 The New Workers Compensation Experience Mod Billy Smith EVP, Risk Management Pete Bellnier, Sr. Underwriter, Workers Compensation 1 Why is There an E-Mod? Industry Standard Individual Employer s Published
World Oil Markets: Implications for Consumers, Producers, and the World Economy. James D. Hamilton Dept. of Economics, UCSD
 World Oil Markets: Implications for Consumers, Producers, and the World Economy James D. Hamilton Dept. of Economics, UCSD 1 Inflation-adjusted price of crude oil (West Texas Intermediate, 2008 dollars)
Coffee prices fall to 18-month low as supply concerns fade
 Coffee prices fall to 18-month low as supply concerns fade The coffee market registered further decreases in July with prices reacting to the depreciation in the Brazilian exchange rate, which dropped
Choosing a Cell Phone Plan-Verizon
 Choosing a Cell Phone Plan-Verizon Investigating Linear Equations I n 2008, Verizon offered the following cell phone plans to consumers. (Source: www.verizon.com) Verizon: Nationwide Basic Monthly Anytime
CHOOSE MY BEST PLAN OPTION (PLAN FINDER) INSTRUCTIONS
 INSTRUCTIONS") CHOOSE MY BEST PLAN OPTION (PLAN FINDER) INSTRUCTIONS Anthem Medical Plan For Employees Working In the US February 10, 2012 Page 1 IMPORTANT NOTES YOU SHOULD CONSIDER BEFORE USING THE TOOL The Choose My
CHOOSE MY BEST PLAN OPTION (PLAN FINDER) INSTRUCTIONS Anthem Medical Plan For Employees Working In the US February 10, 2012 Page 1 IMPORTANT NOTES YOU SHOULD CONSIDER BEFORE USING THE TOOL The Choose My
Computing & Telecommunications Services Monthly Report March 2015
 March 215 Monthly Report Computing & Telecommunications Services Monthly Report March 215 CaTS Help Desk (937) 775-4827 1-888-775-4827 25 Library Annex [email protected] www.wright.edu/cats/ Last Modified
1. Introduction. 2. User Instructions. 2.1 Set-up
 1. Introduction The Lead Generation Plan & Budget Template allows the user to quickly generate a Lead Generation Plan and Budget. Up to 10 Lead Generation Categories, typically email, telemarketing, advertising,
Interest Rates. Countrywide Building Society. Savings Growth Data Sheet. Gross (% per annum)
") Interest Rates (% per annum) Countrywide Building Society This is the rate of simple interest earned in a year (before deducting tax). Dividing by 12 gives the monthly rate of interest. Annual Equivalent
Interest Rates (% per annum) Countrywide Building Society This is the rate of simple interest earned in a year (before deducting tax). Dividing by 12 gives the monthly rate of interest. Annual Equivalent
Economy Class: One bag 22x15x8 inches (55x38x20 cm) weighing not more than 15 lbs(7kg).
 weighing not more than 15 lbs(7kg).") CHECK-IN TIMES Emirates check-in counters worldwide open no less than 3 hours prior to departure. First and Business Class passengers should report to Emirates check-in desks not later than 1 hour prior
CHECK-IN TIMES Emirates check-in counters worldwide open no less than 3 hours prior to departure. First and Business Class passengers should report to Emirates check-in desks not later than 1 hour prior
Airline Industry Analysis Page 1 of 15. Memorandum. Adam Brown, Radmila Gogzheyan, Greg Huwel, Marie Meininger, Josh Riedel, Christina Ryan
 Airline Industry Analysis Page 1 of 15 Date: July 13, 2009 Memorandum Subject: To: From: Airline Industry Analysis Dr. Matt Ford Adam Brown, Radmila Gogzheyan, Greg Huwel, Marie Meininger, Josh Riedel,
Global Corporate Travel Trends
 Global Corporate Travel Trends Andrew W. Menkes, CTC Partnership Travel Consulting, LLC Agenda 1. 1. Industry Overview Walk Down Memory Lane 3. 3. Trends and Forecasts 4. 4. Future Insights Legacy Problems
How To Get A Ticket Upgrade On Aa.Com
 2013 Benefits Guide Going gold is a serious upgrade. 2 gold membership gives you a whole new world of benefits. Complimentary and 500 Mile Upgrades As a Gold member, you ll be able to request complimentary
Media Planning. Marketing Communications 2002
 Media Planning Marketing Communications 2002 Media Terminology Media Planning - A series of decisions involving the delivery of messages to audiences. Media Objectives - Goals to be attained by the media
ILLINOIS STATE BOARD OF EDUCATION Nutrition Programs Division 100 North First Street, W-270 Springfield, IL 62777-0001
 ILLINOIS STATE BOARD OF EDUCATION Nutrition Programs Division 100 North First Street, W-270 Springfield, IL 62777-0001 CHILD AND ADULT CARE FOOD PROGRAM MANAGEMENT ASSESSMENT FOR NEW INSTITUTIONS Directions:
Frequent Flier Credit Cards Generate More Than $4 Billion for Major U.S. Airlines - A Report from IdeaWorks
 Generate More Than $4 Billion for Major U.S. Airlines - A Report from IdeaWorks Card issuers, such as American Express, Bank of America, Chase, Citi, and US Bank, are attracted by annual charge volumes
CONDITIONS OF CONTRACT
 NOTICE : if the passenger s journey involves an ultimate destination or stop in a country other than the country of departure the Warsaw Convention may be applicable and the Convention governs and in most
Norwegian Air Shuttle ASA (NAS) Q4 2003 and FY 2003. 24-26 February 2004
 Q4 2003 and FY 2003. 24-26 February 2004") Norwegian Air Shuttle ASA (NAS) Q4 2003 and FY 2003 24-26 February 2004 Agenda Introduction Financials Q4 2003 and FY 2003 Norwegian low-fare operation Going forward 2004 2 Agenda Introduction Financials
Norwegian Air Shuttle ASA (NAS) Q4 2003 and FY 2003 24-26 February 2004 Agenda Introduction Financials Q4 2003 and FY 2003 Norwegian low-fare operation Going forward 2004 2 Agenda Introduction Financials
INSTITUTIONAL INVESTMENT & FIDUCIARY SERVICES: Building a Better Portfolio: The Case for High Yield Bonds
 14\GBS\22\25062C.docx INSTITUTIONAL INVESTMENT & FIDUCIARY SERVICES: Building a Better Portfolio: The Case for High Yield Bonds By Adam Marks, Area Vice President and Jamia Canlas, Senior Analyst By looking
World of Air Fares. Thea van de Loo
 World of Air Fares Thea van de Loo Welcome and Program Welcome: Thea van de Loo World of Air Fares classes of service booking classes yield management alliances and Code Share Fare rules moment of booking