World Oil Markets: Implications for Consumers, Producers, and the World Economy. James D. Hamilton Dept. of Economics, UCSD
|
|
|
- Beatrix Bradley
- 8 years ago
- Views:
Transcription
1 World Oil Markets: Implications for Consumers, Producers, and the World Economy James D. Hamilton Dept. of Economics, UCSD 1

2 Inflation-adjusted price of crude oil (West Texas Intermediate, 2008 dollars)

3 Key parameter in any economic model of oil effects: value share = dollar value of expenditures on oil divided by dollar value of total expenditures Reason: individual consumer has option to keep buying same amount as before, meaning dollar loss = quantity purchased times price change 3

4 Observed average percent change in total consumption spending m months following an energy price increase that reduces purchasing power 0.1% (e.g., % P = 5 and share = 0.02). Source: Edelstein and Kilian (2007). 4
. Source: Edelstein and Kilian (2007). 4")
5 Observed average percent change in indicated category of consumption m months following an energy price increase that reduces purchasing power 0.1% (e.g., % P = 5 and a = 0.02). Source: Edelstein and Kilian (2007). 5
. Source: Edelstein and Kilian (2007). 5")
6 U.S. auto capacity by segment (thousands of units per quarter). Source: Bresnahan and Ramey, American Economic Review, May

7 Shift away from domestically manufactured vehicles. Source: Edelstein and Kilian (2007). 7

8 Shift away from light trucks (SUVs). Source: Edelstein and Kilian (2007). 8

9 Average GDP growth in 4 quarters following big oil price increases Date of oil price spike 1974:Q1 Average actual GDP growth following 4 qtrs -1.9% GDP growth if motor vehicles had no change -1.2% 1979:Q3-0.6% +0.1% 1981:Q1 1.3% 1.5% 1990:Q3-0.6% -0.1% 9

10 Historical oil shocks also often followed by rapid loss of consumer confidence. Source: Edelstein and Kilian (2007). 10

11 Cumulative logarithmic change in U.S. real GDP since 1949 (horizontal axis) and in U.S. oil consumption (vertical axis) GDP e 1.94 = 7 (2006 GDP)/(1949 GDP) = 7 e 1.27 = 3.6 (2006 oil)/(1949 oil) =

12 Cumulative logarithmic change in U.S. real GDP since 1949 (horizontal axis) and in U.S. oil consumption (vertical axis) Oil price rose 81% 1 Oil use fell 21% GDP 12

13 Cumulative logarithmic change in U.S. real GDP since 1949 (horizontal axis) and in U.S. oil consumption (vertical axis) 1.4 Oil price rose 40% Oil use fell 21% Oil price rose 81% Oil use fell 1% GDP 13

14 Cumulative logarithmic change in U.S. real GDP since 1949 (horizontal axis) and in U.S. oil consumption (vertical axis) : slope = : slope = : slope = GDP 14

15 15

16 16
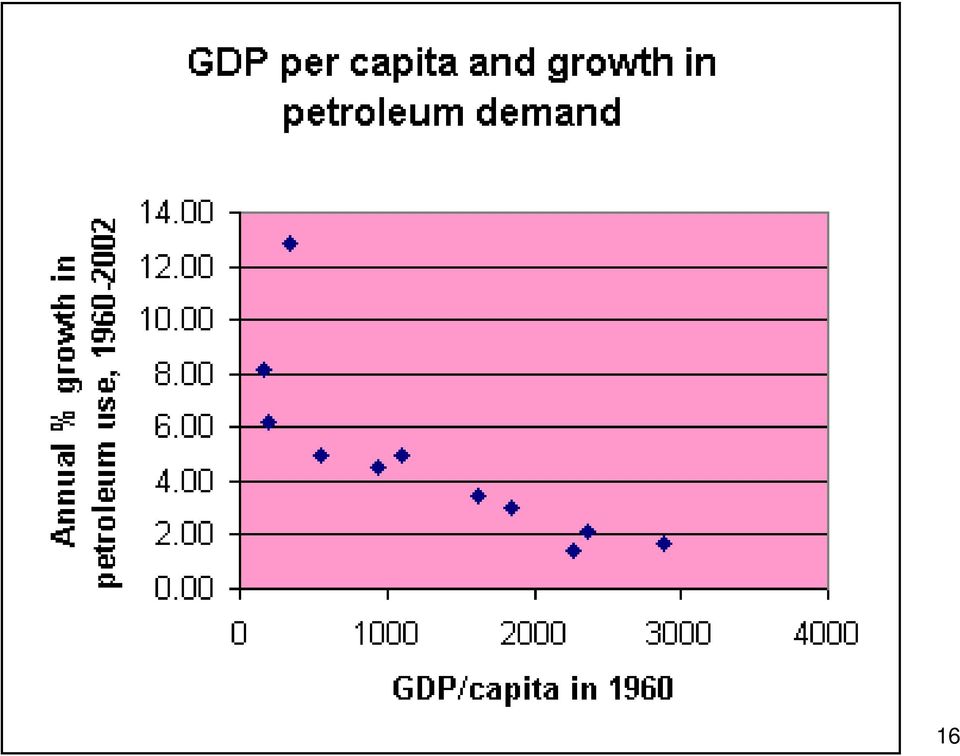
17 Income elasticity for developing countries is closer to 1 Source: Gately and Huntington,

18 7.2% per year! Chinese oil consumption (mb/d)

19 By 2020, China would be using 20 mb/d (= current U.S.) By 2030, China would be using 40 mb/d data trend

20 Oil use per person in China is less than 1/3 current value for Mexico. China has 3.3 vehicles per 100 residents, compared with 77 in U.S data trend

21 World crude oil production (million barrels per day)
22 : China increased consumption by 860,000 b/d World production actually fell slightly OECD countries decreased consumption by 720,000 b/d 22
23 Inflation-adjusted price of crude oil (West Texas Intermediate, 2008 dollars)
24 Income elasticity of oil demand for U.S. is less than 1 (% change oil < % change GDP) Implies dollar share of oil in GDP would fall over time Price elasticity of oil demand is less than 1 (% change oil < % change price) Implies dollar share of oil in GDP rises when price of oil rises 24
25 Dollar value of crude oil as percentage of U.S. GDP, annually and 2008:H1 estimate :H1 calculation used crude oil price of $111/barrel. 25
26 Figure 1 - Moving 12-Month Total on ALL Roads 3,100 3,000 2,900 2,800 Annual Vehicle-Distance Traveled (Billion Miles) 2,700 2,600 2,500 2,400 2,300 2,200 2,100 2,000 1,900 1,800 1,700 1,600 1,500 1, YEAR 26
27 U.S. gasoline consumption: this year (red) versus last (blue) Jun 06 - May 07 Jun 07 - May Jun 1 Jul 6 Aug 10 Sep 14 Oct 19 Nov 23 Dec 28 Feb 1 Mar 7 Apr 11 May 16 27
28 Down 28% June 07 to June 08 28
29 1990:Q3-1991:Q1 GDP from autos (2000 $) -$49 B 2007:Q3-2008:Q1 29
30 1990:Q3-1991:Q1 2007:Q3-2008:Q1 GDP from autos (2000 $) -$49 B -$43 B 30
31 1990:Q3-1991:Q1 2007:Q3-2008:Q1 GDP from autos (2000 $) -$49 B -$43 B (as % of GDP) 0.7% 0.4% 31
32 GDP from autos (2000 $) (as % of GDP) jobs in autos (April yearto year) 1990:Q3-1991:Q1 -$49 B 0.7% -88, :Q3-2008:Q1 -$43 B 0.4% -107,000 32
33 GM announced it will close 4 plants Ford will eliminate 15% of salaried positions Continental, United, Delta, and American Airlines all announced significant flight eliminations and employment cuts in the thousands 33
34 Temecula, CA 60 miles from downtown San Diego population doubled last decade 15% homes now in foreclosure 34
35 11 Figure 1. Unemployment
36 120 Index of consumer sentiment
37 4 Texas Prudhoe Bay Alaska US total
38 Number of wells Fraction offshore Depth of wells
39 North Sea Cantarell Mexico Daqing China
40 By 2020, China would be using 20 mb/d (= current U.S.) By 2030, China would be using 40 mb/d data trend
41 Dollar value of crude oil as percentage of U.S. GDP, annually and 2008:H1 estimate
AT&T Global Network Client for Windows Product Support Matrix January 29, 2015
 AT&T Global Network Client for Windows Product Support Matrix January 29, 2015 Product Support Matrix Following is the Product Support Matrix for the AT&T Global Network Client. See the AT&T Global Network
COMPARISON OF FIXED & VARIABLE RATES (25 YEARS) CHARTERED BANK ADMINISTERED INTEREST RATES - PRIME BUSINESS*
 CHARTERED BANK ADMINISTERED INTEREST RATES - PRIME BUSINESS*") COMPARISON OF FIXED & VARIABLE RATES (25 YEARS) 2 Fixed Rates Variable Rates FIXED RATES OF THE PAST 25 YEARS AVERAGE RESIDENTIAL MORTGAGE LENDING RATE - 5 YEAR* (Per cent) Year Jan Feb Mar Apr May Jun
COMPARISON OF FIXED & VARIABLE RATES (25 YEARS) 2 Fixed Rates Variable Rates FIXED RATES OF THE PAST 25 YEARS AVERAGE RESIDENTIAL MORTGAGE LENDING RATE - 5 YEAR* (Per cent) Year Jan Feb Mar Apr May Jun
The Fuel and Vehicle Trends Report January 31, 2014
 ISSN 1948-2388 The Fuel and Vehicle Trends Report This report is a summary of the latest fuel prices and other oil industry key statistics. In addition, this report provides the latest trends in vehicle
Causes and Consequences of the Decline in the Price of Oil since June 2014
 Causes and Consequences of the Decline in the Price of Oil since June 2014 Christiane Baumeister Lutz Kilian University of Notre Dame University of Michigan CEPR Brent Price of Crude Oil in 2013 and 2014
Case 2:08-cv-02463-ABC-E Document 1-4 Filed 04/15/2008 Page 1 of 138. Exhibit 8
 Case 2:08-cv-02463-ABC-E Document 1-4 Filed 04/15/2008 Page 1 of 138 Exhibit 8 Case 2:08-cv-02463-ABC-E Document 1-4 Filed 04/15/2008 Page 2 of 138 Domain Name: CELLULARVERISON.COM Updated Date: 12-dec-2007
Sonoma County Economic Development Board BUSINESS BAROMETER
 BUSINESS BAROMETER September 2006 In This Month s Report: Newly revised employment data shows that Sonoma County added 3,000 jobs in the 12-month period ending July 2006. The seasonally adjusted unemployment
The Changing Relationship Between the Price of Crude Oil and the Price At the Pump
 In 2007, what goes up, does not necessarily come down... May 3, 2007 The Changing Relationship Between the Price of Crude Oil and the Price At the Pump Prepared by: Tim Hamilton Petroleum Industry Consultant
Natural Gas / Electricity and the Industrial Sector. The Dismantling of US Manufacturing
 Natural Gas / Electricity and the Industrial Sector The Dismantling of US Manufacturing Paul Cicio President Industrial Energy Consumers of America August, 2007 Who Are Energy Price Sensitive Industries?
Analysis One Code Desc. Transaction Amount. Fiscal Period
 Analysis One Code Desc Transaction Amount Fiscal Period 57.63 Oct-12 12.13 Oct-12-38.90 Oct-12-773.00 Oct-12-800.00 Oct-12-187.00 Oct-12-82.00 Oct-12-82.00 Oct-12-110.00 Oct-12-1115.25 Oct-12-71.00 Oct-12-41.00
Enhanced Vessel Traffic Management System Booking Slots Available and Vessels Booked per Day From 12-JAN-2016 To 30-JUN-2017
 From -JAN- To -JUN- -JAN- VIRP Page Period Period Period -JAN- 8 -JAN- 8 9 -JAN- 8 8 -JAN- -JAN- -JAN- 8-JAN- 9-JAN- -JAN- -JAN- -JAN- -JAN- -JAN- -JAN- -JAN- -JAN- 8-JAN- 9-JAN- -JAN- -JAN- -FEB- : days
EMERGING MARKET CURRENCY PAIRS CURRENCY GUIDE
 EMERGING MARKET CURRENCY PAIRS CURRENCY GUIDE /MXN /Mexico 14.597/12.548 168.8 14.5500 14.2500 13.9500 13.7000 13.4000 13.1000 12.7767 JAN 9 FEB 28 APR 21 JUN 11 JUL 30 SEP 18 NOV 7 12.5500 The /MXN is
April Gross Receipts Show Impact of Low Oil and Gas Prices
 OKLAHOMA STATE TREASURER KEN MILLER For Immediate Release: May 5, 2015 April Gross Receipts Show Impact of Low Oil and Gas Prices OKLAHOMA CITY Oklahoma s April Gross Receipts to the Treasury report shows
PETROLEUM WATCH September 16, 2011 Fossil Fuels Office Fuels and Transportation Division California Energy Commission
 PETROLEUM WATCH September 16, 2011 Fossil Fuels Office Fuels and Transportation Division California Energy Commission Summary As of September 14, retail regular-grade gasoline prices in California increased
ECONOMIC INDICATORS AS PREDICTORS OF
 UMTRI-2009-27 JULY 2009 ECONOMIC INDICATORS AS PREDICTORS OF THE NUMBER AND FUEL ECONOMY OF PURCHASED NEW VEHICLES MICHAEL SIVAK BRANDON SCHOETTLE ECONOMIC INDICATORS AS PREDICTORS OF THE NUMBER AND FUEL
Infographics in the Classroom: Using Data Visualization to Engage in Scientific Practices
 Infographics in the Classroom: Using Data Visualization to Engage in Scientific Practices Activity 4: Graphing and Interpreting Data In Activity 4, the class will compare different ways to graph the exact
Lifting the Crude Oil Export Ban
 September 2015 Lifting the Crude Oil Export Ban Explainer I: Crude Oil Export Ban Overview The Bipartisan Policy Center (BPC) prepared this overview as part of a series to promote greater understanding
APES Math Review. For each problem show every step of your work, and indicate the cancellation of all units No Calculators!!
 APES Math Review For each problem show every step of your work, and indicate the cancellation of all units No Calculators!! Scientific Notation All APES students should be able to work comfortably with
CREDIT UNION TRENDS REPORT
 CREDIT UNION TRENDS REPORT CUNA Mutual Group Economics June 2 (April 2 data) Highlights During April, credit unions picked up 3, new memberships, credit union loan balances grew at an annualized 1.7% pace,
Architectural Services Data Summary March 2011
 Firms Typically Small in Size According to the latest U.S. Census Survey of Business Owners, majority of the firms under the description Architectural Services are less than 500 in staff size (99.78%).
The Central Role of Energy Efficiency in the Energy Outlook and EIA s Energy Data Program
 The Central Role of Energy Efficiency in the Energy Outlook and EIA s Energy Data Program For MIT Energy Initiative Symposium May 12, 2014 Cambridge, MA By Howard Gruenspecht, Deputy Administrator U.S.
Ashley Institute of Training Schedule of VET Tuition Fees 2015
 Ashley Institute of Training Schedule of VET Fees Year of Study Group ID:DECE15G1 Total Course Fees $ 12,000 29-Aug- 17-Oct- 50 14-Sep- 0.167 blended various $2,000 CHC02 Best practice 24-Oct- 12-Dec-
NATIONAL CREDIT UNION SHARE INSURANCE FUND
 NATIONAL CREDIT UNION SHARE INSURANCE FUND PRELIMINARY & UNAUDITED FINANCIAL HIGHLIGHTS RENDELL L. JONES CHIEF FINANCIAL OFFICER MANAGEMENT OVERVIEW Balance Sheet Other - Insurance and Guarantee Program
AOBA Utility Committee
 AOBA Utility Committee Energy Markets in Tailspin Major Economic Recession Continues to Pull Energy Prices Downward Where Will It End? Presented By Bruce R. Oliver President, Revilo Hill Associates, Inc.
December 2015 Lutgert College Of Business 10501 FGCU Blvd. South Fort Myers, FL 33965 Phone 239-590-7090 www.fgcu.edu/cob/reri
 Southwest Florida Regional Economic Indicators December 2015 Lutgert College Of Business 10501 FGCU Blvd. South Fort Myers, FL 33965 Phone 239-590-7090 www.fgcu.edu/cob/reri Table of Contents Introduction:
Recent U.S. Economic Growth In Charts MAY 2012
 Recent U.S. Economic Growth In Charts MAY 212 GROWTH SINCE 29 The Growth Story Since 29 Despite the worst financial crisis since the Great Depression and a series of shocks in its aftermath, the economy
Economic Data. October 30, 2015. October 29, 2015
 Economic Data October 29, 2015 Country Economic Data Actual Expected Previous NZD RBNZ Rate Decision 2.75% 2.75% 2.75% JPY Industrial Production M/M Sep 1.00% -0.60% -1.20% AUD Import Price Index Q/Q Q3
Box 6 International Oil Prices: 2002-03
 Annual Report 2002-03 International Oil Prices: 2002-03 Box 6 International Oil Prices: 2002-03 Notwithstanding the state of the world economy, characterised by sluggish growth in 2002, the world crude
Adjusted Estimates of Texas Natural Gas Production
 Adjusted Estimates of Texas Natural Gas Production Background The Energy Information Administration (EIA) is adjusting its estimates of natural gas production in Texas for 2004 and 2005 to correctly account
Economic indicators dashboard
 AS OF NOVEMBER 17, 2015 Economic indicators dashboard Vist www.blog.helpingadvisors.com for the full commentary of the Economic Indicators Dashboard. MOST RECENT 3-MO. trend TYPICAL range EXTREME range
Detailed guidance for employers
 April 2015 3 Detailed guidance for employers Appendix A: Pay reference periods This document accompanies: Detailed guidance no. 3 Assessing the workforce Pay reference period calendars where the definition
The Impact of Medicare Part D on the Percent Gross Margin Earned by Texas Independent Pharmacies for Dual Eligible Beneficiary Claims
 The Impact of Medicare Part D on the Percent Gross Margin Earned by Texas Independent Pharmacies for Dual Eligible Beneficiary Claims Angela Winegar, M.S., Marvin Shepherd, Ph.D., Ken Lawson, Ph.D., and
Example of a diesel fuel hedge using recent historical prices
 Example of a diesel fuel hedge using recent historical prices Firm A expects to consume 5,, litres of diesel fuel over the next 12 months. Fuel represents a large expense for the firm, and volatile prices
Consumer ID Theft Total Costs
 Billions Consumer and Business Identity Theft Statistics Business identity (ID) theft is a growing crime and is a growing concern for state filing offices. Similar to consumer ID theft, after initially
Impacts of Government Jobs in Lake County Oregon
 Impacts of Government Jobs in Lake County Oregon April 2011 Prepared by Betty Riley, Executive Director South Central Oregon Economic Development District Annual Average Pay Based on Oregon Labor Market
Natural Gas: Winter 2012-13 Abundance! and Some Confusion
 Natural Gas: Winter 2012-13 Abundance! and Some Confusion NASEO Winter Fuels Outlook Washington, D.C. October 10, 2012 Bruce B. Henning Vice President, Energy Regulatory and Market Analysis BHenning@icfi.com
Bond Market Perspectives
 LPL FINANCIAL RESEARCH Bond Market Perspectives December 16, 2014 Tempting TIPS Anthony Valeri, CFA Fixed Income & Investment Strategist LPL Financial Highlights Lower inflation expectations as a result
Commodity Price Outlook & Risks
 Commodity Outlook & Risks Research Department, Commodities Team January, 2 www.imf.org/commodities commodities@imf.org This monthly report presents a price outlook and risk assessment for selected commodities
State Heating Oil & Propane Program Final Report Winter 2004/2005
 Commonwealth of Massachusetts Division of Energy Resources State Heating Oil & Propane Program Final Report Winter 2004/2005 May 2005 Mitt Romney Governor Kerry Healey Lt. Governor Beth Lindstrom Director,
CENTERPOINT ENERGY TEXARKANA SERVICE AREA GAS SUPPLY RATE (GSR) JULY 2015. Small Commercial Service (SCS-1) GSR
 JULY 2015. Small Commercial Service (SCS-1) GSR") JULY 2015 Area (RS-1) GSR GSR (LCS-1) Texarkana Incorporated July-15 $0.50690/Ccf $0.45450/Ccf $0.00000/Ccf $2.85090/MMBtu $17.52070/MMBtu Texarkana Unincorporated July-15 $0.56370/Ccf $0.26110/Ccf $1.66900/Ccf
JULY 2015 Area (RS-1) GSR GSR (LCS-1) Texarkana Incorporated July-15 $0.50690/Ccf $0.45450/Ccf $0.00000/Ccf $2.85090/MMBtu $17.52070/MMBtu Texarkana Unincorporated July-15 $0.56370/Ccf $0.26110/Ccf $1.66900/Ccf
Ghana's Economic Performance 2010
 GHANA STATISTICAL SERVICE (GSS) Statistics for Development and Progress Ghana's Economic Performance 21 i n f i g u r e s P.O. Box GP 198, Accra www. statsghana.gov.gh 211 Ghana's Economic Performance
Falling Oil Prices and US Economic Activity: Implications for the Future
 Date Issue Brief # I S S U E B R I E F Falling Oil Prices and US Economic Activity: Implications for the Future Stephen P.A. Brown December 2014 Issue Brief 14-06 Resources for the Future Resources for
May 2014 Texas School Bond Elections
 May 2014 Texas School Bond Elections What are the individual districts needs? New facilities Renovations Technology Central facilities How much tax revenue can the district generate? Depends on district
Aurora Updates Aurora Dividend Income Trust (Managed Fund) vs. Listed Investment Companies
 vs. Listed Investment Companies") Aurora Updates Aurora Dividend Income Trust (Managed Fund) vs. Listed Investment Companies Executive Summary 21 January 2014 The Aurora Dividend Income Trust (Managed Fund) is an efficient and low risk
Aurora Updates Aurora Dividend Income Trust (Managed Fund) vs. Listed Investment Companies Executive Summary 21 January 2014 The Aurora Dividend Income Trust (Managed Fund) is an efficient and low risk
TAX REVENUE MONTHLY REPORT
 TAX REVENUE MONTHLY REPORT NOVEMBER 2015 TAX REVENUE PERFORMANCE Total tax revenue went up to 12.1 billion in November and expanded by 1.5% in a year-to-year comparison (0.18 billion more) as a result
Coffee Year 2014-15 Futures Trading Analysis
 Lower coffee exports lend support to Robusta prices The coffee market rallied slightly in June, led in most part by a recovery in Robusta prices. For the sixth month in a row exports were lower than last
Consumer prices and the money supply
 Consumer prices and the money supply Annual rise. Per cent. -year moving average Money supply Consumer prices - - 9 9 9 96 98 Sources: Statistics Norway and Norges Bank JB Terra Kapitalmarkedsdager, Gardermoen.
FY 2015 Schedule at a Glance
 Coaching and Mentoring for Excellence Oct 21 23, 2014 $2,950 Residential Coaching and Mentoring for Excellence Apr 7 9, 2015 $2,400 Non-residential Coaching and Mentoring for Excellence May 27 29, 2015
How Can Fleets Control Mounting Fuel Costs? Effective fuel management requires purchase controls and driver behavior modification.
 How Can Fleets Control Mounting Fuel Costs? Effective fuel management requires purchase controls and driver behavior modification. How Can Fleets Control Mounting Fuel Costs? 2 Effective Fuel Management
North American Freight Rail Industry. Transportation Research Board Washington, DC March 14, 2014
 North American Freight Rail Industry Transportation Research Board Washington, DC March 14, 2014 Railroads Help Keep Coal- Based Electricity BNSF CN CP CSX FXE KCS/KCSM NS UP Other RRs Freight Railroads
Ways We Use Integers. Negative Numbers in Bar Graphs
 Ways We Use Integers Problem Solving: Negative Numbers in Bar Graphs Ways We Use Integers When do we use negative integers? We use negative integers in several different ways. Most of the time, they are
Oil & Gas Market Outlook. 6 th Norwegian Finance Day Marianne Kah, Chief Economist March 2, 2016
 Oil & Gas Market Outlook 6 th Norwegian Finance Day Marianne Kah, Chief Economist March 2, 2016 Challenging Market Environment Concerns that global economic growth will slow and reduce global oil and natural
2015-16 BCOE Payroll Calendar. Monday Tuesday Wednesday Thursday Friday Jun 29 30 Jul 1 2 3. Full Force Calc
 July 2015 CM Period 1501075 July 2015 1 2 3 4 5 6 7 8 9 10 11 12 13 14 15 16 17 18 19 20 21 22 23 24 25 26 27 28 29 30 31 August 2015 1 2 3 4 5 6 7 8 9 10 11 12 13 14 15 16 17 18 19 20 21 22 23 24 25 26
Economic Data. October 01, 2015. September 30, 2015. October 01, 2015
 Economic Data September 30, 2015 Country Economic Data Actual Expected Previous NZD Building Permits M/M Aug -4.90% 20.40% GBP GfK Consumer Sentiment Sep 3 5 7 JPY Industrial Production M/M Aug P -0.50%
2015 Malaysia Automotive Market Outlook
 2015 Malaysia Automotive Market Outlook New and Face Lifted Model Launches at Lower Price Points to Drive Market Growth 9AB2-18 April 2015 Contents Section Slide Number Executive Summary 3 2014 Automotive
National Economic Indicators. September 28, 2015
 National Economic Indicators September 8, Table of Contents GDP Release Date Latest Period Page Table: Real Gross Domestic Product Sep-- 8: Q- Real Gross Domestic Product Sep-- 8: Q- Decomposition of Real
Economic Activity Index ( GDB-EAI ) For the month of January 2013
 For the month of January 2013") Economic Activity Index ( GDB-EAI ) For the month of January 2013 Special Comment Payroll Employment Benchmark Revision March 2013 There was a major revision on the benchmark of the payroll employment
Economic Activity Index ( GDB-EAI ) For the month of January 2013 Special Comment Payroll Employment Benchmark Revision March 2013 There was a major revision on the benchmark of the payroll employment
Third Quarter 2015 Marketing Overview. Alan H. Shaw Executive Vice President and Chief Marketing Officer
 Third Quarter 2015 Marketing Overview Alan H. Shaw Executive Vice President and Chief Marketing Officer 1 Adapting to our Changing Environment Current Conditions Fuel Surcharges Commodity Prices and Strength
An Assessment of Prices of Natural Gas Futures Contracts As A Predictor of Realized Spot Prices at the Henry Hub
 An Assessment of Prices of Natural Gas Futures Contracts As A Predictor of Realized Spot Prices at the Henry Hub This article compares realized Henry Hub spot market prices for natural gas during the three
Media Planning. Marketing Communications 2002
 Media Planning Marketing Communications 2002 Media Terminology Media Planning - A series of decisions involving the delivery of messages to audiences. Media Objectives - Goals to be attained by the media
CREDIT UNION TRENDS REPORT
 CREDIT UNION TRENDS REPORT CUNA Mutual Group Economics May 216 (March 216 Data) Highlights During March, credit unions picked-up 577, in new memberships, loan and savings balances grew at a % and 7.6%
Recent Developments and Outlook for the Mexican Economy Credit Suisse, 2016 Macro Conference April 19, 2016
 Credit Suisse, Macro Conference April 19, Outline 1 Inflation and Monetary Policy 2 Recent Developments and Outlook for the Mexican Economy 3 Final Remarks 2 In line with its constitutional mandate, the
3 rd Brazil - China Capital Markets Forum
 3 rd Brazil - China Capital Markets Forum Ilan Goldfajn Chief Economist, Itaú Unibanco Partner, Itaú BBA August 30 th, 2012 In Brief World: consolidating a scenario of low growth. Slow recovery in the
Oil Markets Update- October 2015
 SICO Research November 23, - October Crude prices remain low in October led by oversupply and weak economic indicators October has been a volatile month for crude prices; Brent reached USD 53.05/bbl in
Natural Gas Diversification Strategy for PREPA GOVERNMENT DEVELOPMENT BANK FOR PUERTO RICO
 Natural Gas Diversification Strategy for PREPA GOVERNMENT DEVELOPMENT BANK FOR PUERTO RICO Agenda 1 Importance of Diversifying to Natural Gas 2 Natural Gas Diversification Strategy 2 Currently, Puerto
Housing Price Forecasts, 2015. Illinois and Chicago MSA
 Housing Price Forecasts, 2015 Illinois and Chicago MSA Presented To Illinois Association of Realtors From R E A L Regional Economics Applications Laboratory, Institute of Government and Public Affairs
Performance Measures. First Quarter 2012
 Performance Measures First Quarter 2012 1Q2012 Earn & Retain Community Trust 6 Performance Measures: Ridership Cost Efficiency (Cost per Revenue Hour) Cost Effectiveness (Cost per Passenger) Service Effectiveness
A Resource for Free-standing Mathematics Units. Data Sheet 1
 Data Sheet 1 Regular Expenses Item Estimate of Cost When Petrol/Diesel 10p per mile As needed Oil 12 for can of oil and filter Once or twice per year Air Filter 10 Once a year MOT 25-30 (excluding repairs)
CONNECTICUT ENERGY PRICE REPORT
 CONNECTICUT ENERGY PRICE REPORT 1/15/2015 DENOTES FALLING PRICES COMPARED TO YEAR EARLIER DENOTES FLAT PRICES COMPARED TO YEAR EARLIER DENOTES RISING PRICES COMPARED TO YEAR EARLIER CONNECTICUT RETAIL
Ghana s Economic and Political Environment and the Implications for Doing Business
 Ghana s Economic and Political Environment and the Implications for Doing Business Dr. Joe Amoako-Tuffour Director of Research The African Center for Economic Transformation Accra November 5, 2015 NORWAY-GHANA
CAFIS REPORT 2015.10
 CAFIS REPORT 2015.10 INDEX Message CAFIS Inbound 03-06 07-08 CAFIS Arch 09-10 CAFIS Brain 11-12 CAFIS Global 13-14 What We Do 15-16 About CAFIS 17-18 Services for Member Stores 19-34 Services for Card
The 2007-2009 Recession: Similarities to and Differences from the Past
 The 2007-2009 Recession: Similarities to and Differences from the Past Marc Labonte Specialist in Macroeconomic Policy October 6, 2010 Congressional Research Service CRS Report for Congress Prepared for
P/T 2B: 2 nd Half of Term (8 weeks) Start: 25-AUG-2014 End: 19-OCT-2014 Start: 20-OCT-2014 End: 14-DEC-2014
 Start: 25-AUG-2014 End: 19-OCT-2014 Start: 20-OCT-2014 End: 14-DEC-2014") 2014-2015 SPECIAL TERM ACADEMIC CALENDAR FOR SCRANTON EDUCATION ONLINE (SEOL), MBA ONLINE, HUMAN RESOURCES ONLINE, NURSE ANESTHESIA and ERP PROGRAMS SPECIAL FALL 2014 TERM Key: P/T = Part of Term P/T Description
2014-2015 SPECIAL TERM ACADEMIC CALENDAR FOR SCRANTON EDUCATION ONLINE (SEOL), MBA ONLINE, HUMAN RESOURCES ONLINE, NURSE ANESTHESIA and ERP PROGRAMS SPECIAL FALL 2014 TERM Key: P/T = Part of Term P/T Description
P/T 2B: 2 nd Half of Term (8 weeks) Start: 26-AUG-2013 End: 20-OCT-2013 Start: 21-OCT-2013 End: 15-DEC-2013
 Start: 26-AUG-2013 End: 20-OCT-2013 Start: 21-OCT-2013 End: 15-DEC-2013") 2013-2014 SPECIAL TERM ACADEMIC CALENDAR FOR SCRANTON EDUCATION ONLINE (SEOL), MBA ONLINE, HUMAN RESOURCES ONLINE, NURSE ANESTHESIA and ERP PROGRAMS SPECIAL FALL 2013 TERM Key: P/T = Part of Term P/T Description
2013-2014 SPECIAL TERM ACADEMIC CALENDAR FOR SCRANTON EDUCATION ONLINE (SEOL), MBA ONLINE, HUMAN RESOURCES ONLINE, NURSE ANESTHESIA and ERP PROGRAMS SPECIAL FALL 2013 TERM Key: P/T = Part of Term P/T Description
IEA-IEF-OPEC Outlook Comparison
 IEA-IEF-OPEC Outlook Comparison Richard Newell, Director, Duke University Energy Initiative Gendell Professor of Energy and Environmental Economics, Nicholas School of the Environment Sixth IEA-IEF-OPEC
P/T 2B: 2 nd Half of Term (8 weeks) Start: 24-AUG-2015 End: 18-OCT-2015 Start: 19-OCT-2015 End: 13-DEC-2015
 Start: 24-AUG-2015 End: 18-OCT-2015 Start: 19-OCT-2015 End: 13-DEC-2015") 2015-2016 SPECIAL TERM ACADEMIC CALENDAR For Scranton Education Online (SEOL), Masters of Business Administration Online, Masters of Accountancy Online, Health Administration Online, Health Informatics
2015-2016 SPECIAL TERM ACADEMIC CALENDAR For Scranton Education Online (SEOL), Masters of Business Administration Online, Masters of Accountancy Online, Health Administration Online, Health Informatics
II. Measuring and Analyzing GDP
 A Macroeconomic Perspective on the Real Sector: Growth, Economic Fluctuations and Inflation Workshop for Staff of Ministry of National Planning and Economic Development Nay Pyi Taw, Myanmar June 2 3, 2014
Gold Recap. Spread JAN6 FEB6 APR6 JUN6 DEC5 1.3 1.3 0.6-0.3 JAN6 - -0.7-1.6 FEB6-0.7-1.6 APR6-0.9. OI Gold. Chg.
 Economic Data December 21, 2015 Country Economic Data Actual Expected Previous JPY All Industry Activity Index M/M Oct 1.00% 0.80% -0.20% JPY BoJ Monthly Report EUR German PPI M/M Nov -0.20% -0.20% -0.40%
Room XXVI Palais des Nations Geneva, Switzerland. Oil Market Outlook. Eissa B. Alzerma Oil Price Analyst Petroleum Studies Department, OPEC
 UNCTAD Multi-Year Expert Meeting on Commodities and Development 2013 Recent developments and new challenges in commodity markets, and policy options for commodity-based inclusive growth and sustainable
If you are having technical difficulties, please call Go To Webinar at (800) 263 6317
 263 6317") If you are having technical difficulties, please call Go To Webinar at (800) 263 6317 STAR Ohio Update November 19, 2013 Josh Mandel, Treasurer of Ohio Conrad R. Metz, Chief Investment Officer Jason Click,
If you are having technical difficulties, please call Go To Webinar at (800) 263 6317 STAR Ohio Update November 19, 2013 Josh Mandel, Treasurer of Ohio Conrad R. Metz, Chief Investment Officer Jason Click,
October 2013 - Bottled Water Exports and Imports continue to grow!
 October 13 - Bottled Water Exports and Imports continue to grow! Annualised exports for the year to October 13 continue an upwards climb following their break through NZD1m last month. Leading markets
Resource Management Spreadsheet Capabilities. Stuart Dixon Resource Manager
 Resource Management Spreadsheet Capabilities Stuart Dixon Resource Manager Purpose Single view of resource data Shows rolling demand vs supply for 14 months, 2 months back, current month, and 11 forward
Grain Stocks Estimates: Can Anything Explain the Market Surprises of Recent Years? Scott H. Irwin
 Grain Stocks Estimates: Can Anything Explain the Market Surprises of Recent Years? Scott H. Irwin http://nationalhogfarmer.com/weekly-preview/1004-corn-controversies-hog-market http://online.wsj.com/news/articles/sb10001424052970203752604576641561657796544
Eurozone Economic dashboard
 Eurozone Economic dashboard Our Economic Dashboard is designed to help investors understand the true state of the eurozone economy. It is not meant to serve as a direct prediction regarding the future
Coffee prices fall to 18-month low as supply concerns fade
 Coffee prices fall to 18-month low as supply concerns fade The coffee market registered further decreases in July with prices reacting to the depreciation in the Brazilian exchange rate, which dropped
Treasury Presentation to TBAC
 Treasury Presentation to TBAC Office of Debt Management Fiscal Year 2015 Q1 Report Table of Contents I. Fiscal II. A. Quarterly Tax Receipts p. 4 B. Monthly Receipt Levels p. 5 C. Eleven Largest Outlays
Overview of Program Management Services and Proposed CIP FY2012-17
 Finance & Administration Committee Item III-A January 13, 2010 Overview of Program Management Services and Proposed CIP FY2012-17 Page 3 of 64 Washington Metropolitan Area Transit Authority Board Action/Information
2012 CBECS: Preliminary Results and Timeline for Data Release
 2012 CBECS: Preliminary Results and Timeline for Data Release Joelle Michaels, CBECS Survey Manager Interagency Sustainability Working Group September 18, 2012 Washington, DC U.S. Energy Information Administration
1. Introduction. 2. User Instructions. 2.1 Set-up
 1. Introduction The Lead Generation Plan & Budget Template allows the user to quickly generate a Lead Generation Plan and Budget. Up to 10 Lead Generation Categories, typically email, telemarketing, advertising,
2013 global economic outlook: Are promising growth trends sustainable? Timothy Hopper, Ph.D., Chief Economist, TIAA-CREF January 24, 2013
 2013 global economic outlook: Are promising growth trends sustainable? Timothy Hopper, Ph.D., Chief Economist, TIAA-CREF January 24, 2013 U.S. stock market performance in 2012 * +12.59% total return +6.35%
The S&P 500 and Asian investors
 The S&P 500 and Asian investors CME Group s Flagship S&P 500 Equity Index Futures Contract July 2015 Equity Index Futures on the S&P 500 CME Group s flagship equity index product CME Group E-mini S&P 500
Economic Update as of June 30, 2016
 MACRO Report: Review of Wyoming s Economy Economic Update as of June 30, The MACRO Report is a quarterly publication comprised of charts focusing on energy, employment, state revenues, and other indicators
OMBU ENTERPRISES, LLC. Process Metrics. 3 Forest Ave. Swanzey, NH 03446 Phone: 603-209-0600 Fax: 603-358-3083 E-mail: OmbuEnterprises@msn.
 OMBU ENTERPRISES, LLC 3 Forest Ave. Swanzey, NH 03446 Phone: 603-209-0600 Fax: 603-358-3083 E-mail: OmbuEnterprises@msn.com Process Metrics Metrics tell the Process Owner how the process is operating.
Federal Housing Finance Agency
 Fourth Quarter 20 FHFA Federal Property Manager's Report This report contains data on foreclosure prevention activity, refinance and MHA program activity of Fannie Mae and Freddie Mac (the Enterprises)
Workforce Demands In the Mining Industry Workforce Solutions
 Workforce Demands In the Mining Industry Workforce Solutions *Workforce Solutions is an affiliate of the Gulf Coast Workforce Board, which manages a regional workforce system that helps employers solve
Monetary Policy in Emerging Markets: Indonesia s s Case
 Monetary Policy in Emerging Markets: Indonesia s s Case Hartadi A. Sarwono, Deputy Governor Paper presented at The OECD-CCBS CCBS Seminar on Monetary Policy in Emerging Markets,, Paris, 28 February 2007.
How To Find Out How Effective Stimulus Is
 Do Tax Cuts Boost the Economy? David Rosnick and Dean Baker September 2011 Center for Economic and Policy Research 1611 Connecticut Avenue, NW, Suite 400 Washington, D.C. 20009 202-293-5380 www.cepr.net
Fixed Income 2015 Update. Kathy Jones, Senior Vice President Chief Fixed Income Strategist, Schwab Center for Financial Research
 Fixed Income 2015 Update Kathy Jones, Senior Vice President Chief Fixed Income Strategist, Schwab Center for Financial Research 1 Fed: Slow and Low 2015 Fixed Income Outlook 2 Yield Curve Flattening 3
Coffee year 2014/15 ends with prices at 20-month low
 Coffee year 2014/15 ends with prices at 20-month low The coffee market slumped further in September, following a slight rally in August, with the weakness of the real and peso again proving the most influential
UPDATE ON CURRENT MACRO ENVIRONMENT
 1 Oct 213 Macro & Strategy Equity Credit Commodities 13 13 #1 Global Strategy #1 Multi Asset Research #3 Global Economics #2 Equity Quant #2 Index Analysis #3 SRI Research 12 sector teams in the Top 1