Steady-State Power System Security Analysis with PowerWorld Simulator
|
|
|
- Oswin Norton
- 9 years ago
- Views:
Transcription
1 Steady-State Power System Security Analysis with PowerWorld Simulator S6: Voltage Stability Using PV Curves 2001 South First Street Champaign, Illinois (217)
2 Voltage Stability Concepts Voltage stability is the ability of a power system to maintain acceptable voltage at all buses under normal operating conditions and after being subjected to a contingency Voltage stability is a local phenomenon, but its consequences may have a widespread impact A local voltage collapse can and does lead to a widespread collapse of the power system 2
3 Voltage Stability Studies Characteristics of interest are the relationships between transmitted power (P), receiving end voltage (V), and reactive power injection (Q) Traditional forms of displaying these relationships are PV and QV curves obtained through steady-state analysis V-Q sensitivities can also be used as indicators of voltage stability 3
4 PV Study The PV (Power-Voltage) analysis process involves using a series of power flow solutions for increasing transfers of MW and monitoring what happens to system voltages as a result Relationship of voltage to MW transfer is nonlinear, which requires the full power flow solutions 4
5 PV Study Traditionally, MW transfer is designed to model increasing load in a part of the system Specific buses must be selected for monitoring and PV curves are plotted for each bus 5
6 Typical PV Curve Plot Voltage (the V ) Note: This curve is very non-linear. This nonlinearity is the reason that faster linear sensitivity methods cannot be used with PV curve analysis. Critical voltage Maximum Transfer MW Transfer (the P ) 6
7 PV Curve Results At the knee of the PV curve, voltage drops rapidly with an increase in MW transfer The power flow solution fails to converge beyond this limit, which is indicative of instability You may remember the term Maximum Power Transfer from electrical engineering courses. This is the same topic. Operation at or near the stability limit risks a largescale blackout A satisfactory operating condition is ensured by allowing sufficient power margin 7
8 PV Curve Example Use the MAIN 10,452 bus example Midwest.RAW Midwest Injection Groups.aux Midwest PV Options.aux ARPINCTG.aux We will study a transfer of power from generators in MAPP to an increasing Wisconsin load First step - define an injection group containing MAPP generators to serve as the source 8
9 Injection Groups Injection Groups in Simulator PVQV define which region or regions will import the transfer and which region or regions will supply it These are discussed in section I5: Data Aggregation The groups will act in unison to implement a power transfer One side is the source - the other is the sink 9

10 Defining Injection Groups Select Aggregations Injection Groups from the Model Explorer Presently reads None Defined. Right click and select Insert from the local menu. Rename the group MAPP (default: DefaultIG1) This opens the following display 10
11 Defining Participation Points Now add the points of injection to the group To do this, click Insert Points or choose Records Insert on the Participation Points list This opens the dialog below 11
12 Use Filters to Choose Points Click the button Edit Area/Zone Filters Set all areas to No except MAPP Close the Area/Zone Filters display Check the box Use Area/Zone Filters The list of generators will now only show those generators which are in MAPP 12
13 Defining Participation Points Select all the generators in the list by clicking the button Select All For this example, assume all generators will participate proportional to their MW reserves Therefore, select Base on Positive Reserve Use Add -> key to move the selected generators into the participation point list 13
14 Defining Participation Points Each generator will have a participation factor calculated for it based on the method of calculation selected, or will use the pre-defined values In this case, the participation factors will be proportional to the MW reserves Hit OK to add points to injection group 14
15 Define the Sink Group Process is very similar Change area/zone filters so that only areas (WPL, WEP, WPS, and MGE) are set to YES Open Injection Groups display again. Select Records Insert Call this group WUMS Choose Insert Points or Records Insert Switch to Load Tab, because we want the loads to serve as injection points 15

16 Define the Sink Group Select all the loads in the list Use Base on Size to calculate the participation factor, so that the larger loads will participate more heavily in the transfer Click the Add -> button to move loads into the list 16
17 Saving the groups We have now defined a set of source and sink points. The PV study will model an increasing transfer from source to sink. This procedure involved a lot of steps, so you don t want to have to redefine the groups for a slightly different case To save the injection groups, select an injection group and use the Save Auxiliary Menu This will save the groups in a text file along with any other auxiliary data you may have The data can then be loaded into a different case as needed 17
18 Contingency Definition In addition to analyzing the system for its current topology, you may want to examine a specific set of contingencies Simulator s contingency analysis is fully integrated into the PVQV package to allow you to gauge the impact of contingencies To define a contingency list, go to Tools Contingency Analysis 18
19 Contingency Definition For this example, we will use a pre-defined contingency called WPS-ARP2e which is a common contingency in the MAIN list OPEN Branch ARP 345 (39244) TO EAU CL 3 (61853) CKT 1 OPEN Branch WIEN (39706) TO T-CRNRS7 (61866) CKT 1 Also only monitor the regions in MAIN Open Tools Limit Monitoring Settings and Violations Go to the Area Reporting tab Set MAIN areas to Report Limits = YES. (Areas 56-68). Set all other areas to NO. The file ARPINCTG.AUX contains the contingency definition and the Area Monitoring Settings 19
20 Performing a PV Curve Study: Open the PV Study We are finally ready to perform the PVQV study. Select Add Ons ribbon tab PV Curves. This form is organized in a series of pages, that are arranged in the order they should be considered We will use this form to set up a transfer from MAPP to WUMS 20
21 Setup: Common Options Transfer Definition Under Source, click on the drop-down box and select MAPP, our predefined injection group Under Sink, select WUMS You can also define these groups from this dialog by selecting View/Define Groups 21

22 Setup: Common Options 22
23 Setup: Common Options Vary transfer options Initial Step Size The rate at which transfer will increase initially 100 MW for example Minimum Step Size Whenever Simulator fails to converge at a particular transfer level, it will return to the previous one and use a smaller increase. This is the minimum. 10 MW for example Reduce step by a factor of Amount Simulator will reduce the transfer by in case of nonconvergence (Not MWs) 2 for example Stop when transfer exceeds When checked, the PV analysis will stop after a specified MW transfer level has been achieved Unchecked for example 23

24 Setup: Injection Group Ramping Options 24
25 Setup: Injection Group Ramping Options Island-Based AGC Tolerance Tolerance used in the MW control loop when solving the power flow during implementation of the transfer General rule of thumb is that Minimum Step Size should be at least 1 to 2 times larger than this value Simulator will modify this so that MVA convergence tolerance < AGC Tolerance < Minimum Step Size 5 MW for example Allow only AGC units to vary In Simulator each unit may be on or off of AGC. If this box is checked only those set on AGC can vary. Unchecked for example 25
26 Setup: Injection Group Ramping Options Enforce unit MW limits When checked generators will only participate in the transfer if they are within their min/max MW limits Unchecked for example, so we may examine the transfer capacity regardless of reserve in MAPP Do not allow negative load When this box is checked, loads will be prevented from being set below zero Unchecked for example Generator Merit Order Dispatch When in use, each individual generator will be moved to its min/max in succession in order of descending participation factor (as set in its injection group participation point) Can choose to do this for the source only, sink only, or both Can also choose to Use Economic merit order dispatch to maintain units within an Economic Min/Max Unchecked for this example 26
27 Setup: Common Options Stop after finding at least critical scenarios Minimum number of critical scenarios that will be found 1 for example Skip Contingencies Check this box to run the analysis for the base case only Unchecked for example Run Base Case to Completion When checked, the critical transfer point is found for the base case in addition to the number of specified critical scenarios Unchecked for example 27


28 Setup: Advanced Options pfqmult pf specified Each column must sum to 1 28
29 Setup: Advanced Options How should reactive power load change during ramping? Maintain the MW/MVAR ratio at each load, but then scale MVAR by a factor of pf Q 1 Existing = cos tan P Existing 1 Q = tan ( cos ( pf )) P pfqmult As MW changes, change the MVAR at a power factor of ( specified ) ( 1 ) Q = tan cos pf P 29
30 Setup: Advanced Options Load Component Variation Total load (P,Q) at a load can be specified as the sum of constant power (S), constant current (I), and constant impedance components (Z) Constant current and constant impedance components are both functions of voltage at the bus These options determine the proportion of the load change that each component receives 30
31 Setup: Advanced Options Load Component Variation All changes apply to constant power (S MW, S MVAR) P = P, P = 0, P = 0, Q = Q, Q = 0, Q = 0 S I Z S I Z Vary in proportion to existing Z,I,P ratios Existing ratios determined based on the existing total nominal load (P nom,q nom ) prior to any change due to the transfer PnomS PnomI QnomS QnomZ kps =, kpi =,..., kqs =,..., kqz = P P Q Q nom nom nom nom Ratios are multiplied by the total nominal load change to calculate the nominal load change for each component P = k P, P = k P,..., Q = k Q... noms PS nom nomi PI nom noms QS nom 31
32 Setup: Advanced Options Load Component Variation Vary in proportion to existing Z,I,P ratios The total nominal power change is determined based on the total real power change required due to the transfer, the calculated ratios, and present voltage at a bus P Pnom = 2 kps + kpi * V + kpz * V Change in nominal reactive power is determined based on the option selected for how reactive power should change during the transfer 32
33 Setup: Advanced Options Load Component Variation Vary using proportions specified below Proportions are grouped by real and reactive power and then source or sink Proportions for each group must sum to 1 so that component changes sum to the total load change Same calculations as option to use existing Z,I,P ratios except that the ratios are user-specified Apply Reverse Transfer For any contingency that does not solve in the base case, apply a transfer from the Sink to the Source in an attempt to find a solution Must specify the Maximum Reverse Transfer because it is possible that a solvable point will not be found 33

34 Interface MW Flow Ramping Method 34
35 Interface MW Flow Ramping Method Requires the OPF add-on Ramps transfer by increasing flow on 1 or 2 interfaces Search direction determined by Step Size and Angle Optional constraint to maintain flow on a third interface Interface Y X 1 = X 0 + StepSize*cos(θ) Y 1 = Y 0 + StepSize*sin(θ) (X 1, Y 1 ) Search Direction Y 0 Step Size θ Extra Constraint Interface Z = Z Setpoint X 0 Interface X 35
36 Quantities to Track On the Quantities to track page, there are several sub pages that allow you to track values for various devices Let s monitor the following bus voltages (use the Find button): ARP 138 (39245) SPG 138 (39114) And this line s MVA (ARP 345) to (EAU CL 3) circuit 1. Monitor in the direction (TO-FROM) Search for the fields and toggle to change values 36

37 Quantities to Track 37
38 Quantities to Track: Devices At Limits Can track devices that hit or back off limits during the analysis Limits are only tracked during the base case ramping and not during contingencies Generator var, switched shunt var, LTC transformer tap, line thermal, and interface thermal limits can be tracked Limit the amount of elements that are tracked by defining filters for each type of element tracked 38
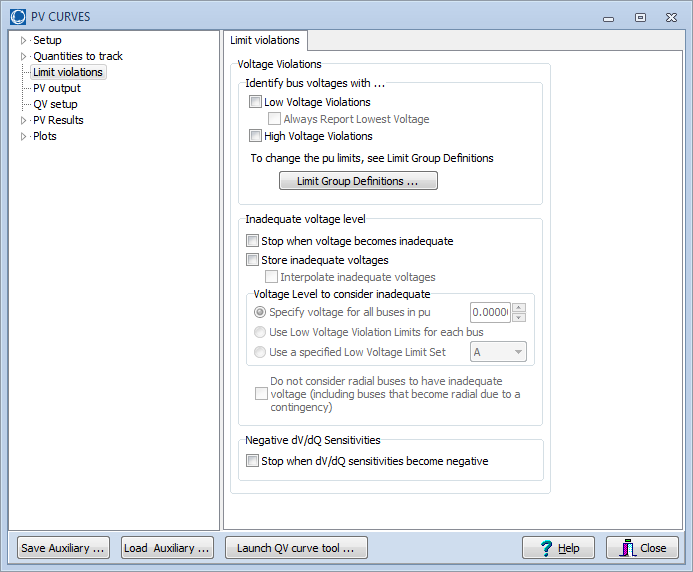
39 Limit Violations 39
40 Limit Violations Use the Identify Bus Voltage Violations with section to tell the PV tool to keep track of buses that violate their voltage limits as of the last successful solution for each scenario Low Voltage Violations Always Report Lowest Voltage will report a voltage even if it does not violate a low voltage limit High Voltage Violations Selecting either one of the two voltage violation boxes will make available a few tools and fields on the Overview table on the PV Results page 40
41 Limit Violations Limit Monitoring Settings determine which buses are monitored and how high and low voltage violations are identified for each bus Limit Group Definitions button will open the Limit Monitoring Settings dialog Inadequate voltage level Stop when voltage becomes inadequate A scenario will be judged critical once any monitored voltage falls below the inadequate voltage level Store inadequate voltages Keeps track of inadequate voltages without considering a scenario to be critical Interpolate inadequate voltages Allows linear estimation of where a voltage becomes inadequate without having to reduce the step size in order to exactly determine when a voltage becomes inadequate 41
42 Limit Violations Inadequate Voltage Level Specify voltage level to consider inadequate Specify voltage for all buses Use Low Voltage Violation Limits for each bus Use a specified Low Voltage Limit Set Do not consider radial buses to have inadequate voltage Buses that are connected by only a single in-service branch are considered radial. If buses are connected by more than one branch, all but one of the branches is open. Buses that are radial for a given scenario, even those that become radial due to a contingency, will not be monitored Limit Monitoring Settings option to not monitor radial lines and buses will exclude from monitoring those buses that are connected by a single branch in the base case 42
43 PV Output Save results to file Simulator records the value of each monitored quantity at each transfer level for each contingency being studied Data only present in memory unless storage file and location specified Save results to file Check and specify the file path and name Results stored with transfer level in rows and tracked quantities in columns Comma-separated file regardless of file extension chosen For this example, choose file c:\temp\voltage.txt Transpose results Results stored with tracked quantities in rows and transfer levels in columns Single Header File Only a single header is shown at the top of the file rather than repeating the header at the start of each scenario section 43
44 PV Output State Archiving Entire system can be saved during the analysis Directory and prefix must be specified to help in distinguishing between separate PV runs Can save as PWB, AUX, or both This can require significant disk space, but can be quite helpful to examine a particular transfer level Save only the base case for each critical contingency Base case without contingency but with critical transfer level implemented will be saved for each critical scenario Save all states All states at each valid transfer will be saved Non-critical states will be saved with contingency implemented. Only base case saved at the critical transfer level. Base case state without contingency implemented will be saved for all scenarios at all transfer levels at which that scenario will solve 44
45 Save/Load Auxiliary Options This form has a large number of options These do not have to be set every time - just use the Save Auxiliary button at the bottom of the form to transfer options between case Options are saved in Simulator s Auxiliary File format You may also load options back in by choose the Load Auxiliary button 45

46 PV Results Performing the Analysis Go to the PV Results page to initiate the PV Curve analysis. Click Run to begin. 46
47 PV Results Overview, Plot When the PV run is completed, the Overview list display will show a summary of the results Critical scenarios (contingencies) are identified along with information about the critical buses and maximum achieved transfer levels Plots of tracked quantities can be made from the Legacy Plots tab or Plots page System state is left at the transfer level of the last studied critical scenario with any contingency restored 47

48 PV Results Legacy Plots Tab Once the PV tool has completed running, you may plot the results using the Legacy Plots tab of the PV Results page Choose Horizontal Axis and Vertical Axis values For vertical axis, choose which elements to plot with selected values Enter a title for the plot Choose which contingencies to include on the plot Click to show the plot 48
49 PV Results Legacy Plots Tab The plot tab allows the user to plot all of the values that were designated to be monitored during the analysis For example, we can plot the bus voltages vs. the size of the transfer For Horizontal-Axis, select Nominal Shift For Vertical-Axis, select PU Volt Select all the buses as elements Select all PV Scenarios Use appropriate title 49
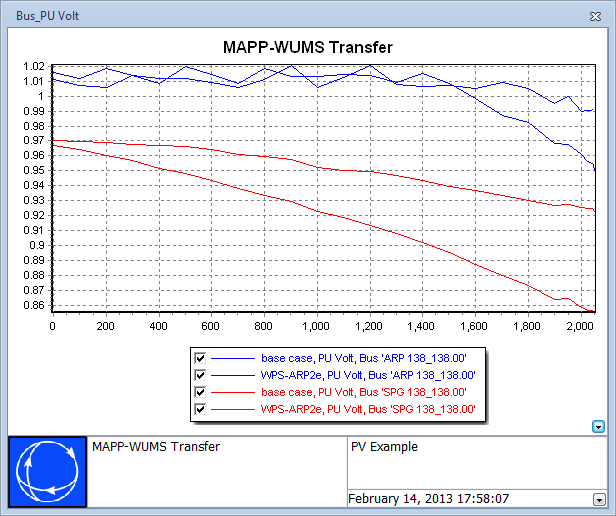
50 PV Results Example PV Curve Notice the jaggedness of the plot. This is caused by the switched shunt and LTC transformer control actions trying to pull the voltages up. Traditionally when performing PV runs, one should disable this control switching. PU Volt PV Curve for MAPP-WUMS Transfer Right-click on the plot to Save it as a bitmap, metafile, or JPEG, or to copy or print the plot ,000 1,200 Nominal Shift 1,400 1,600 1,800 2,000 base case: SPG 138 _138.0 (39114) base case: ARP 138 _138.0 (39245) WPS-ARP2e: SPG 138 _138.0 (39114) WPS-ARP2e: ARP 138 _138.0 (39245) Build Date: August 16,

51 PV Results Track Limits 51
52 PV Results Other actions View activity log Outlines step-by-step the activities the PV tool performed during the run View detailed results Opens a text file that contains the detailed results including the values of the tracked quantities at each step for each scenario Clear results Purges the currently stored results from memory Restore Initial State Brings back the case that was in memory prior to the PV run Restore Last Solved State Brings back the solved power flow model that depicts the system at the largest transfer level that was studied. This is a base case state with no contingency implemented. 52
53 PV Results Other actions Save critical contingencies Saves contingency settings and records in an auxiliary file for each scenario where a critical state was reached Set current state as initial Removes the case that was in memory at the beginning of the PV run and replaces it with what is currently in memory Start Over Removes all results from memory, restores the initial case, and removes all entries from the activity log Run QV tool Launches the QV tool using the case that is currently in memory as its basis 53
54 Time Saving Measures Only define a few contingencies - each contingency monitored can add significant time to the PV study Try to limit the number of Quantities to Track. There is no hard limit on this, but the amount of computer memory can become substantial if you try to monitor too much. 54

55 Plot Designer 55
56 Blank Page
Introduction to PowerWorld Simulator: Interface and Common Tools
 Introduction to PowerWorld Simulator: Interface and Common Tools 2001 South First Street Champaign, Illinois 61820 +1 (217) 384.6330 [email protected] http://www.powerworld.com Fault Analysis Analysis
PowerWorld Simulator
 PowerWorld Simulator Quick Start Guide 2001 South First Street Champaign, Illinois 61820 +1 (217) 384.6330 [email protected] http://www.powerworld.com Purpose This quick start guide is intended to
Transient Stability Analysis with PowerWorld Simulator
 Transient Stability Analysis with PowerWorld Simulator T6: Storage of Transient Stability Results 2001 South First Street Champaign, Illinois 61820 +1 (217) 384.6330 [email protected] http://www.powerworld.com
Fault Analysis I13-1. 2008 PowerWorld Corporation
 Fault Analysis Analysis of power system parameters resulting from a ground or line to line fault somewhere in the system Simulator contains a tool for analyzing faults in an automatic fashion Can perform
Contouring and Advanced Visualization
 Contouring and Advanced Visualization Contouring Underlay your oneline with an image Geographic Data Views Auto-created geographic data visualization Emphasis of Display Objects Make specific objects standout
Steady-State Power System Security Analysis with PowerWorld Simulator
 Steady-State Power System Security Analysis with PowerWorld Simulator S: Power System Modeling Methods and Equations 00 South First Street Champaign, Illinois 680 + (7) 384.6330 [email protected]
N-1-1 Contingency Analysis using PowerWorld Simulator
 N-1-1 Contingency nalysis using PowerWorld Simulator uthor: PowerWorld Corporation Scott R. Dahman, P.E. Date: March 24, 2010 October 25, 2012 (revised) Table of Contents Background and Objective... 2
Power System Simulation for Engineers (PSS/E version 33)
") Power System Simulation for Engineers (PSS/E version 33) Here are instructions for accessing and using the PSS/E-33 software. On-campus students should access this software at any of the computers in the
Power System Simulation for Engineers (PSS/E version 33) Here are instructions for accessing and using the PSS/E-33 software. On-campus students should access this software at any of the computers in the
Merging Labels, Letters, and Envelopes Word 2013
 Merging Labels, Letters, and Envelopes Word 2013 Merging... 1 Types of Merges... 1 The Merging Process... 2 Labels - A Page of the Same... 2 Labels - A Blank Page... 3 Creating Custom Labels... 3 Merged
Universal Simple Control, USC-1
 Universal Simple Control, USC-1 Data and Event Logging with the USB Flash Drive DATA-PAK The USC-1 universal simple voltage regulator control uses a flash drive to store data. Then a propriety Data and
ITS Training Class Charts and PivotTables Using Excel 2007
 When you have a large amount of data and you need to get summary information and graph it, the PivotTable and PivotChart tools in Microsoft Excel will be the answer. The data does not need to be in one
LAB1 INTRODUCTION TO PSS/E EE 461 Power Systems Colorado State University
 LAB1 INTRODUCTION TO PSS/E EE 461 Power Systems Colorado State University PURPOSE: The purpose of this lab is to introduce PSS/E. This lab will introduce the following aspects of PSS/E: Introduction to
Electrical Resonance
 Electrical Resonance (R-L-C series circuit) APPARATUS 1. R-L-C Circuit board 2. Signal generator 3. Oscilloscope Tektronix TDS1002 with two sets of leads (see Introduction to the Oscilloscope ) INTRODUCTION
Power System Simulation for Engineers (PSS/E): Fault Analysis
: Fault Analysis") Power System Simulation for Engineers (PSS/E): Fault Analysis Table of contents: A. GENERAL INSTRUCTIONS 1 B. REQUIRED DATA 2 C. READING AN EXISTING CASE 2 D. SAVING A CASE 4 E. CREATING A NEW CASE 4 F.
Power System Simulation for Engineers (PSS/E): Fault Analysis Table of contents: A. GENERAL INSTRUCTIONS 1 B. REQUIRED DATA 2 C. READING AN EXISTING CASE 2 D. SAVING A CASE 4 E. CREATING A NEW CASE 4 F.
4.1.1 Generator Owner 4.1.2 Transmission Owner that owns synchronous condenser(s)
") A. Introduction 1. Title: Verification and Data Reporting of Generator Real and Reactive Power Capability and Synchronous Condenser Reactive Power Capability 2. Number: MOD-025-2 3. Purpose: To ensure
A. Introduction 1. Title: Verification and Data Reporting of Generator Real and Reactive Power Capability and Synchronous Condenser Reactive Power Capability 2. Number: MOD-025-2 3. Purpose: To ensure
Distributed Flexible AC Transmission System (D FACTS) Jamie Weber. [email protected], 217 384 6330 ext. 13
 Jamie Weber. weber@powerworld.com, 217 384 6330 ext. 13") Distributed Flexible AC Transmission System (D FACTS) Jamie Weber [email protected], 217 384 6330 ext. 13 Slide Preparation: Kate Rogers Davis [email protected], 217 384 6330, Ext 14 2001 South First
Distributed Flexible AC Transmission System (D FACTS) Jamie Weber [email protected], 217 384 6330 ext. 13 Slide Preparation: Kate Rogers Davis [email protected], 217 384 6330, Ext 14 2001 South First
Dealing with Data in Excel 2010
 Dealing with Data in Excel 2010 Excel provides the ability to do computations and graphing of data. Here we provide the basics and some advanced capabilities available in Excel that are useful for dealing
BIGPOND ONLINE STORAGE USER GUIDE Issue 1.1.0-18 August 2005
 BIGPOND ONLINE STORAGE USER GUIDE Issue 1.1.0-18 August 2005 PLEASE NOTE: The contents of this publication, and any associated documentation provided to you, must not be disclosed to any third party without
ICP Data Validation and Aggregation Module Training document. HHC Data Validation and Aggregation Module Training Document
 HHC Data Validation and Aggregation Module Training Document Contents 1. Introduction... 4 1.1 About this Guide... 4 1.2 Scope... 4 2. Steps for Testing HHC Data Validation and Aggregation Module.. Error!
Step One. Step Two. Step Three USING EXPORTED DATA IN MICROSOFT ACCESS (LAST REVISED: 12/10/2013)
") USING EXPORTED DATA IN MICROSOFT ACCESS (LAST REVISED: 12/10/2013) This guide was created to allow agencies to set up the e-data Tech Support project s Microsoft Access template. The steps below have been
USING EXPORTED DATA IN MICROSOFT ACCESS (LAST REVISED: 12/10/2013) This guide was created to allow agencies to set up the e-data Tech Support project s Microsoft Access template. The steps below have been
Interactive Logging with FlukeView Forms
 FlukeView Forms Technical Note Fluke developed an Event Logging function allowing the Fluke 89-IV and the Fluke 189 models to profile the behavior of a signal over time without requiring a great deal of
Advanced Microsoft Excel 2010
 Advanced Microsoft Excel 2010 Table of Contents THE PASTE SPECIAL FUNCTION... 2 Paste Special Options... 2 Using the Paste Special Function... 3 ORGANIZING DATA... 4 Multiple-Level Sorting... 4 Subtotaling
ε: Voltage output of Signal Generator (also called the Source voltage or Applied
 Experiment #10: LR & RC Circuits Frequency Response EQUIPMENT NEEDED Science Workshop Interface Power Amplifier (2) Voltage Sensor graph paper (optional) (3) Patch Cords Decade resistor, capacitor, and
Q&As: Microsoft Excel 2013: Chapter 2
 Q&As: Microsoft Excel 2013: Chapter 2 In Step 5, why did the date that was entered change from 4/5/10 to 4/5/2010? When Excel recognizes that you entered a date in mm/dd/yy format, it automatically formats
Performing a Steady Flow Analysis
 C H A P T E R 7 Performing a Steady Flow Analysis This chapter discusses how to calculate steady flow water surface profiles. The chapter is divided into two parts. The first part discusses how to enter
Welcome to 360 Reporting... 3. Accessing 360 Reporting... 3 MicroEdge Support Program... 3. Using 360 Reporting... 4. Setting up Quick Find...
 Legal Notice The software described in this document is furnished under a license agreement. The software may be used or copied only in accordance with the terms of the agreement. No part of this document
EXCEL PIVOT TABLE David Geffen School of Medicine, UCLA Dean s Office Oct 2002
 EXCEL PIVOT TABLE David Geffen School of Medicine, UCLA Dean s Office Oct 2002 Table of Contents Part I Creating a Pivot Table Excel Database......3 What is a Pivot Table...... 3 Creating Pivot Tables
CATIA Basic Concepts TABLE OF CONTENTS
 TABLE OF CONTENTS Introduction...1 Manual Format...2 Log on/off procedures for Windows...3 To log on...3 To logoff...7 Assembly Design Screen...8 Part Design Screen...9 Pull-down Menus...10 Start...10
In This Issue: Excel Sorting with Text and Numbers
 In This Issue: Sorting with Text and Numbers Microsoft allows you to manipulate the data you have in your spreadsheet by using the sort and filter feature. Sorting is performed on a list that contains
Petrel TIPS&TRICKS from SCM
 Petrel TIPS&TRICKS from SCM Knowledge Worth Sharing Histograms and SGS Modeling Histograms are used daily for interpretation, quality control, and modeling in Petrel. This TIPS&TRICKS document briefly
Intermediate PowerPoint
 Intermediate PowerPoint Charts and Templates By: Jim Waddell Last modified: January 2002 Topics to be covered: Creating Charts 2 Creating the chart. 2 Line Charts and Scatter Plots 4 Making a Line Chart.
Mastering Mail Merge. 2 Parts to a Mail Merge. Mail Merge Mailings Ribbon. Mailings Create Envelopes or Labels
 2 Parts to a Mail Merge 1. MS Word Document (Letter, Labels, Envelope, Name Badge, etc) 2. Data Source Excel Spreadsheet Access Database / query Other databases (SQL Server / Oracle) Type in New List Mail
Power System review W I L L I A M V. T O R R E A P R I L 1 0, 2 0 1 3
 Power System review W I L L I A M V. T O R R E A P R I L 1 0, 2 0 1 3 Basics of Power systems Network topology Transmission and Distribution Load and Resource Balance Economic Dispatch Steady State System
Introduction to Microsoft Excel 2010
 Introduction to Microsoft Excel 2010 Screen Elements Quick Access Toolbar The Ribbon Formula Bar Expand Formula Bar Button File Menu Vertical Scroll Worksheet Navigation Tabs Horizontal Scroll Bar Zoom
Prism 6 Step-by-Step Example Linear Standard Curves Interpolating from a standard curve is a common way of quantifying the concentration of a sample.
 Prism 6 Step-by-Step Example Linear Standard Curves Interpolating from a standard curve is a common way of quantifying the concentration of a sample. Step 1 is to construct a standard curve that defines
In-Depth Guide Advanced Spreadsheet Techniques
 In-Depth Guide Advanced Spreadsheet Techniques Learning Objectives By reading and completing the activities in this chapter, you will be able to: Create PivotTables using Microsoft Excel Create scenarios
Create Charts in Excel
 Create Charts in Excel Table of Contents OVERVIEW OF CHARTING... 1 AVAILABLE CHART TYPES... 2 PIE CHARTS... 2 BAR CHARTS... 3 CREATING CHARTS IN EXCEL... 3 CREATE A CHART... 3 HOW TO CHANGE THE LOCATION
Excel -- Creating Charts
 Excel -- Creating Charts The saying goes, A picture is worth a thousand words, and so true. Professional looking charts give visual enhancement to your statistics, fiscal reports or presentation. Excel
Setup CMS 1500 (02/12) Claim Form
 Claim Form") Setup CMS-1500 (02/12) Claim Form Setup CMS 1500 (02/12) Claim Form The CMS 1500 (02/12) Form was added in Helper 8.1. Clients who upgrade from a version prior to 8.1 have two options; update an existing
Setup CMS-1500 (02/12) Claim Form Setup CMS 1500 (02/12) Claim Form The CMS 1500 (02/12) Form was added in Helper 8.1. Clients who upgrade from a version prior to 8.1 have two options; update an existing
Working with sections in Word
 Working with sections in Word Have you have ever wanted to create a Microsoft Word document with some pages numbered in Roman numerals and the rest in Arabic, or include a landscape page to accommodate
Plots, Curve-Fitting, and Data Modeling in Microsoft Excel
 Plots, Curve-Fitting, and Data Modeling in Microsoft Excel This handout offers some tips on making nice plots of data collected in your lab experiments, as well as instruction on how to use the built-in
ICP Data Entry Module Training document. HHC Data Entry Module Training Document
 HHC Data Entry Module Training Document Contents 1. Introduction... 4 1.1 About this Guide... 4 1.2 Scope... 4 2. Step for testing HHC Data Entry Module.. Error! Bookmark not defined. STEP 1 : ICP HHC
Importing and Exporting With SPSS for Windows 17 TUT 117
 Information Systems Services Importing and Exporting With TUT 117 Version 2.0 (Nov 2009) Contents 1. Introduction... 3 1.1 Aim of this Document... 3 2. Importing Data from Other Sources... 3 2.1 Reading
A Beginning Guide to the Excel 2007 Pivot Table
 A Beginning Guide to the Excel 2007 Pivot Table Paula Ecklund Summer 2008 Page 1 Contents I. What is a Pivot Table?...1 II. Basic Excel 2007 Pivot Table Creation Source data requirements...2 Pivot Table
A New Method for Estimating Maximum Power Transfer and Voltage Stability Margins to Mitigate the Risk of Voltage Collapse
 A New Method for Estimating Maximum Power Transfer and Voltage Stability Margins to Mitigate the Risk of Voltage Collapse Bernie Lesieutre Dan Molzahn University of Wisconsin-Madison PSERC Webinar, October
Introduction to Microsoft Excel 1 Part I
 Introduction to Microsoft Excel 1 Part I Objectives When you complete this workshop you will be able to: Recognize Excel s basic operations and tools; Develop simple worksheets; Use formulas; Format worksheets;
Customizing Confirmation Text and Emails for Donation Forms
 Customizing Confirmation Text and Emails for Donation Forms You have complete control over the look & feel and text used in your donation confirmation emails. Each form in Sphere generates its own confirmation
Navios Quick Reference
 Navios Quick Reference Purpose: The purpose of this Quick Reference is to provide a simple step by step outline of the information needed to perform various tasks on the system. We begin with basic tasks
Excel Pivot Tables. Blue Pecan Computer Training Ltd - Onsite Training Provider www.bluepecantraining.com :: 0800 6124105 :: [email protected].
 Excel Pivot Tables 1 Table of Contents Pivot Tables... 3 Preparing Data for a Pivot Table... 3 Creating a Dynamic Range for a Pivot Table... 3 Creating a Pivot Table... 4 Removing a Field... 5 Change the
Business Objects Version 5 : Introduction
 Business Objects Version 5 : Introduction Page 1 TABLE OF CONTENTS Introduction About Business Objects Changing Your Password Retrieving Pre-Defined Reports Formatting Your Report Using the Slice and Dice
TheFinancialEdge. Configuration Guide for General Ledger
 TheFinancialEdge Configuration Guide for General Ledger 071012 2012 Blackbaud, Inc. This publication, or any part thereof, may not be reproduced or transmitted in any form or by any means, electronic,
Company Setup 401k Tab
 Reference Sheet Company Setup 401k Tab Use this page to define company level 401(k) information, including employee status codes, 401(k) sources, and 401(k) funds. The definitions you create here become
"Excel with Excel 2013: Pivoting with Pivot Tables" by Venu Gopalakrishna Remani. October 28, 2014
 Teaching Excellence and Innovation 1 Pivot table Pivot table does calculations with criteria Data should be arranged as : Field names in the first rows, records in rows No blank rows or blank columns should
Scatter Plots with Error Bars
 Chapter 165 Scatter Plots with Error Bars Introduction The procedure extends the capability of the basic scatter plot by allowing you to plot the variability in Y and X corresponding to each point. Each
Business Warehouse Reporting Manual
 Business Warehouse Reporting Manual This page is intentionally left blank. Table of Contents The Reporting System -----------------------------------------------------------------------------------------------------------------------------
Microsoft Access 2010 Part 1: Introduction to Access
 CALIFORNIA STATE UNIVERSITY, LOS ANGELES INFORMATION TECHNOLOGY SERVICES Microsoft Access 2010 Part 1: Introduction to Access Fall 2014, Version 1.2 Table of Contents Introduction...3 Starting Access...3
Impedance Matching of Filters with the MSA Sam Wetterlin 2/11/11
 Impedance Matching of Filters with the MSA Sam Wetterlin 2/11/11 Introduction The purpose of this document is to illustrate the process for impedance matching of filters using the MSA software. For example,
This activity will show you how to draw graphs of algebraic functions in Excel.
 This activity will show you how to draw graphs of algebraic functions in Excel. Open a new Excel workbook. This is Excel in Office 2007. You may not have used this version before but it is very much the
Running a Load Flow Analysis
 Running a Load Flow Analysis The purpose of this tutorial is to introduce the Load Flow Analysis module, and provide instructions on how to run a load flow study. In addition, an example of how to regulate
IRF Business Objects. Using Excel as a Data Provider in an IRF BO Report. September, 2009
 IRF Business Objects Using Excel as a Data Provider in an IRF BO Report September, 2009 1 Why use Excel Data? Integrating data from: External systems (e.g. foreign accounting and payroll systems) Budget
Microsoft Excel 2010 Charts and Graphs
 Microsoft Excel 2010 Charts and Graphs Email: [email protected] Web Page: http://training.health.ufl.edu Microsoft Excel 2010: Charts and Graphs 2.0 hours Topics include data groupings; creating
Job Streaming User Guide
 Job Streaming User Guide By TOPS Software, LLC Clearwater, Florida Document History Version Edition Date Document Software Trademark Copyright First Edition 08 2006 TOPS JS AA 3.2.1 The names of actual
Tutorial Customer Lifetime Value
 MARKETING ENGINEERING FOR EXCEL TUTORIAL VERSION 150211 Tutorial Customer Lifetime Value Marketing Engineering for Excel is a Microsoft Excel add-in. The software runs from within Microsoft Excel and only
SAP Business Intelligence (BI) Reporting Training for MM. General Navigation. Rick Heckman PASSHE 1/31/2012
 Reporting Training for MM. General Navigation. Rick Heckman PASSHE 1/31/2012") 2012 SAP Business Intelligence (BI) Reporting Training for MM General Navigation Rick Heckman PASSHE 1/31/2012 Page 1 Contents Types of MM BI Reports... 4 Portal Access... 5 Variable Entry Screen... 5
2012 SAP Business Intelligence (BI) Reporting Training for MM General Navigation Rick Heckman PASSHE 1/31/2012 Page 1 Contents Types of MM BI Reports... 4 Portal Access... 5 Variable Entry Screen... 5
History Explorer. View and Export Logged Print Job Information WHITE PAPER
 History Explorer View and Export Logged Print Job Information WHITE PAPER Contents Overview 3 Logging Information to the System Database 4 Logging Print Job Information from BarTender Designer 4 Logging
Creating and Using Databases with Microsoft Access
 CHAPTER A Creating and Using Databases with Microsoft Access In this chapter, you will Use Access to explore a simple database Design and create a new database Create and use forms Create and use queries
Transmitter Interface Program
 Transmitter Interface Program Operational Manual Version 3.0.4 1 Overview The transmitter interface software allows you to adjust configuration settings of your Max solid state transmitters. The following
Excel 2007 - Using Pivot Tables
 Overview A PivotTable report is an interactive table that allows you to quickly group and summarise information from a data source. You can rearrange (or pivot) the table to display different perspectives
Appendix A How to create a data-sharing lab
 Appendix A How to create a data-sharing lab Creating a lab involves completing five major steps: creating lists, then graphs, then the page for lab instructions, then adding forms to the lab instructions,
Invoice Quotation and Purchase Orders Maker
 Invoice Quotation and Purchase Orders Maker Professional Edition Version 2.0.0.0 Help File By: Khaled Aljundi Software developer 1 P a g e Table of Contents 1.0 License Agreement... 3 2.0 About This Software...
Module 7 Invoicing. Step by Step Guide PSA 2015. 7.1 Single project invoicing 7.2 Batch invoicing projects 7.3 Program invoicing 7.
 Step by Step Guide PSA 2015 Module 7 7.1 Single project invoicing 7.2 Batch invoicing projects 7.3 Program invoicing 7.4 Invoice approval PSA 2015 (Release 2.3.0.243) PSA 2015 Step by Step Guide is published
Scan Physical Inventory
 Scan Physical Inventory There are 2 ways to do Inventory: #1 Count everything in inventory, usually done once a quarter #2 Count in cycles per area or category. This is a little easier and usually takes
WebFOCUS BI Portal: S.I.M.P.L.E. as can be
 WebFOCUS BI Portal: S.I.M.P.L.E. as can be Author: Matthew Lerner Company: Information Builders Presentation Abstract: This hands-on session will introduce attendees to the new WebFOCUS BI Portal. We will
Sage Abra SQL HRMS Reports. User Guide
 Sage Abra SQL HRMS Reports User Guide 2010 Sage Software, Inc. All rights reserved. Sage, the Sage logos, and the Sage product and service names mentioned herein are registered trademarks or trademarks
Excel 2013 - Using Pivot Tables
 Overview A PivotTable report is an interactive table that allows you to quickly group and summarise information from a data source. You can rearrange (or pivot) the table to display different perspectives
Statgraphics Getting started
 Statgraphics Getting started The aim of this exercise is to introduce you to some of the basic features of the Statgraphics software. Starting Statgraphics 1. Log in to your PC, using the usual procedure
GUIDE FOR SORTING RX HISTORY REPORTS IN MICROSOFT EXCEL
 GUIDE FOR SORTING RX HISTORY REPORTS IN MICROSOFT EXCEL 1. Log in to your INSPECT WebCenter Account. 2. Go to the Requests tab on the left, and select New Request. 3. Select Practitioner from the drop-down
Central and Remote Users Guide
 Central and Remote Users Guide Proprietary Rights Notice 1985-2006 IDEXX Laboratories, Inc. All rights reserved. Information in this document is subject to change without notice. Practice names, doctors,
Years after 2000. US Student to Teacher Ratio 0 16.048 1 15.893 2 15.900 3 15.900 4 15.800 5 15.657 6 15.540
 To complete this technology assignment, you should already have created a scatter plot for your data on your calculator and/or in Excel. You could do this with any two columns of data, but for demonstration
Microsoft Excel 2010 Tutorial
 1 Microsoft Excel 2010 Tutorial Excel is a spreadsheet program in the Microsoft Office system. You can use Excel to create and format workbooks (a collection of spreadsheets) in order to analyze data and
RA MODEL VISUALIZATION WITH MICROSOFT EXCEL 2013 AND GEPHI
 RA MODEL VISUALIZATION WITH MICROSOFT EXCEL 2013 AND GEPHI Prepared for Prof. Martin Zwick December 9, 2014 by Teresa D. Schmidt ([email protected]) 1. DOWNLOADING AND INSTALLING USER DEFINED SPLIT FUNCTION
Sample Table. Columns. Column 1 Column 2 Column 3 Row 1 Cell 1 Cell 2 Cell 3 Row 2 Cell 4 Cell 5 Cell 6 Row 3 Cell 7 Cell 8 Cell 9.
 Working with Tables in Microsoft Word The purpose of this document is to lead you through the steps of creating, editing and deleting tables and parts of tables. This document follows a tutorial format
Generating a Custom Bill of Materials
 Summary Tutorial TU0104 (v2.3) May 16, 2008 This tutorial describes how to use the Report Manager to set up a Bill of Materials (BOM) report. The manipulation of data and columns and exporting to an Excel
Welcome to the topic on creating key performance indicators in SAP Business One, release 9.1 version for SAP HANA.
 Welcome to the topic on creating key performance indicators in SAP Business One, release 9.1 version for SAP HANA. 1 In this topic, you will learn how to: Use Key Performance Indicators (also known as
BulkSMS Text Messenger Product Manual
 BulkSMS Text Messenger Product Manual 1. Installing the software 1.1. Download the BulkSMS Text Messenger Go to www.bulksms.com and choose your country. process. Click on products on the top menu and select
Record Specification and File Format for Specifying Contingency Definitions and Remedial Actions Schemes
 Record Specification and File Format for Specifying Contingency Definitions and Remedial Actions Schemes Date : October 22, 2013 December 6, 2013 January 21, 2015 August 28, 2015 November 6, 2015, November
Welcome to the topic on Master Data and Documents.
 Welcome to the topic on Master Data and Documents. In this topic, we will look at master data in SAP Business One. After this session you will be able to view a customer record to explain the concept of
BT Analyst Elite 7.0.2. User handbook
 BT Analyst Elite 7.0.2 User handbook Contents Page 1 Introduction 5 2 System requirements 7 3 Installation 8 4 Importing bills 9 5 Import process 10 6 Multiple imports 12 7 OneBillPlus naming conventions
SAMPLE OF THE STUDY MATERIAL PART OF CHAPTER 3. Symmetrical Components & Faults Calculations
 SAMPLE OF THE STUDY MATERIAL PART OF CHAPTER 3 3.0 Introduction Fortescue's work proves that an unbalanced system of 'n' related phasors can be resolved into 'n' systems of balanced phasors called the
Chapter Table & Graph
 Chapter Table & Graph The Table & Graph menu makes it possible to generate numeric tables from functions stored in memory. You can also use multiple functions to generate tables. Since Table & Graph uses
SAS Analyst for Windows Tutorial
 Updated: August 2012 Table of Contents Section 1: Introduction... 3 1.1 About this Document... 3 1.2 Introduction to Version 8 of SAS... 3 Section 2: An Overview of SAS V.8 for Windows... 3 2.1 Navigating
OPTIMAL DISPATCH OF POWER GENERATION SOFTWARE PACKAGE USING MATLAB
 OPTIMAL DISPATCH OF POWER GENERATION SOFTWARE PACKAGE USING MATLAB MUHAMAD FIRDAUS BIN RAMLI UNIVERSITI MALAYSIA PAHANG v ABSTRACT In the reality practical power system, power plants are not at the same
Creating Database Model Diagrams in Microsoft Visio Jeffery S. Horsburgh
 Creating Database Model Diagrams in Microsoft Visio Jeffery S. Horsburgh Visio is a software tool created by Microsoft that contains tools for creating many different types of diagrams. Visio s drawing
Controllable Space Phaser. User Manual
 Controllable Space Phaser User Manual Overview Overview Fazortan is a phasing effect unit with two controlling LFOs. 1 Fazortan graphical interface We can distinguish two sections there: Configuration
DataPA OpenAnalytics End User Training
 DataPA OpenAnalytics End User Training DataPA End User Training Lesson 1 Course Overview DataPA Chapter 1 Course Overview Introduction This course covers the skills required to use DataPA OpenAnalytics
Lab 7.1.9b Introduction to Fluke Protocol Inspector
 Lab 7.1.9b Introduction to Fluke Protocol Inspector DCE SanJose1 S0/0 S0/0 SanJose2 #1 #2 Objective This lab is a tutorial demonstrating how to use the Fluke Networks Protocol Inspector to analyze network
IS 312, Information Systems for Business Database Project in Access
 IS 312, Information Systems for Business Database Project in Access Department of Accounting & Information Systems College of Business & Economics 2010-2015 by David W. Miller, Ph.D. This document created
Reading Management Software. Software Manual. Motivate Your Students to Read More and Better Books!
 Reading Management Software Software Manual Motivate Your Students to Read More and Better Books! Renaissance Learning P. O. Box 8036 Wisconsin Rapids, WI 54495-8036 Phone: (866) 846-7323* Fax: (715) 424-4242
Chapter 2 The Data Table. Chapter Table of Contents
 Chapter 2 The Data Table Chapter Table of Contents Introduction... 21 Bringing in Data... 22 OpeningLocalFiles... 22 OpeningSASFiles... 27 UsingtheQueryWindow... 28 Modifying Tables... 31 Viewing and Editing