Climate and water resources Seasonal update
|
|
|
- Marybeth Richardson
- 7 years ago
- Views:
Transcription
1 Climate and water resources Seasonal update Spring 2016 summary Summer 2017 outlook December 2016 Alex Pezza, Mike Thompson, Mike Harkness and Jon Marks Environmental Science Department For more information, contact the Greater Wellington Regional Council: Wellington PO Box T F Masterton PO Box 41 T F December info@gw.govt.nz
2 DISCLAIMER This report has been prepared by Environmental Science staff of Greater Wellington Regional Council (GWRC) and as such does not constitute Council policy. In preparing this report, the authors have used the best currently available data and have exercised all reasonable skill and care in presenting and interpreting these data. Nevertheless, GWRC does not accept any liability, whether direct, indirect, or consequential, arising out of the provision of the data and associated information within this report. Furthermore, as GWRC endeavours to continuously improve data quality, amendments to data included in, or used in the preparation of, this report may occur without notice at any time. GWRC requests that if excerpts or inferences are drawn from this report for further use, due care should be taken to ensure the appropriate context is preserved and is accurately reflected and referenced in subsequent written or verbal communications. Any use of the data and information enclosed in this report, for example, by inclusion in a subsequent report or media release, should be accompanied by an acknowledgement of the source.
3 Overview Spring 2016 Spring brought a very welcome rainfall recharge into most of the Wellington region. This followed a large scale climatic pattern that caused above average rainfall in most of the country, and our region was one of the wettest spots in New Zealand. November was the wettest month by far, receiving near three times the historical rainfall average and record-breaking daily and monthly totals in several areas including Wellington (Kelburn), which had the highest November and spring rainfall totals since records began in The rainfall distribution was irregular with highly concentrated heavy falls, pressuring our infrastructure and civil defence response during the heaviest episodes. While this irregular nature with possibility of heavy bursts was predicted, the total accumulation far superseded the projections based on the initial climate analogues proposed for central Wairarapa (now revised). A small portion of the north eastern Wairarapa coast however remained drier than average as predicted. Temperatures as a whole were slightly above average and highly variable. In association with the above average rainfall pattern, the Wellington region has also recorded very low sunshine hours, with only about 60% of the theoretical possible number of sunshine hours being observed in some areas such as the Kapiti coast, which had the lowest recorded sunshine hours since 1953 when measurements began. Reason for the heavy rainfall As New Zealand is highly influenced by the oceanic temperatures, the relatively warm waters around the country helped bringing more moisture into the atmosphere through evaporation, thus allowing for heavier rainfall rates. This is a pattern that is also expected to get worse with climate change. The ENSO phenomenon in the Pacific Ocean remains neutral, and the risk of La Niña has now considerably lessened. Most climate projections consistently show continuing neutral ENSO conditions for the next two seasons. This pattern, combined with background global warming with warmer than normal waters to the north and south of New Zealand, should add an interesting mix to the climate behaviour. Climate outlook for summer 2017 Normal to above average temperatures, and around average rainfall. Greater likelihood of extreme weather events, including heavy rainfall alternated by prolonged dry and hot spells. Less reliability of average patterns is expected to worsen due to climate change, effectively reducing the predictability based on climate analogues of the past.
4 Contents Overview Spring 2016 Reason for the heavy rainfall Climate outlook for summer 2017 i i i i 1. Climate drivers El Niño Southern Oscillation (ENSO) Sea ice extent and oceanic temperatures Southern Annular Mode (SAM) 2 2. What is the data showing? Satellite-derived drought stress indices (vegetation health) Soil moisture assessment Regional rainfall Observed rainfall and soil moisture conditions for selected sites Rainfall accumulation for hydrological year (1 June to 31 May) Soil moisture content (1 June to 31 May) Outlook for summer Acknowledgments 19

5 1. Climate drivers 1.1 El Niño Southern Oscillation (ENSO) The ENSO phenomenon is now completely neutral. Figure 1.1 shows the latest predictions suggest a continuing of the neutral phase at least until the end of winter Figure 1.1: ENSO projections until August 2017 show conditions are predicted to be progressively neutral. There are no El Niño or La Niña alerts in place. Source: Australian Bureau of Meteorology. 1.2 Sea ice extent and oceanic temperatures The oceanic temperature anomalies and the total sea ice extent (in white) are shown in Figure 1.2 for 12 th December Sea ice extent is very important to New Zealand because we are relatively close to Antarctica. The ice strengthens the cold fronts that affect New Zealand during the cold season, delaying the effects of global warming. The Antarctic sea ice extent in November was the lowest on record for the entire satellite era starting in This represents a drastic reversal from the increased sea ice extent that had been observed in the Southern Hemisphere so far. For the New Zealand summer, the implication is that the waters in the Southern Ocean near Antarctica are warmer than average for the first time in a long time, possibly suggesting more humid cold fronts from the south. PAGE 1 OF 19

6 Figure 1.2: Sea surface temperature anomalies for 12 th December Source: NOAA. 1.3 Southern Annular Mode (SAM) The SAM is the normal pressure oscillation between mid-latitudes and the Antarctic region. Normally positive SAM is associated with high pressures around the north island of New Zealand, keeping the weather stable and dry/cloud-free, whereas the opposite is expected when the SAM is in the negative phase. Figure 1.3 shows that the SAM was highly negative in November (corridor of low pressure areas indicated by L ), helping explain the abnormal cloud cover and excessive rainfall affecting our region. It is not possible to predict the future behaviour of the SAM at the seasonal scale, unless there is a strong El Niño or La Niña event occurring. PAGE 2 OF 19

7 Figure 1.3: Sea level pressure anomalies for November The negative SAM affecting New Zealand with unstable weather and above average rainfall is shown by the series of troughs depicted by L. Source: NCEP Reanalysis. PAGE 3 OF 19
 for the week ending 8 th December 2016.")
8 2. What is the data showing? 2.1 Satellite-derived drought stress indices (vegetation health) Figure 2.1 shows the satellite-derived vegetation drought-stress index (associated with vegetation health) for the week ending 8 th December As a result of the rainfall recharge in spring most of the region is now stressfree, showing a great improvement compared to the same time last year. It is important to note that the satellite index gives an overview of dryness as felt by the vegetation, compared to normal. As such, this index is not a formal drought assessment as it does not take into account how dry the soil is underneath the surface. Figure 2.1: Satellite-derived Vegetation drought-stress index for the week ending 8 th Dec Drought index scale shows the potential drought risk: 0 (moderate or no stress), 1 (severe stress), 2 (extreme stress), 3 (exceptional stress). The index is relative to a 25 year period base climatology of how healthy (or green) the vegetation is looking. Source: NOAA/USA, resolution 4km. PAGE 4 OF 19

9 2.2 Soil moisture assessment Figure 2.2 shows the latest soil moisture anomaly for the region, as of 6 th December Most of the region s soil moisture is estimated to be around average (i.e., anomalies between -10 and +10 mm). Only small areas along the Wairarapa coast, especially in the far north east, are showing below average soil moisture. Even then, the satellite-derived vegetation drought stress index shown on Figure 2.1 does not suggest an appreciable risk of immediate dryness in those areas as far as the vegetation health is concerned. Figure 2.2: Soil moisture anomaly for 6 th December Moisture levels show a great improvement compared to the same time last year. Below average moisture areas are seen only in small patches along the eastern Wairarapa coast. Source: GWRC, using selected Virtual Climate Station Network (VCSN) data kindly provided by NIWA. Note that this data is indirectly calculated by modelling and interpolation techniques, and does not necessarily reflect the results obtained by direct measurements (compare with section 2.4). This map should only be used for a general indication of the spatial variability. PAGE 5 OF 19
10 2.3 Regional rainfall Figure 2.3 shows the regional spring rainfall expressed as a percentage of the long-term average. Most of the region shows much greater than average rainfall totals, especially in the west, south and in central Wairarapa south of Masterton. A small section of the far north eastern coast was the only area that remained with below average rainfall. The asterisk shows the location of the reference rainfall station (Waikoukou farm) used to produce the climate analogues rainfall projection (see section 3). The farm had about 150% of the rainfall average. Figure 2.3: Rainfall for spring 2016 as a percentage of the long-term average. A large contrast is seen between above average conditions for most of the region and dry conditions in a fairly small sector of the north eastern Wairarapa coast. The asterisk shows the location of the rainfall time series at Waikoukou, Longbush, used for the climate analogues rainfall projection (see Section 3). Source: GWRC. PAGE 6 OF 19

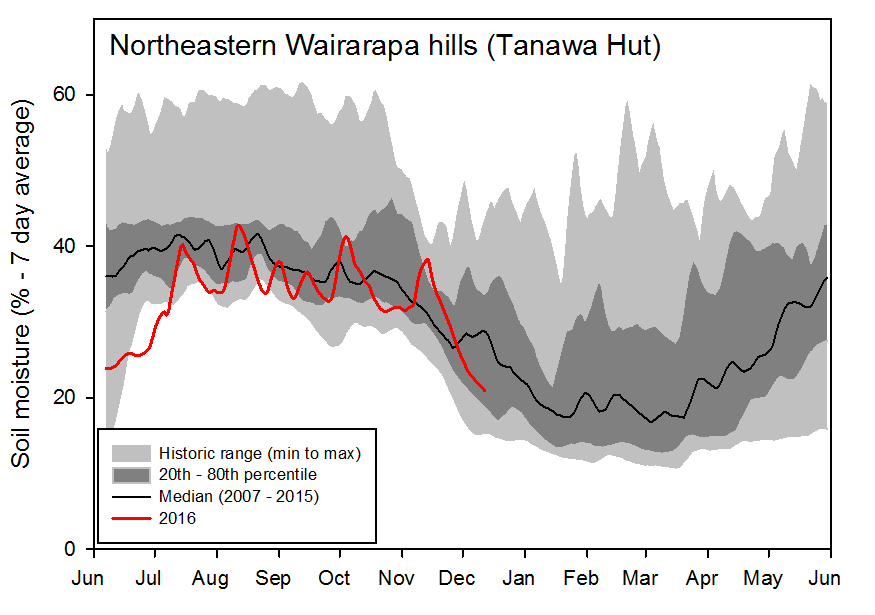
11 2.4 Observed rainfall and soil moisture conditions for selected sites Figure 2.4 shows the location of selected GWRC rainfall and soil moisture monitoring sites. Plots of accumulated rainfall and soil moisture trends are provided in the following pages. Figure 2.4: Map of GWRC rainfall and soil moisture monitoring locations Rainfall accumulation for hydrological year (1 June to 31 May) The following rainfall plots show total rainfall accumulation (mm) for the hydrological year for several years. For comparative purposes, cumulative plots for selected historic years with notably dry summers in the Wairarapa have been included, as well as the site average. Many of the GWRC telemetered rain gauge sites in the lower lying parts of the Wairarapa (i.e., not Tararua Range gauges installed for flood warning purposes) have only been operating since the late 1990s so the period of data presented is somewhat constrained to the past two decades. For each historical record plotted, an indication of ENSO climate state (El Niño, La Niña or neutral) at that time is also given. GWRC does not operate a rain gauge in the southern-most parts of the Wairarapa Valley that is suitable for presenting data in this report. This means that we cannot be confident that the rainfall patterns seen elsewhere extend to this part of the region other than the satellite and VCN data already presented. Overall, accumulations since mid-winter have been well above normal in the western part of the region and the Tararua Range, primarily due to the exceptionally high November rainfall. The benefit of the November rain is also seen in the west and south of the Wairarapa where there has been a recovery to relatively normal accumulations for this time of year after a very dry winter and early spring. Accumulations remain lower than average in northern Wairarapa and especially low farther east (e.g. Tanawa Hut) where the November rain was not exceptional. PAGE 7 OF 19
12 Kapiti Coast Southwest (Wellington city) PAGE 8 OF 19
13 Hutt Valley and Tararua Range PAGE 9 OF 19
14 Wairarapa PAGE 10 OF 19
15 PAGE 11 OF 19
16 PAGE 12 OF 19
 is also provided to give an indication of how the current soil moisture compares with that for a similar time of the season in past")
17 2.4.2 Soil moisture content (1 June to 31 May) The soil moisture plots show seven day rolling average soil moisture (%) for the hydrological year. An envelope plot of the historic range of data (and site mean) is also provided to give an indication of how the current soil moisture compares with that for a similar time of the season in past years. While the soil moisture plots are useful for tracking change within the current season and comparing relative differences between years, they do not provide the absolute moisture content (%) as many of the GWRC soil moisture sites have not yet been fully calibrated. Soil moisture levels in the western part of the region are much higher than normal for this time of year. In fact, data from the Upper Hutt site indicates moisture levels have declined very little since mid-winter and are now at a nearrecord high for this time of year (based on monitoring since 2003). Soils are drier in the Wairarapa, but not outside normal range for this time of year. The benefit of the high November rainfall is evident, especially in southern Wairarapa where late winter soil moisture levels were at a record low and a significant recovery has now occurred. Hutt Valley PAGE 13 OF 19

18 Wairarapa PAGE 14 OF 19

19 PAGE 15 OF 19
20 3. Outlook for summer 2017 ENSO to remain neutral; Warm sea surface temperatures to the north and south of New Zealand increasing the chances of warmer than average, and more atmospheric moisture with heavy rainfall episodes; Variable rainfall, at or above average for some areas but irregular spatial and temporal distribution; Statistical rainfall projection for central Wairarapa: 61 to 227% of average, with 144% most likely (see next page for details) Whaitua * Variables Climate outlook for summer 2017 Wellington Harbour & Hutt Valley Te Awarua-o- Porirua Kāpiti Coast Temperature: Rainfall: Temperature: Rainfall: Temperature: Rainfall: Temperature: Average to above, greater variability of hot and cool temperatures. Around average, long dry periods alternated by heavy rainfall events. Average to above, greater variability of hot and cool temperatures. Around average, long dry periods alternated by heavy rainfall events. Average to above, greater variability of hot and cool temperatures. Around average, long dry periods alternated by heavy rainfall events. Average to above, greater variability of hot and cool temperatures. Possibility of significant hot spells. Ruamāhanga Wairarapa Coast Rainfall: Temperature: Rainfall: Around average, irregular distribution. Long dry periods alternated by heavy rainfall events. Most likely range for the central-eastern area (Longbush) based on climate analogues: 61 to 227% of the average, with 144% most likely see graph below Average to above, greater variability of hot and cool temperatures. Possibility of significant hot spells. Average to below, long dry periods and irregular distribution. Heavy easterly rainfall events possible. *See for whaitua areas PAGE 16 OF 19
21 Statistical rainfall projections for central Wairarapa via climate analogues This is a new, experimental product that gives the likely rainfall range for the coming season based on climate analogues. In this technique, a long and reliable rainfall time series (ideally 100 years of data) is used as a reference to find how much it rained during years in which the ENSO and oceanic temperatures around New Zealand behaved similarly to what is actually happening in the current year. Below we give details of the analogue years used, the area of validity and the previous scores. The analogue years will change from time to time depending on the behaviour of the climate drivers. Likely DJF rainfall range: 61% to 227 % (144% most likely) of the average (see figure 3.1). NOTE: The very large likely interval is due to the mixed climate signal during neutral ENSO conditions. This means that there is LOW confidence in the most likely value. Current analogue years: 1967, 1993, 1994, Area of validity: This projection has been prepared based on long-term rainfall data for Waikoukou (Longbush). The station is strategically located in central-eastern Wairarapa, where rainfall can be regarded as an average of inland conditions (see Figure 2.3 under main body of report). As such, the projected range should be valid for most of the area south of Masterton and eastern of Lake Wairarapa, excluding the coast. Previous Scores: SON predicted: 57% to 94% (75% most likely), using different analogue years that have now been superseded; SON actual observation: 151% of the average. Hence, the observed conditions for JJA fell outside the predicted range using climate analogues. The previous score has failed in part because a transition to weak La Niña was expected at that time, but this did not eventuate. It is very rare to have a strong El Niño followed by a neutral year as currently observed. The current analogue years were chosen based on this rare behaviour. If these years had been chosen for the last spring the most likely range would have been 142% of the average, i.e., very close to the observed rainfall. Note to users: If you have historical rainfall data measured in your property within the area of validity, you can calculate the most likely (actual) rainfall in mm by directly applying the percentage range to your own long-term average. If you live outside the validity area, you can still calculate the average (or ideally the median) and standard deviation of the observed rainfall during previous years using at least four of the seven provided climate analogues, to determine your own likely range for the current season. This projection is a statistical guidance and assumes that previous years rainfall behaviour will more or less repeat, which may not be necessarily true, even less so in light of climate change. Hence, these projections should be used with caution and as PAGE 17 OF 19

22 general guidance of where the climate might be heading. The forecast should be interpreted together with the text discussed in the whaitua tables above. GWRC accepts no responsibility for the accuracy of these forecasts. Figure 3.1: Climate analogue statistical rainfall projection using data for Waikoukou, Longbush (see Figure 2.3 for exact location on the map), expressed as percentage range of likely summer rainfall compared to the average. Due to the large range predicted there is little confidence in the actual most likely value, but the graph shows that there are some reasonable chances of above average rainfall. PAGE 18 OF 19
23 Acknowledgments We would like to thank NIWA for providing selected VCSN data points for the calculation of the regional soil moisture map, and the National Oceanic and Atmospheric Administration (NOAA/USA) for making available the satellite-derived drought indices. PAGE 19 OF 19
IGAD CLIMATE PREDICTION AND APPLICATION CENTRE
 IGAD CLIMATE PREDICTION AND APPLICATION CENTRE CLIMATE WATCH REF: ICPAC/CW/No.32 May 2016 EL NIÑO STATUS OVER EASTERN EQUATORIAL OCEAN REGION AND POTENTIAL IMPACTS OVER THE GREATER HORN OF FRICA DURING
Queensland rainfall past, present and future
 Queensland rainfall past, present and future Historically, Queensland has had a variable climate, and recent weather has reminded us of that fact. After experiencing the longest drought in recorded history,
Climate Extremes Research: Recent Findings and New Direc8ons
 Climate Extremes Research: Recent Findings and New Direc8ons Kenneth Kunkel NOAA Cooperative Institute for Climate and Satellites North Carolina State University and National Climatic Data Center h#p://assessment.globalchange.gov
ENSO Cycle: Recent Evolution, Current Status and Predictions. Update prepared by Climate Prediction Center / NCEP 9 May 2011
 ENSO Cycle: Recent Evolution, Current Status and Predictions Update prepared by Climate Prediction Center / NCEP 9 May 2011 Outline Overview Recent Evolution and Current Conditions Oceanic Niño Index (ONI)
El Niño-Southern Oscillation (ENSO): Review of possible impact on agricultural production in 2014/15 following the increased probability of occurrence
: Review of possible impact on agricultural production in 2014/15 following the increased probability of occurrence") El Niño-Southern Oscillation (ENSO): Review of possible impact on agricultural production in 2014/15 following the increased probability of occurrence EL NIÑO Definition and historical episodes El Niño
El Niño-Southern Oscillation (ENSO): Review of possible impact on agricultural production in 2014/15 following the increased probability of occurrence EL NIÑO Definition and historical episodes El Niño
UK Flooding April to July
 UK Flooding April to July Prepared by JBA Risk Management Limited and Met Office July JBA Risk Management Limited Met Office www.jbarisk.com www.metoffice.gov.uk Overview After a very dry start to the
Temporal variation in snow cover over sea ice in Antarctica using AMSR-E data product
 Temporal variation in snow cover over sea ice in Antarctica using AMSR-E data product Michael J. Lewis Ph.D. Student, Department of Earth and Environmental Science University of Texas at San Antonio ABSTRACT
ENSO: Recent Evolution, Current Status and Predictions. Update prepared by: Climate Prediction Center / NCEP 29 June 2015
 ENSO: Recent Evolution, Current Status and Predictions Update prepared by: Climate Prediction Center / NCEP 29 June 2015 Outline Summary Recent Evolution and Current Conditions Oceanic Niño Index (ONI)
South Africa. General Climate. UNDP Climate Change Country Profiles. A. Karmalkar 1, C. McSweeney 1, M. New 1,2 and G. Lizcano 1
 UNDP Climate Change Country Profiles South Africa A. Karmalkar 1, C. McSweeney 1, M. New 1,2 and G. Lizcano 1 1. School of Geography and Environment, University of Oxford. 2. Tyndall Centre for Climate
2. The map below shows high-pressure and low-pressure weather systems in the United States.
 1. Which weather instrument has most improved the accuracy of weather forecasts over the past 40 years? 1) thermometer 3) weather satellite 2) sling psychrometer 4) weather balloon 6. Wind velocity is
Jessica Blunden, Ph.D., Scientist, ERT Inc., Climate Monitoring Branch, NOAA s National Climatic Data Center
 Kathryn Sullivan, Ph.D, Acting Under Secretary of Commerce for Oceans and Atmosphere and NOAA Administrator Thomas R. Karl, L.H.D., Director,, and Chair of the Subcommittee on Global Change Research Jessica
Monsoon Variability and Extreme Weather Events
 Monsoon Variability and Extreme Weather Events M Rajeevan National Climate Centre India Meteorological Department Pune 411 005 rajeevan@imdpune.gov.in Outline of the presentation Monsoon rainfall Variability
2008 Global Surface Temperature in GISS Analysis
 2008 Global Surface Temperature in GISS Analysis James Hansen, Makiko Sato, Reto Ruedy, Ken Lo Calendar year 2008 was the coolest year since 2000, according to the Goddard Institute for Space Studies analysis
2013 Annual Climate Summary for the Southeast United States
 Months of heavy rain forced the U.S. Army Corp of Engineers to open the spillways at Lake Hartwell, located at the headwaters of the Savannah River along the South Carolina-Georgia border, on July 9,.
Armenian State Hydrometeorological and Monitoring Service
 Armenian State Hydrometeorological and Monitoring Service Offenbach 1 Armenia: IN BRIEF Armenia is located in Southern Caucasus region, bordering with Iran, Azerbaijan, Georgia and Turkey. The total territory
Basic Climatological Station Metadata Current status. Metadata compiled: 30 JAN 2008. Synoptic Network, Reference Climate Stations
 Station: CAPE OTWAY LIGHTHOUSE Bureau of Meteorology station number: Bureau of Meteorology district name: West Coast State: VIC World Meteorological Organization number: Identification: YCTY Basic Climatological
The IPCC Special Report on Managing the Risks of Extreme Events and Disasters to Advance Climate Change Adaptation
 The IPCC Special Report on Managing the Risks of Extreme Events and Disasters to Advance Climate Change Adaptation A changing climate leads to changes in extreme weather and climate events 2 How do changes
The Pennsylvania Observer
 The Pennsylvania Observer August 3, 2009 July 2009 - Pennsylvania Weather Recap Written by: Dan DePodwin After a cool month of June, some hoped July would bring usual summertime warmth to the state of
RaysWeather.Com 2015-2016 Winter Fearless Forecast
 Author: Dr. Ray Russell Founder and President of RaysWeather.Com Date: October 10, 2015 RaysWeather.Com 2015-2016 Winter Fearless Forecast Background It's that time of year--leaves change, temperatures
MIAMI-SOUTH FLORIDA National Weather Service Forecast Office http://www.weather.gov/miami
 MIAMI-SOUTH FLORIDA National Weather Service Forecast Office http://www.weather.gov/miami November 2014 Weather Summary Cooler and Drier than Normal December 1, 2014: Cooler than normal temperatures was
James Hansen, Reto Ruedy, Makiko Sato, Ken Lo
 If It s That Warm, How Come It s So Damned Cold? James Hansen, Reto Ruedy, Makiko Sato, Ken Lo The past year, 2009, tied as the second warmest year in the 130 years of global instrumental temperature records,
AIR TEMPERATURE IN THE CANADIAN ARCTIC IN THE MID NINETEENTH CENTURY BASED ON DATA FROM EXPEDITIONS
 PRACE GEOGRAFICZNE, zeszyt 107 Instytut Geografii UJ Kraków 2000 Rajmund Przybylak AIR TEMPERATURE IN THE CANADIAN ARCTIC IN THE MID NINETEENTH CENTURY BASED ON DATA FROM EXPEDITIONS Abstract: The paper
climate science A SHORT GUIDE TO This is a short summary of a detailed discussion of climate change science.
 A SHORT GUIDE TO climate science This is a short summary of a detailed discussion of climate change science. For more information and to view the full report, visit royalsociety.org/policy/climate-change
6. Base your answer to the following question on the graph below, which shows the average monthly temperature of two cities A and B.
 1. Which single factor generally has the greatest effect on the climate of an area on the Earth's surface? 1) the distance from the Equator 2) the extent of vegetative cover 3) the degrees of longitude
The 2015-2016 El Niño event: expected impact on food security and main response scenarios in East and Southern Africa
 The 2015-2016 El Niño event: expected impact on food security and main response scenarios in East and Southern Africa Update 27 th October 2015 Felix Rembold, Olivier Leo, Thierry Nègre, Neil Hubbard 2015
What Causes Climate? Use Target Reading Skills
 Climate and Climate Change Name Date Class Climate and Climate Change Guided Reading and Study What Causes Climate? This section describes factors that determine climate, or the average weather conditions
WEATHER AND CLIMATE WHY DOES IT MATTER?
 WEATHER AND CLIMATE Rising global average temperature is associated with widespread changes in weather patterns. Scientific studies indicate that extreme weather events such as heat waves and large storms
El Niño 1997-1998 in the Midwest a
 Data/Case Study 2-1 El Niño 1997-1998 in the Midwest a by Stanley A. Changnon, Steven D. Hilberg, and Kenneth E. Kunkel Atmospheric Environment Section Illinois State Water Survey A Division of the Illinois
CLIMATE, WATER & LIVING PATTERNS THINGS
 CLIMATE, WATER & LIVING PATTERNS NAME THE SIX MAJOR CLIMATE REGIONS DESCRIBE EACH CLIMATE REGION TELL THE FIVE FACTORS THAT AFFECT CLIMATE EXPLAIN HOW THOSE FACTORS AFFECT CLIMATE DESCRIBE HOW CLIMATES
ENVIRONMENTAL STRUCTURE AND FUNCTION: CLIMATE SYSTEM Vol. II - Low-Latitude Climate Zones and Climate Types - E.I. Khlebnikova
 LOW-LATITUDE CLIMATE ZONES AND CLIMATE TYPES E.I. Khlebnikova Main Geophysical Observatory, St. Petersburg, Russia Keywords: equatorial continental climate, ITCZ, subequatorial continental (equatorial
Climate of Illinois Narrative Jim Angel, state climatologist. Introduction. Climatic controls
 Climate of Illinois Narrative Jim Angel, state climatologist Introduction Illinois lies midway between the Continental Divide and the Atlantic Ocean, and the state's southern tip is 500 miles north of
Research Commodities El Niño returns grains and soft commodities at risk
 Investment Research General Market Conditions 20 May 2015 Research Commodities El Niño returns grains and soft commodities at risk Meteorologists now agree that El Niño has arrived and project that it
Great Plains and Midwest Climate Outlook 19 March 2015
 Great Plains and Midwest Climate Outlook 19 March 2015 Wendy Ryan Assistant State Climatologist Colorado State University wendy.ryan@colostate.edu Grass fire in SE Nebraska 13 March 2015 General Information
Scholar: Elaina R. Barta. NOAA Mission Goal: Climate Adaptation and Mitigation
 Development of Data Visualization Tools in Support of Quality Control of Temperature Variability in the Equatorial Pacific Observed by the Tropical Atmosphere Ocean Data Buoy Array Abstract Scholar: Elaina
Southern Africa The 2014-2015 Rainfall Season
 Southern Africa The 2014-2015 Rainfall Season HIGHLIGHTS In the early stages (October-November) of the 2014-2015 growing season in Southern Africa significant rainfall deficits and delayed starts to the
How To Predict Climate Change In Tonga
 Niuatoputapu Niuafo'ou Late Island Vava u Group South Pacific Ocean Tofua Island Kotu Group Nomuka Group Ha apai Group NUKU ALOFA Eua Island Tongatapu Group Current and future climate of Tonga > Tonga
Managing Extreme Weather at Transport for London. ARCC Assembly - 12 June 2014 Helen Woolston, Transport for London Sustainability Coordinator
 Managing Extreme Weather at Transport for London ARCC Assembly - 12 June 2014 Helen Woolston, Transport for London Sustainability Coordinator Slide list (wont show) Long Term Climate Change 1. What TfL
The Caribbean Drought and Precipitation Monitoring Network: The Concept and its Progress
 The Caribbean Drought and Precipitation Monitoring Network: The Concept and its Progress Adrian R. Trotman Caribbean Institute for Meteorology and Hydrology Inter-regional Workshop on Indices and Early
Guy Carpenter Asia-Pacific Climate Impact Centre, School of energy and Environment, City University of Hong Kong
 Diurnal and Semi-diurnal Variations of Rainfall in Southeast China Judy Huang and Johnny Chan Guy Carpenter Asia-Pacific Climate Impact Centre School of Energy and Environment City University of Hong Kong
7613-1 - Page 1. Weather Unit Exam Pre-Test Questions
 Weather Unit Exam Pre-Test Questions 7613-1 - Page 1 Name: 1) Equal quantities of water are placed in four uncovered containers with different shapes and left on a table at room temperature. From which
MIAMI-SOUTH FLORIDA National Weather Service Forecast Office http://www.weather.gov/miami
 MIAMI-SOUTH FLORIDA National Weather Service Forecast Office http://www.weather.gov/miami January Summary: Warm and Dry Winter Rolls On February 1, 2013: South Florida s warm and dry winter pattern of
Standardized Runoff Index (SRI)
") Standardized Runoff Index (SRI) Adolfo Mérida Abril Javier Gras Treviño Contents 1. About the SRI SRI in the world Methodology 2. Comments made in Athens on SRI factsheet 3. Last modifications of the factsheet
Standardized Runoff Index (SRI) Adolfo Mérida Abril Javier Gras Treviño Contents 1. About the SRI SRI in the world Methodology 2. Comments made in Athens on SRI factsheet 3. Last modifications of the factsheet
A simple scaling approach to produce climate scenarios of local precipitation extremes for the Netherlands
 Supplementary Material to A simple scaling approach to produce climate scenarios of local precipitation extremes for the Netherlands G. Lenderink and J. Attema Extreme precipitation during 26/27 th August
How Do Oceans Affect Weather and Climate?
 How Do Oceans Affect Weather and Climate? In Learning Set 2, you explored how water heats up more slowly than land and also cools off more slowly than land. Weather is caused by events in the atmosphere.
FLOOD FORECASTING PRACTICE IN NORTHERN CALIFORNIA
 FLOOD FORECASTING PRACTICE IN NORTHERN CALIFORNIA California Department of Water Resources Post Office Box 219000, Sacramento, California 95821 9000 USA By Maurice Roos, Chief Hydrologist ABSTRACT Although
Southern AER Atmospheric Education Resource
 Southern AER Atmospheric Education Resource Vol. 9 No. 5 Spring 2003 Editor: Lauren Bell In this issue: g Climate Creations exploring mother nature s remote control for weather and Climate. g Crazy Climate
CLIMATE OF RWANDA. Overview. Linked to other lessons
 Geography S6 GENERAL PHYSICAL GEOGRAPHY OF RWANDA Lesson 75 Developed by (Niwagaba Innocent) Subtopic Climate and factors influencing it in Rwanda Specific Objectives The learners must be able to: Describe
The Climate of Oregon Climate Zone 2 Willamette Valley
 /05 E-55 No. ci oi Unbound issue e2_, Does not circulate Special Report 914 May 1993 The Climate of Oregon Climate Zone 2 Property of OREGON STATE UNIVERSITY Library Serials Corvallis, OR 97331-4503 Agricultural
Climate Change Impacts & Risk Management
 Climate Change Impacts & Risk Management WA FACILITIES & INFRASTRUCTURE THE ENGINEER S ROLE Alan Carmody, Alberfield Energy, Environment, Risk www.alberfield.com.au Climate Change Risk Management Tools
Climate Change and Infrastructure Planning Ahead
 Climate Change and Infrastructure Planning Ahead Climate Change and Infrastructure Planning Ahead Infrastructure the physical facilities that support our society, such as buildings, roads, railways, ports
MIAMI-SOUTH FLORIDA National Weather Service Forecast Office http://www.weather.gov/miami
 MIAMI-SOUTH FLORIDA National Weather Service Forecast Office http://www.weather.gov/miami Summer 2015 Weather Summary Wet West and Dry East September 2, 2015: One of the most variable summers in recent
Genesis Energy s customer focused strategy is delivering on business performance
 Genesis Energy s customer focused strategy is delivering on business performance INTRODUCTION This disclosure includes market and operational information for Genesis Power Limited, trading as Genesis Energy,
Climate Change on the Prairie:
 Climate Change on the Prairie: A Basic Guide to Climate Change in the High Plains Region - UPDATE Global Climate Change Why does the climate change? The Earth s climate has changed throughout history and
Precipitation Monitoring Network:
 The Caribbean Drought and Precipitation Monitoring Network: Adrian R. Trotman Caribbean Institute for Meteorology and Hydrology CARIWIN Regional Seminar 14-15 January, 2010 Georgetown, Guyana Why Plan
Heavy Rainfall from Hurricane Connie August 1955 By Michael Kozar and Richard Grumm National Weather Service, State College, PA 16803
 Heavy Rainfall from Hurricane Connie August 1955 By Michael Kozar and Richard Grumm National Weather Service, State College, PA 16803 1. Introduction Hurricane Connie became the first hurricane of the
July 2016. Issued: August 6, 2016 Since : August 1980* Volume 37 : Issue 07
 FIJI METEOROLOGICAL SERVICE Private Mail Bag (NAP351) Nadi Airport, Fiji Ph: +679 6724888, Fax: +679 67245 Email: climate@met.gov.fj Also online at http:// www.met.gov.fj Fiji Climate Summary July 216
Christmas. National Meteorological Library and Archive Fact sheet 5 White Christmas. (version 01)
") Christmas National Meteorological Library and Archive Fact sheet 5 White Christmas (version 01) The National Meteorological Library and Archive Many people have an interest in the weather and the processes
Christmas National Meteorological Library and Archive Fact sheet 5 White Christmas (version 01) The National Meteorological Library and Archive Many people have an interest in the weather and the processes
Development of an Integrated Data Product for Hawaii Climate
 Development of an Integrated Data Product for Hawaii Climate Jan Hafner, Shang-Ping Xie (PI)(IPRC/SOEST U. of Hawaii) Yi-Leng Chen (Co-I) (Meteorology Dept. Univ. of Hawaii) contribution Georgette Holmes
Pasture, Rangeland, and Forage Insurance: A Risk Management Tool for Hay and Livestock Producers
 October 2012 Pasture, Rangeland, and Forage Insurance: A Risk Management Tool for Hay and Livestock Producers Monte Vandeveer, Otoe County Extension Educator University of Nebraska-Lincoln Institute of
Projections, Predictions, or Trends?
 Projections, Predictions, or Trends? The challenges of projecting changes to fire regimes under climate change Bec Harris 9-11 th October, 2013 What are we looking for? Aims differ, and are more or less
BASIC APPROACH TO CLIMATE MONITORING PRODUCTS AND CLIMATE MONITORING PRODUCTS IN WMO RA VI
 BASIC APPROACH TO CLIMATE MONITORING PRODUCTS AND CLIMATE MONITORING PRODUCTS IN WMO RA VI Mesut DEMIRCAN Geodesy and Photogrametry Engineer Turkish State Meteorological Service Agrometeorology and Climatological
2015 Climate Review for Puerto Rico and the U.S. Virgin Islands. Odalys Martínez-Sánchez
 2015 Climate Review for Puerto Rico and the U.S. Virgin Islands. Odalys Martínez-Sánchez 2015 can be described as a dry and hot year across Puerto Rico (PR) and the U.S. Virgin Islands (USVI). Below normal
8.5 Comparing Canadian Climates (Lab)
") These 3 climate graphs and tables of data show average temperatures and precipitation for each month in Victoria, Winnipeg and Whitehorse: Figure 1.1 Month J F M A M J J A S O N D Year Precipitation 139
These 3 climate graphs and tables of data show average temperatures and precipitation for each month in Victoria, Winnipeg and Whitehorse: Figure 1.1 Month J F M A M J J A S O N D Year Precipitation 139
Name Period 4 th Six Weeks Notes 2015 Weather
 Name Period 4 th Six Weeks Notes 2015 Weather Radiation Convection Currents Winds Jet Streams Energy from the Sun reaches Earth as electromagnetic waves This energy fuels all life on Earth including the
WEATHER AND CLIMATE practice test
 WEATHER AND CLIMATE practice test Multiple Choice Identify the choice that best completes the statement or answers the question. 1. What role does runoff play in the water cycle? a. It is the process in
Mixing Heights & Smoke Dispersion. Casey Sullivan Meteorologist/Forecaster National Weather Service Chicago
 Mixing Heights & Smoke Dispersion Casey Sullivan Meteorologist/Forecaster National Weather Service Chicago Brief Introduction Fire Weather Program Manager Liaison between the NWS Chicago office and local
Storms Short Study Guide
 Name: Class: Date: Storms Short Study Guide Multiple Choice Identify the letter of the choice that best completes the statement or answers the question. 1. A(n) thunderstorm forms because of unequal heating
Coffee prices fall but Brazilian production estimated lower
 Coffee prices fall but production estimated lower Coffee prices continued their decline as speculation over the current 2015/16 crop suggests that the market has no immediate supply concerns. Indeed, one
Empirical study of the temporal variation of a tropical surface temperature on hourly time integration
 Global Advanced Research Journal of Physical and Applied Sciences Vol. 4 (1) pp. 051-056, September, 2015 Available online http://www.garj.org/garjpas/index.htm Copyright 2015 Global Advanced Research
Geography affects climate.
 KEY CONCEPT Climate is a long-term weather pattern. BEFORE, you learned The Sun s energy heats Earth s surface unevenly The atmosphere s temperature changes with altitude Oceans affect wind flow NOW, you
Emergency Management Service. early warning FLOOD AND FIRE ALERTS. Space
 Emergency Management Service early warning FLOOD AND FIRE ALERTS Space 1 Copernicus at a Glance Copernicus is the European Union s Earth Observation programme: a user-driven space programme under civil
City of Salinas Flood Response Preparations
 City of Salinas Flood Response Preparations Winter Preparations Goals for 2015/2016 Community Preparedness in the event of flooding Media cooperation on safety and preparedness, public information sharing
There is a handout with the highlights of this talk and it will be posted on the San Angelo website.
 Pasture Range & Forage Insurance is a very good product because of the subsidies provided by USDA Risk Management Agency. These subsidies should offset any of the complaints that I have heard about the
Texas Department of Public Safety Texas Division of Emergency Management. Texas State Operations Center
 Texas Department of Public Safety Texas Division of Emergency Management Texas State Operations Center Situation Awareness Brief Saturday, July 20 th 2013 As of 0900 CDT Tropical Weather Outlook For the
[ Climate Data Collection and Forecasting Element ] An Advanced Monitoring Network In Support of the FloodER Program
![[ Climate Data Collection and Forecasting Element ] An Advanced Monitoring Network In Support of the FloodER Program](/thumbs/33/16326315.jpg "[ Climate Data Collection and Forecasting Element ] An Advanced Monitoring Network In Support of the FloodER Program") [ Climate Data Collection and Forecasting Element ] An Advanced Monitoring Network In Support of the FloodER Program December 2010 1 Introduction Extreme precipitation and the resulting flooding events
[ Climate Data Collection and Forecasting Element ] An Advanced Monitoring Network In Support of the FloodER Program December 2010 1 Introduction Extreme precipitation and the resulting flooding events
Chapter 3: Climate and Climate Change Answers
 Chapter 3: Climate and Climate Change Answers Section A: Climate 1. (a) Explain what each of the following means: (4 x 1 mark) (i) climate the average weather of an area over a 25 30 year period (ii) maritime
DFID Economic impacts of climate change: Kenya, Rwanda, Burundi Oxford Office. Climate report Rwanda October 2009
 1 Rwanda Rwanda is a landlocked country which lies within latitudes 1-3 S and longitudes 28-31 E and bordered by Uganda in the north and Tanzania in east while in the south and west are Burundi and the
Canadian Prairie growing season precipitation variability and associated atmospheric circulation
 CLIMATE RESEARCH Vol. 11: 191 208, 1999 Published April 28 Clim Res Canadian Prairie growing season precipitation variability and associated atmospheric circulation B. R. Bonsal*, X. Zhang, W. D. Hogg
HIGH RESOLUTION SATELLITE IMAGERY OF THE NEW ZEALAND AREA: A VIEW OF LEE WAVES*
 Weather and Climate (1982) 2: 23-29 23 HIGH RESOLUTION SATELLITE IMAGERY OF THE NEW ZEALAND AREA: A VIEW OF LEE WAVES* C. G. Revell New Zealand Meteorological Service, Wellington ABSTRACT Examples of cloud
1. Incredible India. Shade the map on the next page, to show India s relief. The correct shading is shown on the final page! Incredible India India
 1. Incredible India Shade the map on the next page, to show India s relief. The correct shading is shown on the final page! Incredible India India The DCSF supported Action plan for Geography is delivered
Long term cloud cover trends over the U.S. from ground based data and satellite products
 Long term cloud cover trends over the U.S. from ground based data and satellite products Hye Lim Yoo 12 Melissa Free 1, Bomin Sun 34 1 NOAA Air Resources Laboratory, College Park, MD, USA 2 Cooperative
List 10 different words to describe the weather in the box, below.
 Weather and Climate Lesson 1 Web Quest: What is the Weather? List 10 different words to describe the weather in the box, below. How do we measure the weather? Use this web link to help you: http://www.bbc.co.uk/weather/weatherwise/activities/weatherstation/
Drought in the Czech Republic in 2015 A preliminary summary
 Drought in the Czech Republic in 2015 A preliminary summary October 2015, Prague DISCLAIMER All data used in this preliminary report are operational and might be a subject of change during quality control.
WEATHER, CLIMATE AND ADAPTATIONS OF ANIMALS TO CLIMATE
 7 WEATHER, CLIMATE AND ADAPTATIONS OF ANIMALS TO CLIMATE TEXTBOOK QUESTIONS AND ANSWERS Q.1. Why weather changes so frequently? Ans. All changes in the weather are caused by the sun. The movement of the
sample The IPCC Special Report on Managing the Risks of Extreme Events and Disasters to Advance Climate Change Adaptation
 sample The IPCC Special Report on Managing the Risks of Extreme Events and Disasters to Advance Climate Change Adaptation A changing climate leads to changes in extreme weather and climate events 2 Impacts
Grade 4 Standard 1 Unit Test Water Cycle. Multiple Choice. 1. Where is most water found on Earth? A. in glaciers B. in lakes C. in rivers D.
 Grade 4 Standard 1 Unit Test Water Cycle Multiple Choice 1. Where is most water found on Earth? A. in glaciers B. in lakes C. in rivers D. in oceans 2. What source of energy evaporates the most water from
Antecedent Conditions:
 Antecedent Conditions: Record to Near Record Heat occurred across Northeast & North Central Colorado September 2-8. A cold front moved across Northeast Colorado the morning of the 9 th, and deeper subtropical
Seasonal & Daily Temperatures. Seasons & Sun's Distance. Solstice & Equinox. Seasons & Solar Intensity
 Seasonal & Daily Temperatures Seasons & Sun's Distance The role of Earth's tilt, revolution, & rotation in causing spatial, seasonal, & daily temperature variations Please read Chapter 3 in Ahrens Figure
Arizona Climate Summary February 2015 Summary of conditions for January 2015
 Arizona Climate Summary February 2015 Summary of conditions for January 2015 January 2015 Temperature and Precipitation Summary January 1 st 14 th : January started off with a very strong low pressure
YEAR 1: Seasons and Weather
 YEAR 1: Seasons and Weather Contents Include: The four seasons Tools to record the weather Making graphs Clouds Weather forecasts Weather around the world Please Note: The activities included in this pack
Examining the Recent Pause in Global Warming
 Examining the Recent Pause in Global Warming Global surface temperatures have warmed more slowly over the past decade than previously expected. The media has seized this warming pause in recent weeks,
Global Seasonal Phase Lag between Solar Heating and Surface Temperature
 Global Seasonal Phase Lag between Solar Heating and Surface Temperature Summer REU Program Professor Tom Witten By Abstract There is a seasonal phase lag between solar heating from the sun and the surface
The Polar Climate Zones
 The Polar Climate Zones How cold is it in the polar climate? Polar areas are the coldest of all the major climate zones The Sun is hardly ever high enough in the sky to cause the plentiful ice to melt,
Climate, Vegetation, and Landforms
 Climate, Vegetation, and Landforms Definitions Climate is the average weather of a place over many years Geographers discuss five broad types of climates Moderate, dry, tropical, continental, polar Vegetation:
Climate Change in North Carolina
 Climate Change in North Carolina Dr. Chip Konrad Director of the The Southeast Regional Climate Center Associate Professor Department of Geography University of North Carolina at Chapel Hill The Southeast
REGIONAL CLIMATE AND DOWNSCALING
 REGIONAL CLIMATE AND DOWNSCALING Regional Climate Modelling at the Hungarian Meteorological Service ANDRÁS HORÁNYI (horanyi( horanyi.a@.a@met.hu) Special thanks: : Gabriella Csima,, Péter Szabó, Gabriella
CropCast Daily Agri-Highlights Don Keeney Wednesday, June 22, 2016
 VHI Image Date: Jun 17, 2016 USA Corn Soybeans Vegetative Health Index Map and Crop Condition Tendency EUROPE Rapeseed BLACK SEA INDIA Soybeans Groundnuts CHINA Corn Soybeans ARGENTINA Corn Soybeans BRAZIL
Climate and Weather. This document explains where we obtain weather and climate data and how we incorporate it into metrics:
 OVERVIEW Climate and Weather The climate of the area where your property is located and the annual fluctuations you experience in weather conditions can affect how much energy you need to operate your
Application of Numerical Weather Prediction Models for Drought Monitoring. Gregor Gregorič Jožef Roškar Environmental Agency of Slovenia
 Application of Numerical Weather Prediction Models for Drought Monitoring Gregor Gregorič Jožef Roškar Environmental Agency of Slovenia Contents 1. Introduction 2. Numerical Weather Prediction Models -