ICA-based artifact removal in EEG
|
|
|
- Duane Bradford
- 9 years ago
- Views:
Transcription
1 ICA-based artifact removal in EEG John J.B. Allen Würzburg Workshop, 26 June, 2015


2 ICA-based artifact removal in EEG John J.B. Allen Würzburg Workshop, 26 June, 2015
3 Clinical vs Actuarial Approaches Dawes, R.M., Faust, D., & Meehl, P.E.(1989). Science, 243,
4 Clinical vs Actuarial Approaches Human raters Good source of possible algorithms Lousy at reliably implementing them Inter-rater Intra-rater Actuarial methods Always arrive at the same conclusion Weight variables according to actual predictive power Dawes, R.M., Faust, D., & Meehl, P.E.(1989). Science, 243,
5 Algorithmic EEG Artifact Approaches Amplitude criteria Too sudden: 100uV between samples Activity criteria Too big: 250uV/2sec epoch Too small: <0.5 uv range across 100ms Regression-based EOG correction Can we make ICA-based correction algorithmic?

6 What is ICA? ICA is a "blind source separation" technique. ICA separates sources of activity that are mixed together at recording electrodes.
7 For EEG data What is ICA? Channel data (X) can be thought of as a weighted (W) combination of independent component activations (Wx), each of which has a scalp projection (W -1 ). You can think of ICs as putative sources of the scalp-recorded EEG.
8
9
10

11
12 Chaumon et al., 2015

13 Chaumon et al., 2015

14 Chaumon et al., 2015

15 Chaumon et al., 2015

16 Chaumon et al., 2015

17 Chaumon et al., 2015

18 Chaumon et al., 2015

19 Chaumon et al., 2015

20 Chaumon et al., 2015

21 Rare Events Chaumon et al., 2015

22 What is ADJUST? ADJUST= Automatic EEG artifact Detection based on the Joint Use of Spatial and Temporal features Automatic ICA-based algorithm that identifies artifact-related IC components Uses both spatial and temporal distributions Combines stereotyped features to efficiently and systematically reject an artifact Mognon, Jovicich, Bruzzone, & Buiatti, 2010
23 How does it work? EEG is decomposed into ICs (done in EEGlab) ICs defined only by statistical relationships. It knows nothing about where electrodes are Detectors are applied for 4 types of artifacts Computes class-specific spatial and temporal features on all ICs Each feature has a threshold dividing artifacts from non-artifacts For each detector, ICs identified as artifacts if features associated with the artifact exceed their respective threshold. Mognon, Jovicich, Bruzzone, & Buiatti, 2010
24 Features Spatial Average Difference (SAD) Temporal Kurtosis (TK) Maximum Epoch Variance (MEV) Spatial Eye Difference (SED) Generic Discontinuities Spatial Feature (GDSF)
25 MARA: Six features derived from machine learning algorithm 1. Current Density Norm: ICA scalp maps can be interpreted as EEG potentials for which the location of the sources can be estimated. It is natural that artifactual signals originating outside the brain can only be modeled by rather complicated sources. Those are characterized by a large l2-norm, which MARA uses as a feature. 2. Range Within Pattern: The logarithm of the difference between the minimal and the maximal activation in a scalp map. Spatially localized scalp maps stemming from e.g muscle artifacts or loose electrodes are typically characterized by a high Range Within Pattern. 3. Mean Local Skewness: The mean absolute local skewness of time intervals of 15s duration. This feature aims to detect outliers in the time series. 4. λ and Fit Error: These two features describe the deviation of a component s spectrum from a prototypical 1/f curve and its shape Hz: The average log band power of the α band (8 13Hz). This feature aims to detect the typical α peak in components of neural origin. Winkler et al., 2011
26 Pre-Processing Steps for ICA Artifact Rejection 1. A rough pre-cleaning of the data by e.g. channel rejection and trial rejection may be performed. This step is usually helpful for obtaining a good ICA decomposition. 2. Filter: As ICA decomposition is known to be sensitive to slow drifts, high pass filtering the data (at 0.5 Hz or even 2 Hz) can sometimes improve the quality of the decomposition. Note that MARA might lead to suboptimal results on narrow band-passed filtered data, because its spectrum features are calculated on the power spectrum between 2 Hz and 39 Hz. 3. Run ICA! Tools>Run ICA calculates ICA decomposition: The option pca can be set to perform a dimensionaliy reduction prior to IC computation. Such a step may be helpful, in order to reduces the noise level and avoid an unnatural splitting of sources. (It also makes IC computation faster and reduces and the number of components that have to be labeled.) Winkler et al., 2011

27
28 The following slides were not used, but may be helpful, and derive from Laura Zambrano-Vazquez s talk about ADJUST
 Kurtosis over the IC time course Kurtosis is \"peakedness\" of the distribution (i.e. distribution of timepoints in the epoch) Looks for outliers in amplitude distribution typical of blinks Mognon, Jovicich, Bruzzone, & Buiatti, 2010")
29 Features Spatial Average Difference (SAD) Spatial topography of blink ICs Looks for higher amplitude in frontal vs. posterior areas Temporal Kurtosis (TK) Kurtosis over the IC time course Kurtosis is "peakedness" of the distribution (i.e. distribution of timepoints in the epoch) Looks for outliers in amplitude distribution typical of blinks Mognon, Jovicich, Bruzzone, & Buiatti, 2010
 Looks for large amplitudes in frontal areas in antiphase typical of horizontal eye movement Generic Discontinuities Spatial Feature (GDSF) Looks for local spatial")
30 Features Maximum Epoch Variance (MEV) Is a ratio of variance in epoch with most variance compared to mean variance over all epochs Looks for slower fluctuations typical of vertical eye movement Spatial Eye Difference (SED) Looks for large amplitudes in frontal areas in antiphase typical of horizontal eye movement Generic Discontinuities Spatial Feature (GDSF) Looks for local spatial discontinuities Mognon, Jovicich, Bruzzone, & Buiatti, 2010
31 Where to begin? Pre-processing Clean file for non-stereotyped gross artifacts AKA Muscle activity and other external factors Variable spatial distribution that could take up a lot of ICs Low-Pass filtering, if appropriate for your data, can remove some artifacts and prevent so many ICs from capturing these higherfrequency noise artifacts ICA From EEGlab or, if not performed already, can be called from ADJUST Run ICA d files with ADJUST Import dataset into EEGLab Tools ADJUST Use script and select file OR
32


33 Component Head Maps # of channels in EEG data = # of components Typically more true components than channels Multiple true components combined into a single ICA component We have 64 components because we had 64 channels ADJUST will highlight in red the components it identified as artifacts


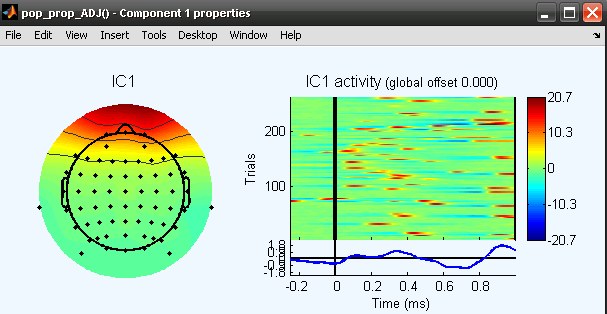
34 Looking at an individual IC Head map IC activity plotted against trial Activity power spectrum Features and thresholds


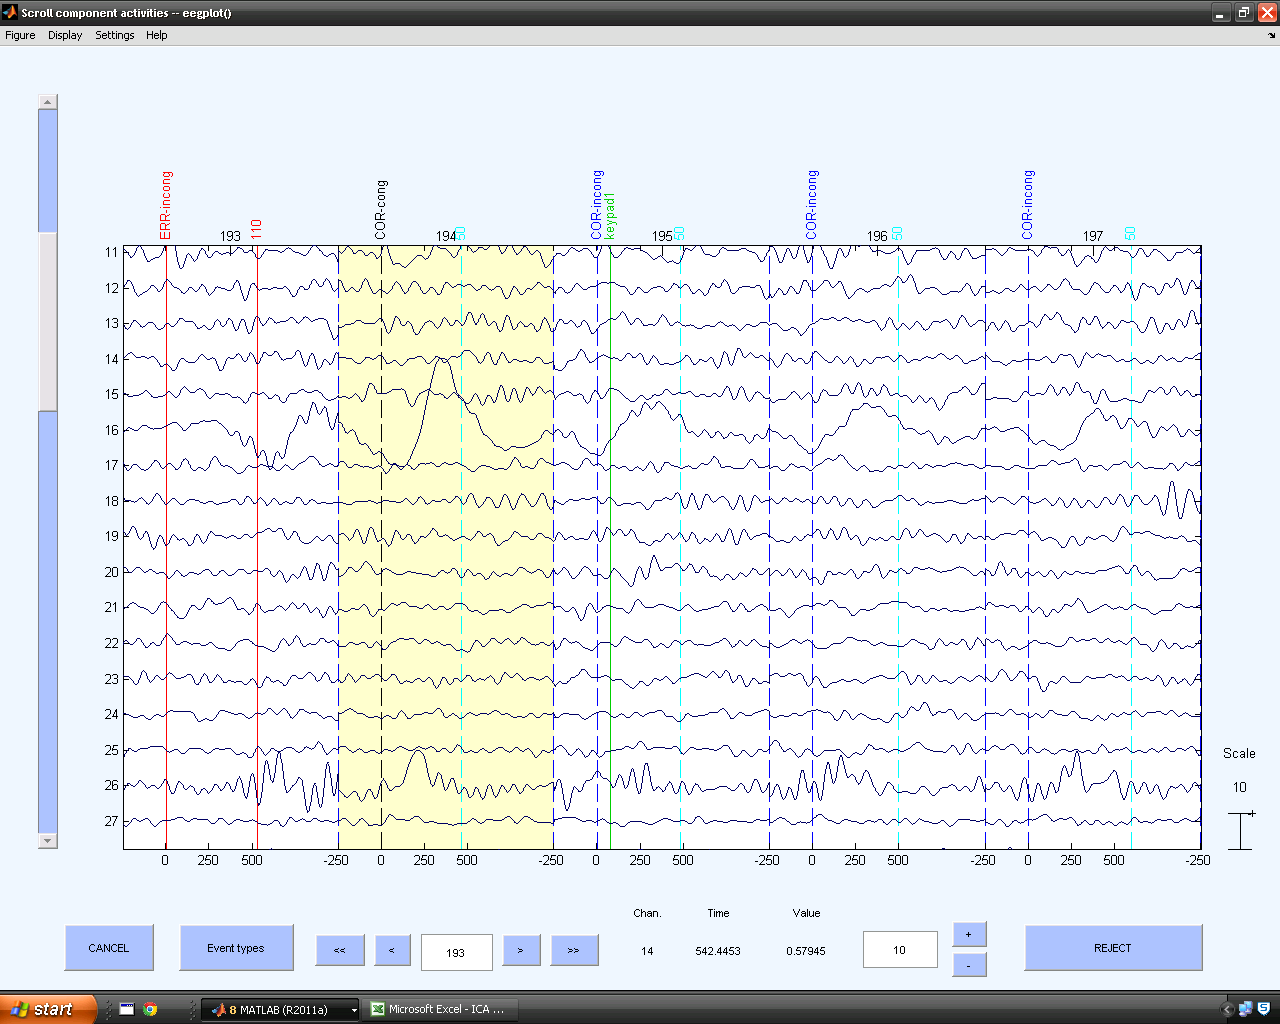
35 Component Data Scroll Shows the activity of 64 components across epochs 10


36
37
 can be")
38 Eye blinks Features used Spatial Average Difference (SAD) Temporal Kurtosis (TK) Frontal distribution High power in delta frequency band In component data scroll high potentials with morphology of eye blink (like in EEG) can be observed


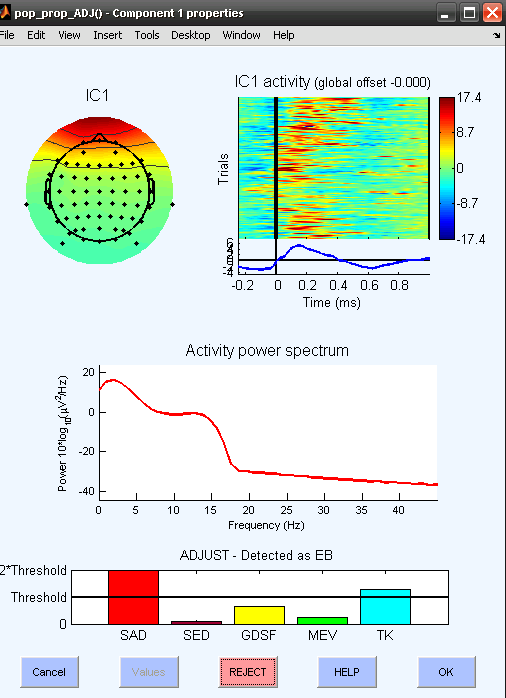

39 All have SAD and TK features over threshold All have a frontal distribution All have higher power in delta band

40 Look at Component Scroll for what IC 1 looks like High potentials with these morphology further suggest the IC component is in fact eye blink related
41 Vertical Eye Movement Features used Spatial Average Difference (SAD) Maximum Epoch Variance (MEV) Frontal distribution similar to that of an eye blink

42 Frontal distribution It appears that the artifact is mostly driven by what is happening around trial 200 SAD and MEV features are over threshold
43
 Frontal distribution in anti-phase (one positive and one")
44 Horizontal Eye Movement Features used Spatial Eye Difference (SED) Maximum Epoch Variance (MEV) Frontal distribution in anti-phase (one positive and one negative)

45 Anti-phase, primarily frontal distribution In the IC Activity by trial, three sections stand out SED and MEV features are over threshold


46 Trial Trials

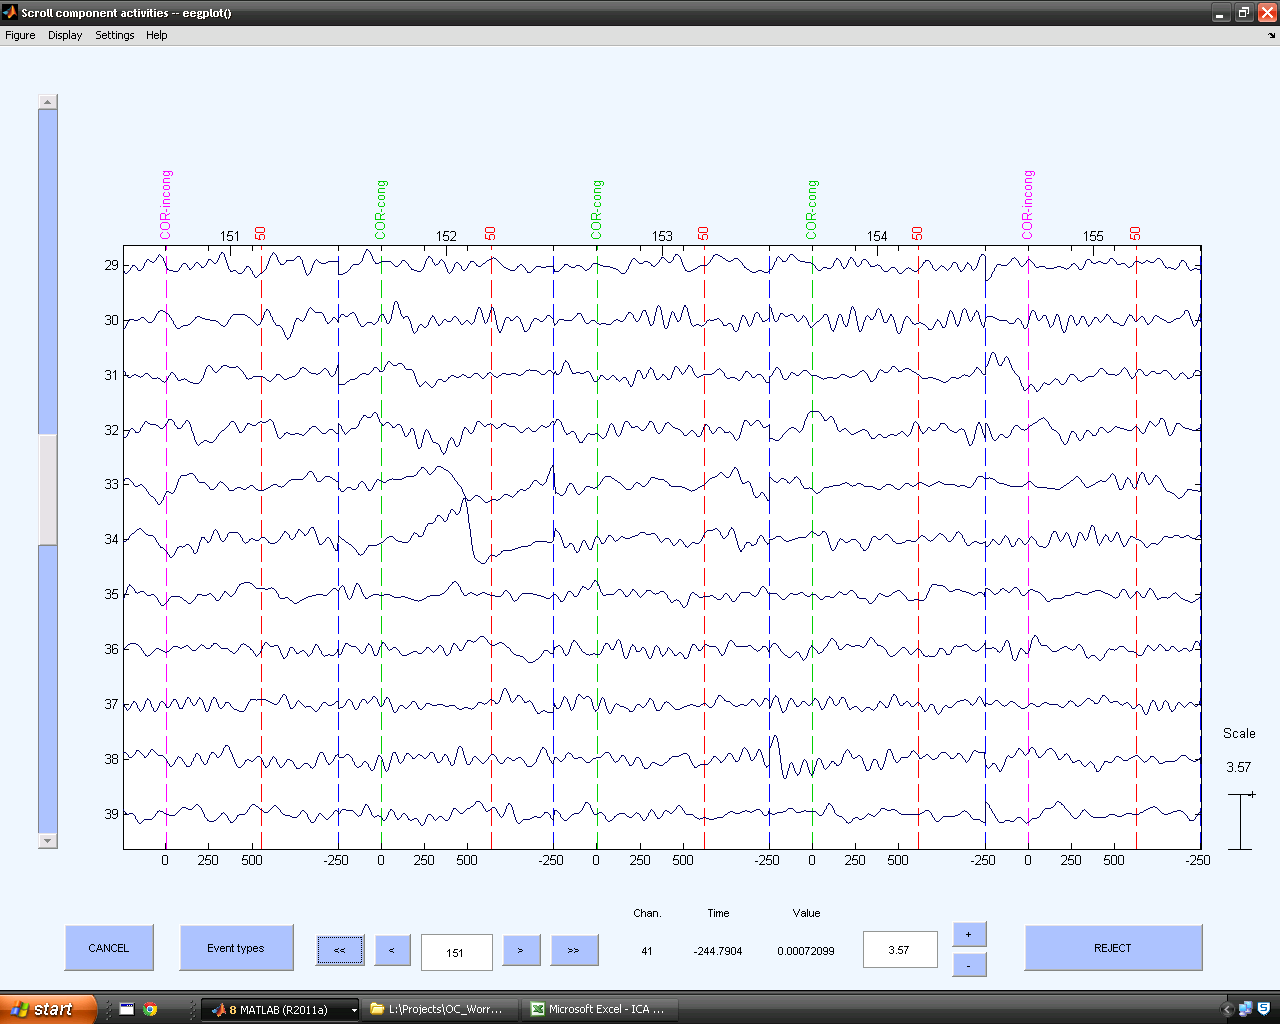
47 Generic Discontinuities Features used Generic Discontinuities Spatial Feature (GDSF) Maximum Epoch Variance (MEV) Variable distribution Sudden amplitude fluctuations with no spatial preference Could be present in as little as one or 2 trials, and limited to 1 channel In component data scroll weird activity in the trial plotted on the IC activity

48 GDSF and MEV features over threshold Variable distribution even at a single channel IC activity shows a lot of variability across epochs and doesn t show one as responsible
49

50 GDSF and MEV features over threshold Variable distribution. In this case, present at a single channel In the IC Activity by trial, one section stands out

51
52 Sample Files Under L:\Projects\OC_Worry\Physiodata Few ICs 714flankers.cnt.ICA.MAT A lot of ICs 770flankers.cnt.ICA.MAT 701pl.cnt.ICA.MAT
ICA decomposition and component analysis
 ICA decomposition and component analysis Task 1 Run ICA Exercise... Task 2 Plot components Identify components Task 3 Plot component power Plot component ERP & erpimages Plot ERSP/Cross coherence Exercise...
Data Analysis Methods: Net Station 4.1 By Peter Molfese
 Data Analysis Methods: Net Station 4.1 By Peter Molfese Preparing Data for Statistics (preprocessing): 1. Rename your files to correct any typos or formatting issues. a. The General format for naming files
Classic EEG (ERPs)/ Advanced EEG. Quentin Noirhomme
/ Advanced EEG. Quentin Noirhomme") Classic EEG (ERPs)/ Advanced EEG Quentin Noirhomme Outline Origins of MEEG Event related potentials Time frequency decomposition i Source reconstruction Before to start EEGlab Fieldtrip (included in spm)
Classic EEG (ERPs)/ Advanced EEG Quentin Noirhomme Outline Origins of MEEG Event related potentials Time frequency decomposition i Source reconstruction Before to start EEGlab Fieldtrip (included in spm)
Estimation of Loudness by Zwicker's Method
 Estimation of Loudness by Zwicker's Method Loudness is one category in the list of human perceptions of sound. There are many methods of estimating Loudness using objective measurements. No method is perfect.
ERPLAB TOOLBOX TUTORIAL
 ERPLAB TOOLBOX TUTORIAL Version Beta1.1.9 1 July 2010 Tutorial written by Steve Luck, Stan Huang, and Javier Lopez- Calderon ERPLAB Toolbox core designed by Javier Lopez- Calderon and Steve Luck Important
Doppler. Doppler. Doppler shift. Doppler Frequency. Doppler shift. Doppler shift. Chapter 19
 Doppler Doppler Chapter 19 A moving train with a trumpet player holding the same tone for a very long time travels from your left to your right. The tone changes relative the motion of you (receiver) and
EEG COHERENCE AND PHASE DELAYS: COMPARISONS BETWEEN SINGLE REFERENCE, AVERAGE REFERENCE AND CURRENT SOURCE DENSITY
 Version 1, June 13, 2004 Rough Draft form We apologize while we prepare the manuscript for publication but the data are valid and the conclusions are fundamental EEG COHERENCE AND PHASE DELAYS: COMPARISONS
Overview of Methodology. Human Electrophysiology. Computing and Displaying Difference Waves. Plotting The Averaged ERP
 Human Electrophysiology Overview of Methodology This Week: 1. Displaying ERPs 2. Defining ERP components Analog Filtering Amplification Montage Selection Analog-Digital Conversion Signal-to-Noise Enhancement
Density Curve. A density curve is the graph of a continuous probability distribution. It must satisfy the following properties:
 Density Curve A density curve is the graph of a continuous probability distribution. It must satisfy the following properties: 1. The total area under the curve must equal 1. 2. Every point on the curve
Modelling, Extraction and Description of Intrinsic Cues of High Resolution Satellite Images: Independent Component Analysis based approaches
 Modelling, Extraction and Description of Intrinsic Cues of High Resolution Satellite Images: Independent Component Analysis based approaches PhD Thesis by Payam Birjandi Director: Prof. Mihai Datcu Problematic
Anomaly Detection and Predictive Maintenance
 Anomaly Detection and Predictive Maintenance Rosaria Silipo Iris Adae Christian Dietz Phil Winters [email protected] [email protected] [email protected] [email protected]
ERPs in Cognitive Neuroscience
 Center for Neuroscience UNIVERSITY OF CALIFORNIA AT DAVIS ERPs in Cognitive Neuroscience Charan Ranganath Center for Neuroscience and Dept of Psychology, UC Davis EEG and MEG Neuronal activity generates
Jitter Measurements in Serial Data Signals
 Jitter Measurements in Serial Data Signals Michael Schnecker, Product Manager LeCroy Corporation Introduction The increasing speed of serial data transmission systems places greater importance on measuring
Documentation Wadsworth BCI Dataset (P300 Evoked Potentials) Data Acquired Using BCI2000's P3 Speller Paradigm (http://www.bci2000.
 Data Acquired Using BCI2000's P3 Speller Paradigm (http://www.bci2000.") Documentation Wadsworth BCI Dataset (P300 Evoked Potentials) Data Acquired Using BCI2000's P3 Speller Paradigm (http://www.bci2000.org) BCI Competition III Challenge 2004 Organizer: Benjamin Blankertz
Documentation Wadsworth BCI Dataset (P300 Evoked Potentials) Data Acquired Using BCI2000's P3 Speller Paradigm (http://www.bci2000.org) BCI Competition III Challenge 2004 Organizer: Benjamin Blankertz
Electronic Communications Committee (ECC) within the European Conference of Postal and Telecommunications Administrations (CEPT)
 within the European Conference of Postal and Telecommunications Administrations (CEPT)") Page 1 Electronic Communications Committee (ECC) within the European Conference of Postal and Telecommunications Administrations (CEPT) ECC RECOMMENDATION (06)01 Bandwidth measurements using FFT techniques
Page 1 Electronic Communications Committee (ECC) within the European Conference of Postal and Telecommunications Administrations (CEPT) ECC RECOMMENDATION (06)01 Bandwidth measurements using FFT techniques
Fetal monitoring on the move, from a hospital to in-home setting
 Michiel Rooijakkers MSc TU/e - Signal Processing Systems SEBAN (Smart Energy Body Area Sensor Networks for Pregnancy Monitoring) 18 th October 2011 Fetal monitoring on the move, from a hospital to in-home
Bandwidth-dependent transformation of noise data from frequency into time domain and vice versa
 Topic Bandwidth-dependent transformation of noise data from frequency into time domain and vice versa Authors Peter Bormann (formerly GeoForschungsZentrum Potsdam, Telegrafenberg, D-14473 Potsdam, Germany),
S.J. Luck ERP Boot Camp All rights reserved
 All rights reserved ERP Boot Camp: Data Analysis Tutorials (for use with BrainVision Analyzer-2 Software) Preparation of these tutorials was made possible by NIH grant R25MH080794 Emily S. Kappenman, Marissa
Component Ordering in Independent Component Analysis Based on Data Power
 Component Ordering in Independent Component Analysis Based on Data Power Anne Hendrikse Raymond Veldhuis University of Twente University of Twente Fac. EEMCS, Signals and Systems Group Fac. EEMCS, Signals
SUMMARY. Additional Digital/Software filters are included in Chart and filter the data after it has been sampled and recorded by the PowerLab.
 This technique note was compiled by ADInstruments Pty Ltd. It includes figures and tables from S.S. Young (2001): Computerized data acquisition and analysis for the life sciences. For further information
1) Write the following as an algebraic expression using x as the variable: Triple a number subtracted from the number
 Write the following as an algebraic expression using x as the variable: Triple a number subtracted from the number") 1) Write the following as an algebraic expression using x as the variable: Triple a number subtracted from the number A. 3(x - x) B. x 3 x C. 3x - x D. x - 3x 2) Write the following as an algebraic expression
1) Write the following as an algebraic expression using x as the variable: Triple a number subtracted from the number A. 3(x - x) B. x 3 x C. 3x - x D. x - 3x 2) Write the following as an algebraic expression
Spectrum Level and Band Level
 Spectrum Level and Band Level ntensity, ntensity Level, and ntensity Spectrum Level As a review, earlier we talked about the intensity of a sound wave. We related the intensity of a sound wave to the acoustic
Increase the measurement speed with NOVA
 Increase the measurement speed with NOVA Case study: how to increase the measurement speed by optimizing the USB communication with the Autolab? 1 USB 1.1 vs USB 2.0 Although the Autolab uses a USB 1.1
RANDOM VIBRATION AN OVERVIEW by Barry Controls, Hopkinton, MA
 RANDOM VIBRATION AN OVERVIEW by Barry Controls, Hopkinton, MA ABSTRACT Random vibration is becoming increasingly recognized as the most realistic method of simulating the dynamic environment of military
RF Network Analyzer Basics
 RF Network Analyzer Basics A tutorial, information and overview about the basics of the RF Network Analyzer. What is a Network Analyzer and how to use them, to include the Scalar Network Analyzer (SNA),
DESCRIPTIVE STATISTICS. The purpose of statistics is to condense raw data to make it easier to answer specific questions; test hypotheses.
 DESCRIPTIVE STATISTICS The purpose of statistics is to condense raw data to make it easier to answer specific questions; test hypotheses. DESCRIPTIVE VS. INFERENTIAL STATISTICS Descriptive To organize,
EEGLAB: an open source toolbox for analysis of single-trial EEG dynamics including independent component analysis
 Journal of Neuroscience Methods 134 (2004) 9 21 EEGLAB: an open source toolbox for analysis of single-trial EEG dynamics including independent component analysis Arnaud Delorme, Scott Makeig Swartz Center
VCO Phase noise. Characterizing Phase Noise
 VCO Phase noise Characterizing Phase Noise The term phase noise is widely used for describing short term random frequency fluctuations of a signal. Frequency stability is a measure of the degree to which
Customer: Cardiff Hospital NHS (United Kingdom) Machine:
 Machine:") Customer: Cardiff Hospital NHS (United Kingdom) Machine: Bench for leak test Model: Easy TS Page 1 of 7 Date: 6 th March 2012 1. Introduction. Easy TS is a compact and reliable table top bench designed
Customer: Cardiff Hospital NHS (United Kingdom) Machine: Bench for leak test Model: Easy TS Page 1 of 7 Date: 6 th March 2012 1. Introduction. Easy TS is a compact and reliable table top bench designed
Basic Acoustics and Acoustic Filters
 Basic CHAPTER Acoustics and Acoustic Filters 1 3 Basic Acoustics and Acoustic Filters 1.1 The sensation of sound Several types of events in the world produce the sensation of sound. Examples include doors
BNG 202 Biomechanics Lab. Descriptive statistics and probability distributions I
 BNG 202 Biomechanics Lab Descriptive statistics and probability distributions I Overview The overall goal of this short course in statistics is to provide an introduction to descriptive and inferential
AN1200.04. Application Note: FCC Regulations for ISM Band Devices: 902-928 MHz. FCC Regulations for ISM Band Devices: 902-928 MHz
 AN1200.04 Application Note: FCC Regulations for ISM Band Devices: Copyright Semtech 2006 1 of 15 www.semtech.com 1 Table of Contents 1 Table of Contents...2 1.1 Index of Figures...2 1.2 Index of Tables...2
SKEWNESS. Measure of Dispersion tells us about the variation of the data set. Skewness tells us about the direction of variation of the data set.
 SKEWNESS All about Skewness: Aim Definition Types of Skewness Measure of Skewness Example A fundamental task in many statistical analyses is to characterize the location and variability of a data set.
Frequency Response of Filters
 School of Engineering Department of Electrical and Computer Engineering 332:224 Principles of Electrical Engineering II Laboratory Experiment 2 Frequency Response of Filters 1 Introduction Objectives To
Time series experiments
 Time series experiments Time series experiments Why is this a separate lecture: The price of microarrays are decreasing more time series experiments are coming Often a more complex experimental design
Shock test severity based on Shock Response Spectrum
 Shock test severity based on Shock Response Spectrum Frans Assink THALES NEDERLAND B.V. AND/OR ITS SUPPLIERS THIS INFORMATION CARRIER CONTAINS PROPRIETARY INFORMATION WHICH SHALL NOT BE USED, REPRODUCED
Time Domain and Frequency Domain Techniques For Multi Shaker Time Waveform Replication
 Time Domain and Frequency Domain Techniques For Multi Shaker Time Waveform Replication Thomas Reilly Data Physics Corporation 1741 Technology Drive, Suite 260 San Jose, CA 95110 (408) 216-8440 This paper
Lecture 1-10: Spectrograms
 Lecture 1-10: Spectrograms Overview 1. Spectra of dynamic signals: like many real world signals, speech changes in quality with time. But so far the only spectral analysis we have performed has assumed
ANIMA: Non-Conventional Interfaces in Robot Control Through Electroencephalography and Electrooculography: Motor Module
 Ninth LACCEI Latin American and Caribbean Conference (LACCEI 2011), Engineering for a Smart Planet, Innovation, Information Technology and Computational Tools for Sustainable Development, August 3-5, 2011,
Fitness Fundamentals
 Fitness Fundamentals Participate 2-3/week Duration 30-60 minutes Intensity moderate to vigorous Exercises should be developmentally appropriate, enjoyable and varied. Benefits can include increased Careful
Detecting Network Anomalies. Anant Shah
 Detecting Network Anomalies using Traffic Modeling Anant Shah Anomaly Detection Anomalies are deviations from established behavior In most cases anomalies are indications of problems The science of extracting
Descriptive Statistics
 Y520 Robert S Michael Goal: Learn to calculate indicators and construct graphs that summarize and describe a large quantity of values. Using the textbook readings and other resources listed on the web
Author: Dr. Society of Electrophysio. Reference: Electrodes. should include: electrode shape size use. direction.
 Standards for Reportin ng EMG Data Author: Dr. Roberto Merletti, Politecnico di Torino, Italy The Standards for Reporting EMG Data, written by Dr. Robertoo Merletti, are endorsed by the International Society
Characterizing Wireless Network Performance
 Characterizing Wireless Network Performance Ruckus Wireless Black Paper Accurate performance testing for wireless networks requires understanding how to test for worst case scenarios As expensive and inconvenient
Analyses: Statistical Measures
 Application Note 129 APPLICATION NOTE Heart Rate Variability 42 Aero Camino, Goleta, CA 93117 Tel (805) 685-0066 Fax (805) 685-0067 [email protected] www.biopac.com 05.22.14 Analyses: Statistical Measures
Alignment and Preprocessing for Data Analysis
 Alignment and Preprocessing for Data Analysis Preprocessing tools for chromatography Basics of alignment GC FID (D) data and issues PCA F Ratios GC MS (D) data and issues PCA F Ratios PARAFAC Piecewise
Financial Time Series Analysis (FTSA) Lecture 1: Introduction
 Lecture 1: Introduction") Financial Time Series Analysis (FTSA) Lecture 1: Introduction Brief History of Time Series Analysis Statistical analysis of time series data (Yule, 1927) v/s forecasting (even longer). Forecasting is often
Financial Time Series Analysis (FTSA) Lecture 1: Introduction Brief History of Time Series Analysis Statistical analysis of time series data (Yule, 1927) v/s forecasting (even longer). Forecasting is often
Filter Comparison. Match #1: Analog vs. Digital Filters
 CHAPTER 21 Filter Comparison Decisions, decisions, decisions! With all these filters to choose from, how do you know which to use? This chapter is a head-to-head competition between filters; we'll select
Chapter 10 Introduction to Time Series Analysis
 Chapter 1 Introduction to Time Series Analysis A time series is a collection of observations made sequentially in time. Examples are daily mortality counts, particulate air pollution measurements, and
sufilter was applied to the original data and the entire NB attribute volume was output to segy format and imported to SMT for further analysis.
 Channel and fracture indicators from narrow-band decomposition at Dickman field, Kansas Johnny Seales*, Tim Brown and Christopher Liner Department of Earth and Atmospheric Sciences, University of Houston,
T = 1 f. Phase. Measure of relative position in time within a single period of a signal For a periodic signal f(t), phase is fractional part t p
, phase is fractional part t p") Data Transmission Concepts and terminology Transmission terminology Transmission from transmitter to receiver goes over some transmission medium using electromagnetic waves Guided media. Waves are guided
Data Transmission Concepts and terminology Transmission terminology Transmission from transmitter to receiver goes over some transmission medium using electromagnetic waves Guided media. Waves are guided
Building a Simulink model for real-time analysis V1.15.00. Copyright g.tec medical engineering GmbH
 g.tec medical engineering GmbH Sierningstrasse 14, A-4521 Schiedlberg Austria - Europe Tel.: (43)-7251-22240-0 Fax: (43)-7251-22240-39 [email protected], http://www.gtec.at Building a Simulink model for real-time
Agilent AN 1316 Optimizing Spectrum Analyzer Amplitude Accuracy
 Agilent AN 1316 Optimizing Spectrum Analyzer Amplitude Accuracy Application Note RF & Microwave Spectrum Analyzers Table of Contents 3 3 4 4 5 7 8 8 13 13 14 16 16 Introduction Absolute versus relative
The Action Potential Graphics are used with permission of: adam.com (http://www.adam.com/) Benjamin Cummings Publishing Co (http://www.awl.
 Benjamin Cummings Publishing Co (http://www.awl.") The Action Potential Graphics are used with permission of: adam.com (http://www.adam.com/) Benjamin Cummings Publishing Co (http://www.awl.com/bc) ** If this is not printed in color, it is suggested you
The Action Potential Graphics are used with permission of: adam.com (http://www.adam.com/) Benjamin Cummings Publishing Co (http://www.awl.com/bc) ** If this is not printed in color, it is suggested you
INTERFERENCE OF SOUND WAVES
 2011 Interference - 1 INTERFERENCE OF SOUND WAVES The objectives of this experiment are: To measure the wavelength, frequency, and propagation speed of ultrasonic sound waves. To observe interference phenomena
Chapter 7 Section 7.1: Inference for the Mean of a Population
 Chapter 7 Section 7.1: Inference for the Mean of a Population Now let s look at a similar situation Take an SRS of size n Normal Population : N(, ). Both and are unknown parameters. Unlike what we used
Independence of Visual Awareness from the Scope of Attention: an Electrophysiological Study
 Cerebral Cortex March 2006;16:415-424 doi:10.1093/cercor/bhi121 Advance Access publication June 15, 2005 Independence of Visual Awareness from the Scope of Attention: an Electrophysiological Study Mika
Skewness and Kurtosis in Function of Selection of Network Traffic Distribution
 Acta Polytechnica Hungarica Vol. 7, No., Skewness and Kurtosis in Function of Selection of Network Traffic Distribution Petar Čisar Telekom Srbija, Subotica, Serbia, [email protected] Sanja Maravić Čisar
Efficient Heart Rate Monitoring
 Efficient Heart Rate Monitoring By Sanjeev Kumar, Applications Engineer, Cypress Semiconductor Corp. Heart rate is one of the most frequently measured parameters of the human body and plays an important
An Evaluation of Irregularities of Milled Surfaces by the Wavelet Analysis
 An Evaluation of Irregularities of Milled Surfaces by the Wavelet Analysis Włodzimierz Makieła Abstract This paper presents an introductory to wavelet analysis and its application in assessing the surface
Perthometer. Surface Texture Parameters New Standards DIN EN ISO / ASME
 Perthometer. Surface Texture Parameters New Standards DIN EN ISO / ASME MAHR GMBH, Germany - EDITION 09/01/99 Contents Real surface... Geometrical Product Specification Definition Profile filter P t Profile
The Effect of Network Cabling on Bit Error Rate Performance. By Paul Kish NORDX/CDT
 The Effect of Network Cabling on Bit Error Rate Performance By Paul Kish NORDX/CDT Table of Contents Introduction... 2 Probability of Causing Errors... 3 Noise Sources Contributing to Errors... 4 Bit Error
Activitity (of a radioisotope): The number of nuclei in a sample undergoing radioactive decay in each second. It is commonly expressed in curies
: The number of nuclei in a sample undergoing radioactive decay in each second. It is commonly expressed in curies") Activitity (of a radioisotope): The number of nuclei in a sample undergoing radioactive decay in each second. It is commonly expressed in curies (Ci), where 1 Ci = 3.7x10 10 disintegrations per second.
Activitity (of a radioisotope): The number of nuclei in a sample undergoing radioactive decay in each second. It is commonly expressed in curies (Ci), where 1 Ci = 3.7x10 10 disintegrations per second.
Regularized Logistic Regression for Mind Reading with Parallel Validation
 Regularized Logistic Regression for Mind Reading with Parallel Validation Heikki Huttunen, Jukka-Pekka Kauppi, Jussi Tohka Tampere University of Technology Department of Signal Processing Tampere, Finland
Using Data Mining Techniques for Analyzing Pottery Databases
 BAR-ILAN UNIVERSITY Using Data Mining Techniques for Analyzing Pottery Databases Zachi Zweig Submitted in partial fulfillment of the requirements for the Master s degree in the Martin (Szusz) Department
TECHNICAL SPECIFICATIONS, VALIDATION, AND RESEARCH USE CONTENTS:
 TECHNICAL SPECIFICATIONS, VALIDATION, AND RESEARCH USE CONTENTS: Introduction to Muse... 2 Technical Specifications... 3 Research Validation... 4 Visualizing and Recording EEG... 6 INTRODUCTION TO MUSE
Short-time FFT, Multi-taper analysis & Filtering in SPM12
 Short-time FFT, Multi-taper analysis & Filtering in SPM12 Computational Psychiatry Seminar, FS 2015 Daniel Renz, Translational Neuromodeling Unit, ETHZ & UZH 20.03.2015 Overview Refresher Short-time Fourier
Interactive Logging with FlukeView Forms
 FlukeView Forms Technical Note Fluke developed an Event Logging function allowing the Fluke 89-IV and the Fluke 189 models to profile the behavior of a signal over time without requiring a great deal of
Signal Detection. Outline. Detection Theory. Example Applications of Detection Theory
 Outline Signal Detection M. Sami Fadali Professor of lectrical ngineering University of Nevada, Reno Hypothesis testing. Neyman-Pearson (NP) detector for a known signal in white Gaussian noise (WGN). Matched
STA 4273H: Statistical Machine Learning
 STA 4273H: Statistical Machine Learning Russ Salakhutdinov Department of Statistics! [email protected]! http://www.cs.toronto.edu/~rsalakhu/ Lecture 6 Three Approaches to Classification Construct
1 One Dimensional Horizontal Motion Position vs. time Velocity vs. time
 PHY132 Experiment 1 One Dimensional Horizontal Motion Position vs. time Velocity vs. time One of the most effective methods of describing motion is to plot graphs of distance, velocity, and acceleration
Statistics Review PSY379
 Statistics Review PSY379 Basic concepts Measurement scales Populations vs. samples Continuous vs. discrete variable Independent vs. dependent variable Descriptive vs. inferential stats Common analyses
NeuroImage 62 (2012) 439 450. Contents lists available at SciVerse ScienceDirect. NeuroImage. journal homepage: www.elsevier.
 439 450. Contents lists available at SciVerse ScienceDirect. NeuroImage. journal homepage: www.elsevier.") NeuroImage 62 (212) 39 5 Contents lists available at SciVerse ScienceDirect NeuroImage journal homepage: www.elsevier.com/locate/ynimg Examining ERP correlates of recognition memory: Evidence of accurate
NeuroImage 62 (212) 39 5 Contents lists available at SciVerse ScienceDirect NeuroImage journal homepage: www.elsevier.com/locate/ynimg Examining ERP correlates of recognition memory: Evidence of accurate
Descriptive Statistics. Purpose of descriptive statistics Frequency distributions Measures of central tendency Measures of dispersion
 Descriptive Statistics Purpose of descriptive statistics Frequency distributions Measures of central tendency Measures of dispersion Statistics as a Tool for LIS Research Importance of statistics in research
Specifying Plasma Deposited Hard Coated Optical Thin Film Filters. Alluxa Engineering Staff
 Specifying Plasma Deposited Hard Coated Optical Thin Film Filters. Alluxa Engineering Staff December 2012 Specifying Advanced Plasma Deposited Hard Coated Optical Bandpass and Dichroic Filters. Introduction
Analog and Digital Signals, Time and Frequency Representation of Signals
 1 Analog and Digital Signals, Time and Frequency Representation of Signals Required reading: Garcia 3.1, 3.2 CSE 3213, Fall 2010 Instructor: N. Vlajic 2 Data vs. Signal Analog vs. Digital Analog Signals
EEG IN CHILDREN: NORMAL AND ABNORMAL. Warren T. Blume, MD,FRCPC EEG Course FSNC/CNSF JUNE 2007
 EEG IN CHILDREN: NORMAL AND ABNORMAL Warren T. Blume, MD,FRCPC EEG Course FSNC/CNSF JUNE 2007 OBJECTIVES Survey some abnormal and normal patterns Maturation characteristics Artefact recognition Patterns
Summary of Formulas and Concepts. Descriptive Statistics (Ch. 1-4)
") Summary of Formulas and Concepts Descriptive Statistics (Ch. 1-4) Definitions Population: The complete set of numerical information on a particular quantity in which an investigator is interested. We assume
Summary of Formulas and Concepts Descriptive Statistics (Ch. 1-4) Definitions Population: The complete set of numerical information on a particular quantity in which an investigator is interested. We assume
Data Mining Practical Machine Learning Tools and Techniques
 Ensemble learning Data Mining Practical Machine Learning Tools and Techniques Slides for Chapter 8 of Data Mining by I. H. Witten, E. Frank and M. A. Hall Combining multiple models Bagging The basic idea
Function Guide for the Fourier Transformation Package SPIRE-UOL-DOC-002496
 Function Guide for the Fourier Transformation Package SPIRE-UOL-DOC-002496 Prepared by: Peter Davis (University of Lethbridge) [email protected] Andres Rebolledo (University of Lethbridge) [email protected]
Lecture 2: Descriptive Statistics and Exploratory Data Analysis
 Lecture 2: Descriptive Statistics and Exploratory Data Analysis Further Thoughts on Experimental Design 16 Individuals (8 each from two populations) with replicates Pop 1 Pop 2 Randomly sample 4 individuals
Command-induced Tracking Jitter Study I D. Clark November 24, 2009
 Command-induced Tracking Jitter Study I D. Clark November 24, 2009 Introduction Reports of excessive tracking jitter on the MMT elevation axis have lately been theorized to be caused by the input command
Action Potentials I Generation. Reading: BCP Chapter 4
 Action Potentials I Generation Reading: BCP Chapter 4 Action Potentials Action potentials (AP s) aka Spikes (because of how they look in an electrical recording of Vm over time). Discharges (descriptive
An analysis method for a quantitative outcome and two categorical explanatory variables.
 Chapter 11 Two-Way ANOVA An analysis method for a quantitative outcome and two categorical explanatory variables. If an experiment has a quantitative outcome and two categorical explanatory variables that
Cortical Source Localization of Human Scalp EEG. Kaushik Majumdar Indian Statistical Institute Bangalore Center
 Cortical Source Localization of Human Scalp EEG Kaushik Majumdar Indian Statistical Institute Bangalore Center Cortical Basis of Scalp EEG Baillet et al, IEEE Sig Proc Mag, Nov 2001, p 16 Mountcastle,
The Phase Modulator In NBFM Voice Communication Systems
 The Phase Modulator In NBFM Voice Communication Systems Virgil Leenerts 8 March 5 The phase modulator has been a point of discussion as to why it is used and not a frequency modulator in what are called
Welcome to SKIL 3 - the most comprehensive quantitative EEG analysis software available
 Welcome to SKIL 3 - the most comprehensive quantitative EEG analysis software available Features of SKIL 3.0 Normative adult and children databases of four conditions (eyes closed and eyes open rest, age-appropriate
Uncertainty evaluations in EMC measurements
 Uncertainty evaluations in EMC measurements Carlo Carobbi Dipartimento di Elettronica e Telecomunicazioni Università degli Studi di Firenze Politecnico di Milano - 20 Feb. 2009 1 Non - reproducibility
ECG SIGNAL PROCESSING AND HEART RATE FREQUENCY DETECTION METHODS
 ECG SIGNAL PROCESSING AND HEART RATE FREQUENCY DETECTION METHODS J. Parak, J. Havlik Department of Circuit Theory, Faculty of Electrical Engineering Czech Technical University in Prague Abstract Digital
ε: Voltage output of Signal Generator (also called the Source voltage or Applied
 Experiment #10: LR & RC Circuits Frequency Response EQUIPMENT NEEDED Science Workshop Interface Power Amplifier (2) Voltage Sensor graph paper (optional) (3) Patch Cords Decade resistor, capacitor, and
Functional neuroimaging. Imaging brain function in real time (not just the structure of the brain).
.") Functional neuroimaging Imaging brain function in real time (not just the structure of the brain). The brain is bloody & electric Blood increase in neuronal activity increase in metabolic demand for glucose
Functional neuroimaging Imaging brain function in real time (not just the structure of the brain). The brain is bloody & electric Blood increase in neuronal activity increase in metabolic demand for glucose
The Design and Implementation of Multimedia Software
 Chapter 10 Auditory Content The Design and Implementation of Multimedia Software David Bernstein Jones and Bartlett Publishers www.jbpub.com David Bernstein (jbpub.com) Multimedia Software Jones and Bartlett
Clock Recovery in Serial-Data Systems Ransom Stephens, Ph.D.
 Clock Recovery in Serial-Data Systems Ransom Stephens, Ph.D. Abstract: The definition of a bit period, or unit interval, is much more complicated than it looks. If it were just the reciprocal of the data
Free software solutions for MEG/EEG source imaging
 Free software solutions for MEG/EEG source imaging François Tadel Cognitive Neuroscience & Brain Imaging Lab., CNRS University of Paris - Hôpital de la Salpêtrière Cognitive Neuroimaging Unit, Inserm U562
DESCRIPTIVE STATISTICS AND EXPLORATORY DATA ANALYSIS
 DESCRIPTIVE STATISTICS AND EXPLORATORY DATA ANALYSIS SEEMA JAGGI Indian Agricultural Statistics Research Institute Library Avenue, New Delhi - 110 012 [email protected] 1. Descriptive Statistics Statistics
How to compute Random acceleration, velocity, and displacement values from a breakpoint table.
 How to compute Random acceleration, velocity, and displacement values from a breakpoint table. A random spectrum is defined as a set of frequency and amplitude breakpoints, like these: 0.050 Acceleration