Network Event Viewer now supports real-time monitoring enabling system administrators to be notified immediately when critical events are logged.
|
|
|
- Melanie Boyd
- 8 years ago
- Views:
Transcription
1 About Network Event Viewer is a network wide event log monitoring, consolidation, auditing and reporting tool enabling System Administrators to satisfy Sarbanes-Oxley auditing requirements while proactively managing their networks. Centralized Event Logging The Windows operating system and many 3rd party Windows Services and applications use the Windows Event Log system to log informational, warning, and error information used by Network Administrators to help identify application errors. Network Event Viewer real-time monitors, consolidates and archives event logs to SQL Server, MySQL or the file system. Administrators can automatically export consolidated logs to CSV, EVT, HTML, TXT, and XML. Network Event Viewer can optionally clear event logs once archived. Use the viewer to merge multiple logs into a single view. Real-Time Monitoring Network Event Viewer now supports real-time monitoring enabling system administrators to be notified immediately when critical events are logged. Advanced Event Filtering Powerful filtering searches through consolidated event logs and allows you to pinpoint events of interest or remove noise. Supports simple and complex regular expression filters. Selectively flag and add notes to events of interest. Alerts, Notifications, and Actions Supports several different alerts and actions when key events are detected. Trigger actions such as sending a fully customizable , exporting to a file, displaying a message box, playing a sound, writing key events to a user defined database table, forwarding key events to a syslog server, displaying a system tray popup message or sending a SMS notification through an -to-sms gateway or service. Automatic Report Generation Create scheduled reports that contain events of interest from a set of computers. For example, receive a daily report that contains a list of all failed login attempts to your domain controllers for the last 24 hours. report content is fully customizable through our HTML templates. Quickly search your network for all domain controllers, servers, SQL Servers or workstations. Once identified, download or configure all at once. Event Log Consolidation and Monitoring Templates Configuration templates allow you to save an event log consolidation and monitoring configuration. Quickly assign configuration templates to a set of computers and logs. New computers can be automatically configured with our Active Directory Auto Configurator. When a new computer is discovered, your configuration template is assigned making log consolidation and monitoring automatic. Syslog Monitoring and Consolidation Network Event Viewer includes a self-contained syslog server that can be used to collect syslog log messages from both computers and devices such as routers. Enterprise Architecture Network Event Viewer consists of a Windows service and a separate management interface. No agent software needs to be installed on the machines you wish to manage. Network Event Viewer uses multi-threaded code to download and filter event logs. This format enables thousands of entries to be Page 1

2 consolidated and filtered in seconds. How It Works Network Event Viewer is built using a Windows Service, management interface application, and tray icon application for user interface alerts. No installation requirements on remotely managed computers. Network Event Viewer uses multi-threaded code to download and filter event logs. This format enables thousands of entries to be consolidated and filtered in seconds. Other Features Receive, consolidate, and monitor syslog messages. Group computers by logical groups. Display event log entry data as HEX, ASCII, or Unicode. Automatically refreshes the current view with when new entries are downloaded. Fully customizable HTML output and content. Automatically archives event log repository. Sends notification when downloads fail. Supports multiple Active Directory connections. Modify Windows Event Log properties (maximum size and overwrite policy) Supports SMTP authentication. Page 2


3 System Architecture Page 3

4 System Requirements.Net Framework 2.0 The installation detects if.net Framework 2.0 is already installed. If not, the framework is automatically downloaded from Microsoft and then installed. Domain administrator account credentials To access remote logs from the user interface, your login must have domain administrator rights. When scheduling the service to download, filter, and clear remote logs, the service must be run with domain administrator rights. The first time the application is run, you will be prompted to assign domain administrator rights to the service. For more information see Security. Microsoft Windows Management Instrumentation Support Network Event Viewer uses the Microsoft Windows Management Instrumentation (WMI) API by default to download logs. WMI is preinstalled in Windows Vista, Windows Server 2003, Windows XP, and Windows Windows NT Workstation 4.0 SP4 and later: WMI is available through "Add/Remove Windows components" in Control Panel, as WBEM option install. A later, more comprehensive, version is available as an Internet download from See "WMI CORE 1.5 (Windows 95/98/NT 4.0)". For information on troubleshooting WMI see Troubleshooting. If WMI is not an option, you can de-select this setting via the Options dialog. Some entries may not contain the entire message but rather just the replacement strings. For more information, see Options. Page 4

5 How to Tutorials In order to help you get started using Network Event Viewer as quickly as possible; we have written several how to tutorials. How To: Consolidate Event Logs How To: Get Notified When Specific Events Occur How To: Monitor an Event Log in Real-Time How To: Monitor an Event Log during Consolidation How To: Receive a Daily Count of Specific Entries How To: Consolidate logs to SQL Server How To: Consolidate logs to MySQL How To: Search the Network for Specific Log Entries How To: Print Logs for Auditors Page 5

6 How To: Consolidate Event Logs Overview The goal of this tutorial is to show you how to configure Network Event Viewer so you can store a full year worth of event log entries while maintaining fast report generation and responsive user interaction. Background Network Event Viewer downloads remote log entries and stores each entry to either a database or the local file system. We call this storage facility the event log repository. Before we get started we would like to explain the composition of our event log repository. Event logs contain thousands of entries and storing a single year s worth of data can require significant disk space and CPU load when accessed. This data is accessed when consolidating, running reports or viewing entries. It is very important to understand that the more data present the slower the access. In order to increase performance we have included an archive function that enables the software to be responsive while providing a mechanism to data mine older event log entries. If you are using a database to store event logs a primary table and a secondary or archive table is created for each consolidated event log. If you are using the file system a primary file and a secondary or archive file is created. The primary table or file contains the latest entries. Ideally the primary table or file is limited to the last 7-30 days of entries while the archive table or file contains the rest of the entries. For example, if you are required to store entries for 1 year, the primary table could store latest 30 days while the archive stores the previous 335 days entries. This format enables the software to quickly generate daily and weekly reports as well as display logs within the application without the requirement of sorting through 1 years worth of entries. For the best results please read and perform each of the following lessons: Lesson 1: Event Log Consolidation for Small Environments Lesson 2: Event Log Consolidation for Large Environments Lesson 3: Testing the Archive Function Page 6


7 Event Log Consolidation for Small Environments Assumptions In this section of the tutorial we will assume you are using the file system to store your event logs although we highly recommend you use a database for performance reasons. Configuring the Download Options In smaller environments we typically don t see terabytes of data per year. With this in mind we will configure Network Event Viewer to store the latest 30 days of entries within the primary file and the previous 335 days of entries in the archive table. The amount of data stored within the event log repository is configured via the Options dialog. To open the Options dialog select Options from the Tools menu item. The Download tab enables you to specify the event log entry archive rules. Set your options as seen below: Please notice the first option on the tab is set to 7 days. This option tells the software to download a maximum of the previous 7 days of entries when downloading each event log. Beware upping this value after has no effect on previously downloaded event logs. Set the primary file to limit entries to 30 days and the archive file to limit entries to 365 days. When you are finished, click OK. The next step is to configure a computer for event log consolidation. Page 7

8 Consolidating Event Logs From the Network view within the Navigation window, navigate to the computer of interest. Right click on the computer and select Configure Selected Computers. From the Configuration Wizard select the Logs tab and check each log you want to consolidate and archive. Next click the Consolidation tab. The consolidation tab enables you to specify a filter to apply prior to storing downloaded log entries. Please note all entries that pass the consolidation filter are stored while the entries that do not pass the filter are bypassed. Using consolidation filters can greatly decrease the amount of disk space required to store event log entries. Specify a schedule to download your logs. We suggest an hourly schedule for domain controllers and daily schedules for servers or workstations with little load. When you are finished click the Close button and save your changes. By default newly configured event logs are automatically downloaded. Using the download options we set earlier we will only see the last 30 days of entries within Network Event Viewer, however; after the software runs for 31 days, you will see 30 days of entries within the primary event log and 1 day of entries within the archived event log. The screen shot below shows you how the primary and archived event logs display within Network Event Viewer: Page 8


9 Event Log Consolidation for Large Environments Assumptions In this section of the tutorial we will assume you are using a database to store your event logs as the file system is not recommended in larger environments for performance reasons. Configuring the Download Options In large environments we typically see terabytes of data per year. With this in mind we will configure Network Event Viewer to store the latest 7 days of entries within the primary file and the previous 45 days of entries in the archive table. Later in this tutorial we will show you how to backup the archive tables every month, when needed, restore the backed up database archive tables to an alternate database, and lastly configure Network Event Viewer to read the alternate database or auxiliary data source. The amount of data stored within the event log repository is configured via the Options dialog. To open the Options dialog select Options from the Tools menu item. The Download tab enables you to specify the event log entry archive rules. Set your options as seen below: Please notice the first option on the tab is set to 7 days. This option tells the software to download a maximum of the previous 7 days of entries when downloading each event log. Beware upping this value after has no effect on previously downloaded event logs. Set the primary table to limit entries to 7 days and the archive table to limit entries to 45 days. When you are finished, click OK. The next step is to configure a computer for event log consolidation. Page 9

10 Consolidating Event Logs From the Network view within the Navigation window, navigate to the computer of interest. Right click on the computer and select Configure Selected Computers. From the Configuration Wizard select the Logs tab and check each log you want to consolidate and archive. Next click the Consolidation tab. The consolidation tab enables you to specify a filter to apply prior to storing downloaded log entries. Please note all entries that pass the consolidation filter are stored while the entries that do not pass the filter are bypassed. Using consolidation filters can greatly decrease the amount of disk space required to store event log entries. Specify a schedule to download your logs. We suggest an hourly schedule for domain controllers and daily schedules for servers or workstations with little load. When you are finished click the Close button and save your changes. By default newly configured event logs are automatically downloaded. Using the download options we set earlier we will only see the last 7 days of entries within Network Event Viewer, however; after the software runs for 8 days, you will see 7 days of entries within the primary event log and 1 day of entries within the archived event log. The screen shot below shows you how the primary and archived event logs display within Network Event Viewer: Archiving the Archive Event Log Entries This statement sounds odd, however; this is exactly what we are going to do. When you are consolidating logs for 500+ computers or are required to store domain controller security event log entries for 1 year you should archive off the archive tables every days. In the following steps we will show you how to backup the database archive tables every month, restore the backed up archive tables to an alternate database, configure Network Event Viewer to display the archive tables contained within the alternate database, and lastly delete the archive tables from the primary database and delete the primary tables from the archive database. Backing up the Archive Tables Before we get started let s turn off the Network Event Viewer service to prevent the service from locking the database and updating tables while we archive off the event log entry tables. From Network Event Viewer select Service -> Stop Service. Open Microsoft SQL Server Management Studio, connect to your database server and navigate to the nev Page 10

11 database. Right click on the nev database and select Tasks -> Back Up. Under the Destination group box click the Add button and specify c:\temp\nev.bak. Click OK to execute the backup procedure. Restoring the Backed Up Archive Tables to an Alternate Database Open Microsoft SQL Server Management Studio, connect to your database server and navigate to the Database node. Right click on the Database node and select New Database. In the Database name text box type nevtutorial and click OK. Once the database has been created click the New Query toolbar button. Paste the following script into the query window and execute. RESTORE DATABASE [nevtutorial] FROM DISK = N'C:\Temp\nev.bak' WITH FILE = 1, MOVE N'nev' TO N'C:\Program Files\Microsoft SQL Server\MSSQL.1\MSSQL\Data\nevtutorial.mdf', MOVE N'nev_log' TO N'C:\Program Files\Microsoft SQL Server\MSSQL.1\MSSQL\Data\nevtutorial_log.ldf', NOUNLOAD, REPLACE, STATS = 10 Configuring Network Event Viewer to Display the Backed Up Database Open Network Event Viewer and select Options from the Tools menu item. Select the Auxiliary Data Sources tab. Click the new data source button, in the Name text box type nevtutorial and click OK. Specify the host, database and username and password to connect to the new database. When you are finished click the Test button to verify the connection settings are valid. Click the Apply button to save the settings and close the dialog. Please see following screen shot for your reference: Page 11


12 Select the Downloaded Logs view within the Navigation window. You should now see a new node called nevtutorial. Expand the node. You should see both the primary logs and the archived logs as shown in the following screen shot: Page 12


13 Deleting the Archive Tables from the Primary Database and the Primary Tables from the Archive Database Wow that s a mouthful but this is exactly what we are going to do. Up to now we have created a full backup and restored it to an alternate database. You don t necessarily need all this data since some of it is duplicated. The primary database duplicates the archive found in the archive database while the archive database duplicates the primary tables contained in the primary database. Select the Downloaded Logs view within the Navigation window. Check the Archive node found at the root level. Expand and check the nevtutorial node. Next un-check the Archive node found under the nevtutorial node as seen in the following screen shot: Page 13

14 Now that you have checked the archive tables within the primary database and the primary tables within the archive database, select Delete from the Edit menu item. Page 14

15 Testing the Archive Function If you would like to see how the archive function works without waiting up to 2 months please follow these steps. Assumptions In this section of the tutorial we will assume you are using the file system to store your event logs although we highly recommend you use a database for performance reasons. Steps Delete all downloaded logs from the Downloaded Logs view within the Navigation window. Select Options from the Tools menu item and set the following options: Limit initial downloads to the previous 365 days. Limit downloaded log files to the 365 days. Deselect the archive option. Download an event log other than the domain controller s security event log. Once the download is complete, restore the download options to: Limit initial downloads to the previous 7 days. Limit downloaded log files to the 30 days. Check the archive option and limit archive log files to 365 days. Once you have restored the download options, without deleting the previously downloaded event log, re-download the event log. This will cause the archive function to run. Once complete, navigate to the Downloaded Logs tab within the Navigation window. You should now see your primary event log files under a logical group as well as a new node called Archive. The archive node should contain event log entries older than 30 days. The screen shot below shows you how the primary and archived event logs display within Network Event Viewer: Page 15

16 How To: Get Notified when Specific Events Occur Network Event Viewer offers 3 different methods for receiving event notification: Real-Time Immediately after a scheduled download Using our scheduled report function Real-Time Real-Time monitoring enables you to receive notification immediately after an entry is written to an event log. Use real-time monitoring when a mission critical system must be monitored for critical event log entries. Over use of real-time monitors may degrade system performance. Real-time monitors do not store event log entries to the event log repository. You must schedule downloads to store event log entries to the event log repository. For more information see: Monitor an Event Log in Real-Time Configuration Wizard Scheduled Downloads Scheduled downloads provide two major functions. First, event log entries are consolidated to the event log repository. Second, event log entries are filtered and actions applied. For example, all newly downloaded error event log entries can be ed to the system administrator. Apply filters to scheduled downloads when you want a single for each event log downloaded at the time of the download. For more information see: Monitor an Event Log during Consolidation Configuration Wizard Scheduled Reports Scheduled reports enable system administrators to data mine already downloaded event log entries and send a single that contains the entries of interest. For example, users can create a daily report that contains all error messages from the previous day on all the domain controllers. If ing a report, the contents can be merged into a single table, grouped by host, grouped by host and log, grouped by log, or grouped by log and host. For more information see: Reports and Views Receive a Daily Count of Specific Entries Page 16


17 How To: Monitor an Event Log in Real-Time Real-Time monitoring enables System Administrators to receive notification of an event immediately after the corresponding entry is written enabling immediate problem resolution. In this tutorial we will walk you through the process of configuring an event log for real-time monitoring and notification. Step 1: Select the computer to monitor From the Network view within the Navigation view navigate to the computer of interest. Right click on the computer and select Configure Selected Computers. To select multiple computers simply check the box to the left of each computer you want to include in the real-time monitor configuration. The Configuration Wizard will now load and automatically select the Computers tab. You should see a list of all the computers you selected: Step 2: Select the event log to monitor Select the Logs tab. Check the logs you would like to monitor. Note: If you are re-configuring a computer event logs may already be checked. If so, do not un-check them otherwise you may stop the service from automatically downloading the event logs. Page 17


18 Step 3: Enable real-time monitoring and apply filters and actions Select the Real-Time tab. Check the Enable real-time monitoring option. Apply at least one filter and action. If you require different actions for different events, create and apply a filter for each scenario and assign the appropriate action to each applied filter. Note: Use the Computers and Logs combo boxes at the top of the Wizard to fine tune each event log monitor. Page 18


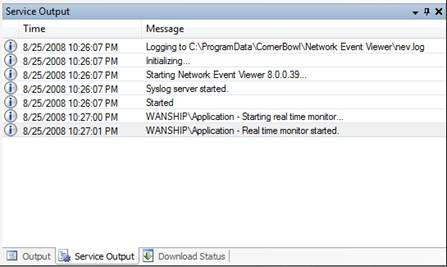
19 Step 4: Save your changes Lastly, click the Close button and save your changes. Step 5: Verify the real-time monitor starts Once you have closed the Configuration Wizard from the View menu item select Windows followed by Service Output. Within a one minute time period a message will appear for each new real-time monitor you configured stating either the monitor started or there was an error when attempting to subscribe to the event log. If an error is displayed please see the Troubleshooting section to aid in resolving the issue. If the monitor starts successfully you should see the following output: Page 19

20 Page 20

21 How To: Monitor an Event Log during Consolidation From the Network view within the Navigation window, navigate to the computer of interest, right click on the computer and select Configure Selected Computers. The Configuration Wizard will load with the Computers tab selected. Select the Logs tab. From the Logs tab, select or type a logical group to place the configuration under and check each log to consolidate. Page 21
22 Once you are finished click the Next button. From the Consolidation tab, click the Schedule button and specify the frequency to download the remote event logs. Page 22

23 Once you are finished click the Next button. From the Actions tab, assign the filters and actions to apply. We always suggest users verify their filters work prior to assigning actions. To verify a filter works, first download the remote event log then from the Downloaded Logs view within the Navigation window, display the log. When prompted to apply a filter, select your filter. Page 23

24 When you are finished click the Close button as save your changes. Page 24
25 How To: Receive a Daily Count of Specific Entries Overview In this tutorial we will show you how to create a daily report that lists the count of duplicate entries. Background There are 2 different methods to create a daily report. First, you can schedule a download for once a day, apply a filter, assign an action, and configure the frequency detection parameters. The second method is to schedule daily or hourly downloads and run a daily report against the consolidated event log entries. We suggest the later method because you are able to isolate the report to a single day. That is when downloading entries the download picks up where it last left off. For example, if you configure the download to occur at 1:00 AM the download will filter entries from 1:00 AM the previous day to 1:00 AM today. In this scenario, the generated or file output will contain these entries rather than the entries from 12:00 AM the previous day to 12:00 today. This tutorial will show how to create a daily report. Creating a daily report requires you to schedule a log for automatic download, create a filter for each entry of interest, and lastly create a report to query and filter the event log entries. Configuring an Event Log for Daily Downloads From the Network view within the Navigation window, navigate to the computer of interest. Right click on the computer and select Configure Selected Computers. From the Configuration Wizard select the Logs tab and check each log you want to download. Next click the Consolidation tab. The Consolidation tab enables you to specify a filter to apply prior to storing downloaded log entries. Please note all entries that pass the consolidation filter are stored while the entries that do not pass the filter are bypassed. Using consolidation filters can greatly decrease the amount of disk space required to store event log entries. Specify a schedule to download your logs. We suggest an hourly schedule for domain controllers and daily schedules for servers or workstations with little load. For this tutorial please schedule the download to run daily at 1:00 AM. Select the Verify tab and check the Download logs now option. When you are finished click the Close button and save your changes. Creating a Filter From the Downloaded Logs view within the Navigation window navigate to one of the logs just downloaded. Right click on the log and select Display Log. Once displayed, locate an entry you want to include within the daily report, right click and select Filter Selected Event. From the Filter Selected Event dialog specify a name to provide the new filter and click the Create and Review Criteria button as seen in the following screen shot: Page 25

26 A filter will be automatically created that includes criteria for the message, event type, source, category, event ID, and user. Once create, the Filters dialog will display as shown: Double-click on the criteria to load the Modify Event Filter dialog. Please review the criteria and clear out any fields you do not want to include within the criteria. In our sample criteria we removed the majority of the message content as it contained date and time information. Please see the screen shot below: Page 26

27 When you are finished modifying the criteria, click the OK button. When you are finished reviewing the filter, click the Select Filter button. Verify the view is updated to show only those entries you want to sum within the daily report. Create as many new filters as necessary to cover all entries you want to include within the daily report. Creating a Daily Report to Count Specific Entries Select New Report from the File menu item and select the Computers tab. From the Computers tab specify a name, select Frequency Detection within the Report type combo box and lastly add the computers to include within the report. Here s what your options should look like: Page 27

28 Select the Logs tab and check each log to include within the report. Please note only logs already downloaded are listed. Using the Schedule tab specify a daily schedule. For this tutorial please specify daily at 4:00 AM. Select the Filters tab and assign the filters to apply to the report. After you assign each filter, select the filter within the Assigned Filters list box. Once selected, configure the filter to pass entries when they occur more than 0 times per day. Please see the sample screen shot below: Click either the Next button or the Actions tab. You should be prompted with the following warning notifying you the applied filter does not contain time based criteria: The Report Wizard is letting you know this report will search all entries previously downloaded rather than entries within a specific date range, for example yesterday. We only want to search yesterday s entries so click No. To assign time based criteria we will copy the current filter and then add the time period to the new filter. Click on the filters button (the button with the screwdriver and funnel). Once the Filters dialog loads, click the Copy button and specify a new name. We simply appended Yesterday to our name. When you are Page 28

29 finished, click OK. From the Filters dialog double-click the criteria. In the Time combo box select Yesterday. Please see the sample screen shot below: When you are finished, click OK. From the Filters dialog box click Select Filter. You should now see both filters listed within the Assigned Filters list box. Remove the original filter by simply double-clicking on it. Select the new filter and re-configure the filter to pass entries when they occur more than 0 times per day. When you have finished your configuration screen should look something like the following: Page 29

30 Lastly, configure the report to the responsible parties. Delimit multiple addresses with a semicolon, comma, or space. Please see the sample screen shot below: When you are finished click the Close button and save your new report. Network Event Viewer is now configured to send you a daily that lists the last entry that matches each filter along with a count of all other entries that passed the same filter within the same day. Page 30

31 How To: Consolidate Logs to SQL Server 2005 In this tutorial, we walk you through the process of configuring SQL Server Once completed, we will configure Network Event Viewer to use SQL Server as its event log repository. Lastly, we will download logs to the SQL Server database and verify entries were written to the database. Step 1: Create the database and user login From the Start menu, navigate to the Microsoft SQL Server 2005 shortcut folder and select SQL Server Management Studio and login to your database server. From the left pane called the Object Explorer, right click on Databases and select New Database. Specify nev in the Database name text box. When you are finished you should see the following: From the Object Explorer right click on Security and select New Login. Specify the nevuser in the Login name text box. Select SQL Server authentication. Specify a password. Deselect Enforce password policy. In the Default database combo box select nev. When you are finished you should see the following: Page 31

32 From the Object Explorer expand Databases\nev. Right click on Security and select New User. Specify the nevuser in the User name text box. Specify the nevuser in the Login name text box. From within the Database Role Membership list check db_owner. When you are finished you should see the following: Page 32

33 You have now created the database and assigned login credentials. Step 4: Initialize SQL Server to work with Network Event Viewer Open Network Event Viewer, select Options from the Tools menu item and then select the Database tab. Under Database type select SQL Server. Specify the host, database, username and password to use. Verify Windows Authentication Mode is deselected. After you have entered the connection information, click the Initialize button. If you receive an access denied error, please check the credentials and try again. When you clicked the Initialize button Network Event Viewer should have created 4 tables. They are: Table host_log type filter_action_event version Description Contains a list of all available logs. Contains a list of the event types (Information, Warning, Error, Success Audit, and Failure Audit). Contains all entries that pass assigned filter criteria during a download. Contains database version information used for upgrade purposes. The first time Network Event Viewer downloads a computer s logs, a table is created for each host and log combination with the following format: Page 33
34 [host]_[log] For example: yourservername_application Step 5: Configure Network Event Viewer to store logs to SQL Server Once initialized, select the Download tab. Under the Event Log Repository section, select Save downloaded entries to a database. To limit log tables to a date range, select Remove entries older than (x) days from the database. All entries older than the configured date are automatically removed prior to every download. If you are required to store entries for a year, for example, you should archive entries to an archive table. The archive option enables the software to quickly load the tip of log files. When review of older entries is necessary, you can view archived logs via the Downloaded Logs view. To save entries removed from the primary table to an archive table, select Archive removed entries. Lastly, specify the number of days to retain entries within the archive table. Please note, any previously downloaded logs are not converted and written to SQL Server. If you need to review your already downloaded logs and do not want to re-download, you can add the file system log repository as an auxiliary data source. For more information see Auxiliary Data Sources. Step 6: Test and verify the configuration From the Navigation view within Network Event Viewer, select the Network tab. Navigate to a server, highlight the Application log, and select Download and Display Selected Log. The log should download and display in the viewer. Go back to your Microsoft SQL Server Management Studio, from the Object Explorer view expand Databases\nev\Tables. Select the Tables tree node. You should now see a new table called [servername]_application where [servername] is the name of the server you downloaded the logs from. If you see this table, you have successfully completed this tutorial. Page 34
35 How To: Consolidate Logs to MySQL In this tutorial, we walk you through the process of downloading, installing and configuring MySQL. Once completed, we will configure Network Event Viewer to use MySQL as its event log repository. Lastly, we will download logs to the MySQL database and verify entries were written to the database. Step 1: Download the MySQL Community Server MySQL can be downloaded from the MySQL web site located at: Choose the Pick a mirror link next to either: Windows ZIP/Setup.EXE (x86) Windows ZIP/Setup.EXE (AMD64 / Intel EM64T) When prompted to create an account or login, click the No thanks link at the bottom of the page. Click a link from one of the mirror sites. When prompted click the Run button. The installation will automatically begin. Follow the instructions selecting all default options. Step 2: Download the MySQL GUI Tools The GUI Tools include the administrator which we will use later to setup your database. The link t other the installation is located at: Choose the Pick a mirror link next to: Windows (x86) When prompted to create an account or login, click the No thanks link at the bottom of the page. Click a link from one of the mirror sites. When prompted click the Run button. The installation will automatically begin. Follow the instructions selecting all default options. Step 3: Create the database and user login From the Start menu, navigate to the MySQL shortcut folder and select MySQL Administrator. Login with the credentials you specified during setup. Please note the initial username is root not sa. From the top left pane, select Catalogs. From the bottom left pane, right click in the Schemata list window and select Create New Schema. Specify nev in the schema name text box. When you are finished you should see the following: Page 35

36 From the top left pane, select User Administration. From the right pane, select Add new user. Specify nevuser in the MySQL User text box and specify a password. Click the Apply changes button. When you are finished you should see the following: Page 36

37 From the right pane, select the Schema Privileges tab. Select the nev database. Click the << button followed by the Apply changes button to add and then apply the privileges. Please note the left pane contains the assigned privileges rather than the right pane. When you are finished you should see the following: Page 37

38 You have now created the database and assigned login credentials. Step 4: Initialize MySQL to work with Network Event Viewer Open Network Event Viewer, select Options from the Tools menu item and then select the Database tab. Under Database type select MySQL. Specify the host, database, username and password to use. After you have entered the connection information, click the Initialize button. If you receive an access denied error, please check the credentials and try again. When you clicked the Initialize button Network Event Viewer should have created 4 tables. They are: Table host_log type filter_action_event version Description Contains a list of all available logs. Contains a list of the event types (Information, Warning, Error, Success Audit, and Failure Audit). Contains all entries that pass assigned filter criteria during a download. Contains database version information used for upgrade purposes. The first time Network Event Viewer downloads a computer s logs, a table is created for each host and log combination with the following format: [host]_[log] For example: yourservername_application Page 38
39 Step 5: Configure Network Event Viewer to store logs to MySQL Once initialized, select the Download tab. Under the Event Log Repository section, select Save downloaded entries to a database. To limit log tables to a date range, select Remove entries older than (x) days from the database. All entries older than the configured date are automatically removed prior to every download. If you are required to store entries for a year, for example, you should archive entries to an archive table. The archive option enables the software to quickly load the tip of log files. When review of older entries is necessary, you can view archived logs via the Downloaded Logs view. To save entries removed from the primary table to an archive table, select Archive removed entries. Lastly, specify the number of days to retain entries within the archive table. Please note, any previously downloaded logs are not converted and written to MySQL. If you need to review your already downloaded logs and do not want to re-download, you can add the file system log repository as an auxiliary data source. For more information see Auxiliary Data Sources. Step 6: Test and verify the configuration From the Navigation view within Network Event Viewer, select the Network tab. Navigate to a server, highlight the Application log, and select Download and Display Selected Log. The log should download and display in the viewer. Go back to your MySQL Administrator, select Catalogs from the upper left pane, and select the nev schemata from the lower left pane. You should now see a new table called [servername]_application where [servername] is the name of the server you downloaded the logs from. If you see this table, you have successfully completed this tutorial. Page 39

40 How To: Search the network for specific log entries? In this sample, we show you how to view multiple logs within the same view, limit the entries in the view with a single click of the mouse, find and mark specific entries, and lastly, create view filters removing noise from the view. Step 1: Identify the computers you want to search for the entries of interest. Once identified, select the Network view from within the Navigation view. Step 2: Navigate to the first computer of interest. Click on the computer name. When clicked, all available logs are displayed beneath the computer. Select the corresponding logs for each computer of interest. Page 40

41 Step 3: When you have finished selecting logs, click the Download toolbar button. Each log receives it s own thread enabling multiple logs to be downloaded simultaneously. The status of each thread is posted to the Download Status view. Expand each node to see the status of the thread. When all threads have completed, the log contents are automatically displayed. Page 41
42 Step 4: Now that the logs have been downloaded, you are ready to search for specific entries. Note: Log entries are displayed in pages. By default each page contains 3 days worth of logs. You have three search options to choose from: Search with the aid of Quick Filters Use the Find dialog to specify search criteria and move through each item or mark all the items at once. Create and apply a filter limiting the view to entries that match your filter criteria. Quick Filters Quick Filters enable you to quickly limit the entry list based on event type and log file. Quick Filters include event types and a list of logs contained within the current computer and log selection. By default, Warning, Error, and Failure Audit entries are displayed while Information and Success Audit are hidden from view. Use the toolbar entry type and log buttons to update the Quick Filters one at a time, or use the Quick Filter dialog to update multiple Quick Filter settings at once. To open the Quick Filter dialog, select Quick Filter from the Filters menu item. Select the event types and logs to include. When you close the Quick Filter dialog, the event type and log toolbar buttons you selected are now selected. Once you have set the Quick Filters to your liking, simply scan the entries. Please note, Quick Filters are always applied and override any selected Filters. The screen shot below shows all available Quick Filter settings in a selected state on the toolbar: Find Dialog The Find dialog is probably the easiest and fastest way to search for specific entries. Simply press Ctrl-F. The Find dialog displays enabling you to specify the search criteria and iterate through each entry that matches your search criteria. The sample screen shot below, searches the security log on the havoc computer for all login activity by testuser1. Pressing F3 searches until the next entry is found. Clicking Mark Page 42
43 All, highlights all matches within the current page. Please note, the Find dialog only searches entries that have already passed the Quick Filters. Create and Apply Filter Criteria Filters enable you to save and re-apply your search criteria with a single click of the mouse. The following section walks you through creating and applying a filter to show all login activity for a specific user. Open the Filter dialog by clicking Filter from the Filters menu item. The following dialog will display. Click the Add button and specify the name to assign to the filter. In this case, All Login Activity - testuser1. Click OK to accept the name. The Filters dialog now contains the new filter. Page 43

44 Create filter criteria by clicking, Add Criteria. De-select the Information, Warning, and Error event types. In the Log combo box, type Security. In the Category text field, type Logon/Logoff. In the User text field, type havoc\testuser1. Click OK to accept the criteria. The Filter Criteria list view now displays the new criteria. The filter is now complete. Click Select Filter, to close the dialog and automatically apply the filter to the current view. Page 44

45 Note: When viewing logs, make sure you have the appropriate Filter and Quick Filter applied. The most common reason administrators do not see entries of interest are because the Quick Filter has overridden the applied Filter. For example, in the sample above, de-selecting the Success Audit Quick Filter toolbar button would render the view empty. Page 45
46 How To: Print Logs for Auditors Overview In this tutorial we will show you how to print log entries for auditors. When you are finished with this tutorial you will know how to query a log for a specific time range, print log content, and customize print output. Assumptions This tutorial assumes you have already downloaded event log entries. How does Printing Work? The Network Event Viewer print function works by taking the entries you have displayed in the viewer, exporting them to a temporary HTML file and then opening the file in your Internet browser. You then use your Internet browser to print the log entries. Displaying Event Log Entries From the Navigation view select Downloaded Logs. Check each log you want to print. Right click and select Display Logs. When prompted, select all event types and clear the filter. Once the viewer displays the event log entries, you have the option of printing the current page or navigating to a specific date and then printing that page. Use the Days per page text box in the upper right corner of the viewer to increase or decrease the number of days displayed. If you are unable to limit the displayed entries to the date range of interest you must create and apply a date range filter. Creating a Date Range Filter Select Configure Filters from the Filters menu item. From the Filters dialog click the New button. Specify a name for the filter and click OK. Click the Add Criteria button. Select Specify time from the Time combo-box. Check the After and Before check boxes and specify the date for each. When you are finished click OK. From the Filters dialog click the Select Filter button. The viewer will now apply the filter to the view. Once complete, use the Days per page text box to increase the number of days to encompass all entries that pass the new filter. For example, if your filter only shows entries for the previous month, specify 90 days. The viewer will show all entries for the last 90 days on the first page. I chose 90 days instead of 30 or 60 for 2 reasons. In the case of 30 days, the viewer would show the previous 30 days of entries rather than the previous month. In most cases the viewer would split the previous month s entries to 2 pages. If I selected the previous 60 days and today s date was March 31 st (but our filter is for April 1st-30 th ) entries on April 1 st would not show on the same page. So to be safe, I set the Days per page to 90 days. To summarize, I m configuring the viewer to display all entries that pass the filter on the first page. Page 46
47 Printing the Current Page From within the event log entry view, right click and select Print Current Page. When prompted to specify the HTML template click OK. The viewer will export the log to HTML and display it within your browser. Use your Internet browser to print the event log entries. Customizing the Output If you want to customize the output you will need to change the HTML template. An example of a typical modification is to remove the message from the output. Select Options from the Tools menu item. Select the Mail and HTML Template tab. At the bottom of the dialog select the text within the Current view template text box and press Ctrl-C. Using Notepad, select Open from the File menu time. Paste the previously copied filename into the open dialog and click OK. Select Save As from the File menu item. When prompted to specify a name, type view_summary.html. Select Replace from the Edit menu item. Search for {MESSAGE} and replace with an empty string. Select Save from the File menu item and close Notepad. From within Network Event Viewer, select Print Current Page from the File menu. When prompted to specify the HTML template, specify the new file you just created and click OK. The viewer will export the log to HTML and display it within your browser. Use your Internet browser to print the event log entries. Page 47
48 Licensing Corner Bowl Software offers 6 different licenses: Desktop This license allows you to install the software on a single workstation and manage Event Logs on 20 computers. Please note, this license can not be installed on a Windows Server operating systems, however; the software can still remotely manage Windows Server computers. Server This license allows you to install the software on a single server or workstation and manage Event Logs on 50 computers. Unlimited This license allows you to install the software on a single server or workstation and manage Event Logs on an unlimited number of computers. 5 Pack Includes 5 Unlimited licenses enabling your organization to load balance, install Network Event Viewer on alternate networks or on various systems administrators' computers. Enterprise Includes 20 Unlimited licenses and includes an additional year of support and updates for a total of 2 years of support and updates. Single Server This license allows you to install the software on a single server or workstation and manage local Event Logs only. Support and Maintenance Your purchase of Network Event Viewer includes: and phone support for 1 year. Product updates for both maintenance builds and major releases for 1 year. In addition, annual maintenance contracts can be purchased for 50% the original list price. Page 48
49 Registration To register your software, visit and purchase a license. Once purchased, we will automatically you a license key. After you receive your license key, select Register from the Help menu item. When prompted, specify the address the license key was ed to and the license key. Click Submit. Our software will transmit the address, license key, and the active IP address s MAC address to our registration web service running on our web server. Once verified a digitally signed license file will be transmitted back to you. This file will automatically be saved to your program data directory. Licenses can be transferred to another computer upon request. Page 49
50 Update Service All or our software supports automatic updates. At startup, each of our user interfaces downloads an XML file from our web server. Using version information, our software determines if an update is necessary. License information may be transmitted to our registration web service, also running on web server, to determine upgrade eligibility. If eligible, our software will download the latest version from our web server. Each license comes with access to updates and major releases for 1 year. After that, you can purchase a maintenance contract that provides you access to updates and major releases for 1 more year. Page 50
51 About Corner Bowl Software Who We Are Corner Bowl Software is a privately held company located in Park City, Utah, USA. We have been developing and selling software specifically for Information Technology professionals for over 7 years now. Our products are designed, developed, and continually updated in direct response to user feedback. All of our software tools are developed and supported in Park City. Our Software Corner Bowl Software offers 4 distinct software tools that enable System Administrators to monitor and maintain their servers and workstations. We offer event log, text log, and syslog management applications as well as disk monitoring and server monitoring software tools. Our oldest and most popular applications are our event log management and disk monitoring applications (Network Event Viewer and SMART Disk Monitor). Both our text log and server monitoring tools (Text Log Monitor and Internet Server Monitor) are relatively new and quickly gaining traction. We welcome you to evaluate our software tools and very much appreciate feedback enabling us to update our applications to meet your demanding needs. Development Cycles Corner Bowl Software prides itself on producing high quality usable software that utilizes the latest user interface components. We receive feature requests on a daily basis and in response have implemented a development system that enables us to quickly add, test, and release new features. Over the years, we have worked closely with System Administrators during Sarbanes Oxley compliance audits providing them with new features that enable them to more quickly respond to auditor requests. How to Contact Us Our Address Corner Bow l Softw are PO Box Park City, Utah 84068, USA Support Inquiries support@cornerbowl.com Phone: Sales Inquiries sales@cornerbowl.com Phone: Page 51
52 Troubleshooting Network Event Viewer uses a Microsoft technology known as WMI to access the logs on your networked computers. The most common error reported by the operating system for WMI problems are: The RPC server is unavailable Access Denied We have found it is beneficial to tell customers to first verify the connection or access failure from within the WMI Control Panel on the computer Network Event Viewer is installed. Connecting to a remote computer within the WMI Control Panel From the run menu or a command-prompt, type: wmimgmt.msc. This command will open the WMI Control Panel within the Microsoft Management Console (MMC). Right click on the WMI Control (Local) node located in the left pane. Select Connect to another computer. If running on an OS prior to Windows Vista, you have the option to specify credentials. If running on Vista, you no longer have this option. Specify credentials as necessary. Lastly, click OK. Once the dialog closes, right click on the WMI Control node again and select Properties. Most users will receive the RPC server is unavailable or access denied error at this point. The RPC Server is Unavailable Typically an RPC error means the remote computer is not allowing WMI packets through its firewall or the remote computer does not allow remote administration. The Windows firewall, a third party firewall, or virus protection software can all block WMI packets. At this point if you think the remote computer s Windows firewall is blocking WMI packets or remote administration is not enabled, please follow this link for more information: Configuring the Windows XP Firewall Otherwise, please continue reading the sections labeled Access Denied and Other Things to Look At below. If you are still unable to resolve the error, please read the following MSDN articles: Connecting to WMI on a Remote Computer Connecting to WMI Remotely Starting with Vista Connecting Through Windows Firewall Access Denied Typically an access denied error means the account you are logged in under or the account the Windows Service is running under does not have the appropriate credentials to access the log files. 1. If reading logs from another computer on the network, make sure that the account you are logged in as and the account the service is running under both have administrative privileges. For more information see Security. If the account you are logged in does not have administrator rights or you are attempting to access a computer not on the domain, you must map the computer to specify the appropriate credentials. For more information see Mapping Computers. 2. Ensure WMI permissions have been set correctly. From the remote computer throwing the error, open a command-prompt and type: wmimgmt.msc. Right click on the WMI Control (local) node and select Properties. Select the Security tab and navigate to root/cimv2. Click the Security button. Grant the account you and the service are using to access logs Remote Enable and Read Security rights. 3. If access is denied to a Windows Server 2003 log, grant the account you are logged in as and the account the service is running under access to each event log. For more information read the following MSDN article: 4. When accessing a Windows Vista computer that has joined a workgroup rather than a domain, the remote Windows Vista computer must disable User Access Control (UAC). To disable UAC on a Windows Page 52
53 Vista computer, search for Turn UAC off within the Windows help system. Other Things to Look At 1. If you have other internal firewalls on your network, you may need to configure them to allow WMI packets. Many virus protection solutions such as McAfee and Symantec contain their own firewalls which must be configured to allow WMI packets. 2. If the remote computer is running Windows XP Pro, make sure remote logons are not being coerced to the GUEST account. From the computer you are unable to download logs from, open a command-prompt and type secpol.msc. Expand the Local Policies node and select Security Options. Scroll down to the setting titled Network access: Sharing and security model for local accounts. If this is set to Guest only, change it to Classic and restart your computer. 3. From the computer you are unable to download logs from, open a command-prompt and type dcomcnfg. Expand the Component Services/Computers/My Computer node. Right click My Computer and then select Properties. Select the COM Security tab. From the Launch and Activation Permissions, select Edit Limits. Add the appropriate account and assign all permissions. 4. Check that DCOM is enabled on both the local and the remote computer. Check the following registry value on both computers: Key: HKLM\Software\Microsoft\OLE, value: EnableDCOM, should be set to 'Y' 5. Check that WMI is installed on both the local and remote computer. WMI is present by default in all flavors of Windows 2000 and later operating systems, but must be installed manually on NT4 systems. To check for the presence of WMI, open a command-prompt and type wbemtest. If the WMI Tester application starts up, WMI is present, if not, it must be installed. Consult Microsoft for more information. 6. Make sure no remote access or WMI-related services have been disabled on either the local or remote computer. On an XP machine, the following services should be running or enabled: COM+ Event System Remote Access Auto Connection Manager Remote Access Connection Manager Remote Procedure Call (RPC) Remote Procedure Call (RPC) Locator Remote Registry Server Windows Management Instrumentation Windows Management Instrumentation Driver Extensions WMI Performance Adapter Workstation For more information, see: Security Mapping Computers Configuring the Windows XP Firewall Connecting to WMI on a Remote Computer Connecting to WMI Remotely Starting with Vista Connecting Through Windows Firewall Page 53
54 Security To access remote logs from the user interface, your login must have domain administrator rights. If your account does not have domain administrator rights, you can map a computer and specify login credentials that enable you to read remote security logs. For more information see Mapping Computers. When scheduling the service to download, real-time monitor, and clear remote logs, the service must be run with domain administrator rights. The first time the application is run, you will be prompted to assign domain administrator rights to the service. When the password assigned to the account the service is running under changes you must update the service to use the latest password. For more information see Change Service Login. Network Event Viewer uses a Microsoft technology known as WMI to access the logs on your networked computers. The most common error reported by the operating system for WMI problems are: The RPC server is unavailable Access Denied For more information see Troubleshooting. For more information, see: Change Service Login Mapping Computers Troubleshooting Page 54
55 Configuring the Windows XP Firewall Windows XP service pack 2 (SP2) and later include an improved version of the Windows Firewall which is now enabled by default. In its default configuration, the Windows Firewall prevents access to event logs from across the network. This will typically be reported by Network Event Viewer as "access denied". In order to restore access, you'll have to configure the firewall on your XP SP2 computers to allow remote administration via Windows Management Instrumentation (otherwise known as WMI). The simplest way to do this is to open up a command prompt and type the following: netsh firewall set service RemoteAdmin The effect is immediate and there is no need to restart. To read more about this, consult the following Microsoft article: If you are still unable to download or monitor remote logs see Troubleshooting. For more information, see: Security Troubleshooting Page 55
56 Technical Support If you have any problems with Network Event Viewer you can contact our tech support by ing us at: Please make sure you tell us as much information as you can about the problem you are experiencing, including any error or warning messages that may have been displayed. Please include the following information with all support requests: The version you are running. This information can be obtained from the About box. The nev.log' file. This file is located in the installation directory. The default location is: o o Window XP/Server 2003/2000: '\documents and settings\all users\application data\cornerbowl\network Event Viewer\nev.log Windows Server 2008/Windows Vista: \programdata\cornerbowl\network Event Viewer\nev.log The operating system version. If applicable, your license key. Description of your problem. Please provide as much information as possible so we can reproduce the problem if necessary. We ll try to help you as fast as possible, usually in one or two business days. If you have any comments or suggestions for the next releases, please feel free to post them to us. Contact Information Website: Phone: support@cornerbowl.com 1-(866) (TOLL FREE) Page 56
57 User Interface Components The Network Event Viewer user interface is made up of several views that enable you to browse the network, map computers, configure logs, view logs, view events that have passed assigned filter criteria, and view application, download, and service status messages. Navigation The Navigation view contains the Network, Configured Computers, Downloaded Logs, and Filter Action Events views. Network This window enables you to navigate your network and browse event logs. From this view, you can: Select a log to immediately download and view the contents. Select a log to view the remote log properties and modify the maximum remote log size and overwrite policy. Configure download and clear schedules as well as filter actions. Check multiple logs and merge the contents. Clear remote logs. Discover and select all servers, domain controllers, SQL Servers, and/or workstations. Discover and select specific logs. Discover all domains and computers. Manually add computers that can not be discovered or require credentials other than the logged in user s credentials. Delete manually added computers. Active Directory This window enables you to navigate your Active Directory tree and browse event logs. From this view, you can do everything that is possible from the Network view plus you can configure Network Event Viewer to automatically start downloading and monitoring new computers. Configured Computers This window displays configured computers. From this view, you can: Configure download and clear schedules as well as filter actions. Download the latest entries. Check multiple computers and merge the contents of the configured and already downloaded logs. Clear remote logs. Delete configurations. When deleting a configuration, the already downloaded logs are not deleted. Downloaded Logs This window displays all downloaded logs. If saving logs to the file system, pre-pending log files, and archiving old entries an archive folder is present once entries are archived. If saving logs to the file system and backing up previously downloaded logs, a date time folder is present for each backed up log. The date and time displayed is the date and time the log was backed up rather than the date time the log was downloaded. From this view, you can: Configure download and clear schedules as well as filter actions. Download the latest entries. Select a log to view the contents. Check multiple logs and merge the contents. Export logs to CSV, EVT, HTML, XML, or TEXT. Page 57
58 logs. Clear remote logs. Delete logs from the file system or SQL Server. Filter Action Events Filter action events are events that pass assigned filter criteria during a scheduled download. These events are saved to a single file (\documents and settings\all users\application data\cornerbowl \network event viewer\fae) or database table (filter_action_events). The Filter Action Events view enables users to: Quickly view all entries associated with each or all filters. Delete entries in the filter action event cache. Reports and Views This window displays all configured reports. A report is a configured collection of downloaded logs with an optionally applied filter. Reports enable system administrators to quickly apply a filter to a set of already downloaded logs. From this view, you can: Configure and create new reports. View reports. Delete reports. Message This window displays the selected event's message. Data This window displays the selected event's binary data. Right clicking in the window enables you to select the format to view the data. Hex, ASCII, and Unicode are all available. Notes This window enables users to add notes to the selected entry. Output This window displays application status messages. Download Status This window displays all download status messages logged while downloading from within the user interface. Status messages are grouped by log, enabling you to quickly review all status messages associated with each log. Service Output The windows service writes status messages to a log file in the installation directory, \documents and settings\all users\application data\cornerbowl \network event viewer\nev.log by default. This window tails the log file and displays each status message. Page 58
59 User Interface Components The Network Event Viewer user interface is made up of several views that enable you to browse the network, map computers, configure logs, view logs, view events that have passed assigned filter criteria, and view application, download, and service status messages. Navigation The Navigation view contains the Network, Configured Computers, Downloaded Logs, and Filter Action Events views. Network This window enables you to navigate your network and browse event logs. From this view, you can: Select a log to immediately download and view the contents. Select a log to view the remote log properties and modify the maximum remote log size and overwrite policy. Configure download and clear schedules as well as filter actions. Check multiple logs and merge the contents. Clear remote logs. Discover and select all servers, domain controllers, SQL Servers, and/or workstations. Discover and select specific logs. Discover all domains and computers. Manually add computers that can not be discovered or require credentials other than the logged in user s credentials. Delete manually added computers. Active Directory This window enables you to navigate your Active Directory tree and browse event logs. From this view, you can do everything that is possible from the Network view plus you can configure Network Event Viewer to automatically start downloading and monitoring new computers. Configured Computers This window displays configured computers. From this view, you can: Configure download and clear schedules as well as filter actions. Download the latest entries. Check multiple computers and merge the contents of the configured and already downloaded logs. Clear remote logs. Delete configurations. When deleting a configuration, the already downloaded logs are not deleted. Downloaded Logs This window displays all downloaded logs. If saving logs to the file system, pre-pending log files, and archiving old entries an archive folder is present once entries are archived. If saving logs to the file system and backing up previously downloaded logs, a date time folder is present for each backed up log. The date and time displayed is the date and time the log was backed up rather than the date time the log was downloaded. From this view, you can: Configure download and clear schedules as well as filter actions. Download the latest entries. Select a log to view the contents. Check multiple logs and merge the contents. Export logs to CSV, EVT, HTML, XML, or TEXT. Page 59
60 logs. Clear remote logs. Delete logs from the file system or SQL Server. Filter Action Events Filter action events are events that pass assigned filter criteria during a scheduled download. These events are saved to a single file (\documents and settings\all users\application data\cornerbowl \network event viewer\fae) or database table (filter_action_events). The Filter Action Events view enables users to: Quickly view all entries associated with each or all filters. Delete entries in the filter action event cache. Reports and Views This window displays all configured reports. A report is a configured collection of downloaded logs with an optionally applied filter. Reports enable system administrators to quickly apply a filter to a set of already downloaded logs. From this view, you can: Configure and create new reports. View reports. Delete reports. Message This window displays the selected event's message. Data This window displays the selected event's binary data. Right clicking in the window enables you to select the format to view the data. Hex, ASCII, and Unicode are all available. Notes This window enables users to add notes to the selected entry. Output This window displays application status messages. Download Status This window displays all download status messages logged while downloading from within the user interface. Status messages are grouped by log, enabling you to quickly review all status messages associated with each log. Service Output The windows service writes status messages to a log file in the installation directory, \documents and settings\all users\application data\cornerbowl \network event viewer\nev.log by default. This window tails the log file and displays each status message. Page 60
61 User Interface Components The Network Event Viewer user interface is made up of several views that enable you to browse the network, map computers, configure logs, view logs, view events that have passed assigned filter criteria, and view application, download, and service status messages. Navigation The Navigation view contains the Network, Configured Computers, Downloaded Logs, and Filter Action Events views. Network This window enables you to navigate your network and browse event logs. From this view, you can: Select a log to immediately download and view the contents. Select a log to view the remote log properties and modify the maximum remote log size and overwrite policy. Configure download and clear schedules as well as filter actions. Check multiple logs and merge the contents. Clear remote logs. Discover and select all servers, domain controllers, SQL Servers, and/or workstations. Discover and select specific logs. Discover all domains and computers. Manually add computers that can not be discovered or require credentials other than the logged in user s credentials. Delete manually added computers. Active Directory This window enables you to navigate your Active Directory tree and browse event logs. From this view, you can do everything that is possible from the Network view plus you can configure Network Event Viewer to automatically start downloading and monitoring new computers. Configured Computers This window displays configured computers. From this view, you can: Configure download and clear schedules as well as filter actions. Download the latest entries. Check multiple computers and merge the contents of the configured and already downloaded logs. Clear remote logs. Delete configurations. When deleting a configuration, the already downloaded logs are not deleted. Downloaded Logs This window displays all downloaded logs. If saving logs to the file system, pre-pending log files, and archiving old entries an archive folder is present once entries are archived. If saving logs to the file system and backing up previously downloaded logs, a date time folder is present for each backed up log. The date and time displayed is the date and time the log was backed up rather than the date time the log was downloaded. From this view, you can: Configure download and clear schedules as well as filter actions. Download the latest entries. Select a log to view the contents. Check multiple logs and merge the contents. Export logs to CSV, EVT, HTML, XML, or TEXT. Page 61
62 logs. Clear remote logs. Delete logs from the file system or SQL Server. Filter Action Events Filter action events are events that pass assigned filter criteria during a scheduled download. These events are saved to a single file (\documents and settings\all users\application data\cornerbowl \network event viewer\fae) or database table (filter_action_events). The Filter Action Events view enables users to: Quickly view all entries associated with each or all filters. Delete entries in the filter action event cache. Reports and Views This window displays all configured reports. A report is a configured collection of downloaded logs with an optionally applied filter. Reports enable system administrators to quickly apply a filter to a set of already downloaded logs. From this view, you can: Configure and create new reports. View reports. Delete reports. Message This window displays the selected event's message. Data This window displays the selected event's binary data. Right clicking in the window enables you to select the format to view the data. Hex, ASCII, and Unicode are all available. Notes This window enables users to add notes to the selected entry. Output This window displays application status messages. Download Status This window displays all download status messages logged while downloading from within the user interface. Status messages are grouped by log, enabling you to quickly review all status messages associated with each log. Service Output The windows service writes status messages to a log file in the installation directory, \documents and settings\all users\application data\cornerbowl \network event viewer\nev.log by default. This window tails the log file and displays each status message. Page 62
63 User Interface Components The Network Event Viewer user interface is made up of several views that enable you to browse the network, map computers, configure logs, view logs, view events that have passed assigned filter criteria, and view application, download, and service status messages. Navigation The Navigation view contains the Network, Configured Computers, Downloaded Logs, and Filter Action Events views. Network This window enables you to navigate your network and browse event logs. From this view, you can: Select a log to immediately download and view the contents. Select a log to view the remote log properties and modify the maximum remote log size and overwrite policy. Configure download and clear schedules as well as filter actions. Check multiple logs and merge the contents. Clear remote logs. Discover and select all servers, domain controllers, SQL Servers, and/or workstations. Discover and select specific logs. Discover all domains and computers. Manually add computers that can not be discovered or require credentials other than the logged in user s credentials. Delete manually added computers. Active Directory This window enables you to navigate your Active Directory tree and browse event logs. From this view, you can do everything that is possible from the Network view plus you can configure Network Event Viewer to automatically start downloading and monitoring new computers. Configured Computers This window displays configured computers. From this view, you can: Configure download and clear schedules as well as filter actions. Download the latest entries. Check multiple computers and merge the contents of the configured and already downloaded logs. Clear remote logs. Delete configurations. When deleting a configuration, the already downloaded logs are not deleted. Downloaded Logs This window displays all downloaded logs. If saving logs to the file system, pre-pending log files, and archiving old entries an archive folder is present once entries are archived. If saving logs to the file system and backing up previously downloaded logs, a date time folder is present for each backed up log. The date and time displayed is the date and time the log was backed up rather than the date time the log was downloaded. From this view, you can: Configure download and clear schedules as well as filter actions. Download the latest entries. Select a log to view the contents. Check multiple logs and merge the contents. Export logs to CSV, EVT, HTML, XML, or TEXT. Page 63
64 logs. Clear remote logs. Delete logs from the file system or SQL Server. Filter Action Events Filter action events are events that pass assigned filter criteria during a scheduled download. These events are saved to a single file (\documents and settings\all users\application data\cornerbowl \network event viewer\fae) or database table (filter_action_events). The Filter Action Events view enables users to: Quickly view all entries associated with each or all filters. Delete entries in the filter action event cache. Reports and Views This window displays all configured reports. A report is a configured collection of downloaded logs with an optionally applied filter. Reports enable system administrators to quickly apply a filter to a set of already downloaded logs. From this view, you can: Configure and create new reports. View reports. Delete reports. Message This window displays the selected event's message. Data This window displays the selected event's binary data. Right clicking in the window enables you to select the format to view the data. Hex, ASCII, and Unicode are all available. Notes This window enables users to add notes to the selected entry. Output This window displays application status messages. Download Status This window displays all download status messages logged while downloading from within the user interface. Status messages are grouped by log, enabling you to quickly review all status messages associated with each log. Service Output The windows service writes status messages to a log file in the installation directory, \documents and settings\all users\application data\cornerbowl \network event viewer\nev.log by default. This window tails the log file and displays each status message. Page 64
65 User Interface Components The Network Event Viewer user interface is made up of several views that enable you to browse the network, map computers, configure logs, view logs, view events that have passed assigned filter criteria, and view application, download, and service status messages. Navigation The Navigation view contains the Network, Configured Computers, Downloaded Logs, and Filter Action Events views. Network This window enables you to navigate your network and browse event logs. From this view, you can: Select a log to immediately download and view the contents. Select a log to view the remote log properties and modify the maximum remote log size and overwrite policy. Configure download and clear schedules as well as filter actions. Check multiple logs and merge the contents. Clear remote logs. Discover and select all servers, domain controllers, SQL Servers, and/or workstations. Discover and select specific logs. Discover all domains and computers. Manually add computers that can not be discovered or require credentials other than the logged in user s credentials. Delete manually added computers. Active Directory This window enables you to navigate your Active Directory tree and browse event logs. From this view, you can do everything that is possible from the Network view plus you can configure Network Event Viewer to automatically start downloading and monitoring new computers. Configured Computers This window displays configured computers. From this view, you can: Configure download and clear schedules as well as filter actions. Download the latest entries. Check multiple computers and merge the contents of the configured and already downloaded logs. Clear remote logs. Delete configurations. When deleting a configuration, the already downloaded logs are not deleted. Downloaded Logs This window displays all downloaded logs. If saving logs to the file system, pre-pending log files, and archiving old entries an archive folder is present once entries are archived. If saving logs to the file system and backing up previously downloaded logs, a date time folder is present for each backed up log. The date and time displayed is the date and time the log was backed up rather than the date time the log was downloaded. From this view, you can: Configure download and clear schedules as well as filter actions. Download the latest entries. Select a log to view the contents. Check multiple logs and merge the contents. Export logs to CSV, EVT, HTML, XML, or TEXT. Page 65
66 logs. Clear remote logs. Delete logs from the file system or SQL Server. Filter Action Events Filter action events are events that pass assigned filter criteria during a scheduled download. These events are saved to a single file (\documents and settings\all users\application data\cornerbowl \network event viewer\fae) or database table (filter_action_events). The Filter Action Events view enables users to: Quickly view all entries associated with each or all filters. Delete entries in the filter action event cache. Reports and Views This window displays all configured reports. A report is a configured collection of downloaded logs with an optionally applied filter. Reports enable system administrators to quickly apply a filter to a set of already downloaded logs. From this view, you can: Configure and create new reports. View reports. Delete reports. Message This window displays the selected event's message. Data This window displays the selected event's binary data. Right clicking in the window enables you to select the format to view the data. Hex, ASCII, and Unicode are all available. Notes This window enables users to add notes to the selected entry. Output This window displays application status messages. Download Status This window displays all download status messages logged while downloading from within the user interface. Status messages are grouped by log, enabling you to quickly review all status messages associated with each log. Service Output The windows service writes status messages to a log file in the installation directory, \documents and settings\all users\application data\cornerbowl \network event viewer\nev.log by default. This window tails the log file and displays each status message. Page 66
67 User Interface Components The Network Event Viewer user interface is made up of several views that enable you to browse the network, map computers, configure logs, view logs, view events that have passed assigned filter criteria, and view application, download, and service status messages. Navigation The Navigation view contains the Network, Configured Computers, Downloaded Logs, and Filter Action Events views. Network This window enables you to navigate your network and browse event logs. From this view, you can: Select a log to immediately download and view the contents. Select a log to view the remote log properties and modify the maximum remote log size and overwrite policy. Configure download and clear schedules as well as filter actions. Check multiple logs and merge the contents. Clear remote logs. Discover and select all servers, domain controllers, SQL Servers, and/or workstations. Discover and select specific logs. Discover all domains and computers. Manually add computers that can not be discovered or require credentials other than the logged in user s credentials. Delete manually added computers. Active Directory This window enables you to navigate your Active Directory tree and browse event logs. From this view, you can do everything that is possible from the Network view plus you can configure Network Event Viewer to automatically start downloading and monitoring new computers. Configured Computers This window displays configured computers. From this view, you can: Configure download and clear schedules as well as filter actions. Download the latest entries. Check multiple computers and merge the contents of the configured and already downloaded logs. Clear remote logs. Delete configurations. When deleting a configuration, the already downloaded logs are not deleted. Downloaded Logs This window displays all downloaded logs. If saving logs to the file system, pre-pending log files, and archiving old entries an archive folder is present once entries are archived. If saving logs to the file system and backing up previously downloaded logs, a date time folder is present for each backed up log. The date and time displayed is the date and time the log was backed up rather than the date time the log was downloaded. From this view, you can: Configure download and clear schedules as well as filter actions. Download the latest entries. Select a log to view the contents. Check multiple logs and merge the contents. Export logs to CSV, EVT, HTML, XML, or TEXT. Page 67
68 logs. Clear remote logs. Delete logs from the file system or SQL Server. Filter Action Events Filter action events are events that pass assigned filter criteria during a scheduled download. These events are saved to a single file (\documents and settings\all users\application data\cornerbowl \network event viewer\fae) or database table (filter_action_events). The Filter Action Events view enables users to: Quickly view all entries associated with each or all filters. Delete entries in the filter action event cache. Reports and Views This window displays all configured reports. A report is a configured collection of downloaded logs with an optionally applied filter. Reports enable system administrators to quickly apply a filter to a set of already downloaded logs. From this view, you can: Configure and create new reports. View reports. Delete reports. Message This window displays the selected event's message. Data This window displays the selected event's binary data. Right clicking in the window enables you to select the format to view the data. Hex, ASCII, and Unicode are all available. Notes This window enables users to add notes to the selected entry. Output This window displays application status messages. Download Status This window displays all download status messages logged while downloading from within the user interface. Status messages are grouped by log, enabling you to quickly review all status messages associated with each log. Service Output The windows service writes status messages to a log file in the installation directory, \documents and settings\all users\application data\cornerbowl \network event viewer\nev.log by default. This window tails the log file and displays each status message. Page 68
69 User Interface Components The Network Event Viewer user interface is made up of several views that enable you to browse the network, map computers, configure logs, view logs, view events that have passed assigned filter criteria, and view application, download, and service status messages. Navigation The Navigation view contains the Network, Configured Computers, Downloaded Logs, and Filter Action Events views. Network This window enables you to navigate your network and browse event logs. From this view, you can: Select a log to immediately download and view the contents. Select a log to view the remote log properties and modify the maximum remote log size and overwrite policy. Configure download and clear schedules as well as filter actions. Check multiple logs and merge the contents. Clear remote logs. Discover and select all servers, domain controllers, SQL Servers, and/or workstations. Discover and select specific logs. Discover all domains and computers. Manually add computers that can not be discovered or require credentials other than the logged in user s credentials. Delete manually added computers. Active Directory This window enables you to navigate your Active Directory tree and browse event logs. From this view, you can do everything that is possible from the Network view plus you can configure Network Event Viewer to automatically start downloading and monitoring new computers. Configured Computers This window displays configured computers. From this view, you can: Configure download and clear schedules as well as filter actions. Download the latest entries. Check multiple computers and merge the contents of the configured and already downloaded logs. Clear remote logs. Delete configurations. When deleting a configuration, the already downloaded logs are not deleted. Downloaded Logs This window displays all downloaded logs. If saving logs to the file system, pre-pending log files, and archiving old entries an archive folder is present once entries are archived. If saving logs to the file system and backing up previously downloaded logs, a date time folder is present for each backed up log. The date and time displayed is the date and time the log was backed up rather than the date time the log was downloaded. From this view, you can: Configure download and clear schedules as well as filter actions. Download the latest entries. Select a log to view the contents. Check multiple logs and merge the contents. Export logs to CSV, EVT, HTML, XML, or TEXT. Page 69
70 logs. Clear remote logs. Delete logs from the file system or SQL Server. Filter Action Events Filter action events are events that pass assigned filter criteria during a scheduled download. These events are saved to a single file (\documents and settings\all users\application data\cornerbowl \network event viewer\fae) or database table (filter_action_events). The Filter Action Events view enables users to: Quickly view all entries associated with each or all filters. Delete entries in the filter action event cache. Reports and Views This window displays all configured reports. A report is a configured collection of downloaded logs with an optionally applied filter. Reports enable system administrators to quickly apply a filter to a set of already downloaded logs. From this view, you can: Configure and create new reports. View reports. Delete reports. Message This window displays the selected event's message. Data This window displays the selected event's binary data. Right clicking in the window enables you to select the format to view the data. Hex, ASCII, and Unicode are all available. Notes This window enables users to add notes to the selected entry. Output This window displays application status messages. Download Status This window displays all download status messages logged while downloading from within the user interface. Status messages are grouped by log, enabling you to quickly review all status messages associated with each log. Service Output The windows service writes status messages to a log file in the installation directory, \documents and settings\all users\application data\cornerbowl \network event viewer\nev.log by default. This window tails the log file and displays each status message. Page 70
71 User Interface Components The Network Event Viewer user interface is made up of several views that enable you to browse the network, map computers, configure logs, view logs, view events that have passed assigned filter criteria, and view application, download, and service status messages. Navigation The Navigation view contains the Network, Configured Computers, Downloaded Logs, and Filter Action Events views. Network This window enables you to navigate your network and browse event logs. From this view, you can: Select a log to immediately download and view the contents. Select a log to view the remote log properties and modify the maximum remote log size and overwrite policy. Configure download and clear schedules as well as filter actions. Check multiple logs and merge the contents. Clear remote logs. Discover and select all servers, domain controllers, SQL Servers, and/or workstations. Discover and select specific logs. Discover all domains and computers. Manually add computers that can not be discovered or require credentials other than the logged in user s credentials. Delete manually added computers. Active Directory This window enables you to navigate your Active Directory tree and browse event logs. From this view, you can do everything that is possible from the Network view plus you can configure Network Event Viewer to automatically start downloading and monitoring new computers. Configured Computers This window displays configured computers. From this view, you can: Configure download and clear schedules as well as filter actions. Download the latest entries. Check multiple computers and merge the contents of the configured and already downloaded logs. Clear remote logs. Delete configurations. When deleting a configuration, the already downloaded logs are not deleted. Downloaded Logs This window displays all downloaded logs. If saving logs to the file system, pre-pending log files, and archiving old entries an archive folder is present once entries are archived. If saving logs to the file system and backing up previously downloaded logs, a date time folder is present for each backed up log. The date and time displayed is the date and time the log was backed up rather than the date time the log was downloaded. From this view, you can: Configure download and clear schedules as well as filter actions. Download the latest entries. Select a log to view the contents. Check multiple logs and merge the contents. Export logs to CSV, EVT, HTML, XML, or TEXT. Page 71
72 logs. Clear remote logs. Delete logs from the file system or SQL Server. Filter Action Events Filter action events are events that pass assigned filter criteria during a scheduled download. These events are saved to a single file (\documents and settings\all users\application data\cornerbowl \network event viewer\fae) or database table (filter_action_events). The Filter Action Events view enables users to: Quickly view all entries associated with each or all filters. Delete entries in the filter action event cache. Reports and Views This window displays all configured reports. A report is a configured collection of downloaded logs with an optionally applied filter. Reports enable system administrators to quickly apply a filter to a set of already downloaded logs. From this view, you can: Configure and create new reports. View reports. Delete reports. Message This window displays the selected event's message. Data This window displays the selected event's binary data. Right clicking in the window enables you to select the format to view the data. Hex, ASCII, and Unicode are all available. Notes This window enables users to add notes to the selected entry. Output This window displays application status messages. Download Status This window displays all download status messages logged while downloading from within the user interface. Status messages are grouped by log, enabling you to quickly review all status messages associated with each log. Service Output The windows service writes status messages to a log file in the installation directory, \documents and settings\all users\application data\cornerbowl \network event viewer\nev.log by default. This window tails the log file and displays each status message. Page 72
73 User Interface Components The Network Event Viewer user interface is made up of several views that enable you to browse the network, map computers, configure logs, view logs, view events that have passed assigned filter criteria, and view application, download, and service status messages. Navigation The Navigation view contains the Network, Configured Computers, Downloaded Logs, and Filter Action Events views. Network This window enables you to navigate your network and browse event logs. From this view, you can: Select a log to immediately download and view the contents. Select a log to view the remote log properties and modify the maximum remote log size and overwrite policy. Configure download and clear schedules as well as filter actions. Check multiple logs and merge the contents. Clear remote logs. Discover and select all servers, domain controllers, SQL Servers, and/or workstations. Discover and select specific logs. Discover all domains and computers. Manually add computers that can not be discovered or require credentials other than the logged in user s credentials. Delete manually added computers. Active Directory This window enables you to navigate your Active Directory tree and browse event logs. From this view, you can do everything that is possible from the Network view plus you can configure Network Event Viewer to automatically start downloading and monitoring new computers. Configured Computers This window displays configured computers. From this view, you can: Configure download and clear schedules as well as filter actions. Download the latest entries. Check multiple computers and merge the contents of the configured and already downloaded logs. Clear remote logs. Delete configurations. When deleting a configuration, the already downloaded logs are not deleted. Downloaded Logs This window displays all downloaded logs. If saving logs to the file system, pre-pending log files, and archiving old entries an archive folder is present once entries are archived. If saving logs to the file system and backing up previously downloaded logs, a date time folder is present for each backed up log. The date and time displayed is the date and time the log was backed up rather than the date time the log was downloaded. From this view, you can: Configure download and clear schedules as well as filter actions. Download the latest entries. Select a log to view the contents. Check multiple logs and merge the contents. Export logs to CSV, EVT, HTML, XML, or TEXT. Page 73
74 logs. Clear remote logs. Delete logs from the file system or SQL Server. Filter Action Events Filter action events are events that pass assigned filter criteria during a scheduled download. These events are saved to a single file (\documents and settings\all users\application data\cornerbowl \network event viewer\fae) or database table (filter_action_events). The Filter Action Events view enables users to: Quickly view all entries associated with each or all filters. Delete entries in the filter action event cache. Reports and Views This window displays all configured reports. A report is a configured collection of downloaded logs with an optionally applied filter. Reports enable system administrators to quickly apply a filter to a set of already downloaded logs. From this view, you can: Configure and create new reports. View reports. Delete reports. Message This window displays the selected event's message. Data This window displays the selected event's binary data. Right clicking in the window enables you to select the format to view the data. Hex, ASCII, and Unicode are all available. Notes This window enables users to add notes to the selected entry. Output This window displays application status messages. Download Status This window displays all download status messages logged while downloading from within the user interface. Status messages are grouped by log, enabling you to quickly review all status messages associated with each log. Service Output The windows service writes status messages to a log file in the installation directory, \documents and settings\all users\application data\cornerbowl \network event viewer\nev.log by default. This window tails the log file and displays each status message. Page 74
75 User Interface Components The Network Event Viewer user interface is made up of several views that enable you to browse the network, map computers, configure logs, view logs, view events that have passed assigned filter criteria, and view application, download, and service status messages. Navigation The Navigation view contains the Network, Configured Computers, Downloaded Logs, and Filter Action Events views. Network This window enables you to navigate your network and browse event logs. From this view, you can: Select a log to immediately download and view the contents. Select a log to view the remote log properties and modify the maximum remote log size and overwrite policy. Configure download and clear schedules as well as filter actions. Check multiple logs and merge the contents. Clear remote logs. Discover and select all servers, domain controllers, SQL Servers, and/or workstations. Discover and select specific logs. Discover all domains and computers. Manually add computers that can not be discovered or require credentials other than the logged in user s credentials. Delete manually added computers. Active Directory This window enables you to navigate your Active Directory tree and browse event logs. From this view, you can do everything that is possible from the Network view plus you can configure Network Event Viewer to automatically start downloading and monitoring new computers. Configured Computers This window displays configured computers. From this view, you can: Configure download and clear schedules as well as filter actions. Download the latest entries. Check multiple computers and merge the contents of the configured and already downloaded logs. Clear remote logs. Delete configurations. When deleting a configuration, the already downloaded logs are not deleted. Downloaded Logs This window displays all downloaded logs. If saving logs to the file system, pre-pending log files, and archiving old entries an archive folder is present once entries are archived. If saving logs to the file system and backing up previously downloaded logs, a date time folder is present for each backed up log. The date and time displayed is the date and time the log was backed up rather than the date time the log was downloaded. From this view, you can: Configure download and clear schedules as well as filter actions. Download the latest entries. Select a log to view the contents. Check multiple logs and merge the contents. Export logs to CSV, EVT, HTML, XML, or TEXT. Page 75
76 logs. Clear remote logs. Delete logs from the file system or SQL Server. Filter Action Events Filter action events are events that pass assigned filter criteria during a scheduled download. These events are saved to a single file (\documents and settings\all users\application data\cornerbowl \network event viewer\fae) or database table (filter_action_events). The Filter Action Events view enables users to: Quickly view all entries associated with each or all filters. Delete entries in the filter action event cache. Reports and Views This window displays all configured reports. A report is a configured collection of downloaded logs with an optionally applied filter. Reports enable system administrators to quickly apply a filter to a set of already downloaded logs. From this view, you can: Configure and create new reports. View reports. Delete reports. Message This window displays the selected event's message. Data This window displays the selected event's binary data. Right clicking in the window enables you to select the format to view the data. Hex, ASCII, and Unicode are all available. Notes This window enables users to add notes to the selected entry. Output This window displays application status messages. Download Status This window displays all download status messages logged while downloading from within the user interface. Status messages are grouped by log, enabling you to quickly review all status messages associated with each log. Service Output The windows service writes status messages to a log file in the installation directory, \documents and settings\all users\application data\cornerbowl \network event viewer\nev.log by default. This window tails the log file and displays each status message. Page 76
77 User Interface Components The Network Event Viewer user interface is made up of several views that enable you to browse the network, map computers, configure logs, view logs, view events that have passed assigned filter criteria, and view application, download, and service status messages. Navigation The Navigation view contains the Network, Configured Computers, Downloaded Logs, and Filter Action Events views. Network This window enables you to navigate your network and browse event logs. From this view, you can: Select a log to immediately download and view the contents. Select a log to view the remote log properties and modify the maximum remote log size and overwrite policy. Configure download and clear schedules as well as filter actions. Check multiple logs and merge the contents. Clear remote logs. Discover and select all servers, domain controllers, SQL Servers, and/or workstations. Discover and select specific logs. Discover all domains and computers. Manually add computers that can not be discovered or require credentials other than the logged in user s credentials. Delete manually added computers. Active Directory This window enables you to navigate your Active Directory tree and browse event logs. From this view, you can do everything that is possible from the Network view plus you can configure Network Event Viewer to automatically start downloading and monitoring new computers. Configured Computers This window displays configured computers. From this view, you can: Configure download and clear schedules as well as filter actions. Download the latest entries. Check multiple computers and merge the contents of the configured and already downloaded logs. Clear remote logs. Delete configurations. When deleting a configuration, the already downloaded logs are not deleted. Downloaded Logs This window displays all downloaded logs. If saving logs to the file system, pre-pending log files, and archiving old entries an archive folder is present once entries are archived. If saving logs to the file system and backing up previously downloaded logs, a date time folder is present for each backed up log. The date and time displayed is the date and time the log was backed up rather than the date time the log was downloaded. From this view, you can: Configure download and clear schedules as well as filter actions. Download the latest entries. Select a log to view the contents. Check multiple logs and merge the contents. Export logs to CSV, EVT, HTML, XML, or TEXT. Page 77
78 logs. Clear remote logs. Delete logs from the file system or SQL Server. Filter Action Events Filter action events are events that pass assigned filter criteria during a scheduled download. These events are saved to a single file (\documents and settings\all users\application data\cornerbowl \network event viewer\fae) or database table (filter_action_events). The Filter Action Events view enables users to: Quickly view all entries associated with each or all filters. Delete entries in the filter action event cache. Reports and Views This window displays all configured reports. A report is a configured collection of downloaded logs with an optionally applied filter. Reports enable system administrators to quickly apply a filter to a set of already downloaded logs. From this view, you can: Configure and create new reports. View reports. Delete reports. Message This window displays the selected event's message. Data This window displays the selected event's binary data. Right clicking in the window enables you to select the format to view the data. Hex, ASCII, and Unicode are all available. Notes This window enables users to add notes to the selected entry. Output This window displays application status messages. Download Status This window displays all download status messages logged while downloading from within the user interface. Status messages are grouped by log, enabling you to quickly review all status messages associated with each log. Service Output The windows service writes status messages to a log file in the installation directory, \documents and settings\all users\application data\cornerbowl \network event viewer\nev.log by default. This window tails the log file and displays each status message. Page 78
79 User Interface Components The Network Event Viewer user interface is made up of several views that enable you to browse the network, map computers, configure logs, view logs, view events that have passed assigned filter criteria, and view application, download, and service status messages. Navigation The Navigation view contains the Network, Configured Computers, Downloaded Logs, and Filter Action Events views. Network This window enables you to navigate your network and browse event logs. From this view, you can: Select a log to immediately download and view the contents. Select a log to view the remote log properties and modify the maximum remote log size and overwrite policy. Configure download and clear schedules as well as filter actions. Check multiple logs and merge the contents. Clear remote logs. Discover and select all servers, domain controllers, SQL Servers, and/or workstations. Discover and select specific logs. Discover all domains and computers. Manually add computers that can not be discovered or require credentials other than the logged in user s credentials. Delete manually added computers. Active Directory This window enables you to navigate your Active Directory tree and browse event logs. From this view, you can do everything that is possible from the Network view plus you can configure Network Event Viewer to automatically start downloading and monitoring new computers. Configured Computers This window displays configured computers. From this view, you can: Configure download and clear schedules as well as filter actions. Download the latest entries. Check multiple computers and merge the contents of the configured and already downloaded logs. Clear remote logs. Delete configurations. When deleting a configuration, the already downloaded logs are not deleted. Downloaded Logs This window displays all downloaded logs. If saving logs to the file system, pre-pending log files, and archiving old entries an archive folder is present once entries are archived. If saving logs to the file system and backing up previously downloaded logs, a date time folder is present for each backed up log. The date and time displayed is the date and time the log was backed up rather than the date time the log was downloaded. From this view, you can: Configure download and clear schedules as well as filter actions. Download the latest entries. Select a log to view the contents. Check multiple logs and merge the contents. Export logs to CSV, EVT, HTML, XML, or TEXT. Page 79
80 logs. Clear remote logs. Delete logs from the file system or SQL Server. Filter Action Events Filter action events are events that pass assigned filter criteria during a scheduled download. These events are saved to a single file (\documents and settings\all users\application data\cornerbowl \network event viewer\fae) or database table (filter_action_events). The Filter Action Events view enables users to: Quickly view all entries associated with each or all filters. Delete entries in the filter action event cache. Reports and Views This window displays all configured reports. A report is a configured collection of downloaded logs with an optionally applied filter. Reports enable system administrators to quickly apply a filter to a set of already downloaded logs. From this view, you can: Configure and create new reports. View reports. Delete reports. Message This window displays the selected event's message. Data This window displays the selected event's binary data. Right clicking in the window enables you to select the format to view the data. Hex, ASCII, and Unicode are all available. Notes This window enables users to add notes to the selected entry. Output This window displays application status messages. Download Status This window displays all download status messages logged while downloading from within the user interface. Status messages are grouped by log, enabling you to quickly review all status messages associated with each log. Service Output The windows service writes status messages to a log file in the installation directory, \documents and settings\all users\application data\cornerbowl \network event viewer\nev.log by default. This window tails the log file and displays each status message. Page 80
81 User Interface Components The Network Event Viewer user interface is made up of several views that enable you to browse the network, map computers, configure logs, view logs, view events that have passed assigned filter criteria, and view application, download, and service status messages. Navigation The Navigation view contains the Network, Configured Computers, Downloaded Logs, and Filter Action Events views. Network This window enables you to navigate your network and browse event logs. From this view, you can: Select a log to immediately download and view the contents. Select a log to view the remote log properties and modify the maximum remote log size and overwrite policy. Configure download and clear schedules as well as filter actions. Check multiple logs and merge the contents. Clear remote logs. Discover and select all servers, domain controllers, SQL Servers, and/or workstations. Discover and select specific logs. Discover all domains and computers. Manually add computers that can not be discovered or require credentials other than the logged in user s credentials. Delete manually added computers. Active Directory This window enables you to navigate your Active Directory tree and browse event logs. From this view, you can do everything that is possible from the Network view plus you can configure Network Event Viewer to automatically start downloading and monitoring new computers. Configured Computers This window displays configured computers. From this view, you can: Configure download and clear schedules as well as filter actions. Download the latest entries. Check multiple computers and merge the contents of the configured and already downloaded logs. Clear remote logs. Delete configurations. When deleting a configuration, the already downloaded logs are not deleted. Downloaded Logs This window displays all downloaded logs. If saving logs to the file system, pre-pending log files, and archiving old entries an archive folder is present once entries are archived. If saving logs to the file system and backing up previously downloaded logs, a date time folder is present for each backed up log. The date and time displayed is the date and time the log was backed up rather than the date time the log was downloaded. From this view, you can: Configure download and clear schedules as well as filter actions. Download the latest entries. Select a log to view the contents. Check multiple logs and merge the contents. Export logs to CSV, EVT, HTML, XML, or TEXT. Page 81
82 logs. Clear remote logs. Delete logs from the file system or SQL Server. Filter Action Events Filter action events are events that pass assigned filter criteria during a scheduled download. These events are saved to a single file (\documents and settings\all users\application data\cornerbowl \network event viewer\fae) or database table (filter_action_events). The Filter Action Events view enables users to: Quickly view all entries associated with each or all filters. Delete entries in the filter action event cache. Reports and Views This window displays all configured reports. A report is a configured collection of downloaded logs with an optionally applied filter. Reports enable system administrators to quickly apply a filter to a set of already downloaded logs. From this view, you can: Configure and create new reports. View reports. Delete reports. Message This window displays the selected event's message. Data This window displays the selected event's binary data. Right clicking in the window enables you to select the format to view the data. Hex, ASCII, and Unicode are all available. Notes This window enables users to add notes to the selected entry. Output This window displays application status messages. Download Status This window displays all download status messages logged while downloading from within the user interface. Status messages are grouped by log, enabling you to quickly review all status messages associated with each log. Service Output The windows service writes status messages to a log file in the installation directory, \documents and settings\all users\application data\cornerbowl \network event viewer\nev.log by default. This window tails the log file and displays each status message. Page 82
83 Navigating the Network Network Event Viewer enables you to navigate your network just as if you where in Windows Explorer. The big difference is, however; once you click on a computer all available logs are displayed. Network navigation is accessed via the Network view in the Navigation window. While navigating your network, you have the ability to: Select a log to immediately download and view the contents. Select a log to view the remote log properties and modify the maximum remote log size and overwrite policy. Configure log download schedule and monitoring. Check multiple logs and merge the contents into the viewer. Clear remote logs. Discover and select all servers, domain controllers, SQL Servers, and/or workstations. Discover and select specific logs. Discover all domains and computers. Manually add computers that can not be discovered or require credentials other than the logged in user s credentials. Delete manually added computers. When a log is selected, the latest entries are downloaded. The methodology for downloading and caching logs is dependent on the options specified in the Options dialog. For more information see Options. If you receive an access denied error after selecting a computer, you can manually map a computer and specify login credentials. For more information see Mapping Computers. When navigating your network, computers online but undiscoverable can be manually added. For more information see Mapping Computers. To discover all domains and computers, click Discover from the File menu or select the toolbar button. For more information, see: Options Mapping Computers Page 83
84 Actions Network Event Viewer fires actions when entries pass a filter assigned to a scheduled download. The following actions are currently supported: Database File Message Box Pager (SMS) Sound Start Process Syslog Message Tray Icon Tray Icon Popup Writes each entry that passed the filter criteria to a database table. Sends a simple notification message or a detailed message that contains all entries that passed the filter criteria. Writes each entry that passed the filter criteria to a file. Displays a message box that optionally includes the oldest event that passed the filter criteria. Sends a text message using Clickatell s web -to-sms online gateway service or any third party -to-sms gateway. Plays a sound. Starts a background process. Forwards each event log entry that passed the filter criteria to your syslog server. Updates the tray icon when events pass filter criteria. Displays a balloon window above the tray icon that optionally contains the oldest event that passed the filter criteria. When entries pass filter criteria, Network Event Viewer can a simple notification message or a detailed message. Notification messages are designed to be seen on PDAs, phones, or as a reminder to look at the event logs. Detailed messages contain each entry that passed the filter criteria. Network Event Viewer supports several replacement tags for the subject and body of the messages. See the available replacement tags at the end of this page. Template Network Event Viewer uses a template file to create the detailed content. For more information see and HTML Templates. File When entries pass filter criteria, Network Event Viewer can write the entries of interest to various file types. You must specify the file type, filename (excluding the extension), and if exporting to HTML, the template. The following file types are supported: CSV EVT HTML TEXT XML The following replacement tags are supported for the file path and name: <HOST> Page 84
85 <LOG> <FILTER> Template Network Event Viewer uses a template file to create the HTML content. For more information see and HTML Templates. Backing up previous files In response to users exporting all event log entry content to EVT file format per regulatory agency requirements, we added the option to automatically back the previously written file. Message Box When entries pass filter criteria, Network Event Viewer can display a message box. The message box can optionally include the oldest entry or can simply be a notification message reminding the logged on user to review the logs. See the available replacement tags at the end of this page. Sound When entries match filter criteria, Network Event Viewer can notify the logged on user to review the logs by playing a sound. SQL Server and MySQL When entries match filter criteria, Network Event Viewer can write the entries of interest to a SQL Server or MySQL database table. NOTE: First, you must configure your database connection via the Tools Options dialog. For more information see Options. Once configured, specify the name of the table to write the entries. If the table does not already exist, it will be automatically created. Entries from different computers and logs can be written to the same table. The table is self-contained meaning it does not contain any foreign keys to other tables. The following replacement tags are supported for table name: <HOST> <LOG> <FILTER> Start Process When entries match filter criteria, Network Event Viewer can start a background process. Please note, user interface processes can not be started unless the Network Event Viewer Service is configured to interact with the desktop. Syslog When entries match filter criteria, Network Event Viewer can forward the entries of interest to your syslog server. Specify syslog facility and syslog server to forward entries. For more information on syslog see: RFC 3164 available at Page 85
86 Tray Popup When entries pass filter criteria, Network Event Viewer can display a tray popup message. The popup can optionally include the oldest entry or can simply be a notification message reminding the logged on user to review the logs. See the available replacement tags at the end of this page. SMS (Clickatell) When entries pass filter criteria, Network Event Viewer can send a message to the Clickatell online SMS gateway. The message can optionally include the oldest entry or can simply be a notification message reminding the logged on user to review the logs. See the available replacement tags below. Replacement Tags The following replacement tags are supported: <HOST> <LOG> <FILTER> <ENTRY_COUNT> <LATEST_ENTRY> <OLDEST_ENTRY> <DATE> <TIME> For more information, see: and HTML Templates Options Page 86
87 Active Directory Network Event Viewer enables you to navigate your Active Directory tree, select computers, and discover logs. When you select the Active Directory view, the software attempts to automatically connect to your Active Directory tree, however; if it is unable to connect, you can specify the host and optionally credentials. Once connected, you can navigate your tree and perform all management tasks as if you were in the Network view. One of the major benefits to using the Active Directory view is to quickly configure computers and merge logs in the same organizational group at the same time. If your organization groups machines by organizational unit, you can easily select all machines in an organizational unit and configure them at once, download logs at the same time, or merge already downloaded logs. For more information see Automatically Configuring New Computers. To specify alternate trees or credentials Select Options from the Tools menu. At the bottom of the dialog, click the Configure Active Directory button. Specify the appropriate Active Directory or LDAP connection string and credentials. Page 87
88 Archiving Event log consolidation is an important and often requirement of regulatory compliance such as Sarbanes-Oxley. System administrators can configure the software to automatically archive event log entries older than a configurable number of days. When storing large event logs, archiving entries becomes is an important function of Network Event Viewer. Archiving enables the user interface to open and scan logs quickly, an important task when viewing large domain controller security logs. Archived entries appear in the Downloaded Logs view under a tree node called Archive. View the archive logs the same way you view the primary logs. When using the file system to store consolidated logs, entries are moved to files in a sub-directory to the repository directory called Archive. When using a database to store consolidated logs, entries are moved to another table called [computer]_[event log]_archive. The table format is identical to the primary table. Page 88
89 Automatically Configuring New Computers Network Event Viewer enables you to configure the service to monitor Active Directory organizational units. When new computers are added, a pre-configured configuration template you create is assigned and automatic downloading and monitoring commences. How to automatically configure new computers The first step is to save a current download configuration to a template. From the Configured Computers view, right click a computer and select Configure Selected Computers. Select the Schedule tab. From the Logs combo box at the top, select one of the logs. Click Save As Configuration Template. Specify a name and click OK. Close the Configuration Wizard. Select the Active Directory view. Navigate and select the organizational unit to monitor. Please note, computers must appear directly under the node you select. The monitoring software does not recurs the tree. Right click and select Automatically Configure New Computers. The Active Directory Auto Configuration dialog is now open. Using this wizard, add each log you want monitored and assign an available template. Select the Exclusions tab and add any computers you do not want to monitor. Select the Schedule tab and specify the frequency to poll the organizational unit. Lastly, specify an address to send a report of all new computers now being monitored. Page 89
90 Auxiliary Data Sources Auxiliary data sources enable system administrators to view and report on logs consolidated by other installations of Network Event Viewer. This scenario is typically used when an instance of Network Event Viewer is installed at a remote location, such as a field office or branch, and that installation pushes log files to a central location such as the corporate headquarters. When a log entry is displayed that is contained within an auxiliary data source the host column shows the data source name followed by the host name. This format allows you to merge logs from multiple computes within different data sources that have the same hostname or IP address as is typically the case with router syslogs. Once you have configured an auxiliary data source, the Downloaded Logs and Filter Action Events views will include a root node for each data source. Reports and views can also be created that include auxiliary data source logs. Please note, logical groups are a component of each download configuration. Download configurations are stored in the local registry and therefore you will be unable to see the logical groups other administrators have setup within their installations of Network Event Viewer. To configure auxiliary data sources Select Options from the Tools menu item. Select the Auxiliary Data Sources tab. Click the add data source button. Specify the friendly name. An example might be the city name the branch office resides. Select the type of repository the logs are stored, either database or file system. Click OK. You should now be back in the Options Dialog. From here, specify either the directory or the database connection information the logs reside. Page 90
91 Backing Up and Restoring the Configuration Network Event Viewer stores all configuration settings in the Windows Registry. To backup Network Event Viewer s configuration select Export Configuration from the Tools menu item. The registry is iterated and saved to an XML file. This file can be imported by the current system or another at any time by selecting Import Configuration from the Tools menu item. Please note the Windows s service credentials are not saved by Network Event Viewer. Page 91
92 Best Practices The most common problem users have is downloading gigabyte sized domain controller security logs. Unless is absolutely required, it is best to download the latest entries and then build the log repository over time. To accomplish this, limit the number of days to download entries via the Options dialog. For example, set the number of days to 2 and then schedule the download to a frequency of once a day. Other things to consider: Download as often as every hour or once a day. Stager download schedules. Limit the number of days per page to a few days. Archive entries older than 30 days. Apply a consolidation filter when downloading logs. Page 92
93 Configuration Templates To ease the process of configuring new computers, Network Event Viewer enables users to create configuration templates. Configuration templates contain all values applied on the Schedule and Actions tab of the Configuration Wizard. To create a configuration template Open an already configured computer. Select the Consolidation tab, from the Logs combo-box, select the log whose configuration you want to save. Click the Save As Template button. Specify a name and click OK. To use a configuration template From any view, select the computer of interest. Open the Configuration Wizard. From the Consolidation tab, click Load Template. Select the template and click OK. For more information, see: Configuration Wizard Page 93
94 Configuration Wizard Although Network Event Viewer enables systems administrators to navigate directly to remote event logs, the real power lies with its ability to automatically download, consolidate, filter, notify, and archive. The Configuration Wizard enables you to schedule log downloads, apply filters and assign actions, and optionally configure automatic remote log clearing. Please note once a log is configured, all assigned filters and corresponding actions are executed when logs are manually downloaded. Selecting computers For more information on selecting computers before opening the Wizard see Configuring Log Management. To open the configuration wizard Select Configuration Wizard from the File menu item or select the toolbar button. Please note when viewing and updating configurations for multiple computers or logs the following rules apply: Text fields and combo-boxes that have different configuration values are empty. Check boxes that have different configuration values display with a square rather than empty or with a check box. Setting a value in a control sets the value for all the selected computers and/or logs. Computers The Computers page enables users to either select computers for configuration or view the already selected computers. If computers were already selected before the wizard opened, this page displays all selected computers otherwise use this page to navigate to the computers of interest. Check each computer to configure. To map a computer not listed, click the Map Computer button. Clicking on any other tab other than Intro causes each selected computer to be listed in a Computers combo-box at the top of the selected page. Use the Computers combo-box to toggle between configuring all computers and a specific computer. Login As By default the user interface uses the logged in user s account to download event logs while the Network Event Viewer service uses the account the service was started with. Typically users login with a domain administrator account and the Network Event Viewer service should always run under a domain administrator account. If you do not login with appropriate credentials or the domain administrator account does not have rights to download logs (as is the case with off domain or alternate domain computers), you can specify an alternate account to use. Logs The Logs page enables you assign each computer to a logical group and select which logs to configure. When configuring multiple computers, the Logs page displays the 3 standard logs, a text field to add specific logs, and a list of configured logs. Check or un-check the standard logs to configure or remove the configuration from. Use the Logs text box and the Add button to add logs to download not already in the list. Please note, manually adding a log file not contained on a remote system will cause the download function to generate an error. Ideally, either use the Computers combo-box at the top of the page to select each specific computer or add logs you know to exist on each computer. When configuring a single computer, the Logs page displays a list of auto-discovered logs. Check or un-check the logs to configure or remove the configuration from. Page 94
95 Consolidation Event log consolidation filters The Consolidation page enables you to apply a filter when downloading logs to limit the amount of data stored within the event log repository. This is especially helpful when downloading large Security logs from domain controllers. Note: Entries that do not pass the consolidation filter are not filtered for actions. Any event log entries you want to apply an action too must first pass the consolidation filter. When using the file system to cache logs rather than a database, you can specify the maximum size of the cached log file. Downloads are immediately terminated once the maximum size is reached. All entries not downloaded remain on the remote computer. The default value is 20 MBs. To limit the file size, check the Limit downloaded log size to check box and specify the size in MBs. Scheduled downloads Many logs are very large and may take a significant period of time to download. Download times running in excess of several hours is not unheard of. For this reason, Network Event Viewer offers a Windows service to download the files during off hours. The service has the ability to clear the log contents as well. If you choose to clear the remote logs, the contents will be permanently deleted from each remote computer. Check the Automatically download remote logs check box to schedule automatic downloads. Click the Schedule button to specify the schedule. Check the Clear remote event logs after downloading to automatically clear remote logs once they have been downloaded. Distributing download schedules For performance reasons, it is best to stagger download schedules when downloading a significant number of logs. Click the Distribute Schedules buttons to use the Schedule Distribution Manager Templates To ease the process of configuring new computers, Network Event Viewer enables users to create configuration templates. To create a template, select a single computer and log from the Computers and Logs combo box at the top of the page. Click the Save To Template button and specify a name. To load a template, click the Load Template button, select the template to apply, and click OK. For more information see Configuration Templates. Actions The Actions page enables you to select and assign filters and actions. For more information on creating filters see Creating Filters. To create filters Click the Filters properties button. For more information, see Filters. To assign filters When assigning filters while multiple computers and/or logs are selected, the filter is assigned to each selected log on each selected computer. When a filter is only applied to a sub-set of the selected computers and/or logs, the filter displays with gray text rather than black. To assign the filter to all computer and/or logs, double-click the available filter. To change the filter assignment for a single log, select the computer and log from the combo-box at the top of the screen. To create actions Page 95
96 Network Event Viewer enables users to create a single action and assign the action to multiple host/log configurations. To create actions, click the Actions properties button. For more information, see Actions. To assign actions When assigning actions while multiple computers and/or logs are selected, the action is assigned to each selected log on each selected computer. When an action is only applied to a sub-set of the selected computers and/or logs, the action displays with gray text rather than black. To assign the action to all computer and/or logs, double-click the available action. To change the action assignment for a single log, select the computer and log from the combo-box at the top of the screen. All entries that pass filter criteria are flagged and the tray icon is updated. The next time Network Event Viewer is opened, all events that have passed filter criteria automatically display. For more information, see Filter Action Events. When viewing logs, all entries that have passed filter criteria display with a red exclamation point. Frequency Detection Frequency detection enables you to fire actions when an expected event fails to fire within a specified frequency or fires more often than expected. Real-Time The Real-Time page enables you to enable real-time monitoring, assign filters, and lastly assign actions. Please note, real-time monitoring employs the use of a single thread for each configured log. Be careful to limit real-time monitoring to mission critical systems and logs. Excessive real-time monitoring may degrade system performance. You can suppress real-time alerts and actions to a user defined frequency. If enabled, the service will flag the log with an alert state upon firing an alert or action. Once set, the service will no longer fire alerts and actions until the alert state is cleared. Optionally configure the service to automatically clear the alert state after a period of time has passed. To manually clear alerts Select System Status from the View menu item. Select the Real-Time Status tab. Highlight each log to clear and click the Clear Selected Alerts button. To clear all the alerts, click the Clear All Alerts button. Frequency Detection Frequency detection enables you to fire actions when an expected event fails to fire within a specified frequency or fires more often than expected. Verify The Verify dialog enables you to review the configuration being set for each computer and log. Note: Use the Computers and Logs combo boxes to fine tune parameters for each computer and/or each log. For more information, see: Actions Filters Configuring Log Management Creating Filters Configuration Templates Filter Action Events Page 96
97 Frequency Detection Schedule Distribution Manager Page 97
98 Configuring Log Management Although Network Event Viewer enables systems administrators to navigate directly to remote event logs, the real power lies with its ability to automatically download, consolidate, filter, notify, and archive. Please note once a log is configured, all manually executed downloads cause filters and their appropriate actions to execute as well. To configure a log for the first time From the Network view in the Navigation window, select the computer that contains the log(s) of interest. To configure multiple computers at the same time, check each computer of interest. To select specific computers and/or logs, see Selecting Specific Computers. Please note, if you do not select any computers, you must navigate your network from within the Configuration Wizard. Select Configure Selected Computers from the File menu. Follow the instructions in the wizard. For more information on the wizard, see Configuration Wizard. To change a log s configuration From the Configured Computers view in the Navigation window, select the computer that contains the log(s) of interest. To configure multiple computers at the same time, check each computer of interest. To select specific computers and/or logs, see Selecting Specific Computers. To select all the computers, right click and select Select All. Select Configure Selected Computers from the File menu. Follow the instructions in the wizard. For more information on the wizard, see Configuration Wizard. To remove a computer s configuration From the Configured Computers view in the Navigation window, select the computer that contains the log(s) of interest. To remove multiple computer configurations at the same time, check each computer of interest. To select specific computers and/or logs, see Selecting Specific Computers. To select all the computers, right click and select Select All. Select Delete from the Edit menu. To remove a log s configuration From the Configured Computers view in the Navigation window, select the computer that contains the log(s) of interest. To remove a log configuration from multiple computers at the same time, check each computer of interest. Select Configure Selected Computers from the File menu. From the Logs tab, de-select the log of interest. Click Close. Page 98
99 For more information, see: Configuration Wizard Selecting Specific Computers Page 99
100 Clearing Remote Logs Network Event Viewer enables you to manually or automatically clear log files on remote computers. Please note, clearing remote logs does nothing with the cache of logs. To manually clear remote logs Select the computers and/or logs. Select Clear Remote Logs from the Tools menu or click the toolbar icon. To automatically clear remote logs Logs can be configured to automatically be cleared after downloaded. For more information, see Configuration Wizard. Page 100
101 Copying Entries to the Clipboard To copy an entry to the clipboard, select the entry and press Ctrl-, or Copy from the Edit menu, or select the toolbar button. The entry contents are copied to the system clipboard in string format. Once in the system clipboard, you can paste the contents to an message or ASCII editor by pressing Ctrl-V or selecting Paste from the target application's Edit menu. Page 101
102 Creating a View from a Merge For ease of use we have included the capability to create a view from a current merge. A view is simply a report that is not scheduled. Please note the quick filter settings (information, warning, error, success audit, and failure audit) are not saved to the view. To filter on event types, include event type criteria within your filter. For more information see Creating Filters. How to create a view from a merge From the Downloaded Logs view within the Navigation window, check each log to include in the merge. Select Merge from the Tools menu item. Select all 5 event type quick filters located on the toolbar. From the filter combo box located on the toolbar, select the filter to apply. From the detail view, right click and select Save As View. Specify a new name and click OK. Once the view is created select the Reports and Views view within the Navigation window. From the Reports and Views view your new view should now be listed. For more information, see: Creating Filters Reports and Views Page 102
103 Creating Filters Event Logs can contain thousands of entries. In order to limit the entries viewed, you can create Filters and apply. Filters enable you to search for specific entries or hide unimportant or entries not relevant at the time. Filters can be created in 2 different ways. First, you can create a filter by simply right clicking on the target entry and selecting Filter Selected Event. Second, you can create a filter from scratch adding all the show and hide criteria yourself. Filter Selected Event Dialog The Filter Selected Event dialog automatically creates filter criteria based on the selected event. Please note the time the entry occurred is not included within the filter criteria. Use this dialog to create a new filter or append the entry to an existing filter. To add an entry to a filter, right click on an event log entry and select Filter Selected Event. Once the Filter Selected Event dialog is loaded, specify if you want to show or hide the event in question. Select if you want to create a new filter or append the criteria to an existing filter. If creating a new filter, specify if you want to create a simple or complex filter. Finally, choose if you want to create the filter and apply the new filter to the current view, create the filter and review the criteria within the Filters dialog, or create the filter without applying the filter to the current view. Filters Dialog The Filters dialog enables you to create and modify filters. To open the Filters dialog select Manage Filters from the Filters menu item or select the toolbar button. There are 2 types of filters, simple and complex. Simple Filters Simple filters are comprised of a series of criteria. Each criteria can include or exclude specific entries. Each include or show criteria is executed followed by each exclude or hide criteria. If an entry passes any criteria it is either shown or hidden depending on the criteria. For more information see Simple Filters Criteria Dialog. Complex Filters Complex filters are comprised of a series of very specific criteria that can be nested. Unlike simple filters which only support OR operands between criteria, complex filters support the AND operand. Nesting occurs when you group criteria. Take the following filter as an example: If (warning or critical) then { if (message contains drive or { } message contains disk ) then if (message contains failure ) then { PASS } Page 103

104 else if (message contains application and message contains fault ) then { PASS } } BLOCK This filter above would be entered in as follows: To add a new filter Click the New button and specify a name. Specify Simple or Complex. Enter a description and click the Apply button. Page 104
105 To remove an existing filter Select the filter in the Filter drop-down list and click the Delete button. To add criteria to a simple filter Select Add Criteria. For more information, see Simple Filter Criteria Dialog Box. To add criteria to a complex filter Click New Criteria. Specify the criteria. Click Apply. To group criteria in a complex filter Select the position to append the group to, select AND, OR, NOT, and lastly click New Group. For more information, see: Filters Simple Filter Criteria Dialog Box Regular Expressions Page 105
106 Display Options Display options are set via the Options dialog. To open the Options dialog, select Options from the Tools menu item. Once open, select the Display tab. Detail View Display logs after downloaded If you use Network Event Viewer to download logs in real time rather than with the service the entries will automatically be displayed in the viewer. If there are thousands of entries, this process may take several minutes. To disable the automatic display of the entries, uncheck the 'Display logs after download' check box. Display logs in pages of X days Many log files are very large and displaying the entire content at once can be very resource intense and time consuming. For this reason, all entries are displayed in pages. By default a page contains the last 3 days of entries. Use this control to override the number of days in a page. Use the Previous Page and Next Page toolbar buttons to navigate between each page of messages. For more information, see Display Pages. Auto advancing When display a log, entries may not reside within the first page for several reasons. Here are several reasons why: Entries may not have been downloaded recently or there was an error during the download process. There may not have been any entries written with the timeframe of the first page. The quick filter (Information, Warning, Error, etc.) may be hiding the entries contained on the first page. A simple or complex filter may be applied via the Filter Combo Box on the toolbar that may be hiding the entries contained on the first page. You have the option of configuring Network Event Viewer to automatically advance to the first page, prompt you before advancing, or doing nothing and displaying the first page (which will be empty). Display log names using color By default Network Event Viewer displays the 3 default log names that reside on all Windows computers using colors. The colors are listed as follows. Use this option to turn off the colorization of the event log names. Please note changes to this option will not reflect in currently open detail views. Log Application System Security Color Dark green Dark blue Dark red Startup Users can optionally display the System Status window and Syslog Viewer windows at startup. Use these options to automatically display the windows. System Status Hiding the System Status window can be advantageous when you are managing a large number of computers and you are not interested in the information presented in the window. Syslog Viewer Displaying the Syslog Viewer may be advantageous when you have configured the syslog server and are interested in watching messages in real-time. Page 106
107 Auto Refresh Network Event Viewer optionally refreshes the currently displayed log(s) merge or report. Please note, when viewing entries on any page other than the first page, the refresh does not occur. The software was implemented in this manner so users would not lose their position while reviewing their logs. Tray Icon The tray icon is responsible for firing user interface actions or alerts such as message box popups, tray icon popups, and playing sounds. If you are running this software on a server and do not use user interface actions, you can save system memory by disabling the tray icon. Page 107
108 Display Pages Event logs can contain thousands of entries. Loading thousands of entries into the user interface is not only slow but CPU and memory intensive. For this reason, entries are viewed in pages. A page contains all entries in a log or merge over a user configurable number of days. The default number of days is 3. When viewing extremely large files, it is advantageous to decrease the number of days. When a log is viewed or a merge executed, each log file is read in its entirety, however; the application does not load all the entries. Instead, the application determines the number of pages present in the log or merge. To navigate between pages, use the toolbar buttons located directly above the entry list. Pages are displayed from latest to oldest entries. Clicking the Next Page button moves the view to the next older page of entries. Clicking the Previous Page button moves the view to the previous or later page of entries. To set the page size, select Options from the Tools menu item. Click the Display tab. Specify the number of days per page. For more information, see Options. For more information, see: Options Page 108
109 Download Options Download options are set via the Options dialog. To open the Options dialog, select Options from the Tools menu item. Once open, select the Download tab. Limit downloads to the previous X days of log entries This option limits entry download to the number of days specified. Please note, if your download frequency is greater than the number of days specified, only entries within the day range are downloaded. In this scenario there will be a hole in the locally cached logs. Use the Windows Management Instrumentation (WMI) to download logs Network Event Viewer uses WMI by default to discover event logs and download entries. WMI is the latest and most comprehensive API Microsoft offers to download logs. If you choose not to use WMI, messages may not contain the actual message but rather a message that is limited to the replacement strings. It is advised to always use WMI. Event Log Repository This option enables you to save all entries to a database or the file system. If you choose to save entries to a database, you must create and initialize the database via the Database tab. For more information, see Using a Database. Save downloaded log entries to the file system Save downloaded log files to the following directory (Default) This option is set by default and causes logs to be cached into proprietary binary log files. Logs by default are saved in a sub-folder to the installation directory called Logs. To change the output directory, either type in a valid directory or click the browse button to select a directory. Prepend new entries to previously downloaded log files (Default) This option enables the software to limit downloads to new entries as well maintain a history of all entries downloaded. When you choose to prepend entries, you have the option of limiting the size of the local log file to a number of days. Entries that are older than the number of days specified are removed from the file. Optionally, you can configure the software to archive the removed entries. Archive files are written to a sub-directory under the output directory. The sub-directory is called Archive. When choosing to archive entries, you can limit the number of days to include in the archive. The default value is 180 days. Entries that exceed this date are removed when the log file is synched up with the remote computer s log file. Move previously downloaded log files to backup directory This option enables you to move all previously downloaded entries to a backup directory. Using this configuration, you end up with a directory for each download. Each directory contains the entries since the last download. If no new entries are found, the previously downloaded log entries are not moved to the backup directory. Overwrite previously downloaded log files If you are only concerned with current entries, you can overwrite the already downloaded logs. This option is suitable when automatically clearing remote logs after each download and you are not concerned with archiving old entries. Please note, if this option is selected and you are not automatically clearing remote logs, actions will re-execute on previously downloaded entries. Save log files using Unicode format If monitoring computers that have a Unicode operating system installed, for example a Japanese OS, check this option. Please note downloaded event logs from computers not running Unicode operating systems will significantly increase in size. Page 109
110 Save downloaded log entries to a database The Configure Database button moves user focus to the Database tab within the Options dialog. From there, you can configure database connection parameters and initialize the database. Entries are stored in 2 tables: a primary table and an archive table. The primary table is used to enable users to quickly review logs within the application. This is extremely important when reviewing domain controller security logs. If users need to review older entries, they can navigate to the Archive tree node in the Downloaded Logs view and review the larger archive tables. Remove entries older than X days from the database When using SQL Server or MySQL as your log repository, this option enables you to remove entries no longer needed from your database. Entries are removed after each download. Archive removed entries When entries are removed from the database (as explained above), you have the option to insert the entries to an archive table. If you choose to archive entries, specify the number of days to limit the archive table. Many regulatory agencies require 1 year or 365 days. Send an alert when a download fails Set this option to receive an when a scheduled download fails. Page 110
111 Downloading Logs Windows Event Logs are downloaded from networked computers and saved locally or to SQL Server. Once downloaded, Systems Administrators can view, sort, search, mark, and filter multiple logs at the same time. Before download logs, you should review the download options. Options are set via the Options dialog. To open the Options dialog, select Options from the Tools menu item. For more information, see Download Options. There are several ways to manually download remote logs. From the Network or Active Directory view, select the log or check the logs to download. From the Configured Computers view, select the computers to download logs from. Only configured logs are downloaded. From the Downloaded logs view, select the log or check the logs to download. Once you have selected the computers and/or logs of interest, click Download Remote Logs from the Tools menu or click the toolbar button. Please note, if a selected log has a filter action assigned to it, the filter is applied and the action executed. To cancel a download, click the Cancel Download toolbar button. To schedule Network Event Viewer to automatically download logs see, Configuring Log Management. To delete a downloaded log from the file system or SQL Server From the Downloaded Logs view, select the log to delete. Either press the Delete button, select Delete from the Edit menu, or click the Delete toolbar button. Please note, this function only deletes the log from the repository and leaves the actual log on the remote computer intact. For more information, see: Configuring Log Management Download Options Page 111
112 and HTML Templates Network Event Viewer enables you to create your own and HTML output templates. There are 4 different types of templates used by reports, filter actions, ing or exporting downloaded logs, and lastly, ing or exporting the current view. The default templates are stored under the installation directory in a sub-directory called HtmlTemplates. The templates are HTML files that must contain <ENTRY_ODD> and <ENTRY_EVEN> tags. Each file contains replacement tags denoted with {}. Please review the supplied templates for your reference. To change the default templates Select Options from the Tools menu item. Select the and HTML Templates tab. Re-assign the templates as necessary. Frequency Detection Report Templates Since the addition of frequency detection reports we have added 2 new templates. The templates include an extra column named Count. This column contains the count of entries that pass the filter criteria. The template files are called report_frequency_detection.html and filter_frequency_detection.html. This files are used for scheduled frequency detection reports and scheduled downloads that apply frequency detection rules. The files are located in the installation directory under the HtmlTemplates sub-directory. The default location is: C:\Program Files\Network Event Viewer\HtmlTemplates. To use the report template, specify the report_frequency_detection.html file within the Report Wizard. To use the filter template create a new or HTML action via the Actions Manager and assign the filter_frequency_detection.html to the action. Lastly assign the new action to your frequency detection rules within the Configuration Wizard. Summary Charts Summary charts have been added to the templates. The charts can only be added to the header section of the template. These charts include: Chart Type De s cription Tag Entry % by type Displays a pie chart that show s the percentage of entries for each entry type w ithin the HTML document. {CHART_TYPES} Entry % by host Displays a pie chart that show s the percentage of entries for each computer or device w ithin the HTML document. {CHART_HOSTS} Entry % by log Entry % by source Entry % by category Displays a pie chart that show s the percentage of entries for each log type the w ithin HTML document. Displays a pie chart that show s the percentage of entries for each source w ithin the HTML document. Displays a pie chart that show s the percentage of entries for each category w ithin the HTML document. {CHART_LOGS} {CHART_SOURCES} {CHART_CATEGORIES} The table below shows the chart types supported by each function: Type Host Log Source Category Re ports X X X X X View Export X X X X X Log Export X X X Dow nloads X X X Re al-time Page 112
113 Grouping Entries The HTML documents now have the capability of grouping entries by host, host then log, log then host, and log. Add the grouping to your template by simply adding an HTML tag around the <ENTRIES_EVEN> and <ENTRIES_ODD> tags. These tags are: <GROUP_BY_HOST> <GROUP_BY_LOG> The type of grouping (host then log, log then host, host, or log) depends on the order you insert the tags. For example, if you add the following section, the software will group by host then log: <GROUP_BY_HOST> <h2>{group_by_host}</h2> <GROUP_BY_LOG> <h3>{group_by_log}</h3> You must include closing tags after the </ENTRIES_EVEN> and </ENTRIES_ODD> tags which ever is last. In the above example you would add (for example): <p>-- {GROUP_BY_LOG}</p> <br /> </GROUP_BY_LOG> <p>---- {GROUP_BY_HOST}</p> <br /> </GROUP_BY_HOST> We have included 2 template files that expose this functionality. They included in your HTMLTemplates directory and are called: report_group_host_log.html view_group_host_log.html Page 113
114 ing Logs Network Event Viewer provides the capability to selected or checked logs to one or many users. Once you have selected a log or checked several logs, select Logs from the File menu. Separate each address with a semi-colon. Lastly, click Send. Page 114
115 ing the Current Page Once you have created a page with merged logs and filtered entries you may want to the results. Select Current Page from the File menu. Separate each address with a semi-colon. Lastly, click Send. Page 115
116 Entry Data Formats Many log entries have binary data associated with them. In most cases this data is designed for developers, however; some data can be formatted into a string. By default all data is displayed in hexadecimal format. To view data in ASCII or Unicode format, right click on the data. Select either Hexadecimal, ASCII, or Unicode. Page 116
117 EVT Files What are EVT Files and How do they Work? The Windows operating system stores event log entries to binary EVT files. EVT files contain each entry s information, however; EVT files do not contain entry messages but instead contain replacement strings. When the Windows Event Viewer displays an event log entry, Windows Event Viewer opens the associated message DLL for the event log entry source. Using the event ID, Windows Event Viewer looks up the message in the message DLL. Using a string insertion function Windows Event Viewer inserts the replacement strings contained within the EVT file. Viewing EVT Files EVT files should ALWAYS be viewed from the generating computer within the Windows Event Viewer. If the generating computer is no longer functioning, you will need to open the EVT files from another computer that has the most similar configuration. Please note, when viewing entries from applications that do not properly interface their event log entries with the operating system or when viewing EVT files from a computer other than the computer that generated the event log entries the following message may display: The description for Event ID {0} from source {1} cannot be found. Either the component that raises this event is not installed on your local computer or the installation is corrupted. You can install or repair the component on the local computer. If the event originated on another computer, the display information had to be saved with the event. The following information was included with the event: {2} Exporting to EVT Network Event Viewer enables you to export logs to EVT file format upon download completion as well as on demand from the Downloaded Logs view. For more information, see: Actions Exporting Logs Page 117
118 Exporting Logs Exporting logs enables you to save the selected or checked logs to CSV, EVT, HTML, XML, or TXT. The CSV export is optimized for Microsoft Excel. Once you have selected a log or checked several logs, select Save Logs As from the File menu. From the Save Logs As dialog, specify the output folder and the file type to save the logs to. The output folder and filename supports the following replacement tags: <HOST> <LOG> <DATE> <TIME> Lastly, click the Save. Page 118
119 Failed Logon Reports As you are probably already aware, Windows writes many different event log entries related to logon failures. Some of these events are specific to OS versions while others span multiple versions. Logon events embed important information within the message portion of the entry that enables system administrators to track down malicious activity. Network Event Viewer parses these messages and places the results into data tables. The result enables Network Event Viewer to: Create summary reports that list the number of times users attempt to logon to a domain or a computer Summarize different event ID messages into a single view. Detail all similar events into a single table. Network Event Viewer includes 7 different report types: Report Type Name Description Account logon failure summary Parses and summarizes account logon events 672, 675 and 680. Account logon failure (672) Account logon failure (675) Account logon failure (680) Parses and displays all 672 event message parameters. The 'Result Code' is replaced with the Kerberos description per RFC Parses and displays all 675 event message parameters. The 'Result Code' is replaced with the Kerberos description per RFC Parses and displays all 680 event message parameters. The NTLM 'Error Code' is replaced with a short description. Logon failure summary Parses and summarizes logon events 529, 530, 531, 532, 533, 534, 535, 539 and Logon failure (2000/XP/2003) Parses and displays all 529, 530, 531, 532, 533, 534, 535 and 539 event message parameters. The 'Logon Type' is replaced with a short description. Logon failure (Vista/2008) Parses and displays all 4625 event message parameters. The 'Logon Type' is replaced with a short description. The NTLM 'Sub Status' is replaced with a short description. To manually run a logon failure report for a specific or several computers From the downloaded logs view, highlight or check the security logs to run the report against and select Display Failed Logons. Select the time period for the report to span. For example, This week. Check Display entry counts to collapse similar entries and display the number of collapsed entries. For example, the number of times a user failed to logon. Lastly, click the Generate button. To create a permanent report or view Select New Failed Logon Report from the File menu item. Specify a report name. Add the computers of interest. To remove computers from the report, check each computer to remove and click the Remove button. Please Page 119
120 note the check boxes are present only to enable you to remove multiple computers from the report at once. From the Reports tab, check each report type to include in the report. Check the appropriate option at the bottom to collapse similar entries and display the number of collapsed entries. For example, the number of times a user failed to logon. Select the time period for the report to span. For example, This week. Use the Schedule tab to optionally schedule the service to automatically run the report. When scheduling a report to automatically run, use the Actions tab to configure an to send the report to or a file to save the report to. HTML, TXT, CSV, and XML are supported. Please note when you manually run a report the results are displayed in an interactive dialog. When you are finished click the Close button and save your changes. For more information, see: Reports and Views Page 120
121 Frequency Detection Network Event Viewer includes support for counting specific entries over a period of time. This counting is called frequency detection. You can configure frequency detection when configuring automated downloads, real-time monitoring, and scheduling reports. Real-time monitoring allows you also detect the lack of a specific entry. For example, if a backup process logs an entry to the Application event log every evening you can create a filter that looks for the backup log entry. If the entry does not occur for more than one day, you can receive an alert. Please note, when detecting the lack of an entry you should use the Actions Manager to create a unique alert or notification that includes your content as the lack of an entry means you will not see an entry in the alert. When firing frequency detection alerts and exporting to CSV, TXT, XML, a column is automatically added that includes the count of entries that passed the assigned filter. If you want to fire an or export to HTML you should point to the frequency detection templates already installed in your installation directory. For more information, see: Configuration Wizard Reports and Views and HTML Templates Page 121

122 Filters Event Logs can contain thousands of entries. In order to limit the entries viewed, you can create Filters and apply. Filters enable you to search for specific entries or hide unimportant or entries not relevant at the time. Filters are applied in 3 different manners. First, you can apply filters while viewing logs in the viewer. Second, you can assign filters and actions to scheduled downloads and real-time monitors. When entries pass the filter criteria, the assigned actions are fired. Lastly, filters can be assigned to a report. When a report is run, the filter is applied. All entries that pass the filter criteria are included in the report. Filtering Logs in the Viewer The viewer enables you to apply Quick Filters as well as complex filters. Quick Filters are available via the toolbar and are in the form of event type (information, warning, error, success audit, failure audit) and log. Log filters are useful when viewing large merges that may contain many different named logs. To assign a Quick Filter to the current merge Quick Filters can be applied by selecting the appropriate event type or log toolbar buttons. Event Type Toolbar Buttons Log Toolbar Buttons When using the event type and log toolbar buttons, the merge is re-executed causing each log in the merge to re-load. In some cases this process can be time consuming. If a merge has already been executed and you want to remove 2 event types, for example, clicking on the toolbar buttons would cause the application to re-load the merge twice. The Quick Filter dialog provides the ability to select multiple event types and logs while only re-loading the merge once. To open the Quick Filter dialog, select Quick Filter from the Filters menu item. Page 122
123 To assign a user defined filter to the current merge User defined filters can be applied to a current merge in the viewer. Using the combo-box from the toolbar, select the filter to apply. Please note: quick filters are always applied after a complex filter is applied. So for example, if you have a complex filter that shows warning, error, and failure audits, but the Failure Audit quick filter toolbar button is de-selected, only warning and error entries are shown. For more information, see Creating Filters. Filtering Entries during Download Schedule and Real-Time Monitor User defined filters can be assigned to scheduled downloads and real-time monitors. When assigned, all corresponding actions are immediately fired on behalf of the entries that passed the filter criteria. For more information, see Configuration Wizard. Filtering Logs for a Report Reports enable you to consolidate computers, logs, and entries into a view enabling quick access to the entries of interest. Reports can be run per a configured schedule or manually. In either case, the assigned filter is applied creating the view, , or file output of interest. For more information, see Reports and Views. For more information, see: Configuration Wizard Creating Filters Actions Reports and Views Page 123
124 Filter Action Events When downloading logs, all entries that pass assigned filter criteria are flagged. The tray icon is notified and when available, displays a notification icon. IMPORTANT: All entries that pass filter criteria reside in the log repository, however; for ease of access to these entries, they are also saved to a file called fae80018 located in the output directory. This file grows every time entries pass filter criteria. Entries must be removed from the file on a regular basis. If using a database to store your logs, the filter action events are stored in the filter_action_events table. The table is automatically truncated per the truncation schedule configured on the download tab of the Options dialog. To remove a single entry from the filter action events repository Highlight the entry(s) in the detail view and either press the Del key or click the Delete toolbar button. To remove all entries associated with a filter Select the filter in the Filter Action Events view and press the Del key or click the Delete toolbar button. For more information, see: Options Page 124
125 Flagging Entries for Follow Up You may feel it necessary to flag entries for later review. When an entry is flagged the second column in the entry list contains a red flag. Once you have completed your review of the entry you can either clear the flag or mark the entry as completed. When marked as completed, the flag turns gray. When cleared, the flag is removed. To flag an entry for follow up Select the entry and select Follow Up from the Actions menu. You can also right-click on the entry and select Follow Up from the popup menu. To mark an entry as completed Select the entry and select Flag Complete from the Actions menu. You can also right-click on the entry and select Flag Complete from the popup menu. To clear an entry's flag Select the entry and select Clear Flag from the Actions menu. You can also right-click on the entry and select the Clear Flag from the popup menu. Page 125
126 Log Properties The Log Properties dialog enables you to set the remote log entry retention policy, view information about the consolidated log repository, and view counts of the top number of events. To open the Log Properties dialog for a specific log Select the log of interest, right click and select Properties, or select Properties from the File menu item, or select the toolbar button. Remote Log Properties The General tab enables you to set the remote log entry retention policy. Use this tab to configure the maximum log size and overwrite policy. Please note these properties are for the remote log and not the local cache of event logs. Downloaded Log Properties The Downloaded Log properties tab displays the last download status, the oldest and latest date and time in the event log repository, the total number of entries consolidated, and graphs the percentage of event log entry types. Please note these stats are only for the selected cached log. If you are archiving but select the primary log, the stats do not include the archived log. If you select an archived log, the stats do not include the primary log. The Network Event Viewer Service log file contains information pertaining to each download. Click the History button to view this information within the Service Log dialog. Please note the service log file is automatically truncated once it exceeds 1 MB. Top Events The Top Events tab enables you to query the event log repository for the top unique entries. An example report would be the top 10 events for the last week or the top 100 events for the last year. An event log entry is deemed unique by the combination of its source and ID. The report is displayed in both a tabular and graphical format. Note within the graphical output events less than 5% of the total report results are grouped together. Page 126
127 Logical Groups To facilitate ease of configuration and merging, the Configured Computers view supports logical grouping. In large networks, it may become necessary to stagger log downloads. Staggering downloads, enables the CPU to minimize load by regularly download logs from various computers rather than downloading all the logs at the same time. By grouping computers into logical groups, you can easily select a group of computers and assign a unique time to download their logs. To create a Logical Group Select New Logical Group from the File menu. Once created, use drag and drop to move computers from the Unassigned Logical Group to your new group. To rename a Logical Group Highlight the logical group and press F2. Enter the new name and press the enter key. Page 127
128 Mail Connection Mail Connection parameters are set via the Options dialog. To open the Options dialog, select Options from the Tools menu item. Once open, select the Mail Connection tab. Server Information Specify the name of the SMTP server. For example: mail.yourserver.com. If your server runs on a port other than 25, for example 2000, use the following format: mail.yourserver.com:2000 Logon Information If your SMTP server requires authentication to send messages, specify your username and password. Mail From Information Optionally, specify the name and from address to appear in outgoing mail. Testing Account Settings When ever you change the mail server settings, it is a good idea to test the settings. To test the account settings, specify a test address then click the Send Test button. Page 128
129 Mail and HTML Templates Network Event Viewer enables you to create your own and HTML output templates. There are 4 different types of templates used by reports, filter actions, ing or exporting downloaded logs, and lastly, ing or exporting the current view. The default templates are stored under the installation directory in a sub-directory called Templates. The templates are HTML files that must contain <ENTRY_ODD> and <ENTRY_EVEN> tags. Each file contains replacement tags denoted with {}. Please review the supplied templates for your reference. To change the templates Select Options from the Tools menu item. Select the Mail and HTML Templates tab. Re-assign the templates as necessary. Frequency Detection Report Templates Since the addition of frequency detection reports we have added 2 new templates. The templates include an extra column named Count. This column contains the count of entries that pass the filter criteria. The template files are called report_frequency_detection.html and filter_frequency_detection.html. This files are used for scheduled frequency detection reports and scheduled downloads that apply frequency detection rules. The files are located in the installation directory under the HtmlTemplates sub-directory. The default location is: C:\Program Files\Network Event Viewer\HtmlTemplates. To use the report template, specify the report_frequency_detection.html file within the Report Wizard. To use the filter template create a new or HTML action via the Actions Manager and assign the filter_frequency_detection.html to the action. Lastly assign the new action to your frequency detection rules within the Configuration Wizard. Page 129

130 Mapping Computers The most common reason users map computers is to provide login credentials, however; computers online but undiscoverable can also be specified. To map a computer Select Map Computer from the File menu or select the toolbar button. From the map computer dialog, specify the hostname or IP address of the machine, the username, password, and domain or workgroup. To modify login credentials From the Network view, select the computer under the Mapped Computers tree node. Select Properties from the File menu item or click the properties toolbar button. Update the username and password as necessary. To remove a mapping Page 130
131 If you are no longer monitoring a computer that was previously mapped, or you no longer need to specify login credentials, you can remove the mapping. From the Network view, select the computer under the Mapped Computers tree node. Press the Delete key, select Delete from the Edit menu, or click the delete toolbar button. For more information, see: Security Page 131
132 Merging Logs One of the most powerful features of Network Event Viewer is its ability to view multiple logs from one list. This function is called log merging. To merge logs, select the computers and/or logs. Next click Merge from the Tools menu or click the merge toolbar button. By default, logs are displayed automatically after a manual download is complete. To set or clear this option, see Display Options. If this option is set and multiple logs are downloaded, the merge is automatic. For more information, see: Display Options Page 132
133 Options Use the options dialog to set configuration parameters. To open the Options dialog, select Options from the Tools menu item. The options dialog contains the following pages: Download options Display options Mail Connection and HTML Templates Database Syslog Auxiliary Data Sources Page 133
134 Printing To print a view Once you have created your log view and have is sorted to your liking, select Print from the File menu item. The view is saved to a temporary HTML file and opened in your default Internet browser. If using Internet Explorer, select Page Setup from the File menu. Select Landscape orientation. Close the dialog and select Print from the File menu. To print a log From the Downloaded Logs view, select the log to print. Select Save Logs As from the File menu. Specify a directory to save the log to, select HTML file type, and click Save. Once finished, open the HTML file in your browser of choice. If using Internet Explorer, select Page Setup from the File menu. Select Landscape orientation. Close the dialog and select Print from the File menu. Page 134
135 Refresh Clicking Refresh from the View menu item or F5 recursively discovers the entire network while the Network View has focus, refreshes the configuration list while the Configured View has focus, refreshes the downloaded logs while the Downloaded Logs has focus, or refreshes the current log view or merge while the entry list has focus. Page 135
136 Regular Expressions Regular expression support enables you to search on multiple criteria within the same search parameter. For example, using regular expressions you can search a range of specific Event IDs. Use the following search string to search all entries between 500 and 600: \b[5-6][0-9][0-9]$ The \b states start with. The $ states end with. The [x-x] states search for all numbers between the values. Use the following search string to search for event IDs 150 and 6005: \b150$ \b6005$ Put both of these together and you get: \b150$ \b6005$ \b[5-6][0-9][0-9]$ For more information, see: Creating Filters Searching Event Logs Page 136
137 Reports and Views Network Event Viewer enables systems administrators to data mine already downloaded logs and create various types of automatically scheduled reports or on-demand views. A report is defined as the scheduled automatic filtered output for a predefined set of computers and logs. For example, a report may send an every week that contains all critical entries from all domain controllers for the last week. We call a report a view when the report is executed on-demand for review within the user interface. Simply put, if you enable the schedule, you are creating a report although you can still view the report within the user interface. If you disable the schedule, you are creating a view. New to Network Event Viewer are frequency detection reports. Frequency detection reports enable you to apply multiple filters. Each time an entry passes the filter it is counted. A line item appears in the report once each time the frequency threshold is crossed for the configured time period for each filter. The last entry that passes the filter within the configured timeframe is displayed and if using the frequency detection and HTML templates a column is added to the entry showing the number of entries that passed the filter. If exporting the report to CSV, TXT, or XML the count is automatically included in the output. To create a report or view Select New Report from the File menu. Specify a report name. Select the report type, either Standard or Frequency Detection. Add the computers of interest. To remove computers from the report, check each computer to remove and click the Remove button. Please note the check boxes are present only to enable you to remove multiple computers from the report at once. From the Logs tab, check each log to include in the report. Use the Schedule tab to optionally schedule the service to automatically run the report. If creating a standard report, use the Filters tab to select an optional filter. Please note, if no filter is selected all entries are output. If creating a frequency detection report, add each filter and specify the frequency. Use the Actions tab to configure the actions when the report automatically runs. When you are finished, close the dialog. To view an already created report Select the Reports and Views view. Double-click on the report or click on the report and select Display Selected Report from the popup menu. Replacement Tags When writing a standard report to file you can specify the following tags within the filename: Tag <DATE> <TIME> Description Replaces the <DATE> tag with the current date in the following format: yyyymmdd Replaces the <TIME> tag with the current time in the following format: hhmmss For more information see Frequency Detection Failed Logon Reports Page 137
138 Saving the Current Page to File Once you have created a page with merged logs and filtered entries you may want to save the results to a file. Select Save Current Page As from the File menu. Specify the file name and type. CSV, HTML, XML, and TXT are supported. The CSV export is optimized for Microsoft Excel. Lastly, click Save. Note: Since a page may contain entries from multiple computers and logs, you can not export to EVT. Page 138
139 Schedule Distribution Manager For performance reasons, it is best to stagger download schedules when downloading a significant number of logs. This task can be accomplished by logically grouping configured computers and then setting the schedule for each logical group via the Configuration Wizard. This format has it limitations however. When you configure the multiple logs within the Configuration Wizard at the same time, the schedule is set the same for each log. To remove this limitation, we added the Schedule Distribution Manager accessed via the Configuration Wizard. To distribute schedules Check the computers to update from the Configured Computers view. Right click and select Configure Selected Computers. Select the Schedule tab. Click the Distribute Schedules button. Please note only download log configurations that are configured to automatically download are included in the distribution algorithm. Once the Schedule Distribution Manager is open, specify the schedule type, schedule type options, and lastly the time of day to exclude. Once finished, click the Distribute Schedules button. Each schedule should be evenly distributed throughout the time period you specified. To verify a schedule is satisfactory, select the configured log from the left pane. The new schedule will now display in the lower right pane. Click the OK button when you are finished. For more information, see: Configuration Wizard Page 139
140 Searching Event Logs Event logs can contain thousands of entries. Network Event Viewer allows you to search the current page for specific events. For information on filtering logs see Filters. Find Dialog Box The Find dialog box allows you to search for events within the current view or page. You can access the Find dialog box by choosing Find on the View menu, or by pressing Ctrl-F, or by selecting the toolbar button. The Find dialog box searches through the view from the insertion point down or from the insertion point up, depending on which search direction you choose. The Find dialog box provides many search parameters to help you improve the accuracy of your search. Regular expression support enables you to search on multiple criteria within the same search parameter. For example, using regular expressions you can search a range of specific Event IDs. Use the following search string to search all entries between 500 and 600: \b[5-6][0-9][0-9]$ The \b states start with. The $ states end with. The [x-x] states search for all numbers between the values. Use the following search string to search for event IDs 150 and 6005: \b150$ \b6005$ Put both of these together and you get: \b150$ \b6005$ \b[5-6][0-9][0-9]$ Message Enter the text for which you intend to search. This field support regular expressions. Match case When selected, the search operation looks only for occurrences that match the uppercase and lowercase characters you enter in the Message box. Search Up When selected, the view is searched from the current row to the top. Use Regular Expression When selected, all fields denoted with an * search using regular expressions. Host When specified, only logs from this host will be searched. This field support regular expressions. Log When specified, only these logs will be searched. Select the drop-down list to display a list of known logs. Time Select the drop-down list to select the time range. If you select Specify time, use the After and Before check boxes and the date time pickers to specify the time range. Source Page 140

141 When specified, only these sources will be searched. Category When specified, only these categories will be searched. Event When specified, only these events will be searched. User When specified, only these users will be searched. Mark All Highlights each event that meets the search criteria. Clear All Clears all highlights generated from the previous search. More Enables advanced search parameters. Less Disables advanced search parameters. Page 141
142 Selecting Specific Computers and Logs To select multiple computers, check each computer of interest. To automatically select computers that match specific search criteria, right click and select Select Specific Computers. From the Select Computers dialog, specify the search criteria. Please note this dialog uses regular expressions. The use of * to denote any is not required. For more information, see: Configuring Log Management Page 142
143 Simple Filter Criteria Dialog The Simple Filter Criteria Dialog Box is very similar to the Find Dialog. The 2 differences are the Type of Event Filter, Show or Hide, and the Event Types, Information, Warning, Error, Success Audit, and Failure Audit. Fields denoted with an asterisks support regular expressions. For more information, see Regular Expressions. Type Select the drop-down list to select the type. If you select Show, all events that meet the criteria will be shown. If you select Hide, all the events the meet the criteria will be hidden. Message Enter the text for which you intend to search. This field support regular expressions. Match case When selected, the search operation looks only for occurrences that match the uppercase and lowercase characters you enter in the Message box. Use Regular Expression When selected, all fields denoted with an * search using regular expressions. Event Types Specify the Event Types to either show or hide depending on the Event Filter Type selected. Host When specified, only logs from this host will be searched. This field support regular expressions. Log When specified, only these logs will be searched. Select the drop-down list to display a list of known logs. Time Select the drop-down list to select the time range. If you select Specify time, use the After and Before check boxes and the date time pickers to specify the time range. Source When specified, only these sources will be searched. Category When specified, only these categories will be searched. Event When specified, only these events will be searched. Users can now delimit multiple event IDs using a comma or specify a range by using a dash, for example, 100,200, Please note this format is only supported when not using regular expressions. User When specified, only these users will be searched. Page 143
144 For more information, see: Creating Filters Regular Expressions Page 144
145 Syslog Syslog Server Network Event Viewer includes a self-contained syslog server that can be used to collect syslog messages from both computers and devices such as routers. Syslog messages are read and stored in Network Event Viewer's event log repository (SQL Server, MySQL, or the file system). A log is created for each device sending syslog messages enabling System Administrators to easily view entries for each device rather than having to sort though one log for a specific device. The syslog server is automatically enabled by default. Syslog level mappings Syslog defines 8 message levels. Since Windows only defines 3 levels not including Success Audit and Failure Audit Network Event Viewer must map syslog levels to Windows event levels. The table below defines the mapping we have chosen: Syslog Level Debug Info Notice Warning Error Critical Alert Emergency Event Log Level Info Info Warning Warning Error Error Error Error To view messages sent by each device Select Downloaded Logs from the Navigation view. Expand the host name or IP address. If messages have been processed on behalf of a device, the syslog log will now be visible. Highlight the syslog log and select Display Log from the popup menu. To view syslog messages in real-time Select Syslog Viewer from the View menu item. To disable or re-enable the syslog server Select Options from the Tools menu item and then select the Syslog tab. Monitoring Syslog Messages Syslog messages can be filtered and actions fired in real-time. To monitor syslog messages Select Syslog Configuration Wizard from the File menu item. Navigate to and check the computer of interest or map the computer or device if undiscoverable. Highlight the computer or device and select Syslog Configuration Wizard from the File menu item. Specify the logical group to place the computer or device in. If using the file system, optionally specify the maximum log size. Page 145
146 Click the Next button. Apply a filter and action. Note: When on the Options or Actions tabs and configuring multiple computers or devices at once, select each computer or device from the Computers/Devices combo-box at the top of the wizard to fine tune each configuration. Forwarding Filtered Event Log Entries to Syslog Optionally, users can assign filters to event log configurations and assign a syslog action to forward entries to the same or another syslogger. For more information see Configuring Log Management. For more information on syslog see: RFC 3164 available at Sending Service Messages to Syslog The Network Event Viewer Service logs all internal messages to the nev.log file located in the common application data directory. The service optionally forwards each generated message to your syslog server. To forward all messages to your syslog server, check the Enabled check box from the Options dialog s Syslog tab. Host Specify the host name of your syslog server. For example: yoursyslogserver. Facility Specify the syslog facility. The default value is Local1. Note: If you change any settings, you must restart the service for the changes to take effect. Note: The host and facility are also used to initialize the default values when configuring filter actions. For more information, see: Configuring Log Management RFC 3164 available at Page 146
147 System Status The System Status window loads at startup to provide users with a quick view of the service status, event log consolidation repository status, syslog server status (if configured), and each configured event log s consolidation status. Information about the last download is displayed next to each log. Downloads that failed are highlighted in red. To refresh the window set focus to the window by selecting anywhere within the detail view of the window and press F5. Page 147
148 Tray Icon Icons in the lower right corner of Windows Taskbar are called Tray Icons. Tray Icons display application status. The Network Event Viewer tray icon has three states: Service Running This is the normal state and indicates no events have passed filter criteria since the last time Network Event Viewer was opened. Service Stopped This state indicates the Network Event Viewer service is not running. Either use the Windows Service Control Manager or Network Event Viewer to turn the Network Event Viewer service on. Once running, the icon will change to the Service Running state. Notice This state is displayed when ever entries are downloaded that have passed filter criteria. Typically, you configure these types of events to send an , log to a file, SQL server, or your syslogger, however; even if no action is assigned, the entry is logged to the repository for later review. For more information, see Filter Action Events. To temporarily turn the tray icon off Select Close Tray Icon from the Service menu. NOTE: Message box, tray popup messages, and sound actions will no longer occur. To temporarily turn the tray icon on Select Start Tray Icon from the Service menu. To permanently disable or re-enable the tray icon Select Options from the Tools menu item. Select the Display tab. From the Tray Icon group, check the option to disable or un-check to re-enable. Page 148
149 Using a Database Network Event Viewer enables System Administrators to consolidate event logs on the local network and from multiple sites (WANs) using Microsoft SQL Server or MySQL as the event log repository. Unlike many event log consolidation products, Network Event Viewer's database schema is open and simple to select from enabling system administrators and developers easy access to entries. Microsoft SQL Server Database Schema The database schema is fairly straight forward. There are 5 tables plus a table for each event log file. Tables host_log host_log_archive type filter_action_event version Contains a list of all consolidated event logs. Contains a list of all archived event logs. Contains the 5 different event types: Information, Warning, Error, Success Audit, and Failure Audit. Contains all entries that pass assigned filter criteria during a download. A version table necessary for schema updates. Event Log Table Schema [entry_id] [int] IDENTITY(1,1) NOT NULL [type_id] [int] NOT NULL [date] [datetime] NOT NULL [source] [varchar](256) NULL [category] [varchar](256) NULL [event] [int] NULL [user] [varchar](256) NULL [message] [varchar](4096) NULL [data] [varbinary](2048) NULL [ext_alert_state] [int] default 0 NOT NULL [ext_flag_state] [int] default 0 NOT NULL [identifier] [bigint] NULL [categoryid] [int] NULL [strings] [varbinary](4096) NULL [notes] [varchar](4096) NULL [host] [varchar](256) NULL The primary key. Foreign key to the 'type' table. The date and time the event occurred. The source of the event. The event category. The event ID as seen in the Windows Event Viewer. The user that caused the event to occur. The event message The event data An alert flag that states if the entry passed assigned filter criteria during a download. Follow up flag set by the user from the event log viewer. The event ID. The event category used when exporting event logs to the Windows EVT file format. The event replacement strings used when exporting event logs to the Windows EVT file format. User assigned notes. The host the entry is was originally sent from. Configuring the Database Connection Before Network Event Viewer can be configured to save all logs to a database or actions can be assigned to a filter via the Configuration Wizard, the database connection information must be set. Setting the Database Connection Parameters Page 149
150 The database connection information is set from within the Options dialog. To open the Options dialog, select Options from the Tools menu item. Once open, select the Database tab. From the Database tab of the Options dialog, specify the database type, host, database, authentication mode (SQL Server only) and optionally the username and password to connect. The user must have rights to create new tables. Once input, click the initialize button. You are now ready to configure Network Event Viewer to use your database as your log repository or assign database actions to filters. Setting the Database Connection and Command Timeouts When downloading many logs at the same time or when querying large logs it may become necessary to increase the connection and/or command timeouts. Use the connection timeout and command timeout controls to increase the timeouts. Database Log Repository To configure Network Event Viewer to use a database instead of the file system for the log repository, select the Download tab in the Options dialog. Next select Save downloaded log files to a database from the Event Log Repository combo box. For more information, see Display options. Database Filter Actions When entries match filter criteria, Network Event Viewer can write entries to a database table. For more information, see Configuration Wizard. Page 150

151 Viewing Entries in Groups Just like Windows Explorer, Network Event Viewer supports viewing list items in groups. To view entries in groups, drag and drop the column to group by to the detail view header. For more information, see: Display Pages Page 151
SpectorSoft Disk Monitor Help
 SpectorSoft Disk Monitor Help 5/3/2013 i SpectorSoft Disk Monitor Table of Contents Getting Started... 1 SpectorSoft Disk Monitor Help... 1 How it Works... 2 Tutorials... 3 Free Disk Space and SMART Status
Server Manager Help 10/6/2014 1
 Server Manager Help 10/6/2014 1 Table of Contents Server Manager Help... 1 Getting Started... 7 About SpectorSoft Server Manager... 8 Client Server Architecture... 9 System Requirements... 10 Screencasts...
SpectorSoft Log Manager Help
 SpectorSoft Log Manager Help 10/8/2013 2013 SpectorSoft Corporation, All rights reserved. Table of Contents Getting Started... 1 About... 1 How it Works... 3 Upgrading from Network Event Viewer... 4 System
Advanced Event Viewer Manual
 Advanced Event Viewer Manual Document version: 2.2944.01 Download Advanced Event Viewer at: http://www.advancedeventviewer.com Page 1 Introduction Advanced Event Viewer is an award winning application
DiskPulse DISK CHANGE MONITOR
 DiskPulse DISK CHANGE MONITOR User Manual Version 7.9 Oct 2015 www.diskpulse.com info@flexense.com 1 1 DiskPulse Overview...3 2 DiskPulse Product Versions...5 3 Using Desktop Product Version...6 3.1 Product
VX Search File Search Solution. VX Search FILE SEARCH SOLUTION. User Manual. Version 8.2. Jan 2016. www.vxsearch.com info@flexense.com. Flexense Ltd.
 VX Search FILE SEARCH SOLUTION User Manual Version 8.2 Jan 2016 www.vxsearch.com info@flexense.com 1 1 Product Overview...4 2 VX Search Product Versions...8 3 Using Desktop Product Versions...9 3.1 Product
NetWrix SQL Server Change Reporter
 NetWrix SQL Server Change Reporter Version 2.2 Administrator Guide Contents NetWrix SQL Server Change Reporter Administrator Guide 1. INTRODUCTION... 3 1.1 KEY FEATURES... 3 1.2 LICENSING... 4 1.3 HOW
Legal Notes. Regarding Trademarks. 2012 KYOCERA Document Solutions Inc.
 Legal Notes Unauthorized reproduction of all or part of this guide is prohibited. The information in this guide is subject to change without notice. We cannot be held liable for any problems arising from
3 Setting up Databases on a Microsoft SQL 7.0 Server
 3 Setting up Databases on a Microsoft SQL 7.0 Server Overview of the Installation Process To set up GoldMine properly, you must follow a sequence of steps to install GoldMine s program files, and the other
WebSpy Vantage Ultimate 2.2 Web Module Administrators Guide
 WebSpy Vantage Ultimate 2.2 Web Module Administrators Guide This document is intended to help you get started using WebSpy Vantage Ultimate and the Web Module. For more detailed information, please see
GP REPORTS VIEWER USER GUIDE
 GP Reports Viewer Dynamics GP Reporting Made Easy GP REPORTS VIEWER USER GUIDE For Dynamics GP Version 2015 (Build 5) Dynamics GP Version 2013 (Build 14) Dynamics GP Version 2010 (Build 65) Last updated
Metalogix SharePoint Backup. Advanced Installation Guide. Publication Date: August 24, 2015
 Metalogix SharePoint Backup Publication Date: August 24, 2015 All Rights Reserved. This software is protected by copyright law and international treaties. Unauthorized reproduction or distribution of this
NETWRIX EVENT LOG MANAGER
 NETWRIX EVENT LOG MANAGER QUICK-START GUIDE FOR THE ENTERPRISE EDITION Product Version: 4.0 July/2012. Legal Notice The information in this publication is furnished for information use only, and does not
Version 4.61 or Later. Copyright 2013 Interactive Financial Solutions, Inc. All Rights Reserved. ProviderPro Network Administration Guide.
 Version 4.61 or Later Copyright 2013 Interactive Financial Solutions, Inc. All Rights Reserved. ProviderPro Network Administration Guide. This manual, as well as the software described in it, is furnished
NETWRIX FILE SERVER CHANGE REPORTER
 NETWRIX FILE SERVER CHANGE REPORTER ADMINISTRATOR S GUIDE Product Version: 3.3 April/2012. Legal Notice The information in this publication is furnished for information use only, and does not constitute
How To Install An Aneka Cloud On A Windows 7 Computer (For Free)
") MANJRASOFT PTY LTD Aneka 3.0 Manjrasoft 5/13/2013 This document describes in detail the steps involved in installing and configuring an Aneka Cloud. It covers the prerequisites for the installation, the
MANJRASOFT PTY LTD Aneka 3.0 Manjrasoft 5/13/2013 This document describes in detail the steps involved in installing and configuring an Aneka Cloud. It covers the prerequisites for the installation, the
Freshservice Discovery Probe User Guide
 Freshservice Discovery Probe User Guide 1. What is Freshservice Discovery Probe? 1.1 What details does Probe fetch? 1.2 How does Probe fetch the information? 2. What are the minimum system requirements
Migrating TimeForce To A New Server
 Rev. 4/28/14 Migrating TimeForce To A New Server Table of Contents 1. Installation Prerequisites... 2 Required... 2 Recommended... 3 2. Update to a Migration Compatible Version... 3 Determine the Database
NovaBACKUP. Storage Server. NovaStor / May 2011
 NovaBACKUP Storage Server NovaStor / May 2011 2011 NovaStor, all rights reserved. All trademarks are the property of their respective owners. Features and specifications are subject to change without notice.
STIDistrict Server Replacement
 STIDistrict Server Replacement Major Steps Defined This document addresses how to migrate data and applications from an existing STIDistrict (SQL) Server to a new machine. There will be 8 major steps:
NetWrix Server Configuration Monitor
 NetWrix Server Configuration Monitor Version 2.2 Quick Start Guide Contents NetWrix Server Configuration Monitor Quick Start Guide 1. INTRODUCTION... 3 1.1 KEY FEATURES... 3 1.2 LICENSING... 4 1.3 HOW
Portions of this product were created using LEADTOOLS 1991-2009 LEAD Technologies, Inc. ALL RIGHTS RESERVED.
 Installation Guide Lenel OnGuard 2009 Installation Guide, product version 6.3. This guide is item number DOC-110, revision 1.038, May 2009 Copyright 1992-2009 Lenel Systems International, Inc. Information
User Guide Online Backup
 User Guide Online Backup Table of contents Table of contents... 1 Introduction... 2 Adding the Online Backup Service to your Account... 2 Getting Started with the Online Backup Software... 4 Downloading
Attix5 Pro Server Edition
 Attix5 Pro Server Edition V7.0.2 User Manual for Mac OS X Your guide to protecting data with Attix5 Pro Server Edition. Copyright notice and proprietary information All rights reserved. Attix5, 2013 Trademarks
WhatsUp Gold v16.3 Installation and Configuration Guide
 WhatsUp Gold v16.3 Installation and Configuration Guide Contents Installing and Configuring WhatsUp Gold using WhatsUp Setup Installation Overview... 1 Overview... 1 Security considerations... 2 Standard
Features at a Glance. Interrogation. History. Hierarchical Monitoring. Windows Server Monitoring
 About Internet Server Monitor is a network server monitoring tool enabling System Administrators to monitor servers and the network applications they host for failures, recoveries and load. Minimize downtime
TANDBERG MANAGEMENT SUITE 10.0
 TANDBERG MANAGEMENT SUITE 10.0 Installation Manual Getting Started D12786 Rev.16 This document is not to be reproduced in whole or in part without permission in writing from: Contents INTRODUCTION 3 REQUIREMENTS
NETWRIX EVENT LOG MANAGER
 NETWRIX EVENT LOG MANAGER ADMINISTRATOR S GUIDE Product Version: 4.0 July/2012. Legal Notice The information in this publication is furnished for information use only, and does not constitute a commitment
WhatsUp Gold v16.1 Installation and Configuration Guide
 WhatsUp Gold v16.1 Installation and Configuration Guide Contents Installing and Configuring Ipswitch WhatsUp Gold v16.1 using WhatsUp Setup Installing WhatsUp Gold using WhatsUp Setup... 1 Security guidelines
Spector 360 Deployment Guide. Version 7
 Spector 360 Deployment Guide Version 7 December 11, 2009 Table of Contents Deployment Guide...1 Spector 360 DeploymentGuide... 1 Installing Spector 360... 3 Installing Spector 360 Servers (Details)...
QUANTIFY INSTALLATION GUIDE
 QUANTIFY INSTALLATION GUIDE Thank you for putting your trust in Avontus! This guide reviews the process of installing Quantify software. For Quantify system requirement information, please refer to the
Sophos for Microsoft SharePoint startup guide
 Sophos for Microsoft SharePoint startup guide Product version: 2.0 Document date: March 2011 Contents 1 About this guide...3 2 About Sophos for Microsoft SharePoint...3 3 System requirements...3 4 Planning
Installing LearningBay Enterprise Part 2
 Installing LearningBay Enterprise Part 2 Support Document Copyright 2012 Axiom. All Rights Reserved. Page 1 Please note that this document is one of three that details the process for installing LearningBay
DiskBoss. File & Disk Manager. Version 2.0. Dec 2011. Flexense Ltd. www.flexense.com info@flexense.com. File Integrity Monitor
 DiskBoss File & Disk Manager File Integrity Monitor Version 2.0 Dec 2011 www.flexense.com info@flexense.com 1 Product Overview DiskBoss is an automated, rule-based file and disk manager allowing one to
Moving the TRITON Reporting Databases
 Moving the TRITON Reporting Databases Topic 50530 Web, Data, and Email Security Versions 7.7.x, 7.8.x Updated 06-Nov-2013 If you need to move your Microsoft SQL Server database to a new location (directory,
Password Reset Server Installation Guide Windows 8 / 8.1 Windows Server 2012 / R2
 Password Reset Server Installation Guide Windows 8 / 8.1 Windows Server 2012 / R2 Last revised: November 12, 2014 Table of Contents Table of Contents... 2 I. Introduction... 4 A. ASP.NET Website... 4 B.
NetWrix Account Lockout Examiner Version 4.0 Administrator Guide
 NetWrix Account Lockout Examiner Version 4.0 Administrator Guide Table of Contents Concepts... 1 Product Architecture... 1 Product Settings... 2 List of Managed Domains and Domain Controllers... 2 Email
Sage Intelligence Financial Reporting for Sage ERP X3 Version 6.5 Installation Guide
 Sage Intelligence Financial Reporting for Sage ERP X3 Version 6.5 Installation Guide Table of Contents TABLE OF CONTENTS... 3 1.0 INTRODUCTION... 1 1.1 HOW TO USE THIS GUIDE... 1 1.2 TOPIC SUMMARY...
Upgrading from MSDE to SQL Server 2005 Express Edition with Advanced Services SP2
 Upgrading from MSDE to SQL Server 2005 Express Edition with Advanced Services SP2 Installation and Configuration Introduction This document will walk you step by step in removing MSDE and the setup and
NetWrix File Server Change Reporter. Quick Start Guide
 NetWrix File Server Change Reporter Quick Start Guide Introduction... 3 Product Features... 3 Licensing... 3 How It Works... 4 Getting Started... 5 System Requirements... 5 Setup... 5 Additional Considerations...
TSM Studio Server User Guide 2.9.0.0
 TSM Studio Server User Guide 2.9.0.0 1 Table of Contents Disclaimer... 4 What is TSM Studio Server?... 5 System Requirements... 6 Database Requirements... 6 Installing TSM Studio Server... 7 TSM Studio
with the ArchiveSync Add-On Evaluator s Guide 2015 Software Pursuits, Inc.
 with the ArchiveSync Add-On Evaluator s Guide 2015 Table of Contents Introduction... 2 System Requirements... 2 Contact Information... 3 Required Add-Ons for ArchiveSync in Real-Time... 3 Communications
Secret Server Installation Windows Server 2008 R2
 Table of Contents Introduction... 2 ASP.NET Website... 2 SQL Server Database... 2 Administrative Access... 2 Prerequisites... 2 System Requirements Overview... 2 Additional Recommendations... 3 Beginning
Installation instructions for MERLIN Dashboard
 Installation instructions for MERLIN Dashboard Contents Installation Prerequisites:... 2 Procedure to manually backup and restore Views and Settings in AxOEE Manager... 3 For XP users go to:... 3 For Vista
How To Backup Your Computer With A Remote Drive Client On A Pc Or Macbook Or Macintosh (For Macintosh) On A Macbook (For Pc Or Ipa) On An Uniden (For Ipa Or Mac Macbook) On
 On A Macbook (For Pc Or Ipa) On An Uniden (For Ipa Or Mac Macbook) On") Remote Drive PC Client software User Guide -Page 1 of 27- PRIVACY, SECURITY AND PROPRIETARY RIGHTS NOTICE: The Remote Drive PC Client software is third party software that you can use to upload your files
Remote Drive PC Client software User Guide -Page 1 of 27- PRIVACY, SECURITY AND PROPRIETARY RIGHTS NOTICE: The Remote Drive PC Client software is third party software that you can use to upload your files
SAS Business Data Network 3.1
 SAS Business Data Network 3.1 User s Guide SAS Documentation The correct bibliographic citation for this manual is as follows: SAS Institute Inc. 2014. SAS Business Data Network 3.1: User's Guide. Cary,
Ajera 7 Installation Guide
 Ajera 7 Installation Guide Ajera 7 Installation Guide NOTICE This documentation and the Axium software programs may only be used in accordance with the accompanying Axium Software License and Services
NETWORK PRINT MONITOR User Guide
 NETWORK PRINT MONITOR User Guide Legal Notes Unauthorized reproduction of all or part of this guide is prohibited. The information in this guide is subject to change without notice. We cannot be held liable
Getting Started - The Control Panel
 Table of Contents 1. Getting Started - the Control Panel Login Navigation Bar Domain Limits Domain User Account Properties Session Management 2. FTP Management Creating and Editing Users Accessing FTP
Spector 360 Deployment Guide. Version 7.3 January 3, 2012
 Spector 360 Deployment Guide Version 7.3 January 3, 2012 Table of Contents Deploy to All Computers... 48 Step 1: Deploy the Servers... 5 Recorder Requirements... 52 Requirements... 5 Control Center Server
User Guide. Version 3.2. Copyright 2002-2009 Snow Software AB. All rights reserved.
 Version 3.2 User Guide Copyright 2002-2009 Snow Software AB. All rights reserved. This manual and computer program is protected by copyright law and international treaties. Unauthorized reproduction or
Live Maps. for System Center Operations Manager 2007 R2 v6.2.1. Installation Guide
 Live Maps for System Center Operations Manager 2007 R2 v6.2.1 Installation Guide CONTENTS Contents... 2 Introduction... 4 About This Guide... 4 Supported Products... 4 Understanding Live Maps... 4 Live
How To Use Senior Systems Cloud Services
 Senior Systems Cloud Services In this guide... Senior Systems Cloud Services 1 Cloud Services User Guide 2 Working In Your Cloud Environment 3 Cloud Profile Management Tool 6 How To Save Files 8 How To
NETWRIX USER ACTIVITY VIDEO REPORTER
 NETWRIX USER ACTIVITY VIDEO REPORTER ADMINISTRATOR S GUIDE Product Version: 1.0 January 2013. Legal Notice The information in this publication is furnished for information use only, and does not constitute
NETWRIX WINDOWS SERVER CHANGE REPORTER
 NETWRIX WINDOWS SERVER CHANGE REPORTER INSTALLATION AND CONFIGURATION GUIDE Product Version: 4.0 March 2013. Legal Notice The information in this publication is furnished for information use only, and
Nexio Connectus with Nexio G-Scribe
 Nexio Connectus with Nexio G-Scribe 2.1.2 3/20/2014 Edition: A 2.1.2 Publication Information 2014 Imagine Communications. Proprietary and Confidential. Imagine Communications considers this document and
StrikeRisk v6.0 IEC/EN 62305-2 Risk Management Software Getting Started
 StrikeRisk v6.0 IEC/EN 62305-2 Risk Management Software Getting Started Contents StrikeRisk v6.0 Introduction 1/1 1 Installing StrikeRisk System requirements Installing StrikeRisk Installation troubleshooting
Application Note 116: Gauntlet System High Availability Using Replication
 Customer Service: 425-487-1515 Technical Support: 425-951-3390 Fax: 425-487-2288 Email: info@teltone.com support@teltone.com Website: www.teltone.com Application Note 116: Gauntlet System High Availability
CRM Migration Manager 3.1.1 for Microsoft Dynamics CRM. User Guide
 CRM Migration Manager 3.1.1 for Microsoft Dynamics CRM User Guide Revision D Issued July 2014 Table of Contents About CRM Migration Manager... 4 System Requirements... 5 Operating Systems... 5 Dynamics
BillQuick Agent 2010 Getting Started Guide
 Time Billing and Project Management Software Built With Your Industry Knowledge BillQuick Agent 2010 Getting Started Guide BQE Software, Inc. 2601 Airport Drive Suite 380 Torrance CA 90505 Support: (310)
ILTA HANDS ON Securing Windows 7
 Securing Windows 7 8/23/2011 Table of Contents About this lab... 3 About the Laboratory Environment... 4 Lab 1: Restricting Users... 5 Exercise 1. Verify the default rights of users... 5 Exercise 2. Adding
Pro Bundle Evaluator s Guide. 2015 Software Pursuits, Inc.
 Pro Bundle Evaluator s Guide 2015 Table of Contents Introduction... 2 System Requirements... 2 Contact Information... 3 About the Communications Agent Add-On... 3 Other SureSync Add-Ons... 4 File Locking
Deploying BitDefender Client Security and BitDefender Windows Server Solutions
 Deploying BitDefender Client Security and BitDefender Windows Server Solutions Quick Install Guide Copyright 2010 BitDefender; 1. Installation Overview Thank you for selecting BitDefender Business Solutions
Secret Server Installation Windows 8 / 8.1 and Windows Server 2012 / R2
 Secret Server Installation Windows 8 / 8.1 and Windows Server 2012 / R2 Table of Contents Table of Contents... 1 I. Introduction... 3 A. ASP.NET Website... 3 B. SQL Server Database... 3 C. Administrative
Tracking Network Changes Using Change Audit
 CHAPTER 14 Change Audit tracks and reports changes made in the network. Change Audit allows other RME applications to log change information to a central repository. Device Configuration, Inventory, and
InventoryControl for use with QuoteWerks Quick Start Guide
 InventoryControl for use with QuoteWerks Quick Start Guide Copyright 2013 Wasp Barcode Technologies 1400 10 th St. Plano, TX 75074 All Rights Reserved STATEMENTS IN THIS DOCUMENT REGARDING THIRD PARTY
enicq 5 System Administrator s Guide
 Vermont Oxford Network enicq 5 Documentation enicq 5 System Administrator s Guide Release 2.0 Published November 2014 2014 Vermont Oxford Network. All Rights Reserved. enicq 5 System Administrator s Guide
Integrating LANGuardian with Active Directory
 Integrating LANGuardian with Active Directory 01 February 2012 This document describes how to integrate LANGuardian with Microsoft Windows Server and Active Directory. Overview With the optional Identity
Upgrading to Document Manager 2.7
 Upgrading to Document Manager 2.7 22 July 2013 Trademarks Document Manager and Document Manager Administration are trademarks of Document Logistix Ltd. TokOpen, TokAdmin, TokImport and TokExRef are registered
Pharos Control User Guide
 Outdoor Wireless Solution Pharos Control User Guide REV1.0.0 1910011083 Contents Contents... I Chapter 1 Quick Start Guide... 1 1.1 Introduction... 1 1.2 Installation... 1 1.3 Before Login... 8 Chapter
RingStor User Manual. Version 2.1 Last Update on September 17th, 2015. RingStor, Inc. 197 Route 18 South, Ste 3000 East Brunswick, NJ 08816.
 RingStor User Manual Version 2.1 Last Update on September 17th, 2015 RingStor, Inc. 197 Route 18 South, Ste 3000 East Brunswick, NJ 08816 Page 1 Table of Contents 1 Overview... 5 1.1 RingStor Data Protection...
LepideAuditor Suite for File Server. Installation and Configuration Guide
 LepideAuditor Suite for File Server Installation and Configuration Guide Table of Contents 1. Introduction... 4 2. Requirements and Prerequisites... 4 2.1 Basic System Requirements... 4 2.2 Supported Servers
TROUBLESHOOTING GUIDE
 Lepide Software LepideAuditor Suite TROUBLESHOOTING GUIDE This document explains the troubleshooting of the common issues that may appear while using LepideAuditor Suite. Copyright LepideAuditor Suite,
Application Performance Monitoring for WhatsUp Gold v16.1 User Guide
 Application Performance Monitoring for WhatsUp Gold v16.1 User Guide Contents Table of Contents Introduction APM Overview... 1 Learning about APM terminology... 2 Getting Started with APM... 3 Application
TIGERPAW EXCHANGE INTEGRATOR SETUP GUIDE V3.6.0 August 26, 2015
 TIGERPAW EXCHANGE INTEGRATOR SETUP GUIDE V3.6.0 August 26, 2015 2201 Thurston Circle Bellevue, NE 68005 www.tigerpawsoftware.com Contents Tigerpaw Exchange Integrator Setup Guide v3.6.0... 1 Contents...
WhatsUp Gold v16.2 Installation and Configuration Guide
 WhatsUp Gold v16.2 Installation and Configuration Guide Contents Installing and Configuring Ipswitch WhatsUp Gold v16.2 using WhatsUp Setup Installing WhatsUp Gold using WhatsUp Setup... 1 Security guidelines
Table of Contents SQL Server Option
 Table of Contents SQL Server Option STEP 1 Install BPMS 1 STEP 2a New Customers with SQL Server Database 2 STEP 2b Restore SQL DB Upsized by BPMS Support 6 STEP 2c - Run the "Check Dates" Utility 7 STEP
Avatier Identity Management Suite
 Avatier Identity Management Suite Migrating AIMS Configuration and Audit Log Data To Microsoft SQL Server Version 9 2603 Camino Ramon Suite 110 San Ramon, CA 94583 Phone: 800-609-8610 925-217-5170 FAX:
Bitrix Site Manager ASP.NET. Installation Guide
 Bitrix Site Manager ASP.NET Installation Guide Contents Introduction... 4 Chapter 1. Checking for IIS Installation... 5 Chapter 2. Using An Archive File to Install Bitrix Site Manager ASP.NET... 7 Preliminary
User Guide. SysMan Utilities. By Sysgem AG
 SysMan Utilities User Guide By Sysgem AG Sysgem is a trademark of Sysgem AG. Other brands and products are registered trademarks of their respective holders. 2013 Sysgem AG, Lavaterstr. 45, CH-8002 Zürich,
Hosting Users Guide 2011
 Hosting Users Guide 2011 eofficemgr technology support for small business Celebrating a decade of providing innovative cloud computing services to small business. Table of Contents Overview... 3 Configure
Welcome to the QuickStart Guide
 QuickStart Guide Welcome to the QuickStart Guide This QuickStart Guide provides the information you need to install and start using Express Software Manager. For more comprehensive help on using Express
Table of Contents. CHAPTER 1 About This Guide... 9. CHAPTER 2 Introduction... 11. CHAPTER 3 Database Backup and Restoration... 15
 Table of Contents CHAPTER 1 About This Guide......................... 9 The Installation Guides....................................... 10 CHAPTER 2 Introduction............................ 11 Required
Exchange Mailbox Protection
 User Guide This guide applies to Windows Server 2008 and later. For Windows Server 2003, refer to the Exchange Server Protection whitepaper. BackupAssist User Guides explain how to create and modify backup
NAS 253 Introduction to Backup Plan
 NAS 253 Introduction to Backup Plan Create backup jobs using Backup Plan in Windows A S U S T O R C O L L E G E COURSE OBJECTIVES Upon completion of this course you should be able to: 1. Create backup
NSi Mobile Installation Guide. Version 6.2
 NSi Mobile Installation Guide Version 6.2 Revision History Version Date 1.0 October 2, 2012 2.0 September 18, 2013 2 CONTENTS TABLE OF CONTENTS PREFACE... 5 Purpose of this Document... 5 Version Compatibility...
SysPatrol - Server Security Monitor
 SysPatrol Server Security Monitor User Manual Version 2.2 Sep 2013 www.flexense.com www.syspatrol.com 1 Product Overview SysPatrol is a server security monitoring solution allowing one to monitor one or
SonicWALL SSL VPN 3.5: Virtual Assist
 SonicWALL SSL VPN 3.5: Virtual Assist Document Scope This document describes how to use the SonicWALL Virtual Assist add-on for SonicWALL SSL VPN security appliances. This document contains the following
Exchange Mailbox Protection Whitepaper
 Exchange Mailbox Protection Contents 1. Introduction... 2 Documentation... 2 Licensing... 2 Exchange add-on comparison... 2 Advantages and disadvantages of the different PST formats... 3 2. How Exchange
Using SQL Reporting Services with Amicus
 Using SQL Reporting Services with Amicus Applies to: Amicus Attorney Premium Edition 2011 SP1 Amicus Premium Billing 2011 Contents About SQL Server Reporting Services...2 What you need 2 Setting up SQL
Richmond SupportDesk Web Reports Module For Richmond SupportDesk v6.72. User Guide
 Richmond SupportDesk Web Reports Module For Richmond SupportDesk v6.72 User Guide Contents 1 Introduction... 4 2 Requirements... 5 3 Important Note for Customers Upgrading... 5 4 Installing the Web Reports
ScriptLogic File System Auditor Agent Configuration Getting Started Guide
 ScriptLogic File System Auditor Agent Configuration Getting Started Guide FILE SYSTEM AUDITOR II 2011 by ScriptLogic Corporation All rights reserved. This publication is protected by copyright and all
RoomWizard Synchronization Software Manual Installation Instructions
 2 RoomWizard Synchronization Software Manual Installation Instructions Table of Contents Exchange Server Configuration... 4 RoomWizard Synchronization Software Installation and Configuration... 5 System
WhatsUp Gold v16.2 Database Migration and Management Guide
 WhatsUp Gold v16.2 Database Migration and Management Guide Contents CHAPTER 1 How to use this guide CHAPTER 2 Migrating the WhatsUp Gold Microsoft SQL Server 2008 R2 Express Edition database to Microsoft
Attix5 Pro Server Edition
 Attix5 Pro Server Edition V7.0.3 User Manual for Linux and Unix operating systems Your guide to protecting data with Attix5 Pro Server Edition. Copyright notice and proprietary information All rights reserved.
Juris Installation / Upgrade Guide
 Juris Installation / Upgrade Guide Version 2.7 2015 LexisNexis. All rights reserved. Copyright and Trademark LexisNexis, Lexis, and the Knowledge Burst logo are registered trademarks of Reed Elsevier Properties
Administration Guide. Novell Storage Manager 3.1.1 for Active Directory. Novell Storage Manager 3.1.1 for Active Directory Administration Guide
 Novell Storage Manager 3.1.1 for Active Directory Administration Guide www.novell.com/documentation Administration Guide Novell Storage Manager 3.1.1 for Active Directory October 17, 2013 Legal Notices
VERITAS Backup Exec TM 10.0 for Windows Servers
 VERITAS Backup Exec TM 10.0 for Windows Servers Quick Installation Guide N134418 July 2004 Disclaimer The information contained in this publication is subject to change without notice. VERITAS Software
Secrets of Event Viewer for Active Directory Security Auditing Lepide Software
 Secrets of Event Viewer for Active Directory Security Auditing Windows Event Viewer doesn t need any introduction to the IT Administrators. However, some of its hidden secrets, especially those related
http://support.microsoft.com/kb/878449 Notes Transfer instructions INTRODUCTION More information
 Page 1 of 6 How to transfer an existing Microsoft Dynamics GP, Microsoft Small Business Financials, or Microsoft Small Business Manager installation to a new server that is running Microsoft SQL Server