White Paper. PlanetDEM 30. PlanetObserver 25/11/ Update
|
|
|
- Helen Daniel
- 8 years ago
- Views:
Transcription
1 White Paper PlanetDEM 30 PlanetObserver 25/11/ Update PlanetObserver France msat@planetobserver.com Tel

2 1. Introduction PlanetObserver presents PlanetDEM 30, a global Digital Elevation Model (DEM) that offers seamless and voidfree coverage with 30-meter resolution for the Earth s entire land surface. PlanetDEM 30 is based on 30-meter ASTER Global DEM v2.0 entirely corrected and completed with PlanetDEM 90, PlanetObserver high quality 90-meter global DEM product (see PlanetDEM 90 technical sheet in App I). Background information On ASTER Global DEM v2.0 The Advanced Spaceborne Thermal Emission and Reflection Radiometer (ASTER) Global Digital Elevation Model (GDEM) was developed jointly by the U.S. National Aeronautics and Space Administration (NASA) and Japan s Ministry of Economy, Trade, and Industry (METI). ASTER GDEM coverage is limited to land surfaces between 83 degrees north and 83 degrees south. ASTER GDEM v2.0 was released in October While benefiting from substantial improvements over GDEM v1, experts pointed out that the product still may contain anomalies and artifacts. On PlanetDEM 90 The NASA Shuttle Radar Topographic Mission (SRTM) has provided digital elevation data for over 80% of the globe. The latest SRTM data version (version 4) has been improved using new interpolation algorithms and better auxiliary data. However, SRTM data coverage is limited up to 60 degrees north and south, and despite void-filling processes used for producing SRTM data version 4, accuracy still remains an issue in many areas specially in relief and desert areas. PlanetObserver has developed PlanetDEM 90, a new high quality elevation dataset, processed from SRTM data combined with other source data. Elevation data have been compiled and extensively reprocessed in order to offer a comprehensive global DEM with precise, corrected and detailed information for the entire Earth. 2
 Global Digital Elevation Model (GDEM) was developed jointly by the U.S. National Aeronautics and Space Administration (NASA) and Japan s Ministry of Economy, Trade, and Industry (METI).")
3 2. Product features 2.1 Coverage PlanetDEM 30 product covers all emerged lands (at 99%). 2.2 Data sources and processing PlanetDEM 30 is processed from one major source data for the main Earth coverage which is ASTER GDEM version v2.0. That dataset which presents many accuracy issues covers the Earth from 83 N to 83 S. ASTER GDEM v2.0 anomalies and artifacts have been comprehensively and seamlessly replaced by totally accurate PlanetDEM 90 data. Exclusive proprietary algorithms have been developed in-house further to an extensive R&D programme. Differentiated processing techniques have been applied depending on relief types in order to offer the best adapted corrections of ASTER GDEM accuracy problems. Water bodies have been flattened on the entire dataset. The end-result is a 100% global product, free of ASTER GDEM v2.0 residual anomalies, artifacts and voids that highly affected overall data quality. [PlanetDEM 90 data sources and processing features are detailed in App. I] 2.3 Data specifications PlanetDEM 30 specifications in terms of vertical and horizontal accuracy are similar to GDEM specs which are reported to be as follows: - Vertical accuracy (LE95): 20 meters - Horizontal accuracy (CE95): 30 meters Ocean value is 0. Negative values are present in areas under the sea level. 2.4 Data structure and format Resolution : PlanetDEM 30 is available with a resolution of 1-arc second (approx. 30-meter resolution). File format : The product is available in the following formats : - GEOTIFF, 16 bit-format, divided in 5 x 5 tiles (18,000 x 18,000 pixels), for a total of 1449 tiles ; total dataset size : 876 GB. - DTED 2, divided in 1 x 1 tiles, for a total of 25,518 tiles ; total dataset size : 397 GB. Both file formats are supplied without tiles containing water only. 3

4 Colmar, France Brittany, France White Paper PlanetDEM 30 PlanetObserver Tile naming : For GeoTiff format, tiles are named as follows : PlanetDEM_30_(N or S)(yy)(W or E)(xxx).tif N or S = tile upper latitude W or E = tile left longitude Projection : The product comes in Geographic (latitude-longitude) projection, WGS84. Other projections can be provided on demand for specific AOIs. 3. Summary of PlanetDEM 30 benefits Homogeneous and seamless product ASTER GDEM v2.0 PlanetDEM 30 Free of all anomalies and artifacts ASTER GDEM v2.0 PlanetDEM 30 4

5 Entirely voidfree ASTER GDEM v2.0 PlanetDEM 30 Lake Naussac, France Mont-Blanc Catalonia, Spain ASTER GDEM v2.0 PlanetDEM 30 Flattened water body surfaces worldwide ASTER GDEM v2.0 PlanetDEM 30 5

6 Appendix I White Paper PlanetDEM Introduction PlanetObserver presents PlanetDEM 90, a new Digital Elevation Model (DEM) entirely reprocessed and offering a global coverage, with 90-meter resolution. Background information The NASA Shuttle Radar Topographic Mission (SRTM) has provided digital elevation data for over 80% of the globe. The latest SRTM data version (version 4) has been improved using new interpolation algorithms and better auxiliary data. However, SRTM data coverage is limited up to 60 degrees north and south, and despite void-filling processes used for producing SRTM data version 4, accuracy still remains an issue in many areas specially in relief and desert areas. PlanetObserver has developed a new high quality elevation dataset, processed from SRTM data combined with other source data. Elevation data have been compiled and extensively reprocessed in order to offer a comprehensive global DEM with precise, corrected and detailed information for the entire Earth. 6
 has been improved using new interpolation algorithms and better auxiliary data.")
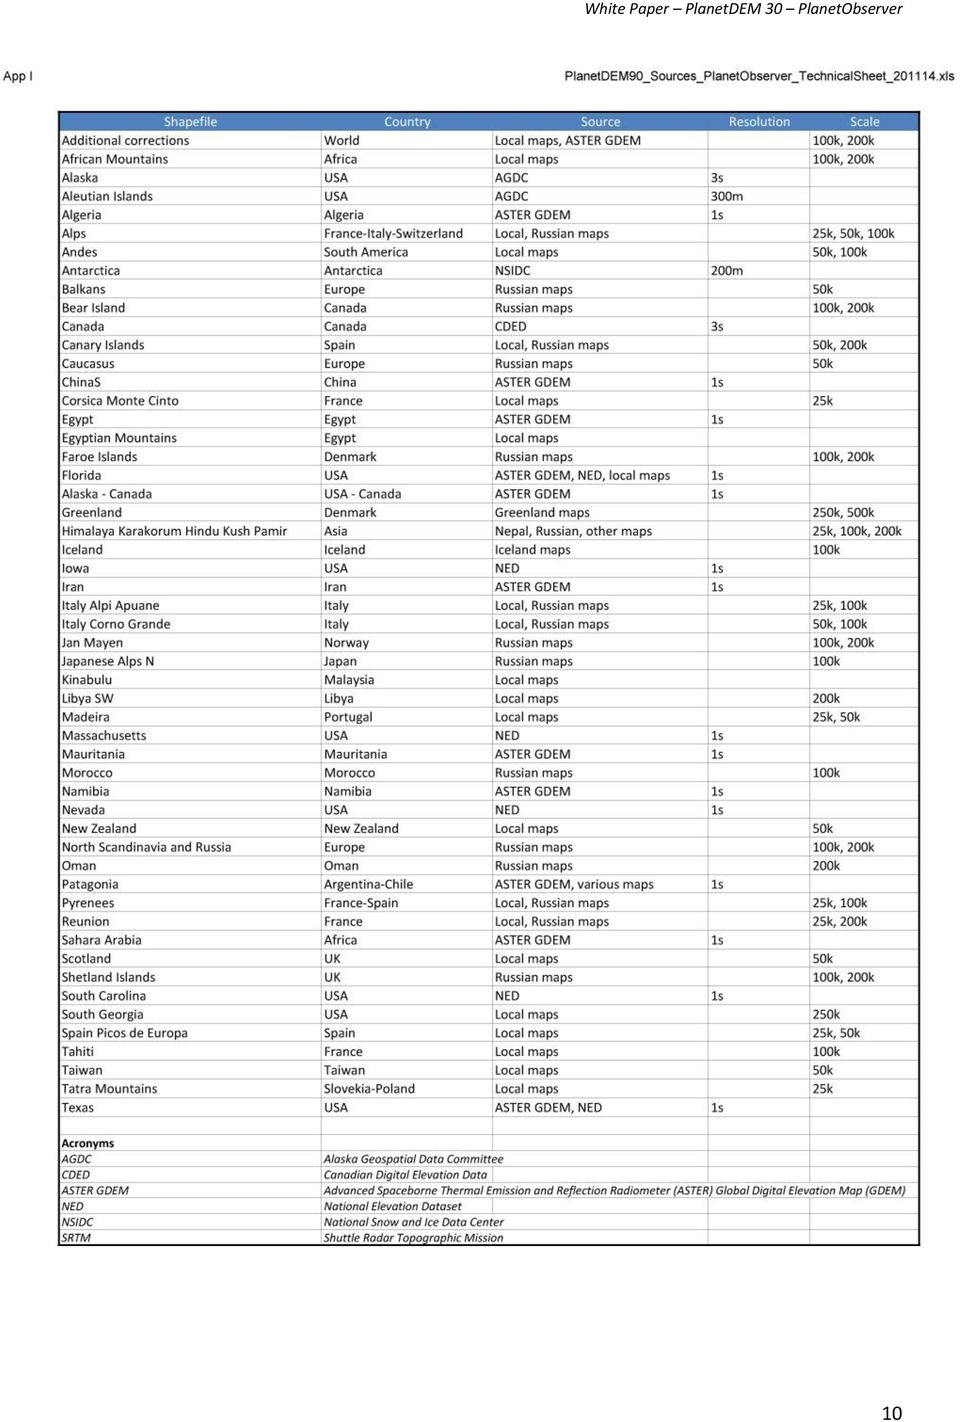
7 2. Product features 2.1 Coverage PlanetDEM 90 product covers all emerged lands (at 99%). The above map shows SRTM data coverage in grey colour, and in orange, areas that have been corrected within the SRTM dataset by using other source data. In blue, the map shows data that have been added beyond 60 North latitude and 60 South latitude. 2.2 Data sources PlanetDEM 90 is developed from different source data : SRTM version 4 (from 60 N to 60 S), which has been corrected in several places : - Mountain areas : Andes, African Mountains, Alps, Caucasus, Himalaya, Karakorum, Hindu Kush, Pamir and others have been corrected with different sources, particularly different local maps and Russian maps at scales 1:25,000, 1:50,000, 1:100,000 and 1:200, Desert : in Mauritania, Algeria, Libya, Egypt, Iran and others, GDEM (ASTER Global Digital Elevation Map) at 1s has been used to fill and correct SRTM bad values. - USA : Problems have been corrected by using GDEM and NED (National Elevation Dataset) at 1s in the following US States : Florida, Iowa, Massachusetts, Nevada, South Carolina and Texas. High Latitudes : Instead of GTOPO30 with 30-arc second resolution, more precise and accurate sources have been used : - Antarctica : NSIDC (National Snow and Ice Data Center), at 200m resolution. 7
, which has been corrected in several places : - Mountain areas : Andes, African Mountains,")
8 - Alaska : AGDC (Alaska Geospatial Data Clearinghouse), at 3s resolution, corrected with GDEM at 1s. - Canada : CDED (Canadian Digital Elevation Data) from Geobase, completed with GDEM at 1s. - Greenland : topographic maps at 1:250,000 and 1:500, Iceland and Svalbard : topographic maps at 1:100, North Atlantic Islands : Russian maps at 1:100,000 and 1:200, North Scandinavia, North Russia and North Siberia : Russian maps at 1:100,000 and 1:200,000. See more details on data sources in App I. 2.3 Data processing PlanetDEM 90 has been processed by compiling different source data. Specific processing methods have been developed and applied, with a particular focus on edge smoothing processing. 2.4 Data specifications PlanetDEM 90 specifications in terms of vertical and horizontal accuracy are similar to SRTM specs which are reported to be as follows: - Vertical accuracy (LE95): 14 meters - Horizontal accuracy (CE95): 10 meters Ocean value is 0. Negative values are present in areas under the sea level. 2.5 Data structure and format Resolution : PlanetDEM 90 is available with a resolution of 3-arc second (approx. 90m resolution). File format : The product is available in the following format : - GEOTIFF, 16 bit-format, divided in 5 x 5 tiles (6,000 x 6,000 pixels), for a total of 2,592 tiles (72 tiles width x 36 tiles height) ; total data size : 173 GB. - DTED 1, divided in 1 x 1 tiles, for a total of 64,800 tiles ; total data size : 125 GB. See tiling structure below. 8

9 Zone Latitude Latitude resolution Longitude resolution Tile size (in pixel) I 0-50 North-South 3 seconds x 3 seconds 1201 x 1201 II North-South 3 seconds x 6 seconds 601 x1201 III North-South 3 seconds x 9 seconds 401 x 1201 IV North-South 3 seconds x 12 seconds 301 x 1201 V North-South 3 seconds x 18 seconds 201 x 1201 Both file formats are supplied with tiles containing water only. Tile naming : For GeoTiff format, tiles are named as follows : PlanetDEM_90(N or S)(yy)(W or E)(xxx).tif N or S = tile upper latitude W or E = tile left longitude Projection : The product comes in Geographic (latitude-longitude) projection, WGS84. Other projections can be provided on demand for specific AOIs. 2.6 Source data See details about source data hereafter. 9
 projection, WGS84.")
10 10
AUTOMATED DEM VALIDATION USING ICESAT GLAS DATA INTRODUCTION
 AUTOMATED DEM VALIDATION USING ICESAT GLAS DATA Mary Pagnutti Robert E. Ryan Innovative Imaging and Research Corp. Building 1103, Suite 140C Stennis Space Center, MS 39529 mpagnutti@i2rcorp.com rryan@i2rcorp.com
Notable near-global DEMs include
 Visualisation Developing a very high resolution DEM of South Africa by Adriaan van Niekerk, Stellenbosch University DEMs are used in many applications, including hydrology [1, 2], terrain analysis [3],
On the CyberShARE site you will find this interpolated version (labeled SRTMv4_90m)
") SRTM Data on Cyber-ShARE The Shuttle Radar Topography Mission (SRTM) data collected by NASA represents the most up-to-date, globally collected topography data set of the Earth. It makes up the first globally
SRTM Data on Cyber-ShARE The Shuttle Radar Topography Mission (SRTM) data collected by NASA represents the most up-to-date, globally collected topography data set of the Earth. It makes up the first globally
TerraColor White Paper
 TerraColor White Paper TerraColor is a simulated true color digital earth imagery product developed by Earthstar Geographics LLC. This product was built from imagery captured by the US Landsat 7 (ETM+)
A CONCEPT OUTLINE ESTABLISHING THE
 Updated 13 November 2009 A CONCEPT OUTLINE ESTABLISHING THE Philippine GIS Data Clearinghouse (PhilGIS) www.philgis.org Prepared by Al Tongco, Ph.D. Stillwater, Oklahoma, U.S.A. al_tongco@yahoo.com Introduction
3D VISUALIZATION OF GEOTHERMAL WELLS DIRECTIONAL SURVEYS AND INTEGRATION WITH DIGITAL ELEVATION MODEL (DEM)
") Presented at Short Course VII on Exploration for Geothermal Resources, organized by UNU-GTP, GDC and KenGen, at Lake Bogoria and Lake Naivasha, Kenya, Oct. 27 Nov. 18, 2012. GEOTHERMAL TRAINING PROGRAMME
Presented at Short Course VII on Exploration for Geothermal Resources, organized by UNU-GTP, GDC and KenGen, at Lake Bogoria and Lake Naivasha, Kenya, Oct. 27 Nov. 18, 2012. GEOTHERMAL TRAINING PROGRAMME
Earth Data Science in The Era of Big Data and Compute
 Earth Data Science in The Era of Big Data and Compute E. Lynn Usery U.S. Geological Survey usery@usgs.gov http://cegis.usgs.gov U.S. Department of the Interior U.S. Geological Survey Board on Earth Sciences
COMPARISON OF SRTM AND 25K TOPOGRAPHIC MAPS IN TURKEY
 COMPARISON OF SRTM AND 25K TOPOGRAPHIC MAPS IN TURKEY Oztug Bildirici 1, Aydin Ustun, Necla Ulugtekin 2, H. Zahit Selvi 1, Alpay Abbak 1, Ilkay Bugdayci 1, A. Ozgur Dogru 2 1 Selcuk University, Faculty
APPLICATION OF GOOGLE EARTH FOR THE DEVELOPMENT OF BASE MAP IN THE CASE OF GISH ABBAY SEKELA, AMHARA STATE, ETHIOPIA
 APPLICATION OF GOOGLE EARTH FOR THE DEVELOPMENT OF BASE MAP IN THE CASE OF GISH ABBAY SEKELA, AMHARA STATE, ETHIOPIA Abineh Tilahun Department of Geography and environmental studies, Adigrat University,
DEM products from TerraSAR-X & TanDEM-X. Nora Meyer zu Erpen // 25.01.2011
 DEM products from TerraSAR- & TanDEM- Nora Meyer zu Erpen // 25.01.2011 GEO-Information Services within Astrium and EADS Airbus Eurocopter Cassidian Astrium Turnover 2009: 4.8 billion Staff 2009: 15,000*
Week 1. Week 2. Week 3
 Week 1 1. What US city has the largest population? 2. Where is Aachen? 3. What is the capitol of Florida? 4. What is the longest mountain range in Spain? 5. What countries border Equador? Week 2 1. What
EO based glacier monitoring
 EO based glacier monitoring THEMES 1. WGMS & GLIMS within GTN G: strategic set up 2. GlobGlacier & Glaciers_cci: EO based products 3. LDCM & Sentinel 2: future monitoring perspectives Frank Paul* Department
American-Eurasian Journal of Sustainable Agriculture
 Copyright 2015, American-Eurasian Network for Scientific Information publisher American-Eurasian Journal of Sustainable Agriculture ISSN: 1995-0748 JOURNAL home page: http://www.aensiweb.com/aejsa 2015
Earth Coordinates & Grid Coordinate Systems
 Earth Coordinates & Grid Coordinate Systems How do we model the earth? Datums Datums mathematically describe the surface of the Earth. Accounts for mean sea level, topography, and gravity models. Projections
Information Contents of High Resolution Satellite Images
 Information Contents of High Resolution Satellite Images H. Topan, G. Büyüksalih Zonguldak Karelmas University K. Jacobsen University of Hannover, Germany Keywords: satellite images, mapping, resolution,
Obtaining and Processing MODIS Data
 Obtaining and Processing MODIS Data MODIS is an extensive program using sensors on two satellites that each provide complete daily coverage of the earth. The data have a variety of resolutions; spectral,
SLOPE, REFLECTANCE, AND VIEWSHEDS ALGORITHMS FOR ARC-SECOND DIGITAL ELEVATION MODELS INTRODUCTION
 SLOPE, REFLECTANCE, AND VIEWSHEDS ALGORITHMS FOR ARC-SECOND DIGITAL ELEVATION MODELS Peter L. Guth, Professor Department of Oceanography United States Naval Academy 572C Holloway Road Annapolis, Maryland
Request for Proposals for Topographic Mapping. Issued by: Teton County GIS and Teton County Engineering Teton County, Wyoming
 Request for Proposals for Topographic Mapping Issued by: Teton County GIS and Teton County Engineering Teton County, Wyoming Proposals due: 2:00PM MDT July 1, 2015 Proposals may be delivered to: Teton
Estimating Firn Emissivity, from 1994 to1998, at the Ski Hi Automatic Weather Station on the West Antarctic Ice Sheet Using Passive Microwave Data
 Estimating Firn Emissivity, from 1994 to1998, at the Ski Hi Automatic Weather Station on the West Antarctic Ice Sheet Using Passive Microwave Data Mentor: Dr. Malcolm LeCompte Elizabeth City State University
APPLICATION OF TERRA/ASTER DATA ON AGRICULTURE LAND MAPPING. Genya SAITO*, Naoki ISHITSUKA*, Yoneharu MATANO**, and Masatane KATO***
 APPLICATION OF TERRA/ASTER DATA ON AGRICULTURE LAND MAPPING Genya SAITO*, Naoki ISHITSUKA*, Yoneharu MATANO**, and Masatane KATO*** *National Institute for Agro-Environmental Sciences 3-1-3 Kannondai Tsukuba
Temporal variation in snow cover over sea ice in Antarctica using AMSR-E data product
 Temporal variation in snow cover over sea ice in Antarctica using AMSR-E data product Michael J. Lewis Ph.D. Student, Department of Earth and Environmental Science University of Texas at San Antonio ABSTRACT
Visualizing of Berkeley Earth, NASA GISS, and Hadley CRU averaging techniques
 Visualizing of Berkeley Earth, NASA GISS, and Hadley CRU averaging techniques Robert Rohde Lead Scientist, Berkeley Earth Surface Temperature 1/15/2013 Abstract This document will provide a simple illustration
Create a folder on your network drive called DEM. This is where data for the first part of this lesson will be stored.
 In this lesson you will create a Digital Elevation Model (DEM). A DEM is a gridded array of elevations. In its raw form it is an ASCII, or text, file. First, you will interpolate elevations on a topographic
GEOGRAPHIC INFORMATION SYSTEMS CERTIFICATION
 GEOGRAPHIC INFORMATION SYSTEMS CERTIFICATION GIS Syllabus - Version 1.2 January 2007 Copyright AICA-CEPIS 2009 1 Version 1 January 2007 GIS Certification Programme 1. Target The GIS certification is aimed
Implementing Marine SDI Through Capacity Building
 Implementing Marine SDI Through Capacity Building A TopoBathy Database for Mozambique NIOHC Colombo, 20 th 23 rd March 2012 Fredericton Canada Heeswijk The Netherlands Washington DC United States Adelaide
Precipitation Remote Sensing
 Precipitation Remote Sensing Huade Guan Prepared for Remote Sensing class Earth & Environmental Science University of Texas at San Antonio November 14, 2005 Outline Background Remote sensing technique
Development of a Global Slope Dataset for Estimation of Landslide Occurrence Resulting from Earthquakes
 Development of a Global Slope Dataset for Estimation of Landslide Occurrence Resulting from Earthquakes Open-File Report 2007-1188 U.S. Department of the Interior U.S. Geological Survey Development of
noaa NOAA Technical Memorandum NESDIS NGDC-24 ETOPO1 1 ARC-MINUTE GLOBAL RELIEF MODEL: PROCEDURES, DATA SOURCES AND ANALYSIS C. Amante B.W.
 NOAA Technical Memorandum NESDIS NGDC-24 ETOPO1 1 ARC-MINUTE GLOBAL RELIEF MODEL: PROCEDURES, DATA SOURCES AND ANALYSIS C. Amante B.W. Eakins National Geophysical Data Center Marine Geology and Geophysics
New, Unique, and Dedicated dataset for the Global Atlas
 WFES 2014 EUDP Global Wind Atlas: New, Unique, and Dedicated dataset for the Global Atlas Presented by Jake Badger EUDP is a Danish fund for development and demonstration projects from the Danish Energy
The USGS Landsat Big Data Challenge
 The USGS Landsat Big Data Challenge Brian Sauer Engineering and Development USGS EROS bsauer@usgs.gov U.S. Department of the Interior U.S. Geological Survey USGS EROS and Landsat 2 Data Utility and Exploitation
Reprojecting MODIS Images
 Reprojecting MODIS Images Why Reprojection? Reasons why reprojection is desirable: 1. Removes Bowtie Artifacts 2. Allows geographic overlays (e.g. coastline, city locations) 3. Makes pretty pictures for
NASA Earth System Science: Structure and data centers
 SUPPLEMENT MATERIALS NASA Earth System Science: Structure and data centers NASA http://nasa.gov/ NASA Mission Directorates Aeronautics Research Exploration Systems Science http://nasascience.nasa.gov/
National Snow and Ice Data Center
 National Snow and Ice Data Center This data set (NSIDC-0484), part of the NASA Making Earth System Data Records for Use in Research Environments (MEaSUREs) Program, provides the first comprehensive, high-resolution,
Automated Spacecraft Scheduling The ASTER Example
 Automated Spacecraft Scheduling The ASTER Example Ron Cohen ronald.h.cohen@jpl.nasa.gov Ground System Architectures Workshop 2002 Jet Propulsion Laboratory The Concept Scheduling by software instead of
Terrain-Related Gravimetric Quantities Computed for the Next EGM
 Terrain-Related Gravimetric Quantities Computed for the Next EGM Nikolaos K. Pavlis 1, John K. Factor 2, and Simon A. Holmes 1 1 SGT, Inc., 7701 Greenbelt Road, Suite 400, Greenbelt, Maryland 20770, USA,
El Camino College. Geography 1 - Physical Geography Office & Phone: NATS 211; (310) 660-3593 x3369 Fall 2015 Office Hours: MW 10:45-11:15 am
 660-3593 x3369 Fall 2015 Office Hours: MW 10:45-11:15 am") El Camino College Geography 1 - Physical Geography Office & Phone: NATS 211; (310) 660-3593 x3369 Fall 2015 Office Hours: MW 10:45-11:15 am Instructor Matt Ebiner Tu 12:30-2:00 pm; TuTh 5-6 pm Email Address:
El Camino College Geography 1 - Physical Geography Office & Phone: NATS 211; (310) 660-3593 x3369 Fall 2015 Office Hours: MW 10:45-11:15 am Instructor Matt Ebiner Tu 12:30-2:00 pm; TuTh 5-6 pm Email Address:
Working with Digital Elevation Models and Digital Terrain Models in ArcMap 9
 Working with Digital Elevation Models and Digital Terrain Models in ArcMap 9 1 TABLE OF CONTENTS INTRODUCTION...3 WORKING WITH DIGITAL TERRAIN MODEL (DTM) DATA FROM NRVIS, CITY OF KITCHENER, AND CITY OF
The premier software for extracting information from geospatial imagery.
 Imagery Becomes Knowledge ENVI The premier software for extracting information from geospatial imagery. ENVI Imagery Becomes Knowledge Geospatial imagery is used more and more across industries because
CityGML goes to Broadway
 CityGML goes to Broadway Thomas H. Kolbe, Barbara Burger, Berit Cantzler Chair of Geoinformatics thomas.kolbe@tum.de September 11, 2015 Photogrammetric Week 2015, Stuttgart The New York City Open Data
Compilation of Digital Elevation Model for Turkey in 3-Arc-Second Resolution by Using SRTM Data Supported with Local Elevation Data
 Chapter 10 Compilation of Digital Elevation Model for Turkey in 3-Arc-Second Resolution by Using SRTM Data Supported with Local Elevation Data I. Oztug Bildirici 1, Aydin Ustun 1, Necla Ulugtekin 2, H.
A remote sensing instrument collects information about an object or phenomenon within the
 Satellite Remote Sensing GE 4150- Natural Hazards Some slides taken from Ann Maclean: Introduction to Digital Image Processing Remote Sensing the art, science, and technology of obtaining reliable information
DIGITAL ELEVATION MODEL DATABASE W42 - A SCALABLE SYSTEM FOR SPATIAL DATA
 DIGITAL ELEVATION MODEL DATABASE W42 - A SCALABLE SYSTEM FOR SPATIAL DATA M. Habermeyer, U. Marschalk, A. Roth German Aerospace Center (DLR),German Remote Sensing Data Center (DFD) 82234 Wessling, Germany,(martin.habermeyer,ursula.marschalk,achim.roth)@dlr.de
WORLD WIND JAVA for MODIS FIRE PRODUCTS VISUALIZATION (WWJF)
") WORLD WIND JAVA for MODIS FIRE PRODUCTS VISUALIZATION (WWJF) User Manual, v 1.0, April 2011 Luigi Boschetti, Alexandra Moulden and Michael Humber Department of Geography, University of Maryland, College
WORLD WIND JAVA for MODIS FIRE PRODUCTS VISUALIZATION (WWJF) User Manual, v 1.0, April 2011 Luigi Boschetti, Alexandra Moulden and Michael Humber Department of Geography, University of Maryland, College
GPS Precise Point Positioning as a Method to Evaluate Global TanDEM-X Digital Elevation Model
 GPS Precise Point Positioning as a Method to Evaluate Global TanDEM-X Digital Elevation Model 7 th FIG Regional Conference TS 1C Advances in GNSS Positioning and Applications I Volker Schwieger 1, Jürgen
Maintaining High Accuracy in Modern Geospatial Data
 Maintaining High Accuracy in Modern Geospatial Data Patrick Cunningham President info@bluemarblegeo.com www.bluemarblegeo.com +1 (207) 582 6747 Copyright 2010 Blue Marble Geographics Concepts Geodesy -
163 ANALYSIS OF THE URBAN HEAT ISLAND EFFECT COMPARISON OF GROUND-BASED AND REMOTELY SENSED TEMPERATURE OBSERVATIONS
 ANALYSIS OF THE URBAN HEAT ISLAND EFFECT COMPARISON OF GROUND-BASED AND REMOTELY SENSED TEMPERATURE OBSERVATIONS Rita Pongrácz *, Judit Bartholy, Enikő Lelovics, Zsuzsanna Dezső Eötvös Loránd University,
AGAP Antarctic Research Project Visualizing Data Learning About Antarctica From RADAR Data? Teacher Version (answers italicized)
") AGAP Antarctic Research Project Visualizing Data Learning About Antarctica From RADAR Data? Teacher Version (answers italicized) Image of Subglacial Lake network courtesy of NSF Ice Sheet: A large glacier
AGAP Antarctic Research Project Visualizing Data Learning About Antarctica From RADAR Data? Teacher Version (answers italicized) Image of Subglacial Lake network courtesy of NSF Ice Sheet: A large glacier
Gravitational potential
 Gravitational potential Let s assume: A particle of unit mass moving freely A body of mass M The particle is attracted by M and moves toward it by a small quantity dr. This displacement is the result of
Great Barrier Reef Bathymetry Survey
 Titel Published Nov. 18 th 2013 EOMAP GmbH & Co. KG 1 Content Executive summary Page 3 Project partner Page 4 The Great Barrier Reef High Resolution Satellite Bathymetry Project Page 5-10 Satellite-Derived
Evaluating Computer Graphics Animations of Aircraft Accidents and Incidents
 Evaluating Computer Graphics Animations of Aircraft Accidents and Incidents Neil A. H. Campbell MO3806 Neil graduated in 1983, with a Bachelor of Engineering degree (Electronics), from the University of
The Map Grid of Australia 1994 A Simplified Computational Manual
 The Map Grid of Australia 1994 A Simplified Computational Manual The Map Grid of Australia 1994 A Simplified Computational Manual 'What's the good of Mercator's North Poles and Equators, Tropics, Zones
Operating Instructions. 3DEM Software for Terrain Visualization and Flyby Animation. Version 20
 Operating Instructions 3DEM Software for Terrain Visualization and Flyby Animation Version 20 Table of Contents CONCEPT OF OPERATION... 1 EQUIPMENT AND SOFTWARE REQUIRED... 2 DIGITAL ELEVATION MODEL FILE
RED RELIEF IMAGE MAP 1 : NEW VISUALIZATION METHOD FOR THREE DIMENSIONAL DATA
 RED RELIEF IMAGE MAP 1 : NEW VISUALIZATION METHOD FOR THREE DIMENSIONAL DATA Tatsuro CHIBA, Shin-ichi KANETA, Yusuke SUZUKI Asia Air Survey Co., Ltd. 1-2-2 Manpukuji, Kawasaki, Japan (ta.chiba, sni.kaneta,
MSDI: Workflows, Software and Related Data Standards
 MSDI: Workflows, Software and Related Data Standards By Andy Hoggarth October 2009 Introduction Leveraging SDI principles for hydrographic operational efficiency French INFRAGEOS example (SHOM - Service
Ms Chairman and distinguished guests,
 Ms Chairman and distinguished guests, On behalf of the Ministry of the Environment, I am honored to open this conference that brings together scientists, policymakers and civil society from the Barents
Learning about GPS and GIS
 Learning about GPS and GIS Standards 4.4 Understand geographic information systems (G.I.S.). B12.1 Understand common surveying techniques used in agriculture (e.g., leveling, land measurement, building
Completing the World Glacier Inventory
 144 Annals of Glaciology 50(53) 2009 Completing the World Glacier Inventory Atsumu OHMURA Institute for Atmospheric and Climate Science, Swiss Federal Institute of Technology (ETH), CH-8092 Zürich, Switzerland
Slide 1. Slide 2. Slide 3
 Satellite Analysis of Sea Surface Temperatures in the Florida Keys to Monitor Coral Reef Health NASA Stennis Space Center Earthzine/DEVELOP Virtual Poster Session, Summer 2011 Video Transcript Slide 1
World Map Lesson 4 - The Global Grid System - Grade 6+
 World Map Lesson 4 - The Global Grid System - Grade 6+ Activity Goal To use the global grid system of latitude and longitude to find specific locations on a world map. Materials Needed: A pencil, a ruler,
GIS: Geographic Information Systems A short introduction
 GIS: Geographic Information Systems A short introduction Outline The Center for Digital Scholarship What is GIS? Data types GIS software and analysis Campus GIS resources Center for Digital Scholarship
Remote Sensing Satellite Information Sheets Geophysical Institute University of Alaska Fairbanks
 Remote Sensing Satellite Information Sheets Geophysical Institute University of Alaska Fairbanks ASTER Advanced Spaceborne Thermal Emission and Reflection Radiometer AVHRR Advanced Very High Resolution
An Introduction to Coordinate Systems in South Africa
 An Introduction to Coordinate Systems in South Africa Centuries ago people believed that the earth was flat and notwithstanding that if this had been true it would have produced serious problems for mariners
GEOENGINE MSc in Geomatics Engineering (Master Thesis) Anamelechi, Falasy Ebere
 Anamelechi, Falasy Ebere") Master s Thesis: ANAMELECHI, FALASY EBERE Analysis of a Raster DEM Creation for a Farm Management Information System based on GNSS and Total Station Coordinates Duration of the Thesis: 6 Months Completion
Master s Thesis: ANAMELECHI, FALASY EBERE Analysis of a Raster DEM Creation for a Farm Management Information System based on GNSS and Total Station Coordinates Duration of the Thesis: 6 Months Completion
Lezione 19 Introduzione a Radio Mobile Freeware
 Corso di A.A. 2007-2008 Lezione 19 Introduzione a Radio Mobile Freeware Ing. Marco GALEAZZI 1 Che cos è? (1) Radio Mobile is freeware by Roger Coudé (VE2DBE). This freeware package is a terrain elevationmapping
Multisensor Data Integration in O&G Business Lutz Petrat Hélène Lemonnier Michael Hall
 Multisensor Data in O&G Business Lutz Petrat Hélène Lemonnier Michael Hall ESA Oil and Gas Workshop 15/09/2010, Frascati, Italy Satellite Products and Services during a typical O&G project Project Life
TopoBathy Database Mozambique
 TopoBathy Database Mozambique Andrew Hoggarth, (Canada), Gordon Johnston (UK) Charles de Jongh and peter Schwarzberg (Netherlands) Montevideo Uruguay, 28 th November 2012 Fredericton Canada Heeswijk The
SMEX04 Land Use Classification Data
 Notice to Data Users: The documentation for this data set was provided solely by the Principal Investigator(s) and was not further developed, thoroughly reviewed, or edited by NSIDC. Thus, support for
Adaptation of High Resolution Ikonos Images to Googleearth for Zonguldak Test Field
 Adaptation of High Resolution Ikonos Images to Googleearth for Zonguldak Test Field Umut G. SEFERCIK, Murat ORUC and Mehmet ALKAN, Turkey Key words: Image Processing, Information Content, Image Understanding,
Data source, type, and file naming convention
 Exercise 1: Basic visualization of LiDAR Digital Elevation Models using ArcGIS Introduction This exercise covers activities associated with basic visualization of LiDAR Digital Elevation Models using ArcGIS.
AMSRIce03 Sea Ice Thickness Data
 Notice to Data Users: The documentation for this data set was provided solely by the Principal Investigator(s) and was not further developed, thoroughly reviewed, or edited by NSIDC. Thus, support for
Plate Tectonics Visual Glossary and Atlas How to use this app in your classroom
 Plate Tectonics Visual Glossary and Atlas How to use this app in your classroom In addition to providing a comprehensive list of terms, definitions, illustrations, and animations related to plate tectonics,
Impacts of Global Warming on Hurricane-related Flooding in Corpus Christi,Texas
 Impacts of Global Warming on Hurricane-related Flooding in Corpus Christi,Texas Sea-level Rise and Flood Elevation A one-foot rise in flood elevation due to both sea-level rise and hurricane intensification
Remote Sensing an Introduction
 Remote Sensing an Introduction Seminar: Space is the Place Referenten: Anica Huck & Michael Schlund Remote Sensing means the observation of, or gathering information about, a target by a device separated
UW Madison Massive Open Online Courses (MOOCs): Preliminary Participant Demographics
: Preliminary Participant Demographics") UW Madison Massive Open Online Courses (MOOCs): Preliminary Participant Demographics Clare Huhn, UW Madison MOOC Data Coordinator Starting in Fall 2013, UW Madison will offer four MOOCs using the Coursera
UW Madison Massive Open Online Courses (MOOCs): Preliminary Participant Demographics Clare Huhn, UW Madison MOOC Data Coordinator Starting in Fall 2013, UW Madison will offer four MOOCs using the Coursera
Using Google Earth to Explore Plate Tectonics
 Using Google Earth to Explore Plate Tectonics Laurel Goodell, Department of Geosciences, Princeton University, Princeton, NJ 08544 laurel@princeton.edu Inspired by, and borrows from, the GIS-based Exploring
SECOND GRADE 1 WEEK LESSON PLANS AND ACTIVITIES
 SECOND GRADE 1 WEEK LESSON PLANS AND ACTIVITIES UNIVERSE CYCLE OVERVIEW OF SECOND GRADE UNIVERSE WEEK 1. PRE: Discovering stars. LAB: Analyzing the geometric pattern of constellations. POST: Exploring
Radar Interferometric and Polarimetric Possibilities for Determining Sea Ice Thickness
 Radar Interferometric and Polarimetric Possibilities for Determining Sea Ice Thickness by Scott Hensley, Ben Holt, Sermsak Jaruwatanadilok, Jeff Steward, Shadi Oveisgharan Delwyn Moller, Jim Reis, Andy
WHAT YOU NEED TO USE THE STATE PLANE COORDINATE SYSTEMS
 WHAT YOU NEED TO USE THE STATE PLANE COORDINATE SYSTEMS N & E State Plane Coordinates for Control Points AZIMUTHS - True, Geodetic, or Grid - Conversion from Astronomic to Geodetic (LaPlace Correction)
Using Remotely Sensed Data From ASTER to Look Impact of Recent Earth Quakes in Gujarat, India.
 Using Remotely Sensed Data From ASTER to Look Impact of Recent Earth Quakes in Gujarat, India. A major earth quake occurred in Gujarat, India on January 26,2000. (Origin time 03:16 GMT, Location 23.399N
GNSS and Heighting, Practical Considerations. A Parker National Geo-spatial Information Department of Rural Development and Land Reform
 GNSS and Heighting, Practical Considerations A Parker National Geo-spatial Information Department of Rural Development and Land Reform GNSS Global Navigation Satellite Systems (GNSS) Global Positioning
Cloud detection and clearing for the MOPITT instrument
 Cloud detection and clearing for the MOPITT instrument Juying Warner, John Gille, David P. Edwards and Paul Bailey National Center for Atmospheric Research, Boulder, Colorado ABSTRACT The Measurement Of
Projections of sea level rise
 Projections of sea level rise Jonathan Gregory Lead author, Chapter 13, Sea level change Yann Arthus-Bertrand / Altitude Causes of global mean sea level rise (GMSLR) Global mean sea level rise is caused
Satellite'&'NASA'Data'Intro'
 Satellite'&'NASA'Data'Intro' Research'vs.'Opera8ons' NASA':'Research'satellites' ' ' NOAA/DoD:'Opera8onal'Satellites' NOAA'Polar'Program:'NOAA>16,17,18,19,NPP' Geosta8onary:'GOES>east,'GOES>West' DMSP'series:'SSM/I,'SSMIS'
STRIKING VARIETY OF THE MOUNTAIN CHAINS APPEARANCE ON SATELLITE IMAGES PROVIDED BY GOOGLE EARTH
 STRIKING VARIETY OF THE MOUNTAIN CHAINS APPEARANCE ON SATELLITE IMAGES PROVIDED BY GOOGLE EARTH Jacek Drachal Instytut Geodezji i Kartografii, ul. Modzelewskiego 27, 02-679 Warszawa, Poland, jacek@igik.edu.pl
LIDAR and Digital Elevation Data
 LIDAR and Digital Elevation Data Light Detection and Ranging (LIDAR) is being used by the North Carolina Floodplain Mapping Program to generate digital elevation data. These highly accurate topographic
TerraSAR-X Applications Guide
 TerraSAR-X Applications Guide Extract: Maritime Monitoring: Oil Spill Detection April 2015 Airbus Defence and Space Geo-Intelligence Programme Line Maritime Monitoring: Oil Spill Detection Issue As the
SRTM and GDEM Models
 Landscape & Environment 7 (2) 2013. 42-47. ASSESSING DATA QUALITY OF REMOTELY-SENSED DEMs IN A HUNGARIAN SAMPLE AREA GERGELY SZABÓ 1 NIKOLETTA MECSER 2 ANITA KARIKA 3 1,2,3 University of Debrecen, Department
Introduction to GIS (Basics, Data, Analysis) & Case Studies. 13 th May 2004. Content. What is GIS?
 & Case Studies. 13 th May 2004. Content. What is GIS?") Introduction to GIS (Basics, Data, Analysis) & Case Studies 13 th May 2004 Content Introduction to GIS Data concepts Data input Analysis Applications selected examples What is GIS? Geographic Information
Introduction to GIS (Basics, Data, Analysis) & Case Studies 13 th May 2004 Content Introduction to GIS Data concepts Data input Analysis Applications selected examples What is GIS? Geographic Information
What Causes Climate? Use Target Reading Skills
 Climate and Climate Change Name Date Class Climate and Climate Change Guided Reading and Study What Causes Climate? This section describes factors that determine climate, or the average weather conditions
Appendix E FAA ALP Sheet Checklist
 Appendix E FAA ALP Sheet Checklist AC 150/5070-6B (incl. Chg. 1, 5/1/07) Airport Layout Plan Drawing Set The following list provides general guidelines in preparing the Airport Layout Plan set. The individual
Tectonic plates push together at convergent boundaries.
 KEY CONCEPT Plates converge or scrape past each other. BEFORE, you learned Plates move apart at divergent boundaries In the oceans, divergent boundaries mark where the sea floor spreads apart On land,
The European Space Agency s Synthetic Aperture Radar Programme From Experiment to Service Provision
 The European Space Agency s Synthetic Aperture Radar Programme From Experiment to Service Provision Evert Attema ESA, Directorate of Earth Observation Programme! The idea of an independent European space
An Analysis of a Methodology for Generating Watershed Parameters using GIS
 CRWR Online Report 00-3 An Analysis of a Methodology for Generating Watershed Parameters using GIS by David Mason, MSE Graduate Research Assistant and David R. Maidment, PhD. Principal Investigator May
Change Detection In Satellite Observed Nightime Lights: 1992-2003
 Change Detection In Satellite Observed Nightime Lights: 1992-2003 Chris Elvidge, Earth Observation Group NOAA National Geophysical Data Center (NGDC). Boulder, Colorado chris.elvidge@noaa.gov Kim Baugh,
Global Cryosphere Watch (GCW): A WMO Initiative
: A WMO Initiative") Global Cryosphere Watch (GCW): A WMO Initiative IICWG 10 th Meeting, Geneva, Switzerland October 12-16, 2009 Barry Goodison, Chair, GCW Expert Team presented by Vladimir Ryabinin (WCRP) Global Cryosphere
Global Cryosphere Watch (GCW): A WMO Initiative IICWG 10 th Meeting, Geneva, Switzerland October 12-16, 2009 Barry Goodison, Chair, GCW Expert Team presented by Vladimir Ryabinin (WCRP) Global Cryosphere
Understanding image scale and resolution
 Understanding image scale and resolution Ned Horning Version: 1.0 Creation Date: 2004-01-01 Revision Date: 2004-01-01 License: This document is licensed under a Creative Commons Attribution-Share Alike
The RapidEye optical satellite family for high resolution imagery
 'Photogrammetric Week 01' D. Fritsch & R. Spiller, Eds. Wichmann Verlag, Heidelberg 2001. Scherer, Krischke 139 The RapidEye optical satellite family for high resolution imagery STEFAN SCHERER and MANFRED
5. GIS, Cartography and Visualization of Glacier Terrain
 5. GIS, Cartography and Visualization of Glacier Terrain 5.1. Garhwal Himalayan Glaciers 5.1.1. Introduction GIS is the computer system for capturing, storing, analyzing and visualization of spatial and
Publishing Hosted 3D Feature Layers. An Esri White Paper September 2015
 An Esri White Paper September 2015 Copyright 2015 Esri All rights reserved. Printed in the United States of America. The information contained in this document is the exclusive property of Esri. This work
Studying Topography, Orographic Rainfall, and Ecosystems (STORE)
") Studying Topography, Orographic Rainfall, and Ecosystems (STORE) Introduction Basic Lesson 2: Using ArcGIS Explorer to Analyze the Connection between Topography and Rainfall This lesson introduces Geographical
Studying Topography, Orographic Rainfall, and Ecosystems (STORE) Introduction Basic Lesson 2: Using ArcGIS Explorer to Analyze the Connection between Topography and Rainfall This lesson introduces Geographical