Edgefield Regional Stormwater Treatment (RST) Facility Tri-County Agricultural Area St. Johns River Water Management District
|
|
|
- Augustine Montgomery
- 8 years ago
- Views:
Transcription
1 Edgefield Regional Stormwater Treatment (RST) Facility Tri-County Agricultural Area St. Johns River Water Management District Water Quality Draft Summary, December 2009 Alicia Steinmetz and Pam Livingston-Way, Lower St. Johns River Basin Program Introduction This is the fourth update on water quality for the Edgefield RST facility, which includes monthly data on concentrations of key water quality constituents from September 2007 August 2009 and data on water quality associated with storm events that occurred from June 2008-September In addition to these data collected by the Division of Environmental Sciences, this report provides operational updates. Detailed data analysis and discussion are not provided in this interim report, but they will be presented in an annual report. Annual reports will include analyses of cumulative, seasonal, and interannual treatment performance, along with estimates of load reductions from the watershed. Interim reports should be viewed as provisional progress reports and should not be considered definitive. Background Since 1998, agricultural best management practices (BMPs) designed to reduce nutrient rich runoff have been implemented in the tri-county agricultural area (TCAA), primarily through growers voluntarily participating in the St. Johns River Water Management District s TCAA Water Quality Protection Cost Share Program. Based on row crop acreage from 2000 land use data implementation of verified in-field BMPs (e.g., reduced fertilizer rates, fertilizer application timing, fertilizer placement, water table management, etc.) has been estimated to yield a 24% reduction in annual loadings of nitrogen and a 14% reduction in annual loadings of phosphorus (Pam Livingston-Way, SJRWMD Division of Environmental Sciences, pers. comm. 2008). Unfortunately, these nutrient reductions are not sufficient to reduce loads to the Total Maximum Daily Loads (TMDLs) mandated for the freshwater section of the river by the Clean Water Act after these waters were added to the 303 D list of impaired waters by the Florida Department of Environmental Protection. In order to meet TMDL allocations for the freshwater DRAFT-Edgefield RST Water Quality Summary, December
2 segment of the LSJR, the TCAA is obligated to implement BMPS on 100% of the total row crop acreage and achieve a 37% reduction in nitrogen and a 15% reduction in phosphorus (LSJR TMDL Executive Committee 2008). Model predictions suggest that nutrient reductions through full implementation of current in-field BMPs will not be sufficient to meet nitrogen and phosphorus reductions for the freshwater section of the river. Thus, the District constructed regional storm water treatment facilities to assist in meeting the TMDL allocations by improving the quality of water exiting the TCAA watershed. Project Objective The District purchased the Edgefield Tract in 2001 for the construction of a regional storm water treatment facility to treat nutrient-rich agricultural runoff in the high-priority Dog Branch subbasin. Dog Branch subbasin is 2,028 acres consisting of 65% agricultural land use. Prior to the District s purchase, the Edgefield Tract had been in agricultural production since the 1940s. Project goals are to reduce watershed loading of total nitrogen by 50%, total phosphorus by 60%, and total suspended solids by 70% from a combination of both ambient (e.g., baseflow, irrigation runoff) and storm events. Project Treatment Components The Edgefield RST was the second facility constructed in the TCAA (Figure 1). The RST is a BMP treatment train consisting of a 25-acre wet detention pond at the forefront, followed by a 56-acre constructed treatment wetland. The constructed wetland is a combination subsurface and surface flooded wetland. During the wetland construction phase in July 2007, soils were amended with a combination of a ferric water treatment residual and standard dolomite to bind legacy soil phosphorus resulting from 60 plus years of farming. Former agricultural sites have the potential to release stored phosphorus upon flooding (Pant and Reddy, 2003). Soil phosphorus tests conducted by the District determined there were elevated levels of phosphorus stored in the mineral soils. Additional work at the wetland site included the installation of approximately 176,607 wetland plants of varying species to promote habitat diversity and enhance treatment performance. Root zone oxygenation varies among wetland plant species, which influences chemical processes in wetland soils (Reddy et al., 2008). It is through these soil chemical processes that nutrient treatment occurs. DRAFT-Edgefield RST Water Quality Summary, December
3 Operation and System Hydraulics Beginning in April 2006, the wet detention pond was intermittently the sole functioning treatment component. Full operation commenced in October 2007, at which time, both components of the treatment train were online (i.e., wet detention pond and constructed wetland). The RST operates by capturing a portion of agricultural runoff from Dog Branch. Runoff flows into a small forebay basin (i.e., approximately 0.25 acre) where it is then pumped into the 25-acre wet detention pond for initial treatment. The percentage of runoff treated by the RST is unknown at this time, but will be determined as the Division of Hydrologic Data Services will monitor Dog Branch flow and develop flow rating curves. However, the pump station was designed for up to 80% flow capture with pumps to accommodate peak flow rates of 30 cubic feet per second (cfs) and 15 cfs under general baseflow conditions. The RST system is dynamic and essentially event-driven by watershed hydraulic patterns related to seasonal climatic conditions as well as agricultural activities. Hydraulic loading entering the facility is dependent upon water level rise in Dog Branch, as a result of irrigation activities during the agricultural growing season (January May) and/or storm events and pump system capabilities. Tidal fluctuations can also affect Dog Branch water levels. Runoff volumes pumped into the RST from February September 2009 are presented in Table 1. Once runoff is pumped into the wet detention pond from the forebay basin and pond water level rises, water is discharged to the constructed wetland header ditch via a concrete weir outfall. Water stages up in the header ditch and flows into the wetland to create subsurface and/or surface flow, where it is eventually treated and discharged to the LSJR via Cat Branch. Hydrologic Monitoring Flow and Water Levels. The Environmental Sciences Division s (ES) Lower St. Johns River Basin Program (LSJR) staff continue to conduct weekly maintenance and equipment calibration at monitoring and telemetry stations, as well as daily remote monitoring of the pump system status and storm sampling programs. Since implementing a weekly maintenance schedule in January 2008, water level data collection at Dog Branch (inflow), pond outflow and wetland outflow has remained uninterrupted. DRAFT-Edgefield RST Water Quality Summary, December
4 Water level data at the three stations have been recorded since February 2008; however, flow data are not yet available. Engineering staff are developing a weir equation for the pond and wetland outfall structures, and ES staff are working with the Division of Hydrologic Data Services (HDS) to develop flow rates for the Dog Branch station. HDS installed monitoring equipment and began collecting data in October Watershed pollutant load reductions and load reductions achieved by each treatment component of the RST cannot be determined until this work is complete. Water levels adjusted to water elevations (NGVD29) measured at the RST inflow (Dog Branch) from February 2008-September 2009 have ranged from ft, and they include measurements affected by irrigation runoff during the agricultural growing season, and lack of agricultural activity during the fallow season and storm events. Water elevations greater than 1.75 ft. are typically associated with storm events. The highest recorded level of 5.59 ft occurred during Tropical Storm Fay in August Monthly average water levels ranged from ft. Ambient and Storm Event Water Quality Data Pollutant loading cannot be calculated at this time due to the absence of flow data, and thus, only pollutant concentrations for ambient (e.g., baseflow, irrigation runoff) and storm events are presented in this report. However, it should be noted that comparison of inflow and outflow concentrations alone does not evaluate treatment performance accurately since some treatment systems can effectively capture and reduce the volume of water discharged, thus reducing the pollutant load (U.S. EPA 2008). Treatment performance based on reductions in pollutant loading will be estimated when flow and volume data become available. Ambient Water Quality Sampling. LSJR field staff continue to collect monthly grab samples on the same day at all locations to characterize water quality at the following: Dog Branch (inflow), inflow of the pond, outflow of the pond, inflow of the wetland header ditch, and outflow of the treatment system (wetland). Monthly data represent ambient conditions and are not associated with storm events. For purposes of this report, data are presented only for those stations that indicate overall system performance (i.e., Dog Branch (inflow), pond outflow, and wetland outflow) shown in Photo 1. DRAFT-Edgefield RST Water Quality Summary, December
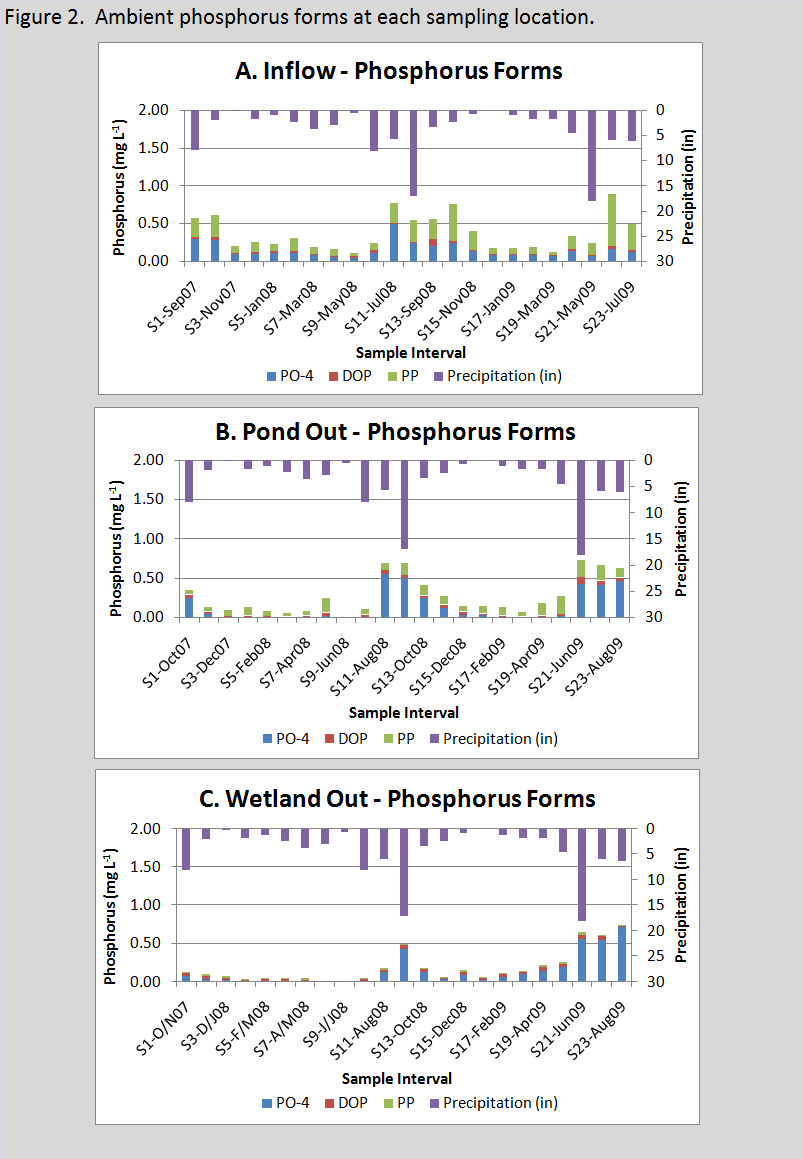
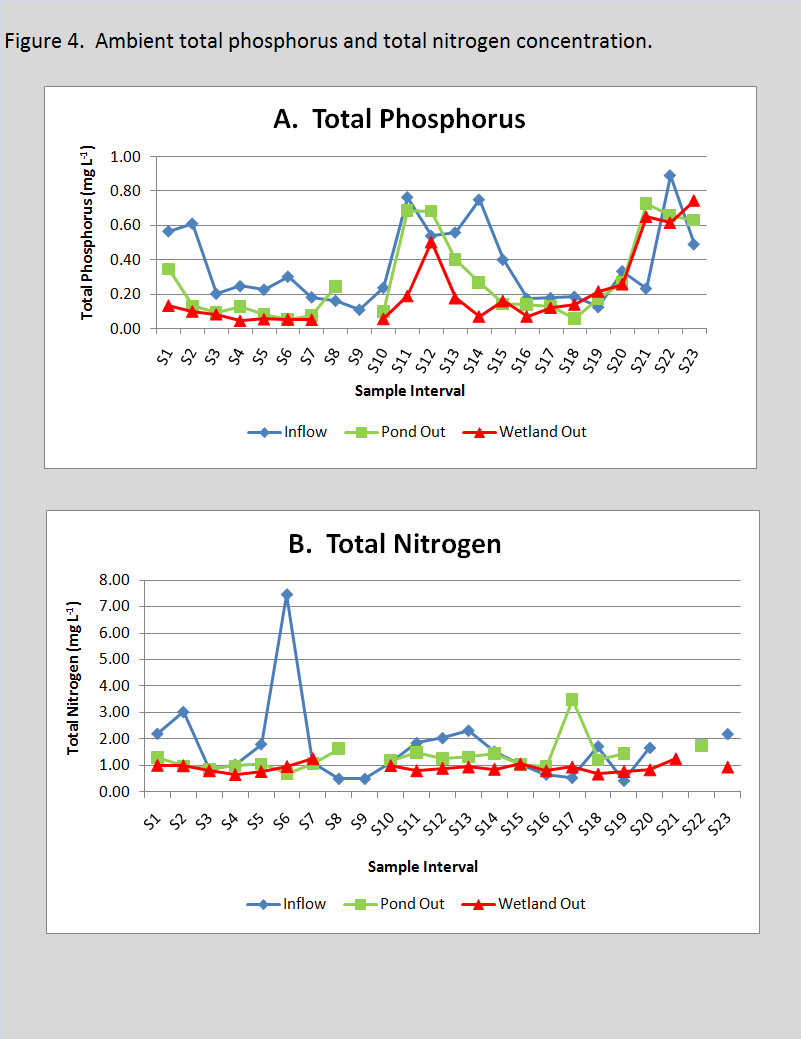
5 Ambient Data Interpretation. Lacking flow data, residence time for the pond cannot currently be estimated. Therefore, for the purpose of this water quality status report, the average residence time of the wet detention pond is assumed to be similar to that of the Deep Creek West (DCW) wet detention pond (e.g., 41 days, ranging from 9-72 days) (Yang and Richmond, 2009) because they are similar in design. Actual residence time may be greater given that the Edgefield pond is 25 acres and the DCW pond is 15 acres. Based on the assumed pond residence time and lag period between the RST inflow (Dog Branch) and the outflow of the pond, monthly water quality grab samples collected at the pond outflow station during a given month cannot be compared to the runoff in Dog Branch collected on the same day. Consequently, data have been plotted such that those collected at the inflow one month are compared to those collected at the pond outflow site in the following month. Similar methodology was used for the wetland outflow, except data were averaged over a two-month period to create sampling intervals. For example, sampling interval 5 (S5) represents Jan-08 inflow, Feb- 08 pond outflow, and the average of Feb/Mar-08 wetland outflow data (refer to Table 2 for a summary of sampling intervals). Wetland data are averaged over a two-month period based on the current assumption that wetland residence time is less than a month. Nominal residence time will be estimated when flow data become available. Beginning July 2008 wetland data were no longer averaged over a two-month period. Rather, additional sampling was conducted at the wetland outflow two weeks after collection at the pond outflow. Presented in Figures 2-5 in this fourth progress report are actual monthly ambient water quality concentration data (data are not interpolated) available to date spanning September 2007-August 2009 (sampling intervals S1-S23). Figures 6a-c to figures 8a-c present annual, growing season and fallow season percent reductions in average ambient concentrations for for each of the treatment components and the overall system (i.e., inflow vs. pond outflow, pond outflow vs. wetland outflow, and inflow vs. wetland outflow). Figures 9a-c and figure 10 present annual, seasonal, and monthly rainfall for Typically, the TCAA growing season is January May and the fallow season is June December. General water quality treatment trends can be discerned from the current analyte concentration data set; however, the true measure of treatment performance will be determined by mass load reductions. Presented in Table 3 are average ambient concentrations for the period of record DRAFT-Edgefield RST Water Quality Summary, December
6 and percent reduction in average ambient concentration for the facility (i.e., inflow vs. wetland outflow concentration). Photo 1. Baseflow and automated storm sampler water quality monitoring stations. Inflow Pond Outflow Wetland Header Ditch Wetland Outflow Photo courtesy of John Richmond Storm Water Quality Sampling. Automated, refrigerated storm sampling units (ISCO Avalanche) are located at the inflow, pond outflow, and wetland outflow (Photo 1). Automated samplers are triggered by stage increases indicative of storm events, or they can be triggered manually to capture lag times at the pond and wetland outflow. In 2008, samplers were programmed to continue sampling for fourteen days once triggered. Fourteen sampling days were targeted to ensure complete capture of the storm hydrograph. Samples were collected at 6 hour intervals as a daily composite sample of four aliquots. After many attempts, it became apparent that the equipment/power supply were not sufficient to collect and refrigerate samples for fourteen days. Thus, the sampling program was revised in November 2008 the sampling program was revised to sample for seven days rather than fourteen once triggered. DRAFT-Edgefield RST Water Quality Summary, December
7 The new program collects sample aliquots every 8 minutes for the first 2 hours to capture rise of the storm hydrograph and first-flush of nutrients, succeeded by sampling in equal time intervals for the remainder of the first day of the storm (for example if 4 hrs remain in the day then samples will be collected every 0.5 hr), and then every 3 hours per day as a daily composite sample of eight aliquots for the next six days. Consequently, more samples are collected per day with the modified sampling program (8 aliquot samples vs. 4 aliquot samples) to represent the respective daily average concentrations over a seven day period. Analyses of water level rises in Dog Branch during several storm events verified that storm hydrographs typically occurred over seven days. Analyte concentrations representing the first day of the storm (i.e., composite samples collected the first two hours and a composite sample collected the remainder of the day) were time-weighted and then averaged for purposes of this report lacking accurate flow data. District laboratory Quality Assurance and Quality Control was maintained as much as logistically possible considering sampling methodology. Samples were refrigerated within the autosampler unit when the first sample was collected. Sample temperatures were maintained according to the SJRWMD Field Standard Operating Procedures for Surface Water Sampling 2010 (FSOP SWS 2010) until samples were retrieved and transported to the District lab for analysis. Cooling of samples assists in reducing microbial activity and species transformation; however, specific analytes were required to be coded for Q=holding time exceeded, Y=samples not acid preserved within 15 minutes of collection, and J=sample not filtered within 15 minutes of collection (pers. comm. Steve Richter, SRJWMD Division of Laboratory Services). Sample containers were not pre-preserved upon deployment since some forms of nutrients (i.e., dissolved orthophosphate and dissolved nitrate+nitrite) and total suspended solids do not require acidification. Typically, samples were preserved between day 8 day 14 at the time they were filtered and submitted to the lab for analysis. Storm Data Interpretation. Composite samples have been collected during various storm events from June 2008 September 2009 to yield concentrations of total phosphorus, total nitrogen and total suspended solids at the inflow, pond outflow and wetland outflow. Storm event data collected in 2008 are presented in Figures These data were collected using the original fourteen-day program, and due to power supply problems, capture of storm events at all three monitoring stations was DRAFT-Edgefield RST Water Quality Summary, December
8 intermittent. Moreover, data collected from June 2008 to September 2008, and an additional several days in November, should be interpreted with caution due to insufficient cooling of samples caused by power interruptions. Data available thus far for 2009 are plotted in Figures 14a-c to 16a-c; monthly average nitrogen, phosphorus, and total suspended solids concentrations are summarized in Table 4. Automated samplers were not triggered at the pond and wetland in Mar-09, and in Apr-09 the sampler at the pond outflow was removed for electrical repairs. It should be noted that the data presented are based exclusively on concentrations, which do not account for potential differences in volumes discharged at the sampling stations. Nonetheless, the data provide a positive indication the facility is reducing pollutant concentrations effectively following storm events. When volume data become available, progress reports will include event mean concentrations for each event. Overall load reductions in pollutants following storms will be presented in annual reports. Summary Monthly ambient concentration data for the sampling period September 2007-August 2009 (sampling intervals S1-S23) for the overall RST (inflow vs. wetland outflow) indicated a 42% reduction in TP concentration; a 46% reduction in TN concentration; and a 69% reduction in TSS concentration (Table 3). Average ambient TN concentrations were 1.70 mg L -1 in the inflow; 1.33 mg L -1 at the pond outflow; and 0.92 mg L -1 at the wetland outflow. TP concentrations were 0.37 mg L -1 in the inflow; 0.28 mg L -1 at the pond outflow; and 0.21 mg L -1 at the wetland outflow. TSS concentrations were 8.78 mg L -1 in the inflow; mg L -1 at the pond outflow; and 2.72 mg L -1 at the wetland outflow (Table 3). In general, annual percent reductions in total nitrogen and nitrate+nitrite in 2008 were achieved by each of the treatment components and the overall RST system. Percent reductions were calculated based on the treatment components of interest and the overall RST. For example, the percent reduction achieved by the pond was calculated by subtracting the average pond outflow concentration for the data period from the average inflow concentration for the data period, then dividing by the average inflow concentration for the data period and multiplying by 100 (i.e., concentration in concentration out/concentration in * 100). Likewise, percent reductions for the wetland were calculated using the average pond outflow concentration and the average wetland outflow concentration, and the overall DRAFT-Edgefield RST Water Quality Summary, December
9 facility percent reduction was calculated using the average inflow concentration (i.e., Dog Branch) and the average wetland outflow concentration. Annual and fallow season data for 2009 are not yet available and data for 2007 were only collected from September to December. The greatest percent reductions in 2008 occurred between the inflow and wetland outflow with a reduction of 49% in total nitrogen and 99% in nitrate+nitrite. Thus, the wetland provided additional treatment of the pond-treated effluent (Figures 6a-f). Growing season (January through May) and fallow season (June through December) reductions in all three years followed the same trend, except there was no reduction in total nitrogen or nitrate+nitrite pond outflow concentrations compared to the inflow for the 2009 growing season (Figures 6a-f). Total phosphorus and orthophosphate followed the same trend as nitrogen with the greatest percent reduction in 2008 occurring between the inflow and the wetland outflow with a 62% reduction in total phosphorus and a 44% reduction in orthophosphate. Growing season reductions occurred in 2008 but not 2009 for both phosphorus and orthophosphate. However, fallow season reductions for both constituents did occur in 2007 and Data are not yet available for the 2009 fallow season to determine if an overall annual reduction in total phosphorus occurred (Figures 7a-f). Total suspended solids concentrations were reduced in the system (inflow vs. wetland outflow) in 2008, and in the growing seasons 2008 and 2009, and fallow seasons 2007 and However, reductions did not occur within the pond compared to the inflow on annual basis in 2008, nor in the growing and fallow seasons in 2008, and growing season 2009 (Figures 8a-c). Annual rainfall was slightly below average (48-52 ) for the area all three years, but growing season rainfall in 2009 was almost 3x the growing season rainfall in 2007 and 2008 (Figures 9a-c). A significant rainfall event of 13.8 occurred in May 2009 (Figure 10). In contrast, fallow season rainfall was 3x greater in 2007 and 2008 than in Likewise, significant rainfall events occurred in September 2007 and August 2008 of 13.3 and 14, respectively (Figure 10). Thus, seasonal differences in percent reductions for nitrogen, phosphorus and total suspended solids among the three years could be in part due to differences in rainfall and its effect on water quality pollutants. Overall, water quality concentrations associated with storm events (Figures 11-16) were less at the wetland outflow than the DRAFT-Edgefield RST Water Quality Summary, December
10 inflow. Average storm event concentrations in 2008 and 2009 for the RST (inflow vs. wetland outflow) indicated a 77% reduction in TN; 91% reduction in TP; and a 97% reduction in TSS (Table 4). Average storm TN concentrations were 4.79 mg L -1 in the inflow; 2.41 mg L -1 at the pond outflow; and 1.11 mg L -1 at the wetland outflow. TP concentrations were 2.94 mg L -1 in the inflow; 0.56 mg L -1 at the pond outflow; and 0.26 mg L -1 at the wetland outflow. TSS concentrations were mg L -1 in the inflow; mg L -1 at the pond outflow; and 3.48 mg L -1 at the wetland outflow (Table 4). While these current treatment performance estimates derived from ambient and storm data represent only reductions in concentrations, these data are indeed encouraging and lead us to believe that the facility is effectively reducing pollutants. As flow and volume data become available, these data in conjunction with pollutant concentrations will be used to determine a more accurate assessment of treatment performance and watershed pollutant load reductions. DRAFT-Edgefield RST Water Quality Summary, December
11 Literature Cited Livingston-Way, P. (2001). Water quality monitoring and assessment of agricultural best management practices in the Tri-County Agricultural Area. Palatka: St. Johns River Water Management District, Division of Environmental Sciences. [LSJR TMDL Executive Committee]. Lower St. Johns River Total Maximum Daily Load Executive Committee. (2008, October). Basin management action plan for the implementation of total maximum daily loads for nutrients adopted by the Florida Department of Environmental Protection for the Lower St. Johns River Basin. Pant, H.K. and K.R. Reddy (2003). Potential internal loading of phosphorus in a wetland constructed in agricultural land. Water Research 37, Reddy K.R., M. Clark, P. Inglett, J. Jawitz, and T. Osborne (2008, June 23-26). Biogeochemistry of Wetlands. Science and Applications. University of Florida Wetland Biogeochemistry Lab, Soil and Water Science Department. Gainesville, FL, U.S. [U.S. EPA] U.S. Environmental Protection Agency. (2008, February 04). Three Keys to BMP Performance - Concentration, Volume and Total Load. Retrieved August 18, 2008, from U.S. Environmental Protection Agency, National Pollutant Discharge Elimination System: Yang, C. and J. Richmond (2009). Deep Creek West Regional Stormwater Treatment Facility, Treatment Performance and Treatment Efficiency for Phosphorus. Palatka: St. Johns River Water Management District, Division of Engineering. DRAFT-Edgefield RST Water Quality Summary, December
12 Figure 1. Location of TCAA Regional Stormwater Treatment (RST) facilities. Edgefield RST DRAFT-Edgefield RST Water Quality Summary, December
13 13

14 14
15 15

16 16
17 17
18 18
19 19
20 20
21 21
22 22
23 23
24 24
25 25
26 26

27 27
28 28

29 29
30 Table 1. Estimated total volume pumped into the treatment facility from Dog Branch. Year 2008 Volume Pumped (cf) Year 2009 Volume Pumped (cf) Feb ,200 Jan-09 3,739,482 Mar-08 2,478,429 Feb-09 3,210,543 Apr-08 4,950,738 Mar-09 8,785,044 May-08 2,167,997 Apr-09 4,222,518 Jun ,544 May-09 13,528,614 Jul-08 6,935,762 Jun-09 5,968,449 Aug-08 7,774,236 Jul-09 2,692,434 Sep-08 26,309,250 Aug-09 8,460,157 Oct-08 18,935,460 Sep-09 29,766,060 Nov-08 9,353,250 Dec-08 2,199,915 DRAFT-Edgefield RST Water Quality Summary, December
31 Table 2. Sampling interval months for each ambient monitoring station. Sampling Interval Inflow Pond Outflow Wetland Outflow S1 Sep-07 Oct-07 Oct/Nov-07 S2 Oct-07 Nov-07 Nov/Dec-07 S3 Nov-07 Dec-07 Dec-07/Jan-08 S4 Dec-07 Jan-08 Jan/Feb-08 S5 Jan-08 Feb-08 Feb/Mar-08 S6 Feb-08 Mar-08 Mar/Apr-08 S7 Mar-08 Apr-08 Apr/May-08 S8 Apr-08 May-08 May/Jun-08 (no data collected in Jun08; no flow exiting wetland S9 May-08 Jun-08 (no data collected; no flow exiting pond) Jun/Jul-08 (no data collected in Jun08; no flow exiting wetland S10 Jun-08 Jul-08 *Jul-08 S11 Jul-08 Aug-08 *Aug-08 S12 Aug-08 Sep-08 *Sep-08 S13 Sep-08 Oct-08 *Oct-08 S14 Oct-08 Nov-08 *Nov-08 S15 Nov-08 Dec-08 *Dec-08 S16 Dec-08 Jan-09 *Jan-09 S17 Jan-09 Feb-09 *Feb-09 S18 Feb-09 Mar-09 *Mar-09 S19 Mar-09 Apr-09 *Apr-09 S20 Apr-09 May-09 *May-09 S21 May-09 Jun-09 *Jun-09 S22 Jun-09 Jul-09 *Jul-09 S23 Jul-09 Aug-09 *Aug-09 *Wetland outflow sample collected two weeks following pond outflow collection. This method replaces averaging over a two-month period. DRAFT-Edgefield RST Water Quality Summary, December
32 Table 3. RST ambient average water quality concentrations and average percent reduction in concentration. Sampling intervals S1-S23 (Sep-07 to Jul/Aug09) Ambient Average Concentration (min-max) TP (mg L -1 ) PO4 (mg L -1 ) TN (mg L -1 ) NOx (mg L -1 ) TSS (mg L -1 ) Inflow 0.37 ( ) 0.15 ( ) 1.70 ( ) 0.70 ( ) 8.78 ( ) Pond Outflow 0.28 ( ) 0.15 (0-0.56) 1.33 ( ) 0.14 (0-1.83) ( ) Wetland Outflow 0.21 ( ) 0.16 (0-0.72) 0.92 ( ) 0.01 (0-0.04) 2.72 ( ) Average Percent Reduction in Concentration TP PO4 TN NOx TSS Inflow vs. Wetland Outflow 42% -10% 46% 98% 69% DRAFT-Edgefield RST Water Quality Summary, December
33 Table to 2009 Average storm event concentration. Total Nitrogen (mg L -1 ) Total Phosphorus (mg L -1 ) Total Suspended Solids (mg L -1 ) Month Inflow TN Pond Out TN Wetl Out TN Inflow TP Pond Out TP Wetl Out TP Inflow TSS Pond Out TSS Wetl Out TSS *Jun no data no data 6.10 no data no data no data no data *Jul *Aug *Sep Oct-08 no data no data 1.33 no data no data no data 4.00 Nov no data no data 0.07 no data no data 2.48 Dec-08 no data no data 1.43 no data no data 0.08 no data no data 2.74 Jan Feb Apr no data no data no data 4.12 May-09 no data no data no data no data 3.59 Jun no data no data no data 1.50 Jul-09 no data Aug Sep Average % Reduction 77% 91% 97% DRAFT-Edgefield RST Water Quality Summary, December
AT&T Global Network Client for Windows Product Support Matrix January 29, 2015
 AT&T Global Network Client for Windows Product Support Matrix January 29, 2015 Product Support Matrix Following is the Product Support Matrix for the AT&T Global Network Client. See the AT&T Global Network
Field Performance of Two Stormwater Bioretention Filtration Design Configurations
 Field Performance of Two Stormwater Bioretention Filtration Design Configurations Andrew Anderson, E.I.T. North Carolina State University Department of Biological & Agricultural Engineering 2013 Annual
FINAL 2014 PROGRESS REPORT
 FINAL 2014 PROGRESS REPORT for the Lake Harney, Lake Monroe, St. Johns River, and Smith Canal Basin Management Action Plan prepared by the Division of Environmental Assessment and Restoration Water Quality
Retention/Irrigation. Design Considerations. Soil for Infiltration Area Required Slope Environmental Side-effects
 Description Retention/irrigation refers to the capture of stormwater runoff in a holding pond and subsequent use of the captured volume for irrigation of landscape of natural pervious areas. This technology
10/4/2012. 40 slide sample of Presentation. Key Principles to Current Stormwater Management
 40 slide sample of Presentation Please contact mhoalton@pacewater.com if you would like the complete presentation Key Principles to Current Stormwater Management Distributed Control Measures Integrated
DEVELOPMENT OF A FUNCTIONAL, BEST MANAGEMENT PRACTICE PROGRAM
 TECHNICAL PUBLICATION SJ2010-2 DEVELOPMENT OF A FUNCTIONAL, BEST MANAGEMENT PRACTICE PROGRAM IN THE TRI-COUNTY AGRICULTURAL AREA OF NORTHEAST FLORIDA Technical Publication SJ2010-2 DEVELOPMENT OF A FUNCTIONAL,
Session 9: Analyze Water Quality Data to Characterize the Watershed and Pollutant Sources
 In This Training Session Acronyms Introduction 2006, State of Minnesota, Minnesota Pollution Control Agency 9-1 All rights reserved. Introduction Do you have the data you need to answer important questions
DESCRIPTION OF STORMWATER STRUCTURAL CONTROLS IN MS4 PERMITS
 DESCRIPTION OF STORMWATER STRUCTURAL CONTROLS IN MS4 PERMITS Phase I MS4 permits require continuous updating of the stormwater system inventory owned and operated by the MS4. They also include inspection
Lessons Learned from the Expert BMP Panel Process That May Apply to MTDs. Tom Schueler Chesapeake Stormwater Network
 Lessons Learned from the Expert BMP Panel Process That May Apply to MTDs Tom Schueler Chesapeake Stormwater Network Recent Expert Panels 1. Stormwater Retrofit Practices 2. New State Performance Standards
TARP Section 2.2 Stormwater BMP Screening for Validation
 Requirements for Final Certification of Manufactured Treatment Devices for Total Suspended Solids Removal Based on Field Testing Amendments to TARP Protocol DRAFT April 28, 2009 The New Jersey Stormwater
The International Stormwater BMP Database Part 1: Summary of Database
 Land Development Brief: February 2013 The Pennsylvania Housing Research Center The International Stormwater BMP Database Part 1: Summary of Database Katherine L. Blansett, Ph.D., P.E. INTRODUCTION This
AZ EGER-PATAK HIDROLÓGIAI VIZSGÁLATA, A FELSZÍNI VÍZKÉSZLETEK VÁRHATÓ VÁLTOZÁSÁBÓL ADÓDÓ MÓDOSULÁSOK AZ ÉGHAJLATVÁLTOZÁS HATÁSÁRA
 AZ EGER-PATAK HIDROLÓGIAI VIZSGÁLATA, A FELSZÍNI VÍZKÉSZLETEK VÁRHATÓ VÁLTOZÁSÁBÓL ADÓDÓ MÓDOSULÁSOK AZ ÉGHAJLATVÁLTOZÁS HATÁSÁRA GÁBOR KEVE 1, GÉZA HAJNAL 2, KATALIN BENE 3, PÉTER TORMA 4 EXTRAPOLATING
CONSTRUCTION GENERAL PERMIT RISK ASSESSMENT R-FACTOR CALCULATION NOTIFICATION
 CONSTRUCTION GENERAL PERMIT RISK ASSESSMENT R-FACTOR CALCULATION NOTIFICATION NATIONAL POLLUTANT DISCHARGE ELIMINATION SYSTEM (NPDES) GENERAL PERMIT FOR STORM WATER DISCHARGES ASSOCIATED WITH CONSTRUCTION
Land Disturbance, Erosion Control and Stormwater Management Checklist. Walworth County Land Conservation Department
 Land Disturbance, Erosion Control and Stormwater Management Checklist Walworth County Land Conservation Department The following checklist is designed to assist the applicant in complying with the Walworth
Stormwater Quality Monitoring Report
 Stormwater Quality Monitoring Report Permeable Interlocking Concrete Pavement (PICP) at Denver Wastewater Management Building Denver, Colorado 28-21 October 211 Prepared by Holly Piza, P.E., and Claire
COMPARISON OF FIXED & VARIABLE RATES (25 YEARS) CHARTERED BANK ADMINISTERED INTEREST RATES - PRIME BUSINESS*
 CHARTERED BANK ADMINISTERED INTEREST RATES - PRIME BUSINESS*") COMPARISON OF FIXED & VARIABLE RATES (25 YEARS) 2 Fixed Rates Variable Rates FIXED RATES OF THE PAST 25 YEARS AVERAGE RESIDENTIAL MORTGAGE LENDING RATE - 5 YEAR* (Per cent) Year Jan Feb Mar Apr May Jun
COMPARISON OF FIXED & VARIABLE RATES (25 YEARS) 2 Fixed Rates Variable Rates FIXED RATES OF THE PAST 25 YEARS AVERAGE RESIDENTIAL MORTGAGE LENDING RATE - 5 YEAR* (Per cent) Year Jan Feb Mar Apr May Jun
National Pollutant Removal Performance Database
 National Pollutant Removal Performance Database Version 3 September, 2007 8390 Main Street, 2 nd Floor Ellicott City, MD 21043 410.461.8323 FAX 410.461.8324 www.cwp.org www.stormwatercenter.net The National
Nitrogen, Phosphorus, and Suspended Solids Concentrations in Tributaries to the Great Bay Estuary Watershed in 2011
 Nitrogen, Phosphorus, and Suspended Solids Concentrations in Tributaries to the Great Bay Estuary Watershed in 2011 A Final Report to The Piscataqua Region Estuaries Partnership Submitted by Matthew A.
APPENDIX B DESIGN GUIDELINES FOR APPROVED TREATMENT METHODS
 APPENDIX B DESIGN GUIDELINES FOR APPROVED TREATMENT METHODS PLANTER BOXES 1. Determine the impervious area contributing flow to the planter box (see Chapter 4.2). 2. Assumption: Typical soil infiltration
Clean Water Services. Ecosystems Services Case Study: Tualatin River, Washington
 Viewed broadly, the concept of ecosystem services describes the many resources and services provided by nature. Typically, traditional planning and development practices do not adequately represent the
A White Paper Describing a Watershed-based Monitoring Network Design for the Purgatoire River Basin
 A White Paper Describing a Watershed-based Monitoring Network Design for the Purgatoire River Basin This white paper summarizes a watershed-based monitoring network design for the Purgatoire River Basin,
Ginger Paige and Nancy Mesner University of Wyoming Utah State University
 Effective Water Quality BMP Monitoring Tools Ginger Paige and Nancy Mesner University of Wyoming Utah State University Overview BMP Monitoring Guidance Document for Stream Systems Lessons learned CEAP
CDM. City of Jacksonville Master Stormwater Management Plan (MSMP) Update. December 2008 Update. Agenda. 1. Data Collection. 2.
 Update. December 2008 Update. Agenda. 1. Data Collection. 2.") City of Jacksonville Master Stormwater Management Plan (MSMP) Update December 2008 Update CDM Agenda 1. Data Collection 1. GIS/LiDAR 2. Survey 2. Water Quantity 1. SWMM Modeling 2. FEMA 3. Water Quality
City of Jacksonville Master Stormwater Management Plan (MSMP) Update December 2008 Update CDM Agenda 1. Data Collection 1. GIS/LiDAR 2. Survey 2. Water Quantity 1. SWMM Modeling 2. FEMA 3. Water Quality
CHAPTER 3 STORM DRAINAGE SYSTEMS
 CHAPTER 3 STORM DRAINAGE SYSTEMS 3.7 Storm Drains 3.7.1 Introduction After the tentative locations of inlets, drain pipes, and outfalls with tail-waters have been determined and the inlets sized, the next
Costs for Green Infrastructure and Stormwater Retention Practices
 Costs for Green Infrastructure and Stormwater Retention Practices Bob Newport U.S. EPA December 9, 2014 Topics to be Covered EPA data collection and cost analysis focused on postconstruction stormwater
City of Toronto Wet Weather Flow Monitoring Network: Baseline Conditions 2008 2011
 City of Toronto Wet Weather Flow Monitoring Network: Baseline Conditions 2008 2011 Sharing Loading Estimation Experiences Workshop Tuesday, January 20, 2015 Presented By: Derek Smith City of Toronto Flood
URBAN DRAINAGE CRITERIA
 URBAN DRAINAGE CRITERIA I. Introduction This division contains guidelines for drainage system design and establishes a policy for recognized and established engineering design of storm drain facilities
Stormwater Best Management Practices (BMP) Performance Analysis
 Performance Analysis") Stormwater Best Management Practices (BMP) Performance Analysis Revised Document: March 2010 (Original Document: December 2008) Prepared for: United States Environmental Protection Agency Region 1 5 Post
Stormwater Best Management Practices (BMP) Performance Analysis Revised Document: March 2010 (Original Document: December 2008) Prepared for: United States Environmental Protection Agency Region 1 5 Post
Enhanced Vessel Traffic Management System Booking Slots Available and Vessels Booked per Day From 12-JAN-2016 To 30-JUN-2017
 From -JAN- To -JUN- -JAN- VIRP Page Period Period Period -JAN- 8 -JAN- 8 9 -JAN- 8 8 -JAN- -JAN- -JAN- 8-JAN- 9-JAN- -JAN- -JAN- -JAN- -JAN- -JAN- -JAN- -JAN- -JAN- 8-JAN- 9-JAN- -JAN- -JAN- -FEB- : days
SPA Annual Report for 2002 September, 2003 Montgomery County Department of Environmental Protection Page 125. Evaluation and Recommendations
 Montgomery County Department of Environmental Protection Page 125 Evaluation and Recommendations Monitoring efforts in the Special Protection Areas continue to provide the kind of information needed to
Basic Hydrology. Time of Concentration Methodology
 Basic Hydrology Time of Concentration Methodology By: Paul Schiariti, P.E., CPESC Mercer County Soil Conservation District What is the Time of Concentration? The time it takes for runoff to travel from
City of Lakeland s Wetlands Treatment System An Overview
 An Overview In response to more stringent requirements for wastewater discharges in the early 1980 s, the City explored options for the advanced treatment required, with the Wetland Treatment System proving
FIVE-YEAR ASSESSMENT REPORT
 FIVE-YEAR ASSESSMENT REPORT For the Long Branch Basin Management Action Plan prepared by the Division of Environmental Assessment and Restoration Watershed Restoration Program Florida Department of Environmental
THE FOUR RIVERS RESTORATION PROJECT AND ITS IMPLICATIONS TO THE CHAO PHRAYA RIVER
 KOREA S EXEMPLARY CASE OF FLOOD PREVENTION THE FOUR RIVERS RESTORATION PROJECT AND ITS IMPLICATIONS TO THE CHAO PHRAYA RIVER Office of National River Restoration, Korea MLTM Republic of Korea CONTENTS
Final Report of the Town Owned Lands Improvement Project for the Town of Brentwood, NH
 Final Report of the Town Owned Lands Improvement Project for the Town of Brentwood, NH Project Background In November of 2013 the Green Infrastructure for Sustainable Coastal Communities (GISCC) project
Accounting for Uncertainty in Offset and Trading Programs
 Accounting for Uncertainty in Offset and Trading Programs EPA Technical Memorandum February 12, 2014 Prepared by EPA Region III 1 of 12 CONTENTS Abbreviations and acronyms... 3 Scope... 4 Executive summary...
CITY UTILITIES DESIGN STANDARDS MANUAL
 CITY UTILITIES DESIGN STANDARDS MANUAL Book 2 (SW) SW9 June 2015 SW9.01 Purpose This Chapter provides information for the design of open channels for the conveyance of stormwater in the City of Fort Wayne.
Use of Green Roofs to Meet New Development Runoff Requirements. Greg Davis Nov. 8, 2007
 Use of Green Roofs to Meet New Development Runoff Requirements Greg Davis Nov. 8, 2007 Why green roof? Absorption of precipitation Increased insulation Reduced urban heat island effect Pollutant removal
Pervious Pavers. By: Rich Lahren. Hebron Brick & Block Supply
 Pervious Pavers By: Rich Lahren Hebron Brick & Block Supply Stormwater Management and Control Issues Past emphasis was on flood control Today s emphasis is also on pollution More impermeable areas are
WATER QUALITY MODELING TO SUPPORT THE ROUGE RIVER RESTORATION
 WATER QUALITY MODELING TO SUPPORT THE ROUGE RIVER RESTORATION Edward H. Kluitenberg, P.E., Applied Science, Inc. Gary W. Mercer, P.E., Camp, Dresser and McKee Vyto Kaunelis, Wayne County Department of
Maine Department of Environmental Protection Program Guidance On Combined Sewer Overflow Facility Plans
 Maine Department of Environmental Protection Program Guidance On Combined Sewer Overflow Facility Plans OVERVIEW The objective of a Combined Sewer Overflow (CSO) Facility Plan is to abate CSO discharges
Application of Wetlands for Nutrient Polishing in Urban Environments. Jan Vymazal ENKI, o.p.s., Třeboň, Czech Republic
 Application of Wetlands for Nutrient Polishing in Urban Environments Jan Vymazal ENKI, o.p.s., Třeboň, Czech Republic (Constructed) wetlands have been used to treat many types of stormwater runoff Streets,
1.7.0 Floodplain Modification Criteria
 1.7.0 Floodplain Modification Criteria 1.7.1 Introduction These guidelines set out standards for evaluating and processing proposed modifications of the 100- year floodplain with the following objectives:
Peter J. Strazdas Associate Vice President, Facilities Management Western Michigan University peter.strazdas@wmich.edu
 Peter J. Strazdas Associate Vice President, Facilities Management Western Michigan University peter.strazdas@wmich.edu Mark S. Kieser Principal, Senior Scientist Kieser & Associates, LLC mkieser@kieser-associates.com
Toronto s Wet Weather Flow Master Plan
 Toronto s Wet Weather Flow Master Plan 1. The Master Plan 2. The Don And Waterfront Study 3. What the Individual Can Do Wet Weather Flow Management Master Plan 2000 Storm Presentation to Don Mouth Naturalization...
Case 2:08-cv-02463-ABC-E Document 1-4 Filed 04/15/2008 Page 1 of 138. Exhibit 8
 Case 2:08-cv-02463-ABC-E Document 1-4 Filed 04/15/2008 Page 1 of 138 Exhibit 8 Case 2:08-cv-02463-ABC-E Document 1-4 Filed 04/15/2008 Page 2 of 138 Domain Name: CELLULARVERISON.COM Updated Date: 12-dec-2007
Analysis One Code Desc. Transaction Amount. Fiscal Period
 Analysis One Code Desc Transaction Amount Fiscal Period 57.63 Oct-12 12.13 Oct-12-38.90 Oct-12-773.00 Oct-12-800.00 Oct-12-187.00 Oct-12-82.00 Oct-12-82.00 Oct-12-110.00 Oct-12-1115.25 Oct-12-71.00 Oct-12-41.00
Water Resources Collections and Archives University of California
 Water Resources Collections and Archives University of California Title: Effects of climate change on the hydrology of upper Alameda Creek Author: Klausmeyer, Kirk, University of California, Berkeley Publication
Greater Los Angeles County Region
 Attachment 6 Greater Los Angeles County Region IRWM Implementation Grant Proposal Monitoring, Assessment, and Attachment 6 consists of the following items: Monitoring, Assessment, and. The purpose of this
WATER QUALITY MONITORING AND APPLICATION OF HYDROLOGICAL MODELING TOOLS AT A WASTEWATER IRRIGATION SITE IN NAM DINH, VIETNAM
 WATER QUALITY MONITORING AND APPLICATION OF HYDROLOGICAL MODELING TOOLS AT A WASTEWATER IRRIGATION SITE IN NAM DINH, VIETNAM LeifBasherg (1) OlujZejlllJul Jessen (1) INTRODUCTION The current paper is the
Annual Forage (AF) Pilot Program
 Pilot Program") Oklahoma Cooperative Extension Service AGEC-626 Annual Forage (AF) Pilot Program Jody Campiche Assistant Professor & Extension Economist JJ Jones Southeast Area Extension Agriculture Economist The Rainfall
Oklahoma Cooperative Extension Service AGEC-626 Annual Forage (AF) Pilot Program Jody Campiche Assistant Professor & Extension Economist JJ Jones Southeast Area Extension Agriculture Economist The Rainfall
Restoration Strategies Regional Water Quality Plan
 Prepared by South Florida Water Management District April 27, 2012 Final Version Table of Contents 1.0 Introduction... 4 2.0 Evaluation Tools and Assumptions... 5 2.1 Modeling Tools and Datasets... 5 2.1.1
COMPREHENSIVE PLAN SECTION B, ELEMENT 4 WATER RESOURCES. April 20, 2010 EXHIBIT 1
 COMPREHENSIVE PLAN SECTION B, ELEMENT 4 WATER RESOURCES April 20, 2010 EXHIBIT 1 ELEMENT 4 WATER RESOURCES TABLE OF CONTENTS 4.1 INTRODUCTION 4.2 GOALS AND POLICIES 4.2.A General Goals and Policies 1 4.2.B
User s Manual for the BMPTRAINS Model
 User s Manual for the BMPTRAINS Model Prepared By: Marty Wanielista, Mike Hardin, Przemyslaw Kuzlo, and Ikiensinma Gogo-Abite STORMWATER TREATMENT ANALYSIS: STEP 1: Specify pre- and post-development watershed
Evaluating Drain Inlet Cleaning as a Storm Water Best Management Practice
 California State University, Sacramento (CSUS) University of California, Davis (UCD) California Department of Transportation (Caltrans) Evaluating Drain Inlet Cleaning as a Storm Water Best Management
Swamp Area Passive Treatment System Kettle Creek Watershed, Clinton County, PA
 Swamp AMD Chemistry Swamp Area Passive Treatment System Kettle Creek Watershed, Clinton County, PA A Technical Report for Trout Unlimited and the Kettle Creek Watershed Association Prepared by Hedin Environmental
Tennessee Watershed Modeling Tools. Southern Region Watershed Meeting, July 2005. Forbes Walker University of Tennessee Extension
 Tennessee Watershed Modeling Tools Southern Region Watershed Meeting, July 2005 Forbes Walker University of Tennessee Extension Outline Land Use and Water Quality in Tennessee Watershed models Watershed
Report prepared by: Kelly Hagan and Mark Anderson Grand River Conservation Authority 400 Clyde Road Cambridge ON N1R 5W6
 2013 Watershed Overview of Wastewater Treatment Plant Performance Report prepared by: Kelly Hagan and Mark Anderson Grand River Conservation Authority 400 Clyde Road Cambridge ON N1R 5W6 Table of Contents
Blaine Hanson Department of Land, Air and Water Resources University of California, Davis
 Blaine Hanson Department of Land, Air and Water Resources University of California, Davis Irrigation Water Management - Science, Art, or Guess? Irrigation water management: questions to answer When should
Biennial Review Request for Comments From DEQ (revised 12-30- 14)
") Biennial Review Request for Comments From DEQ (revised 12-30- 14) The State Department of Agriculture and the State Board of Agriculture shall consult with the Department of Environmental Quality or the
Biennial Review Request for Comments From DEQ (revised 12-30- 14) The State Department of Agriculture and the State Board of Agriculture shall consult with the Department of Environmental Quality or the
Executive Summary Minnesota Nutrient Reduction Strategy
 Executive Summary The (NRS) will guide the state in reducing excess nutrients in waters so that in-state and downstream water quality goals are ultimately met. Nutrient impacts are widespread. Excessive
CHAPTER 2 HYDRAULICS OF SEWERS
 CHAPTER 2 HYDRAULICS OF SEWERS SANITARY SEWERS The hydraulic design procedure for sewers requires: 1. Determination of Sewer System Type 2. Determination of Design Flow 3. Selection of Pipe Size 4. Determination
ROSE CREEK WATERSHED HYDROLOGIC, HYDRAULIC, SEDIMENT TRANSPORT, AND GEOMORPHIC ANALYSES TASK 1 EXISTING DATA AND INFORMATION SUMMARY REPORT BACKGROUND
 ROSE CREEK WATERSHED HYDROLOGIC, HYDRAULIC, SEDIMENT TRANSPORT, AND GEOMORPHIC ANALYSES TASK 1 EXISTING DATA AND INFORMATION SUMMARY REPORT BACKGROUND The Rose Creek Watershed (RCW) consists of three planning
Fort Dodge Stormwater Master Planning. Prepared By: Ralph C. Stark, Jr., P.E., C.F.M. Joel N. Krause, P.E., C.F.M.
 Fort Dodge Stormwater Master Planning Prepared By: Ralph C. Stark, Jr., P.E., C.F.M. Joel N. Krause, P.E., C.F.M. Project Location Project Background Flooding History Localized flooding and storm sewer
Watershed-Wide Modeling for TMDL/MS4 Permit Compliance. Greg Wilson, Barr Engineering
 Watershed-Wide Modeling for TMDL/MS4 Permit Compliance Greg Wilson, Barr Engineering Acknowledge City of Golden Valley Eric Eckman Heather Hegi Laura Jester and BCWMC Technical Advisory Committee members
Table 2: State Agency Recommendations Agency of Agriculture, Food and Markets
 SUPPORTING INFORMATION ASSOCIATED WITH THE ALLOCATION PRIORITIES FOR CLEAN WATER FUND BOARD Table 2: State Agency Recommendations Agency of Agriculture, Food and Markets 1 Agriculture AAFM On-Farm Implementation
TEXAS: SAN ANTONIO San Antonio Protects Edwards Aquifer
 TEXAS: SAN ANTONIO San Antonio Protects Edwards Aquifer Background San Antonio, the seventh largest city in the United States, covers approximately 515 square miles of Bexar County in south central Texas.
New River Cleanup. Progress & Emerging Threats
 C R W Q New River Cleanup Progress & Emerging Threats C B California Regional Water Quality Control Board- Colorado River Basin Jose L. Angel, Principal Engineer, Assistant Executive Officer 1 New River
U.S. Army Corps of Engineers Tulsa District
 U.S. Army Corps of Engineers Tulsa District Mike Abate, PMP. Chief, Civil Works Branch, PPMD April 17, 2015 US Army Corps of Engineers Civil Works Mission Water Supply 50% of Corps water supply contracts
CLACKAMAS COUNTY ZONING AND DEVELOPMENT ORDINANCE
 1008 STORM DRAINAGE (3/24/05) 1008.01 PURPOSE To minimize the amount of stormwater runoff resulting from development utilizing nonstructural controls where possible, maintain and improve water quality,
Order No. R1-2009-0050 MS4 Storm Water Permit Santa Rosa, Sonoma County, and the Sonoma County Water Agency
 PART 4 Modifications/Revisions (IV) Storm drain clean-outs (include dumping fees separately); (V) Other costs (describe); (vii) Public information and participation program; (viii) Monitoring program;
During the past decade, the city of
 An Advanced Pollution Control Facility s Conversion to Four-Stage Bardenpho to Improve Biological Nitrogen Removal Timur Deniz, Thomas W. Friedrich, and John Milligan During the past decade, the city of
Hydrologic Modeling using HEC-HMS
 Hydrologic Modeling using HEC-HMS Prepared by Venkatesh Merwade School of Civil Engineering, Purdue University vmerwade@purdue.edu April 2012 Introduction The intent of this exercise is to introduce you
Drainage Water Management Phosphorus Loss from a Tile Drained Field in Northern New York. Justin Geibel, Eric Young, and Stephen Kramer
 Drainage Water Management Phosphorus Loss from a Tile Drained Field in Northern New York Justin Geibel, Eric Young, and Stephen Kramer Tile Drainage Widespread use in US and NNY o Accessibility o Extends
Restoring Anadromous Fish Habitat in Big Canyon Creek Watershed. Summary Report 2002
 Restoring Anadromous Fish Habitat in Big Canyon Creek Watershed Summary Report 2002 DOE/BP-00005268-5 November 2002 This Document should be cited as follows: "Restoring Anadromous Fish Habitat in Big Canyon
Water Balance Study: A Component of the Watershed Management Plan for the Carneros Creek Watershed, Napa County, California
 Water Balance Study: A Component of the Watershed Management Plan for the Carneros Creek Watershed, Napa County, California prepared for Stewardship Support and Watershed Assessment in the Napa River Watershed:
OPTIMIZING BIOLOGICAL PHOSPHORUS REMOVAL FROM AN SBR SYSTEM MIDDLEBURY, VT. Paul Klebs, Senior Applications Engineer Aqua-Aerobic Systems, Inc.
 OPTIMIZING BIOLOGICAL PHOSPHORUS REMOVAL FROM AN SBR SYSTEM ABSTRACT MIDDLEBURY, VT Paul Klebs, Senior Applications Engineer Aqua-Aerobic Systems, Inc. The Middlebury Wastwater Treatment Plant, located
Section 2. Mono Basin Operations
 Section 2 Mono Basin Chapter 2 Mono Basin Compliance with State Water Resources Control Board Decision 1631 and Order Nos. 98-05 and 98-07 May 2008 Los Angeles Department of Water and Power Table of Contents
Innovative Stormwater Solutions in Coastal Areas 2015 APWA Stormwater Conference
 Innovative Stormwater Solutions in Coastal Areas 2015 APWA Stormwater Conference September 15, 2015 Barrier Island Hydrology 2015 APWA Stormwater Conference September 15, 2015 2 Barrier Island Hydrology
STORMWATER MANAGEMENT CHECKLIST
 STORMWATER MANAGEMENT CHECKLIST *This checklist must be completed and part of the Land Disturbing Permit submittal for review if the acreage disturbed is one (1) acre or more: I. SUPPORTING DATA Narrative
Interlocking Concrete Pavement Institute (ICPI) Model Stormwater Ordinance for Permeable Interlocking Concrete Pavements August 2010
 Model Stormwater Ordinance for Permeable Interlocking Concrete Pavements August 2010") Interlocking Concrete Pavement Institute (ICPI) Model Stormwater Ordinance for Permeable Interlocking Concrete Pavements August 2010 Background What are permeable interlocking concrete pavements (PICP)?
Interlocking Concrete Pavement Institute (ICPI) Model Stormwater Ordinance for Permeable Interlocking Concrete Pavements August 2010 Background What are permeable interlocking concrete pavements (PICP)?
BLACK/HARMONY/FAREWELL CREEK WATERSHED EXISTING CONDITIONS REPORT CHAPTER 12 - STORMWATER MANAGEMENT
 Harmony Creek subwatershed Harmony Creek subwatershed BLACK/HARMONY/FAREWELL CREEK WATERSHED EXISTING CONDITIONS REPORT CHAPTER 12 - STORMWATER MANAGEMENT April 2011 TABLE OF CONTENTS 1.0 INTRODUCTION...
2013 Watershed Treatment Model C E N T E R F O R W A T E R S H E D P R O T E C T I O N A U G U S T, 2 0 1 3
 2013 Watershed Treatment Model C E N T E R F O R W A T E R S H E D P R O T E C T I O N A U G U S T, 2 0 1 3 WTM - Agenda 1. Overview of the WTM Terminology Model Structure (Versions) 2. WTM Details (Assumptions)
3.4 DRAINAGE PLAN. 3.4.1 Characteristics of Existing Drainages. 3.4.2 Master Drainage System. Section 3: Development Plan BUTTERFIELD SPECIFIC PLAN
 3.4 DRAINAGE PLAN This section describes the existing onsite drainage characteristics and improvements proposed within this Specific Plan. Following this description, drainage plan development standards
MASSACHUSETTS COASTAL NONPOINT PROGRAM NOAA/EPA DECISIONS ON CONDITIONS OF APPROVAL
 MASSACHUSETTS COASTAL NONPOINT PROGRAM NOAA/EPA DECISIONS ON CONDITIONS OF APPROVAL FOREWORD This document contains the basis for NOAA and EPA s decision to fully approve Massachusetts Coastal Nonpoint
Orange County Fertilizer Application Education Course for Citizens
 Orange County Fertilizer Application Education Course for Citizens Purpose & Intent In 2009 Orange County took a proactive stand on protecting our lakes, rivers, streams, and groundwater by approving a
WHISKY CREEK DEMONSTRATION PROJECT
 WHISKY CREEK DEMONSTRATION PROJECT OCC Tasks 16 and 17 FY 1990 319(h) Sub-Task 200(A) EPA Grant # C9-006704-90-0 Submitted by: Oklahoma Conservation Commission Water Quality Division 413 NW 12 th Oklahoma
The Droplet. Florida Water Environment Association Integrated Water Resources Committee. June 2013 Volume 5 Issue 2. Chair: Saurabh Srivastava
 The Droplet Florida Water Environment Association Integrated Water Resources Committee June 2013 Volume 5 Issue 2 In this Issue Page Gainesville Regional Utilities Paynes Prairie Sheetflow Restoration
Report for 2003PA14B: Spruce Creek Watershed Keystone Project
 Report for 2003PA14B: Spruce Creek Watershed Keystone Project There are no reported publications resulting from this project. Report Follows Abstract: This proposal seeks support for a graduate assistant
Purpose of the water security outlook
 Water Security Outlook December 2015 Purpose of the water security outlook The Water Security Outlook (WSO) is an annual update to Barwon Water s Water Supply Demand Strategy (WSDS), published in 2012.
THE MARSHALL STREET ADVANCED POLLUTION CONTROL FACILITY (CLEARWATER, FLORIDA) CONVERSION TO 4-STAGE BARDENPHO TO IMPROVE BIOLOGICAL NITROGEN REMOVAL
 CONVERSION TO 4-STAGE BARDENPHO TO IMPROVE BIOLOGICAL NITROGEN REMOVAL") THE MARSHALL STREET ADVANCED POLLUTION CONTROL FACILITY (CLEARWATER, FLORIDA) CONVERSION TO 4-STAGE BARDENPHO TO IMPROVE BIOLOGICAL NITROGEN REMOVAL ABSTRACT Timur Deniz, Ph.D., Thomas W. Friedrich, P.E.
THE MARSHALL STREET ADVANCED POLLUTION CONTROL FACILITY (CLEARWATER, FLORIDA) CONVERSION TO 4-STAGE BARDENPHO TO IMPROVE BIOLOGICAL NITROGEN REMOVAL ABSTRACT Timur Deniz, Ph.D., Thomas W. Friedrich, P.E.
GROWER ADVISORY Agriculture Regulations of the Wetlands Protection Act
 Cape Cod Cranberry Growers Association GROWER ADVISORY Agriculture Regulations of the Wetlands Protection Act Cranberry Bogs and the Agricultural Exemption The Massachusetts Wetlands Protection Act (WPA)
Permeable Pavement Treatment Capacity
 Permeable Pavement Treatment Capacity April 20 2011 This investigation will analyze the pollutant removal capacity of various types of permeable paving techniques. Daniel Sullivan Joseph Fleury Contents
LOW INTEREST LOANS FOR AGRICULTURAL CONSERVATION
 LOW INTEREST LOANS FOR AGRICULTURAL CONSERVATION LILAC MANUAL LOW INTEREST LOANS FOR AGRICULTURAL CONSERVATION TABLE OF CONTENTS Introduction... 3 General Eligibility... 4 Specific Eligibility Criteria
CREATING A GREEN FUTURE THROUGH WATER REMEDIATION
 CREATING A GREEN FUTURE THROUGH WATER REMEDIATION Cornerstone Principles for Conducting Business Active Treatment Systems, Inc. goes to great lengths to instill in every employee the importance of ethical
RETICULATED RECYCLED WATER SCHEMES OPERATIONAL CONSIDERATIONS. Duncan Wallis. RM Consulting Group
 RETICULATED RECYCLED WATER SCHEMES OPERATIONAL CONSIDERATIONS Paper Presented by: Duncan Wallis Author: Duncan Wallis, Senior Consultant, RM Consulting Group 72 nd Annual Water Industry Engineers and Operators
WASHINGTON STATE DEPARTMENT OF TRANSPORTATION SUMMARY OF INVENTORY FINDINGS:
 WASHINGTON STATE DEPARTMENT OF TRANSPORTATION SUMMARY OF INVENTORY FINDINGS: Spokane River Dissolved Oxygen Total Maximum Daily Load October 15, 2013 Introduction Special Condition S6 of the Washington
Chapter 2 Stormwater Pollution Prevention Plan (SWPPP) for Park Operations
 for Park Operations") SWPPP for Park Operations 2 Chapter 2 Stormwater Pollution Prevention Plan (SWPPP) for Park Operations Bordered by Lake Washington & Lake Sammamish, the City of Bellevue has more than 60 miles of streams,
SWPPP for Park Operations 2 Chapter 2 Stormwater Pollution Prevention Plan (SWPPP) for Park Operations Bordered by Lake Washington & Lake Sammamish, the City of Bellevue has more than 60 miles of streams,
Climate Change. Lauma M. Jurkevics - DWR, Southern Region Senior Environmental Scientist
 Climate Change A n o t h e r F a c t o r i n M a n a g i n g S o u t h e r n C a l i f o r n i a s W a t e r R e s o u r c e s Lauma M. Jurkevics - DWR, Southern Region Senior Environmental Scientist USEPA-Region