Condensing PQ Data and Visualization Analytics. Thomas Cooke
|
|
|
- Austin Cox
- 8 years ago
- Views:
Transcription
1 1 Condensing PQ Data and Visualization Analytics Thomas Cooke

2 Storing and Transmitting Data One Monitor / Site (2 bytes per sample) X (512 samples/cycle) X (60 cycles/sec) X (60 sec/min) X (60 min/hr) 221,184,000 bytes or 221 MB/hr X (8 channels of Voltage and Current data) 1,769,472,000 bytes or 1.8 GB/hr X (24 hrs/day) X (365 days/year) 15,500,574,720,000 bytes or 15 TB/yr

3 Impact on Human Interpretation of Data If scrolling and observing 10 cycles/sec (x 8 channels) 48 years to look at 1 year of data
 48 years to look at 1")
4 Present Example of Big Data Mitigation

5 What are we missing with present triggering methods? If the thresholds are not sensitive enough, anomalies can be missed. (High Impedance Fault Deviations) If the sensitivities of thresholds are set too low, the user is inundated with a large amount of data sets to parse and zoom through

6 EPRI Cyclic Histogram Open Conceptual Design Guide Tom Cooke April Electric Power Research Institute, Inc. All rights reserved.

7 Background In the electric power industry, the voltage and current waveforms are the rawest forms of data that are analyzed for power system anomalies. To capture these anomalies, digital signal processors sample amplitude values from 128 to 1024 times per waveform cycle in order to deliver an interpretable anomalous event cause. Historically, it is not efficient to collect and store this type of data continuously because such data storage is impractical, nor is it preferable to sort through this amount of data to find the anomalies that have occurred in one 60-hertz cycle out of millions of cycles recorded in a given day. Today, power quality monitors are configured to record data only when the waveform exceeds preset boundaries as predetermined by input variables. If the waveform is not changing significantly, the data-acquisition system does not record that data, therefore reducing the size of stored data. The problem with this method is often anomalies are not captured because the threshold triggers are not preset correctly. If the thresholds are not sensitive enough, anomalies can be missed. Conversely, if the sensitivity of thresholds are set too low, the user is inundated with a large amount of data sets to parse and zoom through, requiring a significant amount of time for analysis. The new Cyclic Histogram method reduces the impact of large amounts of waveform data and resolves the issues associated with the current methods mentioned above. Note that this method is meant to enhance current methods, rather than replace it.

8 Basic Cyclic Histogram Structure This Cyclic Histogram method is a three-dimensional representation of many continuous cycles of historical current or voltage waveforms in a one-cycle view. The X and Y axes make up a given matrix of bins for a stack of Z values to be established. As a given X sample is selected, the Y value is measured and placed in the corresponding bin. The number of bins is determined by horizontal and vertical resolution.

9 Cyclic Histogram (X and Y Axis) The X axes should represent the number of points per cycle, with each sample having a delta-t that is the inversefrequency divided by the number of points. For visual needs, the Y axis will not need the same vertical resolution as the source data. Most meters record 16 bit (65536) resolution. 10 bit (1024) may suffice which in this case would aggregate 64 vertical value levels into 1 bin.
 resolution.")
10 For steady state, values in this color region (yellow to red) will be percentage values and the representative color will be dynamic depending on the total period (T) of the cyclic histogram. For this algorithm, the value will be stored as a percent, which is derived from one sample divided by total samples in the T measurement period. If one or more values already exists in this bin, the percent value is mathematically added to the previous value(s). The minimum percentage will depend on the total period selected, but it will always be based on 1 minute. (1 minute / 1 hour = 1.67%) or (1 minute / 1 day = 0.069%) This method gives us some visual distinction between events and steady state variations. Z axis Coloring For power quality phenomena we have two distinct variations in waveforms. steady state variations, and event variations. And each have their typical range as defined in PQ standard IEEE For events, we typically see variations from 1 to ~180 cycles. A series of events are typically less than one minute (3600 cycles). Steady state variations are greater than one minute. As shown in the graphic, events have a color region that presents static duration (1 to 3600 cycles) regardless of the cyclic histograms total period (T). For the static algorithm one pass by a bin equals 1 cycle. Counting the number of samples in a bin establishes what color of blue to green is presented.
 or (1 minute / 1 day = 0.")
.")

11 To ease storage, transfer, and display of the cyclic histogram, it can be distributed as a static image (gif, png, etc). There can be multiple images for each phase, voltage and current. Furthermore, there may be multiple pages of images representing different time periods (i.e. 1 hour, 1 day, or maybe 1 week) Format and Display

12 For more information on the Cyclic Histogram, contact.. Thomas Cooke Project Manager Power Quality Monitoring and Analytics, Power Delivery Electric Power Research Institute (EPRI) 942 Corridor Park Blvd., Knoxville, TN Office: Fax: Together... Shaping the Future of Electricity

13 13 Subtle Waveform Deviation from Arcing Animation

14 Cyclic Histogram Highlights Deviations 14

15 Data Type and Priority Priority (Communicating/Processing) Low High Raw PQ Data Historical Analysis Large Real-Time Analysis Real-Time Notification Trends & Historical Operational Small Data Set Size Example Outage/Event notification Transmits quickly Text based Translation of Event Fault location analysis Select sites, or manual polling to lessen impact High resolution RMS or waveform data Historical data for statistical process control / notification with real-time system data Processed statistical trends (down sampled copy of historical) Bench marking or long term impact studies High resolution original format from a high volume of data sets
 Bench marking or long term impact studies High resolution original format from a high")
16 Operational Historic Data Plotting historical data with realtime is important to establish that changes have occurred outside the historical norm. (statistical process control) Operating directly from the historical database would require pre-processing or decompression, which, for some applications, may not perform efficiently when analyzing large data sets. There s benefit using an operational historical database that uses preprocessed downsampled or statistical parameters Leads to analyzing data quicker. SPC Example


17 Text Based Translation / Event Parameters

18 Waveform Downsampling

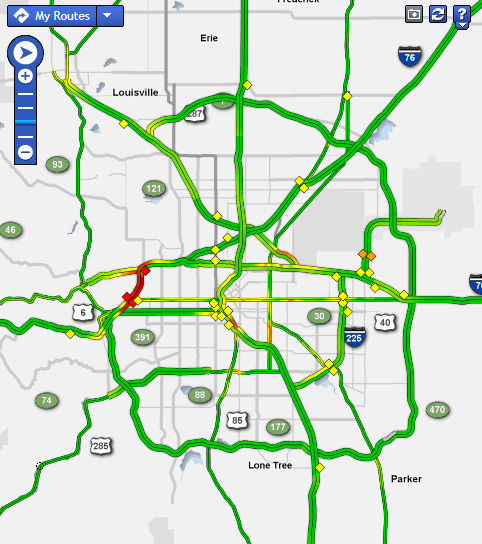

19 Example of Visualizing -Denver Traffic Data

20 PQ Monitoring Evolving from Single-Site Investigations. to Wide-Area PQ Monitoring Applications DME w/pq

21 Equating to large amounts of PQ data to both communicate and interpret.
22 Opportunities using Data Visualization for Reporting Quick and Interpretable PQ Information V THD
23 100% Voltage Sag Severity from a Fault 90% 80% 70% 60% V Sag 50% 40% 30% 20%
24 24
25 25
Jitter Measurements in Serial Data Signals
 Jitter Measurements in Serial Data Signals Michael Schnecker, Product Manager LeCroy Corporation Introduction The increasing speed of serial data transmission systems places greater importance on measuring
USER MANUAL Detcon Log File Viewer
 USER MANUAL Detcon Log File Viewer DETCON, Inc. 4055 Technology Forest Blvd., The Woodlands, Texas 77381 Ph.281.367.4100 / Fax 281.298.2868 www.detcon.com January 29, 2013 Document #4482 Revision 1.00
2002 IEEE. Reprinted with permission.
 Laiho J., Kylväjä M. and Höglund A., 2002, Utilization of Advanced Analysis Methods in UMTS Networks, Proceedings of the 55th IEEE Vehicular Technology Conference ( Spring), vol. 2, pp. 726-730. 2002 IEEE.
MMGD0203 Multimedia Design MMGD0203 MULTIMEDIA DESIGN. Chapter 3 Graphics and Animations
 MMGD0203 MULTIMEDIA DESIGN Chapter 3 Graphics and Animations 1 Topics: Definition of Graphics Why use Graphics? Graphics Categories Graphics Qualities File Formats Types of Graphics Graphic File Size Introduction
Utilization of Web-based Power Quality Monitoring to Assess Customer Power System Performance
 Utilization of Web-based Power Quality Monitoring to Assess Customer Power System Performance Christopher J. Melhorn, Sandy Smith Electrotek Concepts Knoxville, TN Frank Sinicola, Peter Muccio Consolidated
Use one dashboard to drive your energy awareness and business objectives
 Use one dashboard to drive your energy awareness and business objectives PowerLogic ION EEM enterprise energy management software For electric industry, buildings and infrastructure applications Make the
Monitoring & Control of Small-scale Renewable Energy Sources
 Small Scale Renewable Energy Sources and Energy Saving: 6-17 th July 2009 Monitoring & Control of Small-scale Renewable Energy Sources Dr G A Taylor Brunel Institute of Power Systems Brunel University,
COM CO P 5318 Da t Da a t Explora Explor t a ion and Analysis y Chapte Chapt r e 3
 COMP 5318 Data Exploration and Analysis Chapter 3 What is data exploration? A preliminary exploration of the data to better understand its characteristics. Key motivations of data exploration include Helping
Complete fleet management package for Qualitrol Information Products
 + iq Master Station Configuration, collection and analysis platform Complete fleet management package for Qualitrol Information Products Scalable client-server solution Advanced Record Analysis diagnostics
Visualizations. Cyclical data. Comparison. What would you like to show? Composition. Simple share of total. Relative and absolute differences matter
 Visualizations Variable width chart Table or tables with embedded charts Bar chart horizontal Circular area chart per item Many categories Cyclical data Non-cyclical data Single or few categories Many
Iris Sample Data Set. Basic Visualization Techniques: Charts, Graphs and Maps. Summary Statistics. Frequency and Mode
 Iris Sample Data Set Basic Visualization Techniques: Charts, Graphs and Maps CS598 Information Visualization Spring 2010 Many of the exploratory data techniques are illustrated with the Iris Plant data
Oscilloscope, Function Generator, and Voltage Division
 1. Introduction Oscilloscope, Function Generator, and Voltage Division In this lab the student will learn to use the oscilloscope and function generator. The student will also verify the concept of voltage
Shock Alarm software. User Guide
 Shock Alarm software User Guide Contact Information Email: info@laboratories.cz Web: laboratories.cz Contents Preface.. 3 Software installation 3 First time use. 3 Sensor settings. 4 Alarm settings 5 Application
Data Mining: Exploring Data. Lecture Notes for Chapter 3. Introduction to Data Mining
 Data Mining: Exploring Data Lecture Notes for Chapter 3 Introduction to Data Mining by Tan, Steinbach, Kumar Tan,Steinbach, Kumar Introduction to Data Mining 8/05/2005 1 What is data exploration? A preliminary
siemens.com/mobility Traffic data analysis in Sitraffic Scala/Concert The expert system for visualization, quality management and statistics
 siemens.com/mobility Traffic data analysis in Sitraffic Scala/Concert The expert system for visualization, quality management and statistics 2 Traffic data analysis produces transparent intersections The
Introduction. Page1of13
 BookMap User Guide Introduction BookMap is an innovative analysis and trading application that delivers a consolidated visualization of past and present market depth. Using a configurable color scheme,
Data Visualization Techniques
 Data Visualization Techniques From Basics to Big Data with SAS Visual Analytics WHITE PAPER SAS White Paper Table of Contents Introduction.... 1 Generating the Best Visualizations for Your Data... 2 The
Building a Simulink model for real-time analysis V1.15.00. Copyright g.tec medical engineering GmbH
 g.tec medical engineering GmbH Sierningstrasse 14, A-4521 Schiedlberg Austria - Europe Tel.: (43)-7251-22240-0 Fax: (43)-7251-22240-39 office@gtec.at, http://www.gtec.at Building a Simulink model for real-time
Software version 1.1 Document version 1.0
 Software version 1.1 Document version 1.0 1 RDNET PROTOCOL OVERVIEW... 2 1.1 Network description... 2 1.2 Connection topology... 2 2 SOFTWARE BASIC OPERATIONS... 3 2.1 Main View elements... 3 2.2 Scanning
WhatsUp Gold v16.1 Wireless User Guide
 WhatsUp Gold v16.1 Wireless User Guide Contents Welcome to WhatsUp Gold Wireless Wireless Overview... 3 Wireless licensing and accessibility... 5 Using WhatsUp Gold Wireless Discovering wireless devices...
Monitoring Software using Sun Spots. Corey Andalora February 19, 2008
 Monitoring Software using Sun Spots Corey Andalora February 19, 2008 Abstract Sun has developed small devices named Spots designed to provide developers familiar with the Java programming language a platform
BEHAVIOR BASED CREDIT CARD FRAUD DETECTION USING SUPPORT VECTOR MACHINES
 BEHAVIOR BASED CREDIT CARD FRAUD DETECTION USING SUPPORT VECTOR MACHINES 123 CHAPTER 7 BEHAVIOR BASED CREDIT CARD FRAUD DETECTION USING SUPPORT VECTOR MACHINES 7.1 Introduction Even though using SVM presents
Basic Electrical Technology Dr. L. Umanand Department of Electrical Engineering Indian Institute of Science, Bangalore. Lecture - 33 3 phase System 4
 Basic Electrical Technology Dr. L. Umanand Department of Electrical Engineering Indian Institute of Science, Bangalore Lecture - 33 3 phase System 4 Hello everybody. So, in the last class we have been
Animated example of Mr Coscia s trading
 1 Animated example of Mr Coscia s trading 4 An example of Mr Coscia's trading (::. to ::.69) 3 2 The chart explained: horizontal axis shows the timing of the trades in milliseconds right hand vertical
Free 15-day trial. Signata Waveform Viewer Datasheet
 The Signata Waveform Viewer allows you to view and analyze data captured from your oscilloscope anytime and anywhere. You will gain instant insight into device performance, quickly determine the root cause
Logging of RF Power Measurements
 Logging of RF Power Measurements By Orwill Hawkins Logging of measurement data is critical for effective trend, drift and Exploring the use of RF event analysis of various processes. For RF power measurements,
Data Visualization Techniques
 Data Visualization Techniques From Basics to Big Data with SAS Visual Analytics WHITE PAPER SAS White Paper Table of Contents Introduction.... 1 Generating the Best Visualizations for Your Data... 2 The
Big Data: Rethinking Text Visualization
 Big Data: Rethinking Text Visualization Dr. Anton Heijs anton.heijs@treparel.com Treparel April 8, 2013 Abstract In this white paper we discuss text visualization approaches and how these are important
5 Steps to Avoid Network Alert Overload
 5 Steps to Avoid Network Alert Overload By Avril Salter 1. 8 0 0. 8 1 3. 6 4 1 5 w w w. s c r i p t l o g i c. c o m / s m b I T 2011 ScriptLogic Corporation ALL RIGHTS RESERVED. ScriptLogic, the ScriptLogic
Electronic Communications Committee (ECC) within the European Conference of Postal and Telecommunications Administrations (CEPT)
 within the European Conference of Postal and Telecommunications Administrations (CEPT)") Page 1 Electronic Communications Committee (ECC) within the European Conference of Postal and Telecommunications Administrations (CEPT) ECC RECOMMENDATION (06)01 Bandwidth measurements using FFT techniques
Page 1 Electronic Communications Committee (ECC) within the European Conference of Postal and Telecommunications Administrations (CEPT) ECC RECOMMENDATION (06)01 Bandwidth measurements using FFT techniques
PVNMS Brochure. 2013 All rights reserved. Proxim Wireless Corporation. 1
 2013 All rights reserved. Proxim Wireless Corporation. 1 Manage Your Wireless Network Via The Cloud Engineered with a revolutionary new design, the next generation ProximVision Network Management System
Power Monitoring for Modern Data Centers
 Power Monitoring for Modern Data Centers December 2010/AT304 by Reza Tajali, P.E. Square D Power Systems Engineering Make the most of your energy SM Revision #1 12/10 By their nature, mission critical
Data Mining: Exploring Data. Lecture Notes for Chapter 3. Introduction to Data Mining
 Data Mining: Exploring Data Lecture Notes for Chapter 3 Introduction to Data Mining by Tan, Steinbach, Kumar What is data exploration? A preliminary exploration of the data to better understand its characteristics.
The Scientific Data Mining Process
 Chapter 4 The Scientific Data Mining Process When I use a word, Humpty Dumpty said, in rather a scornful tone, it means just what I choose it to mean neither more nor less. Lewis Carroll [87, p. 214] In
Machine Data Analytics with Sumo Logic
 Machine Data Analytics with Sumo Logic A Sumo Logic White Paper Introduction Today, organizations generate more data in ten minutes than they did during the entire year in 2003. This exponential growth
Data Exploration Data Visualization
 Data Exploration Data Visualization What is data exploration? A preliminary exploration of the data to better understand its characteristics. Key motivations of data exploration include Helping to select
GlobiLab 1.0 App for Android Quick Start Guide
 GlobiLab 1.0 App for Android Quick Start Guide Contents GlobiLab overview... 1 Getting started establishing communication. 2 Working with the different display types... 3 Graph and Labdisc controls...
What is LOG Storm and what is it useful for?
 What is LOG Storm and what is it useful for? LOG Storm is a high-speed digital data logger used for recording and analyzing the activity from embedded electronic systems digital bus and data lines. It
Clock Jitter Definitions and Measurement Methods
 January 2014 Clock Jitter Definitions and Measurement Methods 1 Introduction Jitter is the timing variations of a set of signal edges from their ideal values. Jitters in clock signals are typically caused
Visualization methods for patent data
 Visualization methods for patent data Treparel 2013 Dr. Anton Heijs (CTO & Founder) Delft, The Netherlands Introduction Treparel can provide advanced visualizations for patent data. This document describes
imc FAMOS 6.3 visualization signal analysis data processing test reporting Comprehensive data analysis and documentation imc productive testing
 imc FAMOS 6.3 visualization signal analysis data processing test reporting Comprehensive data analysis and documentation imc productive testing imc FAMOS ensures fast results Comprehensive data processing
Using angular speed measurement with Hall effect sensors to observe grinding operation with flexible robot.
 Using angular speed measurement with Hall effect sensors to observe grinding operation with flexible robot. François Girardin 1, Farzad Rafieian 1, Zhaoheng Liu 1, Marc Thomas 1 and Bruce Hazel 2 1 Laboratoire
Spectrum and Power Measurements Using the E6474A Wireless Network Optimization Platform
 Application Note Spectrum and Power Measurements Using the E6474A Wireless Network Optimization Platform By: Richard Komar Introduction With the rapid development of wireless technologies, it has become
How to Use Log & Event Management For Fault Diagnosis and Prevention. Greg Ferro Author and Blogger. whitepaper
 How to Use Log & Event Management For Fault Diagnosis and Prevention Greg Ferro Author and Blogger How to Use Log & Event Management For Fault Diagnosis and Prevention What s the process of diagnosing
Nuclear Science and Technology Division (94) Multigroup Cross Section and Cross Section Covariance Data Visualization with Javapeño
 Multigroup Cross Section and Cross Section Covariance Data Visualization with Javapeño") June 21, 2006 Summary Nuclear Science and Technology Division (94) Multigroup Cross Section and Cross Section Covariance Data Visualization with Javapeño Aaron M. Fleckenstein Oak Ridge Institute for Science
June 21, 2006 Summary Nuclear Science and Technology Division (94) Multigroup Cross Section and Cross Section Covariance Data Visualization with Javapeño Aaron M. Fleckenstein Oak Ridge Institute for Science
imc FAMOS 6.3 visualization signal analysis data processing test reporting Comprehensive data analysis and documentation imc productive testing
 imc FAMOS 6.3 visualization signal analysis data processing test reporting Comprehensive data analysis and documentation imc productive testing www.imcfamos.com imc FAMOS at a glance Four editions to Optimize
Annex: VISIR Remote Laboratory
 Open Learning Approach with Remote Experiments 518987-LLP-1-2011-1-ES-KA3-KA3MP Multilateral Projects UNIVERSITY OF DEUSTO Annex: VISIR Remote Laboratory OLAREX project report Olga Dziabenko, Unai Hernandez
User guide TSL2771 EVM / TMD2771 EVM. TSL2771/TMD2771 Light-to-Digital Proximity Detector/Ambient Light Sensor
 User guide TSL2771 EVM / TMD2771 EVM TSL2771/TMD2771 Light-to-Digital Proximity Detector/Ambient Light Sensor Content 1 Establishing basic functionality... 4 2 Txx2771 EVM graphical user interface (GUI)...
Machinery condition monitoring software
 VIBex Machinery condition monitoring software Optimize productivity of your facilities VIBex is a state-of-the-art system dedicated to online vibration-based condition monitoring and diagnostics of rotating
telemetry Rene A.J. Chave, David D. Lemon, Jan Buermans ASL Environmental Sciences Inc. Victoria BC Canada rchave@aslenv.com I.
 Near real-time transmission of reduced data from a moored multi-frequency sonar by low bandwidth telemetry Rene A.J. Chave, David D. Lemon, Jan Buermans ASL Environmental Sciences Inc. Victoria BC Canada
Data Mining: Exploring Data. Lecture Notes for Chapter 3. Slides by Tan, Steinbach, Kumar adapted by Michael Hahsler
 Data Mining: Exploring Data Lecture Notes for Chapter 3 Slides by Tan, Steinbach, Kumar adapted by Michael Hahsler Topics Exploratory Data Analysis Summary Statistics Visualization What is data exploration?
Final Software Tools and Services for Traders
 Final Software Tools and Services for Traders TPO and Volume Profile Chart for NinjaTrader Trial Period The software gives you a 7-day free evaluation period starting after loading and first running the
WHITEPAPER. Complying with the Red Flag Rules and FACT Act Address Discrepancy Rules
 WHITEPAPER Complying with the Red Flag Rules and FACT Act Address Discrepancy Rules May 2008 2 Table of Contents Introduction 3 ID Analytics for Compliance and the Red Flag Rules 4 Comparison with Alternative
Anomaly Detection in Predictive Maintenance
 Anomaly Detection in Predictive Maintenance Anomaly Detection with Time Series Analysis Phil Winters Iris Adae Rosaria Silipo Phil.Winters@knime.com Iris.Adae@uni-konstanz.de Rosaria.Silipo@knime.com Copyright
3D Data Visualization / Casey Reas
 3D Data Visualization / Casey Reas Large scale data visualization offers the ability to see many data points at once. By providing more of the raw data for the viewer to consume, visualization hopes to
Diagrams and Graphs of Statistical Data
 Diagrams and Graphs of Statistical Data One of the most effective and interesting alternative way in which a statistical data may be presented is through diagrams and graphs. There are several ways in
Adding Animation With Cinema 4D XL
 Step-by-Step Adding Animation With Cinema 4D XL This Step-by-Step Card covers the basics of using the animation features of Cinema 4D XL. Note: Before you start this Step-by-Step Card, you need to have
Correcting the Lateral Response Artifact in Radiochromic Film Images from Flatbed Scanners
 Correcting the Lateral Response Artifact in Radiochromic Film Images from Flatbed Scanners Background The lateral response artifact (LRA) in radiochromic film images from flatbed scanners was first pointed
Development of an Electrical Power Quality Monitor Based on a PC
 Renato Alves, D. Gonçalves, J. G. Pinto, José Batista, João L. Afonso, Development of an Electrical Power Quality Monitor Based on a PC, IECON 2009 - The 35th Annual Conference of the IEEE Industrial Electronics
How To Use A High Definition Oscilloscope
 PRELIMINARY High Definition Oscilloscopes HDO4000 and HDO6000 Key Features 12-bit ADC resolution, up to 15-bit with enhanced resolution 200 MHz, 350 MHz, 500 MHz, 1 GHz bandwidths Long Memory up to 250
We can display an object on a monitor screen in three different computer-model forms: Wireframe model Surface Model Solid model
 CHAPTER 4 CURVES 4.1 Introduction In order to understand the significance of curves, we should look into the types of model representations that are used in geometric modeling. Curves play a very significant
Cisco IPS Manager Express
 Cisco IPS Manager Express Product Overview Intrusion prevention systems (IPSs) are critical to protecting your network and assets against worms, Trojans, and other malicious attacks. Cisco IPS Manager
TDMS Test & Data Management Software
 Test & Data Management Software TDMS protective relays energy meters transducers power quality CT-VT-PT transformers ground grid circuit breakers batteries surge arresters The Integrated Testing Solution
Online Monitoring User Guide
 High Resolution Temperature Sensing Strip Online Monitoring User Guide 888.637.3282 www.nerdata.com Page 1 of 26 Contents The Aurora Online Monitoring System... 3 1. Creating an Account on the Aurora Online
What is the number one issue that Organizational Leaders are facing today?
 What is the number one issue that Organizational Leaders are facing today? Managing time and energy in the face of growing complexity...the sense that the world is moving faster -Chris Zook (Bain & Company
IntelliSpace PACS 4.4. Image Enabled EMR Workflow and Enterprise Overview. Learning Objectives
 IntelliSpace PACS 4.4 Image Enabled EMR Workflow and Enterprise Overview Learning Objectives Use the Cerner EMR to view images and reports via IntelliSpace PACS: Image Launch Workflow (SUBI Image Viewer)
SunGuide Software. Color Dynamic Message Sign Support Concept of Operations. Technical Memorandum. Version 1.0. February 24, 2012.
 Technical Memorandum SunGuide Software Color Dynamic Message Sign Support Concept of Operations Version 1.0 February 24, 2012 Prepared for: Florida Department of Transportation Intelligent Transportation
Technical Paper DISPLAY PROFILING SOLUTIONS
 Technical Paper DISPLAY PROFILING SOLUTIONS A REPORT ON 3D LUT CREATION By Joel Barsotti and Tom Schulte A number of display profiling solutions have been developed to correct image rendering errors in
Vision based Vehicle Tracking using a high angle camera
 Vision based Vehicle Tracking using a high angle camera Raúl Ignacio Ramos García Dule Shu gramos@clemson.edu dshu@clemson.edu Abstract A vehicle tracking and grouping algorithm is presented in this work
hp ProLiant network adapter teaming
 hp networking june 2003 hp ProLiant network adapter teaming technical white paper table of contents introduction 2 executive summary 2 overview of network addressing 2 layer 2 vs. layer 3 addressing 2
Compensation Basics - Bagwell. Compensation Basics. C. Bruce Bagwell MD, Ph.D. Verity Software House, Inc.
 Compensation Basics C. Bruce Bagwell MD, Ph.D. Verity Software House, Inc. 2003 1 Intrinsic or Autofluorescence p2 ac 1,2 c 1 ac 1,1 p1 In order to describe how the general process of signal cross-over
The Effect of Network Cabling on Bit Error Rate Performance. By Paul Kish NORDX/CDT
 The Effect of Network Cabling on Bit Error Rate Performance By Paul Kish NORDX/CDT Table of Contents Introduction... 2 Probability of Causing Errors... 3 Noise Sources Contributing to Errors... 4 Bit Error
Product Characteristics Page 2. Management & Administration Page 2. Real-Time Detections & Alerts Page 4. Video Search Page 6
 Data Sheet savvi Version 5.3 savvi TM is a unified video analytics software solution that offers a wide variety of analytics functionalities through a single, easy to use platform that integrates with
Kepware Technologies Optimizing KEPServerEX V5 Projects
 Kepware Technologies Optimizing KEPServerEX V5 Projects September, 2010 Ref. 50.16 Kepware Technologies Table of Contents 1. Overview... 1 2. Factors that Affect Communication Speed... 1 2.1 Defining Bandwidth...
Review Article Analytical Review of Data Visualization Methods in Application to Big Data
 Electrical and Computer Engineering Volume 2013, Article ID 969458, 7 pages http://dx.doi.org/10.1155/2013/969458 Review Article Analytical Review of Data Visualization Methods in Application to Big Data
Efficiently Managing Firewall Conflicting Policies
 Efficiently Managing Firewall Conflicting Policies 1 K.Raghavendra swamy, 2 B.Prashant 1 Final M Tech Student, 2 Associate professor, Dept of Computer Science and Engineering 12, Eluru College of Engineeering
Data Analysis Methods: Net Station 4.1 By Peter Molfese
 Data Analysis Methods: Net Station 4.1 By Peter Molfese Preparing Data for Statistics (preprocessing): 1. Rename your files to correct any typos or formatting issues. a. The General format for naming files
Visualization of 2D Domains
 Visualization of 2D Domains This part of the visualization package is intended to supply a simple graphical interface for 2- dimensional finite element data structures. Furthermore, it is used as the low
Raven Exhibit Software
 Raven Exhibit Software Version 1.4 Cornell Lab of Ornithology Developed by the Bioacoustics Research Program of the Cornell Lab of Ornithology for the Visitors Center of the Imogene Powers Johnson Center
REQUIREMENTS FOR AUTOMATED FAULT AND DISTURBANCE DATA ANALYSIS
 REQUIREMENTS FOR AUTOMATED FAULT AND DISTURBANCE DATA ANALYSIS Mladen Kezunovic *, Texas A&M University Tomo Popovic, Test Laboratories International, Inc. Donald R. Sevcik, CenterPoint Energy Aniruddha
Case Study: Real-Time Video Quality Monitoring Explored
 1566 La Pradera Dr Campbell, CA 95008 www.videoclarity.com 408-379-6952 Case Study: Real-Time Video Quality Monitoring Explored Bill Reckwerdt, CTO Video Clarity, Inc. Version 1.0 A Video Clarity Case
Licenses of savic-net for Integrated Building Management System for FDA Title 21 CFR Part 11 Compliance
 Specifications Licenses of savic-net for Integrated Building Management System for FDA Title CFR Part Compliance General The savic-net for Integrated Building Management System (hereinafter referred to
AKCess Pro Server Management Software
 Management Software v.100.00x takes the best from IP Video Monitoring Software and is the first to combine it with Environmental / Security Sensor and Access Control equipment in one centralized management
Developing a Utility/Customer Partnership To Improve Power Quality and Performance
 Developing a Utility/Customer Partnership To Improve Power Quality and Performance Mark McGranaghan Electrotek Concepts Knoxville, TN Abstract Many industrial and commercial electric customers now require
o Text-to-Speech and Text-to-Speech Tracking Enhanced Accessibility Mode) o Toolbar Buttons
 o Toolbar Buttons") Ohio s State Tests English Language Arts and Mathematics Sample Items Science and Social Studies Practice Tests and Released Items Guidance Document Updated Dec. 28, 2015 This document covers the following
Ohio s State Tests English Language Arts and Mathematics Sample Items Science and Social Studies Practice Tests and Released Items Guidance Document Updated Dec. 28, 2015 This document covers the following
Why use ColorGauge Micro Analyzer with the Micro and Nano Targets?
 Image Science Associates introduces a new system to analyze images captured with our 30 patch Micro and Nano targets. Designed for customers who require consistent image quality, the ColorGauge Micro Analyzer
Get The Picture: Visualizing Financial Data part 1
 Get The Picture: Visualizing Financial Data part 1 by Jeremy Walton Turning numbers into pictures is usually the easiest way of finding out what they mean. We're all familiar with the display of for example
ADINSTRUMENTS. making science easier. LabChart 7. Student Quick Reference Guide
 ADINSTRUMENTS making science easier LabChart 7 Student Quick Reference Guide How to use this guide The LabChart Student Quick Reference Guide is a resource for users of PowerLab systems in the classroom
Real-time Power Analytics Software Increasing Production Availability in Offshore Platforms
 Real-time Power Analytics Software Increasing Production Availability in Offshore Platforms Overview Business Situation The reliability and availability of electrical power generation and distribution
SAS VISUAL ANALYTICS AN OVERVIEW OF POWERFUL DISCOVERY, ANALYSIS AND REPORTING
 SAS VISUAL ANALYTICS AN OVERVIEW OF POWERFUL DISCOVERY, ANALYSIS AND REPORTING WELCOME TO SAS VISUAL ANALYTICS SAS Visual Analytics is a high-performance, in-memory solution for exploring massive amounts
Auto-Tuning Using Fourier Coefficients
 Auto-Tuning Using Fourier Coefficients Math 56 Tom Whalen May 20, 2013 The Fourier transform is an integral part of signal processing of any kind. To be able to analyze an input signal as a superposition
APRSstat An APRS Network Analysis Tool
 APRSstat An APRS Network Analysis Tool Richard Parry, P.E., W9IF rparry@qualcomm.com http://people.qualcomm.com/rparry ABSTRACT APRSstat monitors network traffic by connecting to an APRS telnet server
Challenge 10 - Attack Visualization The Honeynet Project / Forensic Challenge 2011 / 2011-12-18
 Challenge 10 - Attack Visualization The Honeynet Project / Forensic Challenge 2011 / 2011-12-18 Fabian Fischer Data Analysis and Visualization Group University of Konstanz Data Preprocessing with & I wanted
Network Monitoring. RMON-Based vs. Localized Analysis. White paper. w w w. n i k s u n. c o m
 Network Monitoring RMON-Based vs. Localized Analysis White paper w w w. n i k s u n. c o m Copyrights and Trademarks NetVCR and NIKSUN are registered trademarks of NIKSUN, Inc. NetReporter, NetDetector,
Power Quality Centre VOLTAGE FLUCTUATIONS IN THE ELECTRIC SUPPLY SYSTEM. Technical Note No. 7 August 2003
 Technical Note No. 7 August 2003 Power Quality Centre VOLTAGE FLUCTUATIONS IN THE ELECTRIC SUPPLY SYSTEM This Technical Note discusses voltage fluctuations, their causes and adverse effects, what levels
T O B C A T C A S E G E O V I S A T DETECTIE E N B L U R R I N G V A N P E R S O N E N IN P A N O R A MISCHE BEELDEN
 T O B C A T C A S E G E O V I S A T DETECTIE E N B L U R R I N G V A N P E R S O N E N IN P A N O R A MISCHE BEELDEN Goal is to process 360 degree images and detect two object categories 1. Pedestrians,
Visualizing Data from Government Census and Surveys: Plans for the Future
 Censuses and Surveys of Governments: A Workshop on the Research and Methodology behind the Estimates Visualizing Data from Government Census and Surveys: Plans for the Future Kerstin Edwards March 15,
Application Note #49 RF Amplifier Output Voltage, Current, Power, and Impedance Relationship
 Application Note #49 RF Amplifier Output Voltage, Current, Power, and Impedance Relationship By: Jason Smith; Manager Applications Engineer and Pat Malloy; Sr. Applications Engineer How much output voltage,
Analyses: Statistical Measures
 Application Note 129 APPLICATION NOTE Heart Rate Variability 42 Aero Camino, Goleta, CA 93117 Tel (805) 685-0066 Fax (805) 685-0067 info@biopac.com www.biopac.com 05.22.14 Analyses: Statistical Measures
A Conceptual Approach to Data Visualization for User Interface Design of Smart Grid Operation Tools
 A Conceptual Approach to Data Visualization for User Interface Design of Smart Grid Operation Tools Dong-Joo Kang and Sunju Park Yonsei University unlimit0909@hotmail.com, boxenju@yonsei.ac.kr Abstract