Output Area Classification in Hampshire Introduction and Profile
|
|
|
- Claude Little
- 10 years ago
- Views:
Transcription
1 Output Area Classification in Hampshire Introduction and Profile The Output Area classification (OAC) distills key results from the 2001 Census for the whole of the UK at a fine grain to indicate the character of local areas. It was created in a collaboration between the Office for National Statistics (ONS) and the University of Leeds using the same well established methods as the related classifications of local authorities and wards. Like those it is freely available from ONS and other sources for all to use, and complements commercially available classifications. Among the wide ranging applications for OAC are the profiling of populations, structuring other data, and the targeting of resources. (Alexander Singleton, OAC User Group). Content Page Part 1: Overview of OAC...2 Part 2: Supergroup Description and Hampshire Profile 4 Part 3: OAC Online Tool Guide.14 Part 4: OAC and British Population Survey...15 Part 5: OAC and Household Spending...19 Part 6: OAC and Wealth and Assets Survey...23 Appendix.32 1

2 Part 1: Overview of OAC The Output Area Classification (OAC) was designed to describe neighbourhoods by providing summary characteristics about those people living within those neighbourhoods. OAC consists of a number of hierarchical typologies from broad to more detailed descriptions, from the top level seven Supergroups, down to 21 Groups and lastly 52 Supergroups (Table 1). The OAC spatial unit is the Output Area (OA) developed for the 2001 Census as an method to derive populations quite tightly distributed around a population of 125 households. In that respect the OAC covers a larger area than many of the postcode based commercial models, such as Mosaic or Acorn. Nonetheless, the OA is good enough to provide a broad description of an area. For a more detailed account of OAC, Dan Vickers and Phil Rees 1 provide an in-depth description of how the UK National Statistics Output Area Classification was built. However, in essence an area classification looks at spatial patterns resulting from a cluster analysis. This is a statistical methodology that brings together a range of variables e.g. age, social class, employment status, ethnicity etc. to determine measures of association between them. The cluster analysis looks for similarities and dissimilarities between the variables to derive a number of cluster groups; in effect a form of data reduction. The choice and number of variables used are important factors any cluster process and whether the model is for a specific or general purpose. The OAC is a general purpose model and as such is based on a wide range of variables. The final model was based on 41 variables from the 2001 Census, under five broad headings: Demographic (age, ethnicity, population density) Household composition (marital status, children etc) Housing (tenure and type) Socio-economic (HE qualifications, car ownership, health etc) Employment (unemployment, full-time/part-time, industry) A full list of variables used in the cluster model are listed in the Appendix. There are more census variables that might have been used, but highly correlated variables are excluded as they either cancel each other out or duplicate the same effects. 1 Vickers, D and Rees, P. (2007) Creating the UK National Statistics 2001 output area classification, Journal of Statistical Society A, 170, Part 2, pp , Royal Statistical Society 2

3 Table 1: OAC Typology Supergroup Group Subgroup 1 Blue collar communities 2. City living 3. Countryside 4. Prospering suburbs 5. Constrained by circumstances 6. Typical traits 7. Multicultural 1a Terraced blue collar 1b. Younger blue collar 1c. Older blue collar 2a. Transient communities 2b. Settle in the city 3a. Village life 3b. Agricultural 3c. Accessible countryside 4a. Prospering younger families 4b. Prospering older families 4c. Prosperous semis 4d. Thriving suburbs 5a. Senior communities 5b. Older workers 5c. Public housing 6a. Settled households 6b. Least divergent 6c. Young families in terraced housing 6d. Aspiring households 7a. Asian communities 7b. Afro-Caribbean communities 1a1 1a2 1a3 1b1 1b2 1c1 1c2 1c3 2a1 2a2 2b1 2b2 3a1 3a2 3b1 3b2 3c1 3c2 4a1 4a2 4b1 4b2 4b3 4b4 4c1 4c2 4c3 4d1 4d2 5a1 5a2 5b1 5b2 5b3 5c1 5c2 5c3 6a1 6a2 6b1 6b2 6b3 6c1 6c2 6d1 6d2 7a1 7a2 7a3 7b1 7b2 3

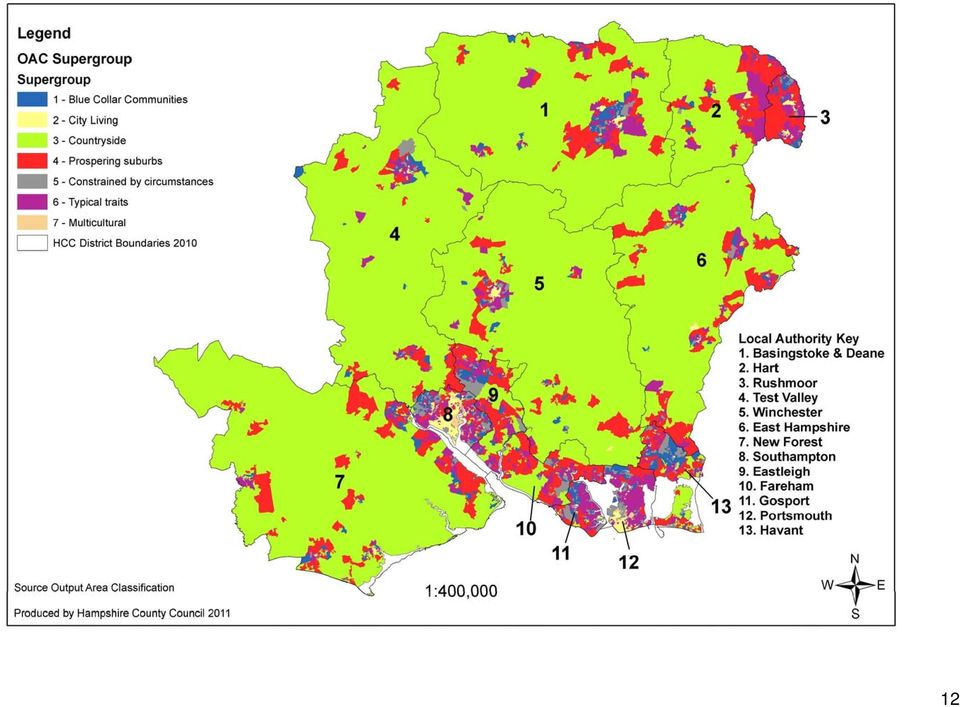
4 Part 2: Supergroup Description and Hampshire Profile OAC Supergroup Variables with proportions above the national average Variables with proportions below the national average 1. Blue collar communities 2. City living 3. Countryside 4. Prospering suburbs 5. Constrained by circumstances 6. Typical traits 7. Multicultural Age 5-14 Lone parent households Households with non-dependent children Terraced Housing Routine/Semi-routine Employment Mining/Quarrying/Construction employment Manufacturing Employment Indian, Pakistani and Bangladeshi Black Born Outside the UK Rent (Private) Flats HE Qualification Financial Intermediation Employment Retail Trade Employment Lone parent households Age Ages 0-4, 5-14, and 65+ Born Outside UK Single Parent Household Population Density Households with non-dependent children Single person household Rooms per household Rent (Private) Provide unpaid care Flats Economically inactive looking after family No Central Heating General employment HE Qualification Students Financial Intermediation Employment Ages and 65+ Indian, Pakistani and Bangladeshi Detached Housing Black Rooms per Household Population Density 2+ Car Households Single Person Household Work from Home Flats Provide Unpaid Care People Per Room Agricultural Employment Public Transport to Work Unemployment Age Indian, Pakistani and Bangladeshi Two adults no children Black Households with non-dependent children Divorced/Separated Detached housing Single Person Household Single Pensioner Households Rooms per household Renting Public and Private 2+ Car households Terraced Housing Provide unpaid care Flats No Central Heating LLTI Unemployment Age 65+ Two adults no children Divorced/separated Rent (Private) Single Pensioner Households Detached Housing Lone Parent Households Rooms per household Rent (Public) HE Qualifications Flats 2+ Car Households People per Room Work From Home Routine/Semi-routine employment LLTI Unemployment Work Part Time Age 65+ Terraced Housing Rent (Public) Ages 0-4 and 5-15 Ages and 65+ Indian, Pakistani and Bangladeshi Single Pensioner Households Black Two adults No Children Born Outside UK Economically inactive/ looking after family/home Population Density No Central Heating Source: Family Spending: 2010 edition. Adapted from Vickers, D., Rees,P. & Birkin,M (2005) Creating the national classification of Census output areas: data, methods and results 4
 Flats HE Qualification Financial Intermediation Employment Retail Trade Employment Lone parent households Age 25-44 Ages")
5 1. Blue Collar Communities Housing in these areas is more likely to be terraced housing rather than flats and residents mainly rent from the public sector (social housing). There is a high proportion of young people, especially children. This group tends to be lower qualified with fewer higher educational qualifications than the national average. A higher proportion work in manufacturing, retail or construction. Around one in four Output Areas in Havant are Blue Collar Communities. Basingstoke and Deane and Gosport both have above the UK average for this Supergroup reflecting manufacturing and semi-routine occupations in the districts. Table 2: Proportion of Blue Collar Communities Output Areas 1 - Blue Collar Communities United Kingdom Hampshire Economic Area Hampshire County Council area East Hampshire Basingstoke and Deane Eastleigh Fareham Gosport Hart Havant New Forest Rushmoor Test Valley Winchester Portsmouth Southampton Table 3: Census 2001 Population Proportion by Blue Collar Communities Hampshire Economic Area 1 - Blue Collar Communities Basingstoke and Deane Hampshire County Council area East Hampshire Eastleigh Fareham Gosport Hart Havant New Forest Rushmoor Test Valley Winchester Portsmouth Southampton 5

6 2. City Living These people are urban residents who are more likely to be single and living alone. They are more likely to be students, recent graduates or young professionals aged 24-44). They are more likely to hold higher educational qualifications, and are often students and or first generation immigrants the UK and students. Housing is often made up of flats and residents typically rent from the private sector. Naturally the two city authorities have the greatest concentration of City Living Supergroup residents. Across the rest of Hampshire these people will be located in town centre locations. Table 4: Proportion of City Living Output Areas 2 - City Living United Kingdom Hampshire Economic Area Basingstoke and Deane Hampshire County Council area East Hampshire Eastleigh Fareham Gosport Hart Havant New Forest Rushmoor Test Valley Winchester Portsmouth Southampton Table 5: Census 2001 Population Proportion by City Living 2 - City Living Hampshire Economic Area Basingstoke and Deane Hampshire County Council area East Hampshire 2.0 Eastleigh Fareham Gosport Hart Havant New Forest Rushmoor Test Valley Winchester Portsmouth Southampton 6

7 3. Countryside Rural and semi rural residents, many working from home. Employment in agricultural and fishing (coastal areas) is higher than the national average. Residents often live in detached houses, and in households with more than one car. Reflecting the rural landscape that defines much of Hampshire, it is unsurprising that seven out of 13 local authorities have above the national average for Countryside living. Almost one in three Winchester OA s fall in this Supergroup. Table 6: Proportion of Countryside Output Areas 3 - Countryside United Kingdom Hampshire Economic Area Basingstoke and Deane Hampshire County Council area East Hampshire Eastleigh 5.0 Fareham Gosport Hart Havant New Forest Rushmoor Test Valley Winchester Portsmouth Southampton Table 7: Census 2001 Population Proportion by Countryside Hampshire Economic Area 3 - Countryside Basingstoke and Deane Hampshire County Council area East Hampshire Eastleigh Fareham Gosport Hart Havant New Forest Rushmoor Test Valley Winchester Portsmouth Southampton 7

8 4. Prospering semis These are prosperous people who are have established themselves in the workplace. They often live in detached houses, most privately owned, with either older children who have left home. These households have access to more than one cars. Hampshire is generally recognised as a prosperous area, and this is borne out by ten out of 13 local authorities scoring above the national average for this Supergroup. Fareham, Hart and Eastleigh districts have particularly high proportions of Prospering semis, reflecting for example, well-to-do suburbs in Fareham/Locks Heath, Chandler s Ford and Fleet. The two cities and Gosport have a much lower representation in this Supergroup. Table 8: Proportion of Prospering semis Output Areas 4 - Prospering suburbs United Kingdom Hampshire Economic Area Hampshire County Council area Basingstoke and Deane East Hampshire Eastleigh Fareham Gosport Hart Havant New Forest Rushmoor Test Valley Winchester Portsmouth Southampton Table 9: Census 2001 Population Proportion by Prospering semis 4 - Prospering suburbs Hampshire Economic Area Hampshire County Council area Basingstoke and Deane East Hampshire Eastleigh Fareham Gosport Hart Havant New Forest Rushmoor Test Valley Winchester Portsmouth Southampton 8

9 5. Constrained by circumstances Residents in this group are more likely to be marginalised or on welfare benefits. These people typically live in social housing, mostly flats. They likely to few qualifications. Many will be older workers or pensioners or those on benefits. While Hampshire is a prosperous there are areas more constrained by circumstances. Five out of 13 local authorities have above the national average for this Supergroup, notably in the two cities, Gosport and Havant, and to a lesser extent in Rushmoor. However, both Havant and Rushmoor contain sizeable proportions of prosperous and constrained areas, often in close proximity to neighbourhoods with socio-economic problems. Table 10: Proportion of Constrained by circumstances Output Areas 5 - Constrained by circumstances United Kingdom Hampshire Economic Area Hampshire County Council area Basingstoke and Deane East Hampshire Eastleigh Fareham Gosport Hart Havant New Forest Rushmoor Test Valley Winchester Portsmouth Southampton Table 11: Census 2001 Population Proportion by Constrained by circumstances 5 - Constrained by circumstances Hampshire Economic Area Hampshire County Council area Basingstoke and Deane East Hampshire Eastleigh Fareham Gosport Hart Havant New Forest Rushmoor Test Valley Winchester Portsmouth Southampton 9

10 6. Typical traits This is your average person, likely to own a home and come from a mix of households. They are more likely to be younger families and aspiring households, younger less established versions of Prospering semis. They don t work in any particular industry. Portsmouth and Gosport have notably higher proportions of OA s with Typical traits, whereas other local authority profiles are broadly similar. To understand why would probably require drilling down to the Group or Subgroup, although higher proportions of terraced housing and young families are likely to play a significant part. Table 12: Proportion of Typical traits Output Areas 6 - Typical traits United Kingdom Hampshire Economic Area Hampshire County Council area Basingstoke and Deane East Hampshire Eastleigh Fareham Gosport Hart Havant New Forest Rushmoor Test Valley Winchester Portsmouth Southampton Table 13: Census 2001 Population Proportion by Typical traits 6 - Typical traits Hampshire Economic Area Hampshire County Council area Basingstoke and Deane East Hampshire Eastleigh Fareham Gosport Hart Havant New Forest Rushmoor Test Valley Winchester Portsmouth Southampton 10

11 7. Multicultural Residents are often non-white, mainly Asian and Black ethnic groups. Many are first time immigrants. Housing is a mix of social housing and private landlords, often in flats. This group is more reliant on public transport. Unsurprisingly, the two cities have the largest Multicultural representation, but this is well below the UK average. Eight local authorities have no Multicultural OA s, which only means there are no significant clusters rather than no multicultural areas. The OAC model would not have picked up on any significant immigration from the EU Accession states post Table 14: Proportion of Multicultural Output Areas 7 - Multicultural United Kingdom Hampshire Economic Area Hampshire County Council area Basingstoke and Deane East Hampshire Eas tleigh Fareham Gosport Hart Havant New Forest Rushmoor Test Valley Winchester Portsmouth Southampton Table 15: Census 2001 Population Proportion by Multicultural 7 - Multicultural Hampshire Economic Area Hampshire County Council area Basingstoke and Deane East Hampshire Eastleigh Fareham Gosport Hart Havant New Forest Rushmoor Test Valley Winchester Portsmouth Southampton 11

12 12
13 13

14 Part 3 OAC Online Tool Guide To understand OAC and make full use of the classification tool there are additional free software for profiling and studies. These can be accessed from the OAC User Group webpage all software needs to be downloaded from this site. Alternatively, many of the documents and reports can be found on the shared I: Drive by navigating to I: Drive/shared/OAC Postcode Profiler (from OAC User Group website) The OAC classification has previously been disseminated by the ONS at the Output Area Level. For a lot of users this has been problematic given that address records typically consist of lists of unit postcodes. A recent development at the ONS has created an open licence version of the National Statistics Postcode Directory (NSPD), which usefully includes an OAC Code for each unit postcode in the UK. Researchers at University College London and University of Liverpool have created a free tool which uses this file and can read a CSV list of postcodes, and then append the corresponding OAC code for each of these addresses. Please note you will need access to a hard-drive to download this software. Grand Index British Population Survey (From OAC User Group website) The Grand Index (Excel file) is a simple spreadsheet of index scores for a series of variables cross tabulated with OAC Sub Groups, Groups and Super Groups. These index scores can be used to target specific OAC clusters in your profiling work. For example, you could ask which neighbourhoods in your local area are likely to contain users of social networking websites? HantsMap There are two layers (Shape) files currently for OAC. These have been built locally by combining ONS data with other surveys, notably the Wealth and Assets Survey and Family Spending Survey to provide additional variables. These are discussed in the next section. For further information on any of the above please contact Gareth Henry: [email protected],

15 Part 4: OAC and British Population Survey The British Population Survey (BPS) was launched in its current format in 2010, with geodemographic data added in June The BPS is a quota sample of 6-8,000 respondents per month (approx 80,000 per year), who are interviewed face-to-face to provide data about: family circumstances, household composition, economic situation, education and employment, access and use of the internet, ownership of consumer durables, newspaper readership The data is updated every month by personal face to face interviews, (over 80,000 individuals per year) and each wave is fully representative of the adult population for Great Britain and at the regional level. Older Data can be downloaded for free, or it is possible to subscribe to latest datasets released quarterly. Click here for further information So how is the BPS useful to OAC and local use? The BPS in collaboration with the OAC User Group have created a Grand Index, which takes the national survey data and links this to the geodemographic data. Using a segmentation index, the OAC Supergroup, Group and Subgroup mean averages against each variable can be compared to the national global average to derive further knowledge of likely behaviour or traits. Data Explorer This is an interactive database of national and regional data. You will need access to a harddrive to download the software required to run the free data explorer datasets, or more recent ones if you choose to subscribe. Grand Index The Grand Index is a simple spreadsheet of index scores for a series of variables cross tabulated by OAC Supergroups, Groups and Subgroups. These index scores can be used to target specific OAC clusters in your profiling work. The Grand Index also includes DVLA data on vehicles e.g. type of car etc, and when combined with the BPS the Grand Index has several hundred variables. An initial in-house study by HCC of BPS and Household Income gives just one example of how BPS might be used. Naturally, the data is indicative of the Group behaviour, not actual individuals. To provide a greater range of income the example used the Group classification rather than the Supergroup.. 15
 and each wave is fully representative of the adult population for Great Britain and at the regional level.")
16 Table 16: Grand Index Household Income Index Scores Select Variable: HOUSEHOLD INCOME :UNDER 4,499 1a: Terraced Blue Collar 1b: Younger Blue Collar 1c: Older Blue Collar Upper Index Lower Select Variable: HOUSEHOLD INCOME :75,000-99,999 1a: Terraced Blue Collar 1b: Younger Blue Collar 1c: Older Blue Collar Upper Index Lower Source: Grand Index (OAC) The variables used in the example are Household Income Under 4,499 and Household Income 75,000 to 99,999, although there are other income groups in between that would need to be looked at to get the Income band most closely associated with each Group. This data are presented as an Index value where 100 = the national (GB) average. This is derived by dividing the mean cluster value for a Group and the national mean value, and multiplying by 100. Scores over 100 suggest above average likelihood the Group exhibit that trait, and vice versa if the value were lower than 100. So a score of 120 more or less equates to that Group having a 20% higher likelihood of that behaviour than the national norm. Index scores of 200+ suggest very high probabilities, in effect twice as likely. Low scores of around 50 or less suggest that particular behaviour is unlikely to be exhibited by that Group. The Upper and Lower values are statistical measures of reliability known as confidence intervals, and this is included to help the user decide have much faith to put in the estimate or Index value. There is a lower and upper range, and the larger that range the less reliable the data. In the example the Index value of Terraced Blue Collar for Household Income Under 4,499 could be as high as 120 (Upper) or as low as 103 (Lower). As the Lower Index value is still above 100 this Group is more likely than the average to be in this income band, but it is not a strong association given the possible proximity to 100. However, there is a much stronger likelihood from the other variable that Terraced Blue Collar types will not have a Household Income between 75,000 and 99,999 given the scores are well below 100. To determine the most likely income group will require looking at all the income bands to find the highest index score. The Household Income category consists of several variables and will take longer to pull out the information needed, whereas categories will have fewer variables. It is also worth looking at how the variables lend themselves to Index scores to derive character traits and some common sense needs to be applied. Taking the Income example further, you might want to be less specific given the data is based on a national survey. In this case rather than have all the income bands you might want to split income bands into five indicative groups: 16
 average.")
17 (5) Index scores above 130 = well off (in effect a 30% high than national concentration) (4) Index scores = Good income (3) Index scores = Average income (there is a confidence interval around the Index score so 10 points each side allows for this) (2) Index scores = Low income (1) Index scores less than 70 = Very low income To map this you would need to attribute the most probable income band to each Group as in Table 17. Table 17: OAC Groups and most likely Household Income Bands 1a: Terraced Blue Collar 13,500-17,500 1b: Younger Blue Collar 6,500-13,500 1c: Older Blue Collar 9,500-11,500 2a: Transient Communities 75,000+ under 4,499 extremes 2b: Settled in the City under 4,499 extremes 3a: Village Life 75,000+ 3b: Agricultural 15,500-25,000 3c: Accessible Countryside 40,000+ 4a: Prospering Younger Families 40,000+ 4b: Prospering Older Families 75,000+ 4c: Prospering Semis 30,000-49,999 4d: Thriving Suburbs a: Senior Communities Under 7,500 11,500-17,499 Mostly lower 5b: Older Workers Under 11,500 5c: Public Housing Under 11,500 6a: Settled Households 40,000-74,999 6b: Least Divergent 13,500-15,499 6c: Young Families in Terraced Homes 4,500-13,499 6d: Aspiring Households 50,000+ 7a: Asian Communities Under 6,499 7b: Afro-Caribbean Communities Under 6,499 Some Groups had extremes values at each end of the income spectrum, such as Transient Communities or Settled in the City. However, only one income code can be applied to an Output Area, so in this case the data needed to be compared to the 2004 Output Area deprivation data and some local knowledge, to determine if the area was more likely to be high or low income households. The important point to remember is that these are the most likely income bands, not actual income, and that not everyone in the Output Area will necessarily be in that income band. So if you re targeting the well off, the OAC will indicate the most likely locations where these people will live, but you will naturally miss others you wanted to target, and likewise capture people you weren t interested in. OAC should be used in this context as an indicative tool that can focus your area of interest. The best way to interpret OAC is spatially on a map. The example overleaf takes the household income data 17

18 to show Household Income distributions. This data could be linked to HCC admin or other data to target resources. Since the example below was produced, a more reliable survey on wealth was produced using the Wealth and Assets Survey. HCC does have access to Mosaic, so in reality that geodemographic tool is likely to be used most often, especially in Customer Insight. However, OAC does not have any licence restrictions regarding access or sharing with non-hcc partners or the public. 18

19 Part 5: OAC and Household Spending The OAC data comes from a report on the 2009 Living Costs and Food Survey, published by the Office for National Statistics in 2010 a copy can be found on the I: Drive/shared/OAC. The part specific to OAC is in Chapter 5 (pp ). The aim of the article was to provide an overview that highlights key findings from the 2009 Living Costs and Food Survey (LCF) by OAC but not a comprehensive analysis of income and expenditure. The key findings from the report found: Supergroups with the highest expenditure are Supergroups 2 (city living) and 4 (prospering suburbs), spending an average of and per week, respectively, followed by Supergroup 3 (countryside) with expenditure of Supergroup 5 (constrained by circumstances) showed the lowest expenditure at , followed by Supergroup 1 (blue collar communities). The pattern of total expenditures for 2009 is similar to Since 2007 Supergroup 2 (city living) total average weekly household expenditure has gradually risen to exhibit the largest expenditure of all OAC Supergroups. Supergroup 5 (constrained by circumstances) remaining consistently the lowest. The differences in total expenditure between Supergroups can be considered in more detail by COICOP categories (Classification of Individual Consumption by Purpose): High expenditure by Supergroup 2, city living, was partially attributable to expenditure on housing, fuel and power ( 95.60), which was higher than for any other group. Expenditure on housing fuel and power showed high variability between Supergroups; after city living the next highest expenditure in this category was by Supergroup 7 multicultural ( 77.00). All other Supergroups spent considerably less, with Supergroup 1 (blue collar communities) spending the least at per week. Transport expenditure was highest for Supergroup 4 prospering suburbs ( 77.90). and Supergroup 3 countryside ( 72.20), and lowest for Supergroup 5 constrained by circumstances ( 32.70). Spending on restaurants and hotels was almost three times as much in the highestspending category, city living ( 62.20) than the lowest, constrained by circumstances ( 22.80). Average weekly household expenditure for alcoholic drinks, tobacco and narcotics, health and communication showed minimal differences between OAC Supergroups. 19
 and 4 (prospering suburbs), spending an average of 457.90 and 454.")
20 Table:18 Average weekly household expenditure by OAC Supergroup, 2009 based on weighted data and including children's expenditure Blue collar Communities City living Countryside Prospering suburbs Contstrained by circumstances Super- Super- Super- Super- Super- Super- Super- All group group group group group group group house holds Typical traits Multicultural Weighted number of households (thousands) 4,330 1,600 3,330 5,720 2,980 5,240 2,790 25,980 Total number of households in sample , , ,830 Total number of persons in sample 2, ,060 3,350 1,340 2,620 1,240 13,740 Total number of adults in sample 1, ,670 2,660 1,060 2, ,650 Weighted average number of persons per household Commodity or service Average weekly household expenditure ( ) 1 Food & non-alcoholic drinks Alcoholic drinks, tobacco & narcotics Clothing & footwear Housing (net) 1, fuel & power Household goods & services Health Transport Communication Recreation & culture Education Restaurants & hotels Miscellaneous goods & services All expenditure groups Excluding mortgage interest payments, council tax and Northern Ireland rates Source: Family Spending: 2010 edition (Table 5.4, p109) ONS, Family Spending 2009, Crown copyright

21 Table 19: Average weekly household expenditure by OAC Supergroup, 2009 based on weighted data Blue collar Communities City living Countryside Prospering suburbs Contstrained by circumstances Super- Super- Super- Super- Super- Super- Super- All group group group group group group group house holds Typical traits Multicultural Weighted number of households (thousands) 4,330 1,600 3,330 5,720 2,980 5,240 2,790 25,980 Total number of households in sample 1, , , ,830 Total number of persons in sample 2, ,060 3,350 1,340 2,620 1,240 13,740 Total number of adults in sample 1, ,670 2,660 1,060 2, ,650 Weighted average number of persons per household Gross normal weekly household income Source: Family Spending: 2010 edition (Table 5.6, p112) ONS, Family Spending 2009, Crown copyright 2010 The average weekly expenditure values for Supergroups have been matched to the Hampshire OAC database and georeferenced to create a Shapefile. Please note that the expenditure values are based on a national survey data and should be interpreted as indicative of likely expenditure for that Supergroup. Actual expenditure locally in Hampshire may vary so please use with care when quoting the amounts. 21
22 Table 20: Average weekly household expenditure by OAC Group, 2009 Terraced blue collar Younger blue collar Older blue collar Transient communities Settled in the city Village life Agricultural Accessible countryside Propsering younger families Prospering older families Prospering semis Thriving suburbs OAC OAC OAC OAC OAC OAC OAC OAC OAC OAC OAC OAC OAC OAC OAC OAC OAC OAC OAC OAC OAC All group group group group group group group group group group group group group group group group group group group group group house- 1A 1B 1C 2A 2B 3A 3B 3C 4A 4B 4C 4D 5A 5B 5C 6A 6B 6C 6D 7A 7B holds Senior communities Older workers Public housing Settled households Least divergent Young families in terraced homes Aspiring households Asian communities Afro-Caribbean communities Weighted number of households (thousands) 1,230 1,580 1, ,030 1,230 1,010 1,080 1,230 1,470 1,910 1, , ,480 1,390 1,340 1,030 1,640 1,140 25,980 Total number of households in sample ,830 Total number of persons in sample , ,740 Total number of adults in sample ,650 Weighted average number of persons per household Commodity or service Average weekly household expenditure ( ) Average weekly household expenditure ( ) 1 Food & non-alcoholic drinks Alcoholic drinks, tobacco & narcotics Clothing & footwear Housing (net) 1, fuel & power Household goods & services Health Transport Communication Recreation & culture Education Restaurants & hotels Miscellaneous goods & services All expenditure groups Excluding mortgage interest payments, council tax and Northern Ireland rates ONS, Family Spending 2009, Crown copyright
23 Part 6: OAC and Wealth and Assets Survey The data for the Wealth and Assets Survey was taken from the Office for National Statistics publication; Economic & Labour Market Review Volume 5, Number 1, January The flowing text summarises the ELMR article and also extracts from the Wealth in Great Britain report. Copies of both can be found at I: Drive/shared/OAC. Wealth and Assets Survey results were first published in the report, Wealth in Great Britain in December 2009 with datasets released in March Building on from that initial study the ELMR paper sort to provide an understanding of the geographical distribution of wealth and its components using the OAC groupings. The Wealth and Assets Survey (WAS) began in 2006, gathering personal and household information from around 30,000 private households across Britain. Data was collected on property, physical, financial and pension wealth and indebtedness. The data in the study uses that first 2006 wave, even though later survey waves have been started. The overriding conclusion from the 'Wealth in Great Britain' report found the distribution of wealth, to be highly skewed across all categories i.e. property, financial, pension and physical. The mean total household wealth (including private pension wealth) was calculated to be 367,000, although 50 per cent of households had total wealth of less than 200,00. This compares to most wealthy 5 per cent held wealth in excess of 1.1 million. Because of this skewness, any one measure of central tendency (mean, median, mode) the distribution of the data must be borne in mind. When considering the geographical distribution of wealth you need to appreciate the underlying factors that are associated with wealth. Wealth varies as we get older, with savings and entitlements generally rising and peaking in the age-group, and falling thereafter as wealth is drawn upon or distributed. The report found this pattern being repeated at the Supergroup level. There are four categories of wealth loosely defined as: Mean property wealth = value of properties, and proportion of households owning property. Pension wealth = private pension schemes wealth from state pensions were excluded. Financial wealth = value of formal and informal financial assets held by adults, and of children s assets Physical wealth = contents of the main residence and any other property of a household, collectables and valuables (such as antiques, artworks or stamps), vehicles and personalised number plates. Key Findings from the ELMR paper Mean net Property wealth was highest in at Supergroup 3 (Countryside) 258,182 and 4 (Prospering semis) at 223,4435, while the lowest was in Supergroups 1 (Blue collar workers) at 63,037 and 5 (Constrained by circumstances) at 43,806. The mean Pension wealth was highest for Supergroup 3 (Countryside) at 224,241 and 4 (Prospering semis) at 237,058. The lowest mean pension wealth was in 23
24 Supergroups 1 (Blue collar workers), 5 (Constrained by circumstances) and 7 (Multicultural) ranging from 60,128 in 5 (Constrained by circumstances) to 70,443 in 7 (Multicultural) Mean Financial wealth was highest in Supergroups 3 (Countryside) and 4 (Prospering semis), which were 92 per cent and 71 per cent respectively above the mean for Great Britain. Supergroups 5 (Constrained by circumstances) and 1 (Blue collar workers) had the lowest mean financial wealth: 10,454 and 13,059 respectively, constituting only 27 per cent and 33 per cent of the overall mean. Mean Physical wealth was the highest in Supergroups 3 (Countryside) and 4 (Prospering semis), at 56,861 and 53,145 respectively. There was not a great difference in the physical wealth held by the other five Supergroups. The wealthiest OAC Supergroups were Supergroups 3 (Countryside) and 4 (Prospering semis),with mean Total wealth of 622,271 and 576,748 and median wealth of 386,242 and 420,839 respectively. The least wealthy Supergroups are 5 (Constrained by circumstances), 1 (Blue collar workers) and 7 (Multicultural) with mean wealth ranging from 135,526 to 212,694 and median wealth ranging from 44,379 to 104,400. The article also provides analysis by Group and Sub-group. The mean and median values for Supergroup, Group and Subgroup have been matched to the Hampshire OAC database and georeferenced to create a Shapefile. Please note that the expenditure values are based on a national survey data and should be interpreted as indicative of likely wealth and assets for that Supergroup, Group or Subgroup. Actual wealth locally in Hampshire may vary so please use with care when quoting the amounts. 24
25 Table 21: Wealth total and components, 2006/08 ( ) Property Wealth ( ) Pension Wealth ( ) Financial Wealth ( ) Total Wealth* ( ) Physical Wealth* Output Area Classification Weighted Households* Mean Median Mean Median Mean Median Weighted Households* Mean Median Mean Median 1 - Blue Collar Communities 3,951,681 63,037 34,000 70,443 9,754 13, ,181, , ,400 32,056 25,500 1a - Terraced blue collar 924,083 45, ,756 7,500 8, , ,175 70,750 30,492 25,000 1a1 362,111 32, ,405 2,000 4, , ,209 58,964 25,943 21,300 1a2 255,341 63,175 60,000 77,282 20,000 12,197 1, , , ,754 33,159 28,000 1a3 306,630 45, ,385 7,436 10, , ,734 55,553 33,290 25,000 1b - Younger blue collar 1,597,426 49,861 11,700 50,745 3,807 7, , ,975 73,737 30,034 25,000 1b1 934,339 49, ,701 2,770 7, , ,229 64,134 30,267 25,000 1b2 663,087 50,725 26,000 53,626 6,265 7, , ,999 84,468 29,715 25,000 1c - Older blue collar 1,430,172 89,104 74,000 99,350 22,186 22,059 3, , , ,882 35,377 28,750 1c1 582,016 91,255 72, ,152 19,329 26,997 2, , , ,085 36,586 30,000 1c2 285,913 76,640 62,000 83,099 20,035 11,796 2, , , ,220 32,874 27,000 1c3 562,243 93,215 84, ,748 26,246 22,166 3, , , ,396 35,423 29, City Living 1,585, ,420 51, ,620 15,250 48,561 6, , , ,375 36,015 25,000 2a - Transient communities 586, ,418 5, ,705 5,468 38,199 3, , ,666 88,335 30,306 17,000 2a1 254,648 89,588 7,000 72,381 5,000 18,534 2, , ,800 71,750 23,131 15,000 2a2 331, , ,200 6,500 53,284 7, , , ,696 35,213 23,000 2b - Settled in the city 999, ,321 85, ,819 22,000 54,645 7, , , ,000 39,220 25,500 2b1 377, ,580 81, ,744 26,596 46,897 5, , , ,690 35,470 25,000 2b2 621, ,081 90, ,788 20,456 59,348 9, , , ,667 41,644 26, Countryside 2,828, , , ,241 68,361 75,845 18,750 1,616, , ,242 56,861 44,700 3a - Village life 1,198, , , ,598 59,208 62,155 13, , , ,455 49,027 39,000 3a1 610, , , ,090 68,000 56,995 13, , , ,300 47,226 39,000 3a2 588, , , ,780 52,632 67,513 13, , , ,550 50,877 38,500 3b - Agricultural 659, , , ,845 60,351 83,796 23, , , ,764 63,133 47,300 3b1 335, , , ,783 69,712 81,992 24, , , ,887 67,965 49,500 3b2 323, , , ,451 49,639 85,668 22, , , ,742 58,163 43,000 3c - Accessible countryside 970, , , ,744 85,000 87,353 26, , , ,951 62,587 47,500 3c1 556, , , ,170 92,118 81,098 26, , , ,170 58,362 47,800 3c2 414, , , ,959 73,931 95,755 22, , , ,971 68,319 47, Prospering suburbs 5,287, , , , ,772 67,466 24,200 2,957, , ,839 53,145 44,500 4a - Prospering younger families 1,020, , , , ,829 51,553 18, , , ,883 49,874 42,250 4a1 366, , , , ,176 47,494 17, , , ,290 51,896 44,300 4a2 653, , , ,635 90,670 53,830 19, , , ,904 48,734 41,000 4b - Prospering older families 1,586, , , , ,169 85,644 37, , , ,636 58,084 49,000 4b1 444, , , ,021 97,541 66,452 27, , , ,515 49,734 46,000 4b2 427, , , , ,991 58,989 29, , , ,332 51,726 48,000 4b3 335, , , , , ,336 64, ,629 1,045, ,875 74,067 55,500 4b4 379, , , , ,451 93,308 43, , , ,920 60,893 48,000 4c - Prospering semis 1,561, , , ,307 78,369 41,216 14, , , ,407 46,301 38,000 4c1 512, , , ,382 70,027 36,411 10, , , ,780 42,432 38,000 4c2 680, , , ,243 82,569 45,922 16, , , ,183 48,596 37,000 4c3 369, , , ,356 86,890 39,211 18, , , ,779 47,389 41,000 4d - Thriving suburbs 1,117, , , , ,518 92,879 31, , , ,500 58,153 47,000 4d1 375, , , ,247 97, ,136 32, , , ,831 63,321 50,700 4d2 741, , , , ,214 84,140 30, , , ,458 55,664 45,000 25
26 Table 21 cont. ( ) Property Wealth ( ) Pension Wealth ( ) Financial Wealth ( ) Total Wealth* ( ) Physical Wealth* Output Area Classification Weighted Households* Mean Median Mean Median Mean Median Weighted Households* Mean Median Mean Median 5 - Constrained by circumstances 3,094,081 43, ,128 2,000 10, ,766, ,526 44,379 25,124 15,500 5a - Senior Communities 426,303 29, ,676 1,437 7, , ,469 34,830 19,747 15,000 5a1 270,767 15, , , ,413 68,755 25,624 18,710 15,000 5a2 155,536 53, ,817 10,023 15,571 2,500 85, ,817 55,127 21,645 15,000 5b - Older Workers 1,956,523 55, ,516 5,059 13, ,118, ,238 71,730 28,272 18,000 5b1 372,503 46, ,349 14,522 12,747 1, , ,152 79,642 28,150 18,800 5b2 444,939 90,092 40,000 84,688 12,000 25,401 2, , , ,194 38,128 25,000 5b3 677,576 46, ,352 2,290 7, , ,226 52,210 25,224 16,500 5b4 461,505 43, ,987 1,803 11, , ,816 49,456 23,184 15,000 5c - Public Housing 711,256 20, , , ,528 68,509 20,595 19,648 15,000 5c1 245,628 22, , , ,450 84,390 27,754 21,354 15,000 5c2 161,596 24, , , ,963 83,441 19,510 18,277 15,000 5c3 304,032 15, , , ,115 48,300 15,801 18,980 10, Typical traits 5,134, , , ,852 41,443 34,976 6,900 2,911, , ,770 39,037 31,900 6a - Settled households 1,431, , , ,041 50,392 30,083 7, , , ,129 40,710 35,000 6a1 889, , , ,151 48,375 30,532 7, , , ,907 40,874 35,300 6a2 541, , , ,860 53,063 29,345 7, , , ,970 40,418 35,000 6b - Least divergent 1,406, , , ,467 41,134 38,620 8, , , ,600 40,635 33,500 6b1 384, , , ,896 25,460 45,219 7, , , ,610 40,318 27,700 6b2 520, , , ,488 49,000 40,060 9, , , ,847 41,486 35,000 6b3 501, , , ,851 41,134 32,072 7, , , ,288 39,938 33,000 6c - Young families in terraced homes 1,231,481 86,344 70,000 91,395 17,650 16,395 2, , , ,927 29,516 25,000 6c1 590,784 89,429 76,500 99,053 19,686 16,122 2, , , ,587 30,427 25,000 6c2 640,698 83,499 57,000 84,334 15,847 16,647 1, , , ,248 28,739 25,000 6d - Aspiring households 1,064, , , ,004 69,050 58,226 16, , , ,975 46,317 37,000 6d1 541, , , ,782 69,314 55,302 14, , , ,356 44,634 35,500 6d2 523, , , ,300 67,695 61,246 18, , , ,568 47,984 38, Multicultural 2,702,036 94, , , ,574, ,694 71,513 26,772 16,300 7a - Asian communities 1,565, ,294 45,000 76,357 4,050 22,051 1, , , ,799 29,627 20,000 7a1 379,082 60,776 6,000 27, , , ,273 66,400 23,128 15,000 7a2 506,258 71,231 3,000 69,508 5,000 14, , ,387 82,050 25,979 19,000 7a3 679, , , ,744 18,000 36,369 4, , , ,769 36,070 25,000 7b - Afro-Caribbean communities 1,136,966 74, , , , ,967 33,000 22,931 15,000 7b1 681, , ,236 1,264 29,736 1, , ,731 61,660 25,885 15,000 7b2 455,035 33, , , ,378 86,159 17,186 18,271 12,500 Great Britain 24,583, ,214 95, ,890 29,145 39,432 5,140 13,901, , ,607 39,666 29,900 Source: ONS, Ellis Daniel and Geoff Bright (2011) Exploring the geographical distribution of wealth using the output area classification, Annex 1, Economic & Labour Market Review Jan Crown copyright
27 27
28 28
29 29
30 30
31 31
32 Appendix: Census variables used in OAC cluster analysis Variable Description Demographic V1 Age 0-4: percentage of resident population aged 0-4 years V2 Age 5-14 : percentage of resident population aged 5-14 years V3 Age 25-44: percentage of resident population aged years V4 Age 45-64: percentage of resident population aged years V5 Age 65+: percentage of resident population aged 65 or more years V6 Indian, Pakistani or Bangladeshi: percentage of people identifying as Indian, Pakistani or Bangladeshi V7 Black African, Black Caribbean or Other Black: percentage of people identifying as Black African, Black Caribbean or Other Black V8 Born outside UK: percentage of people not born in the UK V9 Population density: population density (number of people per hectare) Household composition V10 Separated/divorced: percentage of residents 16 years or older who are not living in a couple and are separated or divorced V11 Single person household (not pensioner): percentage of households with one person who is not a pensioner V12 Single pensioner household: percentage of households which are singlepensioner households V13 Lone parent household: percentage of households which are lone parent households with dependent children V14 Two adults no children: percentage of households which are cohabiting or married couple households with no children V15 Households with non-dependent children: percentage of households comprising one family and no others with non-dependent children living with their parents Housing V16 Rent (public): percentage of households that are public sector rented accommodation V17 Rent (private): percentage of households that are private or other rented accommodation V18 Terraced housing: percentage of all household spaces which are terraced V19 Detached housing: percentage of all household spaces which are detached V20 All Flats: percentage of all households which are flats V21 No central heating: percentage of occupied household spaces without central heating V22 Average home size: average house size (rooms per household) V23 People per room: average number of people per room Socio-economic V24 HE qualification: percentage of people aged between 16 and 74 years with a higher education qualification V25 Routine/semi-routine occupation: percentage of people aged years in employment working in routine or semi-routine occupations V26 V27 2+ car household: percentage of households with 2 or more cars Public transport to work: percentage of people aged years in employment who usually travel to work by public transport 32
33 V28 Work form home: percentage of people aged years in employment who work mainly form home V29 LLTI (SIR): percentage of people who reported suffering from a limiting long-term illness (standardized illness ration, standardized by age) V30 Provide unpaid care: percentage of people who provide care unpaid Employment V31 Students (fill-time): percentage of people who are aged years who are students V32 Unemployed: percentage of economically active people aged years who are unemployed V33 Working part-time: percentage of economically active people aged years who work part-time V34 Economically inactive looking after family: percentage of economically inactive people aged who are looking after the home V35 Agriculture/fishing employment: percentage of people aged years in employment working in agriculture and fishing V36 Mining/quarrying/construction employment: percentage of people aged years in employment working in Mining, Quarrying and Construction V37 Manufacturing employment: percentage of people aged years in employment working in Manufacturing V38 Hotel and Catering employment: percentage of people aged years in employment working in Hotel and Catering V39 Health and social work employment: percentage of people aged years in employment working in Health and social work V40 Financial intermediation employment: percentage of people aged years in employment working in Financial intermediation V41 Wholesale/retail trade employment: percentage of people aged years in employment working in Wholesale and retail 33
This briefing is divided into themes, where possible 2001 data is provided for comparison.
 Information Action 2011 Census Second Release December 2012 Consultation The Office for National Statistics (ONS) has now begun the Second Release of outputs from the 2011 Census at local authority level.
Chapter 3: Property Wealth, Wealth in Great Britain 2010-12
 Chapter 3: Property Wealth, Wealth in Great Britain 2010-12 Coverage: GB Date: 15 May 2014 Geographical Area: GB Theme: Economy Key Points Aggregate net property wealth for all private households in Great
Poverty among ethnic groups
 Poverty among ethnic groups how and why does it differ? Peter Kenway and Guy Palmer, New Policy Institute www.jrf.org.uk Contents Introduction and summary 3 1 Poverty rates by ethnic group 9 1 In low income
Ethnic Group Profile of Hampshire. 2011 Census. Published by Research and Intelligence (Autumn 2013) www.hants.gov.uk
 www.hants.gov.uk") Ethnic Group Profile of Hampshire 2011 Census Published by Research and Intelligence (Autumn 2013) 1 www.hants.gov.uk Contents 1. Introduction 2. Ethnic Group by District 3. Ethnic Group by Age and Sex
Ethnic Group Profile of Hampshire 2011 Census Published by Research and Intelligence (Autumn 2013) 1 www.hants.gov.uk Contents 1. Introduction 2. Ethnic Group by District 3. Ethnic Group by Age and Sex
Seaham Major Centre Area Profile
 Area Profile Crown Copyright. Durham County Council. LA 100019779. 2006 Corporate Research and Information, Durham County Council, County Hall, Durham, DH1 5UF. Tel: 0191 3834340 [email protected] June
Statistics about Bourne, South Kesteven. People Statistics. 32UG012 Bourne Parish is within South Kesteven LAD or UA. Resident Population and Age
 Statistics about Bourne, 32UG012 Bourne Parish is within LAD or UA People Statistics Resident Population and Age The resident population of Bourne as measured in the 2001 Census, was 11,933 of which 48.3
Statistics about Sleaford, North Kesteven. People Statistics. 32UE057 Sleaford Parish is within North Kesteven LAD or UA. Resident Population and Age
 Statistics about Sleaford, 32UE057 Sleaford Parish is within LAD or UA People Statistics Resident Population and Age The resident population of Sleaford as measured in the 2001 Census, was 14,494 of which
Neath Port Talbot County Borough Council. Neighbourhood Profile for Margam Ward
 Neath Port Talbot County Borough Council Neighbourhood Profile for Margam Ward 1 Introduction This profile covers the Margam ward and provides a general overview of the main characteristics of Margam.
Main Report: The Burden of Property Debt in Great Britain, 2006/08 & 2008/10
 Main Report: The Burden of Property Debt in Great Britain, 2006/08 & 2008/10 Coverage: England and Wales Date: 13 May 2013 Geographical Area: Region Theme: Economy Key Points This release focuses on the
Full report - Women in the labour market
 Full report - Women in the labour market Coverage: UK Date: 25 September 2013 Geographical Area: UK Theme: Labour Market Key points The key points are: Rising employment for women and falling employment
How has Hounslow s demographic profile changed? An analysis of the 2011 Census data based on releases available up to January 2013
 How has Hounslow s demographic profile changed? An analysis of the 2011 Census data based on releases available up to January 2013 Background Since 2001 Hounslow s population has grown by 19.6% from 212,341
Article: Main results from the Wealth and Assets Survey: July 2012 to June 2014
 Article: Main results from the Wealth and Assets Survey: July 2012 to June 2014 Coverage: GB Date: 18 December 2015 Geographical Area: Region Theme: Economy Main points In July 2012 to June 2014: aggregate
Population Size. 7.9% from a non-white ethnic group. Population: by ethnic group, April 2001
 Focus on Ethnicity and Identity paints a picture of the ethnic groups in the UK today. It includes information on their characteristics, lifestyles and experiences, placing particular emphasis on comparing
Analysis of Employee Contracts that do not Guarantee a Minimum Number of Hours
 Analysis of Employee Contracts that do not Guarantee a Minimum Number of Hours Coverage: GB Date: 30 April 2014 Geographical Area: GB Theme: Labour Market 1. Summary There is no legal definition of zero-hours
SELECTED POPULATION PROFILE IN THE UNITED STATES. 2013 American Community Survey 1-Year Estimates
 S0201 SELECTED POPULATION PROFILE IN THE UNITED STATES 2013 American Community Survey 1-Year Estimates Supporting documentation on code lists, subject definitions, data accuracy, and statistical testing
GOWER WARD PROFILE. Information, Research & GIS Team, City and County of Swansea, October 2015
 GOWER WARD PROFILE Information, Research & GIS Team, City and County of Swansea, October 2015 Population: 3,600 (source: mid-2013 estimates, rounded - Office for National Statistics / ONS) Councillors
Religious Populations
 Focus on Religion paints a picture of the different faith groups in the UK today. It looks separately at Great Britain and Northern Ireland. Information comparing and contrasting the characteristics of
Regional characteristics of foreignborn people living in the United Kingdom
 Regional characteristics of foreignborn people living in the United Kingdom By Alice Reid and Caroline Miller, Office for National Statistics Abstract This article examines the characteristics of foreign-born
Chapter 5: Financial Wealth, Wealth in Great Britain 2010-12
 Chapter 5: Financial Wealth, Wealth in Great Britain 201012 Coverage: GB Date: 15 May 2014 Geographical Area: Region Theme: Economy Key points Aggregate net financial wealth for all private households
TravelOAC: development of travel geodemographic classifications for England and Wales based on open data
 TravelOAC: development of travel geodemographic classifications for England and Wales based on open data Nick Bearman *1 and Alex D. Singleton 1 1 Department of Geography and Planning, School of Environmental
Chapter 1 Smoke alarms and fire safety measures in the home
 Chapter 1 Smoke alarms and fire safety measures in the home Smoke alarms and other fire safety equipment that are correctly installed and maintained, play a vital role in reducing fire deaths and injuries
Public and Private Sector Earnings - March 2014
 Public and Private Sector Earnings - March 2014 Coverage: UK Date: 10 March 2014 Geographical Area: Region Theme: Labour Market Theme: Government Key Points Average pay levels vary between the public and
Investigating the Accuracy of Predicted A Level Grades as part of 2009 UCAS Admission Process
 RESEARCH PAPER NUMBER 37 Investigating the Accuracy of Predicted A Level Grades as part of 2009 UCAS Admission Process JUNE 2011 Authors: Nick Everett and Joanna Papageorgiou, UCAS The views expressed
2. Incidence, prevalence and duration of breastfeeding
 2. Incidence, prevalence and duration of breastfeeding Key Findings Mothers in the UK are breastfeeding their babies for longer with one in three mothers still breastfeeding at six months in 2010 compared
Impact of the recession
 Regional Trends 43 21/11 Impact of the recession By Cecilia Campos, Alistair Dent, Robert Fry and Alice Reid, Office for National Statistics Abstract This report looks at the impact that the most recent
The relationship between mental wellbeing and financial management among older people
 The relationship between mental wellbeing and financial management among older people An analysis using the third wave of Understanding Society January 2014 www.pfrc.bris.ac.uk www.ilcuk.org.uk A working
Harmonised Index of Consumer Prices: update on methodological developments
 Harmonised Index of Consumer Prices: update on methodological developments Jim O Donoghue Office for National Statistics e-mail: [email protected] National Statistics customer enquiry line: +44 (0)845 601
Energy Use in Homes. A series of reports on domestic energy use in England. Fuel Consumption
 Energy Use in Homes A series of reports on domestic energy use in England Fuel Consumption Energy Use in Homes A series of reports on domestic energy use in England Fuel Consumption This is one of a series
Contents... 2. Executive Summary... 5. Key Findings... 5. Use of Credit... 5. Debt and savings... 6. Financial difficulty... 7. Background...
 CREDIT, DEBT AND FINANCIAL DIFFICULTY IN BRITAIN, A report using data from the YouGov DebtTrack survey JUNE 2013 Contents Contents... 2 Executive Summary... 5 Key Findings... 5 Use of Credit... 5 Debt
4. Work and retirement
 4. Work and retirement James Banks Institute for Fiscal Studies and University College London María Casanova Institute for Fiscal Studies and University College London Amongst other things, the analysis
E-Commerce and ICT Activity, 2012. 95% of businesses had broadband Internet and 82% had a website.
 Statistical Bulletin E-Commerce and ICT Activity, 2012 Coverage: UK Date: 04 December 2013 Geographical Area: UK Theme: Business and Energy Key points E-commerce sales represented 18% of business turnover
TRADE UNION MEMBERSHIP 2014. Statistical Bulletin JUNE 2015
 TRADE UNION MEMBERSHIP 2014 Statistical Bulletin JUNE 2015 Contents Contents... 2 Introduction... 3 Key findings... 5 1. Long Term Trends... 6 2.Private and Public Sectors. 12 3. Personal and job characteristics...
The Financial Services Trust Index: A Pilot Study. Christine T Ennew. Financial Services Research Forum. University of Nottingham
 The Financial Services Trust Index: A Pilot Study Christine T Ennew Harjit Sekhon Financial Services Research Forum University of Nottingham The Financial Services Trust Index: A Pilot Study Executive
ACORN Socio-Economic Classifications. Cumbria and Districts, 2016
 ACORN Socio-Economic Classifications Cumbria and Districts, 2016 Introduction to ACORN ACORN is a socio-economic profiling tool which has been developed by the company CACI Ltd and subscribed to by the
Demographic Analysis of the Salt River Pima-Maricopa Indian Community Using 2010 Census and 2010 American Community Survey Estimates
 Demographic Analysis of the Salt River Pima-Maricopa Indian Community Using 2010 Census and 2010 American Community Survey Estimates Completed for: Grants & Contract Office The Salt River Pima-Maricopa
Ethnicity and family
 Ethnicity and family Relationships within and between s: An analysis using the Labour Force Survey Lucinda Platt Institute for Social & Economic Research University of Essex Ethnicity and family Relationships
The Burden of Financial and Property Debt, Great Britain, 2010 to 2012
 The Burden of Financial and Property Debt, Great Britain, 2010 to 2012 Coverage: GB Date: 27 July 2015 Geographical Area: Region Theme: Economy Theme: People and Places Foreword Using the Wealth and Assets
Cheshire East Area Profile (spring 2015)
") Cheshire East Area Profile (spring 2015) Appendix 1 Introduction Cheshire East is the third biggest unitary authority in the North West and the thirteenth largest in the country. It therefore has a wide
Cheshire East Area Profile (spring 2015) Appendix 1 Introduction Cheshire East is the third biggest unitary authority in the North West and the thirteenth largest in the country. It therefore has a wide
Section 6: Existing Households in Housing Need
 Section 6: Existing Households in Housing Need Introduction 6.1 Understanding the term housing need is key to assessing the requirement for affordable housing. It is important that the difference between
Household Finance and Consumption Survey
 An Phríomh-Oifig Staidrimh Central Statistics Office Household Finance and Consumption Survey 2013 Published by the Stationery Office, Dublin, Ireland. Available from: Central Statistics Office, Information
Childcare and early years survey of parents 2014 to 2015
 Childcare and early years survey of parents 2014 to 2015 March 2016 Tom Huskinson, Sylvie Hobden, Dominic Oliver, Jennifer Keyes, Mandy Littlewood, Julia Pye, and Sarah Tipping Contents Executive Summary...
THE CAYMAN ISLANDS LABOUR FORCE SURVEY REPORT SPRING 2015
 THE CAYMAN ISLANDS LABOUR FORCE SURVEY REPORT SPRING 2015 Published September 2015 Economics and Statistics Office i CONTENTS SUMMARY TABLE 1. KEY LABOUR FORCE INDICATORS BY STATUS... 1 SUMMARY TABLE 2.
Bristol Housing Market in 2015 A Summary. In brief: Housing Stock
 Bristol Housing Market in 2015 A Summary In brief: Demand is up and there continues to be an undersupply of new homes, both for ownership and rent. There is evidence to suggest that, during the last year,
Published by the Stationery Office, Dublin, Ireland.
 An Phríomh-Oifig Staidrimh Central Statistics Office Published by the Stationery Office, Dublin, Ireland. Available from the: Central Statistics Office, Information Section, Skehard Road, Cork. Prn A12/0296
The UK Tourism Satellite Account (UK- TSA) for 2012. Tourism Direct Gross Value Added (GVA) was 57.3 billion in 2012.
 for 2012. Tourism Direct Gross Value Added (GVA) was 57.3 billion in 2012.") Statistical Bulletin The UK Tourism Satellite Account (UK- TSA) for 2012 Coverage: UK Date: 26 June 2015 Geographical Area: UK Theme: People and Places Theme: Economy Main Figures Tourism Direct Gross
Statistical Bulletin The UK Tourism Satellite Account (UK- TSA) for 2012 Coverage: UK Date: 26 June 2015 Geographical Area: UK Theme: People and Places Theme: Economy Main Figures Tourism Direct Gross
QuickStats About Auckland Region
 QuickStats About Population/ Dwellings Number of people counted Total population 1,303,068 people usually live in. This is an increase of 144,177 people, or 12.4 percent, since the 2001 Census. Its population
2011 UK Census Coverage Assessment and Adjustment Methodology. Owen Abbott, Office for National Statistics, UK 1
 Proceedings of Q2008 European Conference on Quality in Official Statistics 2011 UK Census Coverage Assessment and Adjustment Methodology Owen Abbott, Office for National Statistics, UK 1 1. Introduction
Profile of Black and Minority ethnic groups in the UK
 Profile of Black and Minority ethnic groups in the UK David Owen, University of Warwick Ethnic composition of the population in 2001 The 2001 Census of Population provides the most up-to-date and comprehensive
5 Advice and Legal Services in Oldham
 5 Advice and Legal Services in Oldham The metropolitan Borough of Oldham has a population of approximately 220,000, the majority of whom live in the urban area in the south west of the borough. The east
Who are the Other ethnic groups?
 Article Who are the Other ethnic groups? Social and Welfare David Gardener Helen Connolly October 2005 Crown copyright Office for National Statistics 1 Drummond Gate London SW1V 2QQ Tel: 020 7533 9233
Digital Hampshire A strategy for Hampshire County Council and its partners
 Digital Hampshire A strategy for Hampshire County Council and its partners Helping everyone in Hampshire to benefit from the digital age www.hants.gov.uk 2 CONTENTS Foreword 3 What is Digital Hampshire?
E-commerce and ICT Activity, 2013. While 22% of businesses generated e-commerce sales, 51% of businesses made e-commerce purchases in 2013.
 Statistical Bulletin E-commerce and ICT Activity, 2013 Coverage: UK Date: 28 November 2014 Geographical Area: UK Theme: Business and Energy Key Points E-commerce sales represented 20% of business turnover
Measuring National Well-being - Personal Finance, 2012
 Measuring National Well-being - Personal Finance, 2012 Author Name(s): Carla Seddon Office for National Statistics Abstract This article is published as part of the Office for National Statistics (ONS)
Beyond 2011: Population Coverage Survey Field Test 2013 December 2013
 Beyond 2011 Beyond 2011: Population Coverage Survey Field Test 2013 December 2013 Background The Beyond 2011 Programme in the Office for National Statistics (ONS) is currently reviewing options for taking
Just under a fifth of full time 16-18 year olds (19.4%) were aged 18 at the beginning of the 2012/13 academic year.
 were aged 18 at the beginning of the 2012/13 academic year.") Analysis of 18 Year in FE Colleges RCU ref. Analysis of 18 Year olds in FE Colleges 1. Introduction This report has been prepared by RCU to support the AoC s response to the recent proposal by EFA to cut
Analysis of 18 Year in FE Colleges RCU ref. Analysis of 18 Year olds in FE Colleges 1. Introduction This report has been prepared by RCU to support the AoC s response to the recent proposal by EFA to cut
Electoral Registration Analysis
 31 July 2013 Electoral Registration Analysis Analysis of factors driving electoral registration rates in local authorities in England and Wales This document is available in large print, audio and braille
Ireland and the EU 1973-2003 Economic and Social Change
 Ireland and the EU 1973-2003 Economic and Social Change Table 1 Population, 1971-2002 viii Table 2 Population of the provinces ix Table 3 Births, deaths and life expectancy ix Table 4 Numbers in education
Statistical appendix. A.1 Introduction
 A Statistical appendix A.1 Introduction This appendix contains contextual information to assist the interpretation of the performance indicators presented in the Report. The following four key factors
English Housing Survey Headline Report 2014-15
 English Housing Survey Headline Report 214-15 Contents Introduction and main findings Section 1: Households Section 2: Housing stock Technical notes and glossary Introduction and main findings 1. English
Survey of Family, Income and Employment Dynamics (Wave 2) September 2004
 September 2004") Embargoed until 10:45 am 04 November 2005 Survey of Family, Income and Employment Dynamics (Wave 2) September 2004 Highlights There were 578,600 people in a one parent with child(ren) family at some stage
Embargoed until 10:45 am 04 November 2005 Survey of Family, Income and Employment Dynamics (Wave 2) September 2004 Highlights There were 578,600 people in a one parent with child(ren) family at some stage
1960-61. United States
 61-61 United States By, the U.S. population had surpassed 179 million, a gain of 19.0 percent from. The median age had decreased to 29.5 (28.7 for men and.3 for women), the first decline since 1900. The
Social Grade A Classification Tool. Bite Sized Thought Piece
 Social Grade A Classification Tool Bite Sized Thought Piece 2009 There are several demographic classification systems used in market research. A well established system, as well as the most widely known
Estimating differences in public and private sector pay
 Estimating differences in public and private sector pay Andrew Damant and Jamie Jenkins, July 2011 Summary It is difficult to make comparisons of the two sectors because of differences in the types of
SOLIHULL PEOPLE AND PLACE
 2016 Solihull Metropolitan Borough Council Prepared by Solihull Observatory SOLIHULL PEOPLE AND PLACE Abstract People: An analysis of demographic and population data for Solihull, including a review of
Statistical Bulletin. Annual Survey of Hours and Earnings, 2014 Provisional Results. Key points
 Statistical Bulletin Annual Survey of Hours and Earnings, 2014 Provisional Results Coverage: UK Date: 19 November 2014 Geographical Areas: Country, European (NUTS), Local Authority and County, Parliamentary
Advice and legal services in the London Borough of Newham
 1 6 Advice and Legal Services in the London Borough of Newham The London Borough of Newham has a population of just over 200,000. According to the Department of the Environment s study of urban deprivation,
Domestic Energy Prices: Data sources and methodology
 Domestic Energy Prices: Data sources and methodology 1. Introduction 1.1 Background Domestic Energy Prices Statistics Domestic price statistics provide important information for monitoring the energy market.
Consumer needs not being met by UK grocery market A British Brands Group research publication
 Consumer needs not being met by UK grocery market A British Brands Group research publication INTRODUCTION The British Brands Group provides the voice for brand manufacturers in the UK. It is a membership
Appendix C. Logistic regression analysis
 Appendix C. Logistic regression analysis Summary Logistic regression analysis was undertaken in order to explore the factors associated with breastfeeding initiation and prevalence at two and six weeks.
2011 Census: Cultural diversity in Kent
 Business Intelligence Statistical Bulletin January 2013 2011 Census: Cultural diversity in Kent Related documents 2011 Census results 2011 Census release timetable Equality & diversity The Office for National
Maidstone is the largest district in Kent with a resident population of 155,143. This grew by 11.7% between 2001 and 2011.
 Census 2011 Briefing Ethnicity & National Identity The 1991 Census was the first census to include a question about ethnic background to monitor equal opportunities /anti-discrimination policies. Over
Application Form ONLY APPLICATIONS SUBMITTED ON THIS FORM WILL BE PROCESSED BY THE OFFICER
 Application Form ONLY APPLICATIONS SUBMITTED ON THIS FORM WILL BE PROCESSED BY THE OFFICER Applicant s details Loan Member Amount of loan Repayment Terms X w/f/m Cheque /Cash Loan Approved/Refused Payment
Mobile phone usage. Attitudes towards mobile phone functions including reception
 Attitudes towards mobile phone functions including reception Research Document Publication date: 23 January 13 Contents Section Page 1 Executive summary 1 2 About the research 3 3 Consumer experience
The Art of Customer Profiling. Why understanding audience is important and how to do it
 The Art of Customer Profiling Why understanding audience is important and how to do it The Art of Customer Profiling 2014 1. The importance of understanding your audience...3 CONTENTS 1.1 Why is it important
Changing Work in Later Life: A Study of Job Transitions Stephen McNair, Matt Flynn, Lynda Owen, Clare Humphreys, Steve Woodfield
 UniS Changing Work in Later Life: A Study of Job Transitions Stephen McNair, Matt Flynn, Lynda Owen, Clare Humphreys, Steve Woodfield Centre for Research into the Older Workforce Funded by Changing Work
Total 50,000 4,509,800 39,865,700 Male 25,000 2,244,900 19,851,500 Female 24,900 2,264,800 20,014,200. Blackpool South (numbers)
") Labour Market Profile - Parliamentary Constituency The profile brings together data from several sources. Details about these and related terminology are given in the definitions section. Resident Population
Labour Market Profile - Parliamentary Constituency The profile brings together data from several sources. Details about these and related terminology are given in the definitions section. Resident Population
Profile of the Contact Centre Sector Workforce
 Profile of the Contact Centre Sector Workforce Content Profile of the UK workforce Status of the workforce Gender Age Ethnicity Disability Salary Level About Us Introduction In December 2012 there were
Demographics of Atlanta, Georgia:
 Demographics of Atlanta, Georgia: A Visual Analysis of the 2000 and 2010 Census Data 36-315 Final Project Rachel Cohen, Kathryn McKeough, Minnar Xie & David Zimmerman Ethnicities of Atlanta Figure 1: From