Introduction to R. Guodong Li Department of Statistics & Actuarial Science, HKU
|
|
|
- Rosamond Elliott
- 7 years ago
- Views:
Transcription
1 Introduction to R Guodong Li Department of Statistics & Actuarial Science, HKU
2 Introduction to R S: an interactive environment for data analysis developed at Bell Laboratories since S2: RA Becker, JM Chambers, A Wilks S3: JM Chambers, TJ Hastie S4: JM Chambers Exclusively licensed by AT&T/Lucent to Insightful Corporation, Seattle WA. Product name: S-plus. R: initially written by Ross Ihaka and Robert Gentleman at Dep. of Statistics of U of Auckland, New Zealand during 1990s. We have named our language R in part to acknowledge the influence of S and in part to celebrate our own efforts. Since 1997: international R-core team ~15 people & 1000s of code writers and statisticians happy to share their libraries!
3 Introduction to R Most people come to R because of Its statistical analysis, and Drawing a beautiful plot. Implementation languages: C, Fortran. R is an interpreted computer language. Most user-visible functions are written in R itself, calling upon a smaller set of internal primitives. It is possible to interface procedures written in C, C+, or FORTRAN languages for efficiency, and to write additional primitives. System commands can be called from within R R is free, and anyone can contribute to it as packages. In R, a statistical analysis is normally done as a series of steps, with intermediate results being stored in objects.
4 Getting started Open the webpage: Where to get R? Go to Downloads: CRAN Set your Mirror Select operation system, e.g. Windows Select base. Download R. The textbook An Introduction to R (English version, 繁體版, 简体版 )

5 R Console/RGui in Windows(MS) Menu Graphics box Icons Command box

6 Several concepts in Administrating R Workspace xxx.rdata History xxx.rhistory Package Object Run your R codes -- Ihaka R. & Gentleman R., 1996 Load/save workspace Load/save History Change your working directory
) Load a local package Install packages from internet or local Update the local package from")
7 Add a new package Commands: library() add a package in the library detach(package : xxx) detach a package All can do in the GUI (except detach()) Load a local package Install packages from internet or local Update the local package from internet
8 Packages in R Environment Basic packages "package:methods" "package:stats" "package:graphics "package:utils" Recommanded packages grid; lattice;e1071 "package:base" Contributed packages (more than 366 packages nowadays) You can see what packages loaded now by the command search().
9 Don t lose your way! Three useful system command getwd() Get Working Directory setwd() Set Working Directory list.files() List the Files in a Directory/Folder

10 Show the Demonstrations of the Packages/Functions Commands demo() example() Demonstrations of R Functionality Run an Examples Section from the Online Help
 or?() help.search() Internet searching I like it very much.")
11 Getting Helps Several commands help.start() help() or?() help.search() Internet searching I like it very much. It seems omnipotence.
 Terminate an R")
12 Quit R Command q() or quit() Terminate an R Session
13 Basic R working flow(object orientation) package -- R for Beginners. Emmanuel Paradis
14 How to use R? Part I Chapters 1-6 in An Introduction to R
15 R commands It is case sensitive. The R name consists of letter, number,. and _ (a1._); must start with letter or. ;.2XX is illegal. Elementary commands consist of either expressions or assignments. Commands are separated either by a semi-colon ( ; ), or by a newline. Elementary commands can be grouped by braces ( { and } ). Comments start with a hashmark ( # ). If a plus mark ( + ) appears, then the command is not complete. The vertical arrow keys on the keyboard can be used to scroll forward and backward through a command history.
16 R commands 1.10 Executing commands from or diverting output to a file source("commands.r") Executing commands in commands.r sink("record.lis") Output all subsequent to file, record.lis sink() Restores it to the console Checking and removing objects Objects() or ls() Display current objects; rm(x,y) Romove objects x and y.
17 Chapter 2 Simple manipulations; numbers and vectors 2.1 Vectors and assignment 2.2 Vector arithmetic Elementary operators: +, -, *, / and ^; Functions: log, exp, sin, cos, tan, sqrt, max, min, range, length, sum, prod, sort, order,etc.; sqrt(-17) and sqrt(-17+0i)
, c1 c2 ( or ),!")
18 Chapter 2 Simple manipulations; numbers and vectors 2.3 Generating regular sequences 2.4 Logical vectors Values: TRUE, FALSE, and NA; Logical operators: <, <=, >, >=, ==,!=; Logical expressions: c1 & c2 ( and ), c1 c2 ( or ),!c1 ( not ); Sometimes, FALSE becoming 0 and TRUE becoming 1.
19 Chapter 2 Simple manipulations; numbers and vectors 2.5 Missing values 2.6 Character vectors 2.7 Index vectors; selecting and modifying subsets of a data set 1. A logical vector. 2. A vector of positive integral quantities. 3. A vector of negative integral quantities. 4. A vector of character strings.
20 Chapter 2 Simple manipulations; numbers and vectors 2.7 Index vectors; selecting and modifying subsets of a data set (cont. )
21 Chapter 2 Simple manipulations; numbers and vectors 2.8 Other types of objects matrices or more generally arrays are multi-dimensional generalizations of vectors. In fact, they are vectors that can be indexed by two or more indices and will be printed in special ways. factors provide compact ways to handle categorical data. lists are a general form of vector in which the various elements need not be of the same type, and are often themselves vectors or lists. Lists provide a convenient way to return the results of a statistical computation. data frames are matrix-like structures, in which the columns can be of different types. Think of data frames as data matrices with one row per observational unit but with (possibly) both numerical and categorical variables. Many experiments are best described by data frames: the treatments are categorical but the response is numeric. functions are themselves objects in R which can be stored in the project s workspace. This provides a simple and convenient way to extend R.

22 Chapter 3 Objects, their modes and attributes 3.1 Intrinsic attributes: mode and length vector has a atomic structure, i.e. their components are all of the same type, or mode (numeric, complex, logical, character and raw). list has a recursive structure. 3.2 Changing the length of an object

23 Chapter 4 Ordered and unordered factors Ordered and unordered factors. Functions: factor, levels, ordered, tapply.

24 Chapter 5 Arrays and matrices An array can be considered as a multiply subscripted collection of data entries, for example numeric. A matrix is a special array with two dimensions.
25 Chapter 5 Arrays and matrices
26 Chapter 6 Lists and data frames
27 How to use R? Part II Chapters 7-12 in An Introduction to R
28 Chapter 7. Reading data from files read.table() copy two data in section 7.1 into file1.txt and file2.txt. save them into D:/temp. creat file3.txt without header line and the last column. scan function Accessing builtin datasets Loading data from other R packages Editing data
29
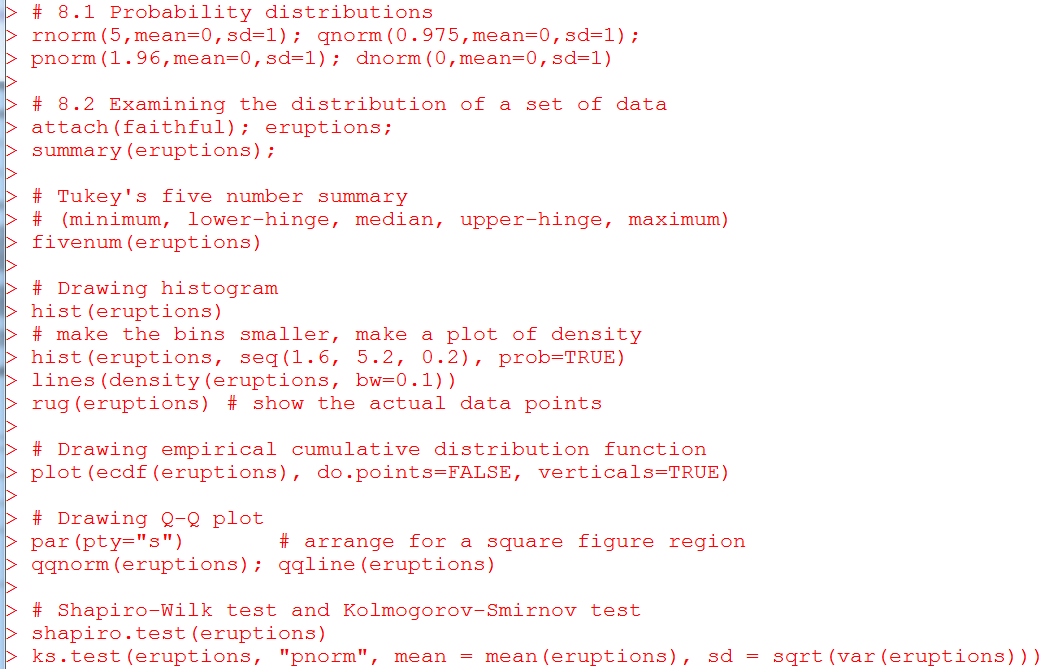
30 Chapter 8. Probability distributions 8.1 Probability distributions Prefix the name d for the density, p for the CDF, q for the quantile function and r for simulation (random deviates). The first argument is x for dxxx, q for pxxx, p for qxxx and n for rxxx (except for rhyper, rsignrank and rwilcox, for which it is nn). Please refer to section 8.1 for other distributions.
31 Chapter 8. Probability distributions 8.2 Examining the distribution of a set of data Functions: summary, fivenum, stem, hist, ecdf, qqnorm, shapiro.test, ks.test, etc. example: the eruption times of dataset faithful. Questions: Suppose that we focus on the values greater than 3. Please do the same checking 8.3 One- and two-sample tests Functions: boxplot, t.test, var.test, wilcox.test, ks.test
32
33 Chapter 8. Probability distributions

34 Chapter 9. Grouping, loops and conditional execution There are also repeat and while, however, they are not commonly used. Braces ( {} ) can be used to group more than one lines of commands.
35 Chapter 10. Writing your own functions A simple example below.
36 Chapter 11. Statistical models in R An example of the linear regression model How to specify formula? Please refer to section 11.1 y1, y2 and y3 are all vectors of the dataframe anscombe
37 Chapter 11. Statistical models in R How to perform the analysis of variance (ANOVA)? Please refer to section 11.4 How to perform the generalized linear model? Please refer to section 11.6 for families, glm() function, the gaussian family, the binomial family, poisson models. How to perform optimizations? Functions: optim(), nlm() and nlminb(). For some non-standard models, please refer to section 11.8
38 Chapter 11. Statistical models in R Linear regression models. Interpreting outputs. Updating the model.
39 Chapter 11. Statistical models in R Generating the linear regression model, y=0.5*x1-2*x2+e, where x1 and x2 are standard normal, e is Student s t(5), and sample size is 200. Calculate the regression coefficients by fitting the model, and by direct calculation.

40 Solutions
41 Chapter 12. Graphical procedures Plotting commands are divided into three basic groups: High-level plotting functions create a new plot on the graphics device, possibly with axes, labels, titles and so on. Low-level plotting functions add more information to an existing plot, such as extra points, lines and labels. Interactive graphics functions allow you interactively add information to, or extract information from, an existing plot, using a pointing device such as a mouse. In addition, R maintains a list of graphical parameters which can be manipulated to customize your plots. Sections are respectively for high-level, low-level and interactive functions. Section 12.4 & 12.5 are for graphical parameters.
42 Chapter 12. Graphical procedures
43 Chapter 12. Graphical procedures Draw densities of the standard normal, t(3), t(10), t(20) in one plot. I require to use different colors, different line types, different line width. Draw vertical lines at 95% quantiles.
Getting Started with R and RStudio 1
 Getting Started with R and RStudio 1 1 What is R? R is a system for statistical computation and graphics. It is the statistical system that is used in Mathematics 241, Engineering Statistics, for the following
R Language Fundamentals
 R Language Fundamentals Data Types and Basic Maniuplation Steven Buechler Department of Mathematics 276B Hurley Hall; 1-6233 Fall, 2007 Outline Where did R come from? Overview Atomic Vectors Subsetting
An Introduction to R. W. N. Venables, D. M. Smith and the R Core Team
 An Introduction to R Notes on R: A Programming Environment for Data Analysis and Graphics Version 3.2.2 (2015-08-14) W. N. Venables, D. M. Smith and the R Core Team This manual is for R, version 3.2.2
OVERVIEW OF R SOFTWARE AND PRACTICAL EXERCISE
 OVERVIEW OF R SOFTWARE AND PRACTICAL EXERCISE Hukum Chandra Indian Agricultural Statistics Research Institute, New Delhi-110012 1. INTRODUCTION R is a free software environment for statistical computing
Using R for Windows and Macintosh
 2010 Using R for Windows and Macintosh R is the most commonly used statistical package among researchers in Statistics. It is freely distributed open source software. For detailed information about downloading
There are six different windows that can be opened when using SPSS. The following will give a description of each of them.
 SPSS Basics Tutorial 1: SPSS Windows There are six different windows that can be opened when using SPSS. The following will give a description of each of them. The Data Editor The Data Editor is a spreadsheet
An Introduction to R. W. N. Venables, D. M. Smith and the R Core Team
 An Introduction to R Notes on R: A Programming Environment for Data Analysis and Graphics Version 3.1.1 (2014-07-10) W. N. Venables, D. M. Smith and the R Core Team This manual is for R, version 3.1.1
Dataframes. Lecture 8. Nicholas Christian BIOST 2094 Spring 2011
 Dataframes Lecture 8 Nicholas Christian BIOST 2094 Spring 2011 Outline 1. Importing and exporting data 2. Tools for preparing and cleaning datasets Sorting Duplicates First entry Merging Reshaping Missing
Formulas, Functions and Charts
 Formulas, Functions and Charts :: 167 8 Formulas, Functions and Charts 8.1 INTRODUCTION In this leson you can enter formula and functions and perform mathematical calcualtions. You will also be able to
Time Series Analysis AMS 316
 Time Series Analysis AMS 316 Programming language and software environment for data manipulation, calculation and graphical display. Originally created by Ross Ihaka and Robert Gentleman at University
R: A self-learn tutorial
 R: A self-learn tutorial 1 Introduction R is a software language for carrying out complicated (and simple) statistical analyses. It includes routines for data summary and exploration, graphical presentation
Silvia Liverani. Department of Statistics University of Warwick. CSC, 24th April 2008. R: A programming environment for Data. Analysis and Graphics
 : A Department of Statistics University of Warwick CSC, 24th April 2008 Outline 1 2 3 4 5 6 What do you need? Performance Functionality Extensibility Simplicity Compatability Interface Low-cost Project
An introduction to using Microsoft Excel for quantitative data analysis
 Contents An introduction to using Microsoft Excel for quantitative data analysis 1 Introduction... 1 2 Why use Excel?... 2 3 Quantitative data analysis tools in Excel... 3 4 Entering your data... 6 5 Preparing
EET 310 Programming Tools
 Introduction EET 310 Programming Tools LabVIEW Part 1 (LabVIEW Environment) LabVIEW (short for Laboratory Virtual Instrumentation Engineering Workbench) is a graphical programming environment from National
From The Little SAS Book, Fifth Edition. Full book available for purchase here.
 From The Little SAS Book, Fifth Edition. Full book available for purchase here. Acknowledgments ix Introducing SAS Software About This Book xi What s New xiv x Chapter 1 Getting Started Using SAS Software
Excel 2010: Create your first spreadsheet
 Excel 2010: Create your first spreadsheet Goals: After completing this course you will be able to: Create a new spreadsheet. Add, subtract, multiply, and divide in a spreadsheet. Enter and format column
Solving Systems of Linear Equations Using Matrices
 Solving Systems of Linear Equations Using Matrices What is a Matrix? A matrix is a compact grid or array of numbers. It can be created from a system of equations and used to solve the system of equations.
Engineering Problem Solving and Excel. EGN 1006 Introduction to Engineering
 Engineering Problem Solving and Excel EGN 1006 Introduction to Engineering Mathematical Solution Procedures Commonly Used in Engineering Analysis Data Analysis Techniques (Statistics) Curve Fitting techniques
Financial Econometrics MFE MATLAB Introduction. Kevin Sheppard University of Oxford
 Financial Econometrics MFE MATLAB Introduction Kevin Sheppard University of Oxford October 21, 2013 2007-2013 Kevin Sheppard 2 Contents Introduction i 1 Getting Started 1 2 Basic Input and Operators 5
Package dsmodellingclient
 Package dsmodellingclient Maintainer Author Version 4.1.0 License GPL-3 August 20, 2015 Title DataSHIELD client site functions for statistical modelling DataSHIELD
GETTING STARTED WITH R AND DATA ANALYSIS
 GETTING STARTED WITH R AND DATA ANALYSIS [Learn R for effective data analysis] LEARN PRACTICAL SKILLS REQUIRED FOR VISUALIZING, TRANSFORMING, AND ANALYZING DATA IN R One day course for people who are just
A Short Guide to R with RStudio
 Short Guides to Microeconometrics Fall 2013 Prof. Dr. Kurt Schmidheiny Universität Basel A Short Guide to R with RStudio 1 Introduction 2 2 Installing R and RStudio 2 3 The RStudio Environment 2 4 Additions
SOAL-SOAL MICROSOFT EXCEL 1. The box on the chart that contains the name of each individual record is called the. A. cell B. title C. axis D.
 SOAL-SOAL MICROSOFT EXCEL 1. The box on the chart that contains the name of each individual record is called the. A. cell B. title C. axis D. legend 2. If you want all of the white cats grouped together
Statistical Data Mining. Practical Assignment 3 Discriminant Analysis and Decision Trees
 Statistical Data Mining Practical Assignment 3 Discriminant Analysis and Decision Trees In this practical we discuss linear and quadratic discriminant analysis and tree-based classification techniques.
4 Other useful features on the course web page. 5 Accessing SAS
 1 Using SAS outside of ITCs Statistical Methods and Computing, 22S:30/105 Instructor: Cowles Lab 1 Jan 31, 2014 You can access SAS from off campus by using the ITC Virtual Desktop Go to https://virtualdesktopuiowaedu
Formulas & Functions in Microsoft Excel
 Formulas & Functions in Microsoft Excel Theresa A Scott, MS Biostatistician II Department of Biostatistics Vanderbilt University theresa.scott@vanderbilt.edu Table of Contents 1 Introduction 1 1.1 Using
Microsoft Excel 2010 Part 3: Advanced Excel
 CALIFORNIA STATE UNIVERSITY, LOS ANGELES INFORMATION TECHNOLOGY SERVICES Microsoft Excel 2010 Part 3: Advanced Excel Winter 2015, Version 1.0 Table of Contents Introduction...2 Sorting Data...2 Sorting
EXCEL SOLVER TUTORIAL
 ENGR62/MS&E111 Autumn 2003 2004 Prof. Ben Van Roy October 1, 2003 EXCEL SOLVER TUTORIAL This tutorial will introduce you to some essential features of Excel and its plug-in, Solver, that we will be using
R language in data mining techniques and statistics
 American Journal of Software Engineering and Applications 2013; 2(1) : 7-12 Published online February 20, 2013 (http://www.sciencepublishinggroup.com/j/ajsea) doi: 10.11648/j. ajsea.20130201.12 R language
Appendix A Doing Things in R
 271 Appendix A Doing Things in R This appendix is not an exhaustive list of all the things that R can do, but rather a list of some common steps you may want to take gathered in one convenient place, and
Using Excel for Statistical Analysis
 2010 Using Excel for Statistical Analysis Microsoft Excel is spreadsheet software that is used to store information in columns and rows, which can then be organized and/or processed. Excel is a powerful
Psychology 205: Research Methods in Psychology
 Psychology 205: Research Methods in Psychology Using R to analyze the data for study 2 Department of Psychology Northwestern University Evanston, Illinois USA November, 2012 1 / 38 Outline 1 Getting ready
Introduction to R and UNIX Working with microarray data in a multi-user environment
 Microarray Data Analysis Workshop MedVetNet Workshop, DTU 2008 Introduction to R and UNIX Working with microarray data in a multi-user environment Carsten Friis Media glna tnra GlnA TnrA C2 glnr C3 C5
Data Mining: Exploring Data. Lecture Notes for Chapter 3. Introduction to Data Mining
 Data Mining: Exploring Data Lecture Notes for Chapter 3 Introduction to Data Mining by Tan, Steinbach, Kumar What is data exploration? A preliminary exploration of the data to better understand its characteristics.
FIRST STEPS WITH SCILAB
 powered by FIRST STEPS WITH SCILAB The purpose of this tutorial is to get started using Scilab, by discovering the environment, the main features and some useful commands. Level This work is licensed under
WebFOCUS RStat. RStat. Predict the Future and Make Effective Decisions Today. WebFOCUS RStat
 Information Builders enables agile information solutions with business intelligence (BI) and integration technologies. WebFOCUS the most widely utilized business intelligence platform connects to any enterprise
Scientific Graphing in Excel 2010
 Scientific Graphing in Excel 2010 When you start Excel, you will see the screen below. Various parts of the display are labelled in red, with arrows, to define the terms used in the remainder of this overview.
Basics of using the R software
 Basics of using the R software Experimental and Statistical Methods in Biological Sciences I Juulia Suvilehto NBE 10.9.2015 Demo sessions Demo sessions (Thu 14.15 17.00) x 5 Demos, example code, and exercises
Using Excel for Data Manipulation and Statistical Analysis: How-to s and Cautions
 2010 Using Excel for Data Manipulation and Statistical Analysis: How-to s and Cautions This document describes how to perform some basic statistical procedures in Microsoft Excel. Microsoft Excel is spreadsheet
The R Environment. A high-level overview. Deepayan Sarkar. 22 July 2013. Indian Statistical Institute, Delhi
 The R Environment A high-level overview Deepayan Sarkar Indian Statistical Institute, Delhi 22 July 2013 The R language ˆ Tutorials in the Astrostatistics workshop will use R ˆ...in the form of silent
Introduction and usefull hints for the R software
 What is R Statistical software and programming language Freely available (inluding source code) Started as a free re-implementation of the S-plus programming language Introduction and usefull hints for
Introduction to Matlab
 Introduction to Matlab Social Science Research Lab American University, Washington, D.C. Web. www.american.edu/provost/ctrl/pclabs.cfm Tel. x3862 Email. SSRL@American.edu Course Objective This course provides
Chapter One Introduction to Programming
 Chapter One Introduction to Programming 1-1 Algorithm and Flowchart Algorithm is a step-by-step procedure for calculation. More precisely, algorithm is an effective method expressed as a finite list of
A Handbook of Statistical Analyses Using R. Brian S. Everitt and Torsten Hothorn
 A Handbook of Statistical Analyses Using R Brian S. Everitt and Torsten Hothorn CHAPTER 1 An Introduction to R 1.1 What is R? The R system for statistical computing is an environment for data analysis
Analysis of System Performance IN2072 Chapter M Matlab Tutorial
 Chair for Network Architectures and Services Prof. Carle Department of Computer Science TU München Analysis of System Performance IN2072 Chapter M Matlab Tutorial Dr. Alexander Klein Prof. Dr.-Ing. Georg
BIO503 - Lecture 1 Introduction to the R language
 BIO503 - Lecture 1 Introduction to the R language Bio503 January 2008, Aedin Culhane. I R, S and S-plus What is R? ˆ R is an environment for data analysis and visualization ˆ R is an open source implementation
University of Arkansas Libraries ArcGIS Desktop Tutorial. Section 2: Manipulating Display Parameters in ArcMap. Symbolizing Features and Rasters:
 : Manipulating Display Parameters in ArcMap Symbolizing Features and Rasters: Data sets that are added to ArcMap a default symbology. The user can change the default symbology for their features (point,
Computational Assignment 4: Discriminant Analysis
 Computational Assignment 4: Discriminant Analysis -Written by James Wilson -Edited by Andrew Nobel In this assignment, we will investigate running Fisher s Discriminant analysis in R. This is a powerful
2+2 Just type and press enter and the answer comes up ans = 4
 Demonstration Red text = commands entered in the command window Black text = Matlab responses Blue text = comments 2+2 Just type and press enter and the answer comes up 4 sin(4)^2.5728 The elementary functions
An Introduction to R. W. N. Venables, D. M. Smith and the R Core Team
 An Introduction to R Notes on R: A Programming Environment for Data Analysis and Graphics Version 3.2.0 (2015-04-16) W. N. Venables, D. M. Smith and the R Core Team This manual is for R, version 3.2.0
2x + y = 3. Since the second equation is precisely the same as the first equation, it is enough to find x and y satisfying the system
 1. Systems of linear equations We are interested in the solutions to systems of linear equations. A linear equation is of the form 3x 5y + 2z + w = 3. The key thing is that we don t multiply the variables
Exercises on using R for Statistics and Hypothesis Testing Dr. Wenjia Wang
 Exercises on using R for Statistics and Hypothesis Testing Dr. Wenjia Wang School of Computing Sciences, UEA University of East Anglia Brief Introduction to R R is a free open source statistics and mathematical
KaleidaGraph Quick Start Guide
 KaleidaGraph Quick Start Guide This document is a hands-on guide that walks you through the use of KaleidaGraph. You will probably want to print this guide and then start your exploration of the product.
How To Use Epicalc In R
 > help.start() > exp(-5) [1] 0.006738 9 > log(3.8 + ) [1] 1.335001 > help.start() > exp(-5) [1] 0.006738 9 50 40 > log(3.8 + ) [1] 1.335001 Virasakdi Chongsuvivatwong 30 20 Analysis of epidemiological
Bowerman, O'Connell, Aitken Schermer, & Adcock, Business Statistics in Practice, Canadian edition
 Bowerman, O'Connell, Aitken Schermer, & Adcock, Business Statistics in Practice, Canadian edition Online Learning Centre Technology Step-by-Step - Excel Microsoft Excel is a spreadsheet software application
Reading and writing files
 Reading and writing files Importing data in R Data contained in external text files can be imported in R using one of the following functions: scan() read.table() read.csv() read.csv2() read.delim() read.delim2()
Using Casio Graphics Calculators
 Using Casio Graphics Calculators (Some of this document is based on papers prepared by Donald Stover in January 2004.) This document summarizes calculation and programming operations with many contemporary
5 Correlation and Data Exploration
 5 Correlation and Data Exploration Correlation In Unit 3, we did some correlation analyses of data from studies related to the acquisition order and acquisition difficulty of English morphemes by both
Quick Tour of Mathcad and Examples
 Fall 6 Quick Tour of Mathcad and Examples Mathcad provides a unique and powerful way to work with equations, numbers, tests and graphs. Features Arithmetic Functions Plot functions Define you own variables
Data exploration with Microsoft Excel: analysing more than one variable
 Data exploration with Microsoft Excel: analysing more than one variable Contents 1 Introduction... 1 2 Comparing different groups or different variables... 2 3 Exploring the association between categorical
Excel 2003 Tutorial I
 This tutorial was adapted from a tutorial by see its complete version at http://www.fgcu.edu/support/office2000/excel/index.html Excel 2003 Tutorial I Spreadsheet Basics Screen Layout Title bar Menu bar
Using Microsoft Excel to Analyze Data
 Entering and Formatting Data Using Microsoft Excel to Analyze Data Open Excel. Set up the spreadsheet page (Sheet 1) so that anyone who reads it will understand the page. For the comparison of pipets:
SPSS: Getting Started. For Windows
 For Windows Updated: August 2012 Table of Contents Section 1: Overview... 3 1.1 Introduction to SPSS Tutorials... 3 1.2 Introduction to SPSS... 3 1.3 Overview of SPSS for Windows... 3 Section 2: Entering
Chapter 2 Exploratory Data Analysis
 Chapter 2 Exploratory Data Analysis 2.1 Objectives Nowadays, most ecological research is done with hypothesis testing and modelling in mind. However, Exploratory Data Analysis (EDA), which uses visualization
Dynamic Programming. Lecture 11. 11.1 Overview. 11.2 Introduction
 Lecture 11 Dynamic Programming 11.1 Overview Dynamic Programming is a powerful technique that allows one to solve many different types of problems in time O(n 2 ) or O(n 3 ) for which a naive approach
An R Tutorial. 1. Starting Out
 An R Tutorial 1. Starting Out R is an interactive environment for statistical computing and graphics. This tutorial will assume usage of R 2.0.0 on a PC. However, except in rare situations, these commands
Excel Level Two. Introduction. Contents. Exploring Formulas. Entering Formulas
 Introduction Excel Level Two This workshop introduces you to formulas, functions, moving and copying data, using autofill, relative and absolute references, and formatting cells. Contents Introduction
CHAPTER 3 EXAMPLES: REGRESSION AND PATH ANALYSIS
 Examples: Regression And Path Analysis CHAPTER 3 EXAMPLES: REGRESSION AND PATH ANALYSIS Regression analysis with univariate or multivariate dependent variables is a standard procedure for modeling relationships
imc FAMOS 6.3 visualization signal analysis data processing test reporting Comprehensive data analysis and documentation imc productive testing
 imc FAMOS 6.3 visualization signal analysis data processing test reporting Comprehensive data analysis and documentation imc productive testing www.imcfamos.com imc FAMOS at a glance Four editions to Optimize
Excel 2007 Basic knowledge
 Ribbon menu The Ribbon menu system with tabs for various Excel commands. This Ribbon system replaces the traditional menus used with Excel 2003. Above the Ribbon in the upper-left corner is the Microsoft
Introduction to Microsoft Excel 2007/2010
 to Microsoft Excel 2007/2010 Abstract: Microsoft Excel is one of the most powerful and widely used spreadsheet applications available today. Excel's functionality and popularity have made it an essential
SAS Analyst for Windows Tutorial
 Updated: August 2012 Table of Contents Section 1: Introduction... 3 1.1 About this Document... 3 1.2 Introduction to Version 8 of SAS... 3 Section 2: An Overview of SAS V.8 for Windows... 3 2.1 Navigating
GeoGebra. 10 lessons. Gerrit Stols
 GeoGebra in 10 lessons Gerrit Stols Acknowledgements GeoGebra is dynamic mathematics open source (free) software for learning and teaching mathematics in schools. It was developed by Markus Hohenwarter
SPSS Manual for Introductory Applied Statistics: A Variable Approach
 SPSS Manual for Introductory Applied Statistics: A Variable Approach John Gabrosek Department of Statistics Grand Valley State University Allendale, MI USA August 2013 2 Copyright 2013 John Gabrosek. All
Q&As: Microsoft Excel 2013: Chapter 2
 Q&As: Microsoft Excel 2013: Chapter 2 In Step 5, why did the date that was entered change from 4/5/10 to 4/5/2010? When Excel recognizes that you entered a date in mm/dd/yy format, it automatically formats
Computational Mathematics with Python
 Boolean Arrays Classes Computational Mathematics with Python Basics Olivier Verdier and Claus Führer 2009-03-24 Olivier Verdier and Claus Führer Computational Mathematics with Python 2009-03-24 1 / 40
Microsoft Excel v5.0 Database Functions
 Microsoft Excel v5.0 Database Functions Student Guide Simon Dupernex Aston Business School Version 1.0 1 Preface This document is an introduction to the database functions contained within the spreadsheet
Introduction Course in SPSS - Evening 1
 ETH Zürich Seminar für Statistik Introduction Course in SPSS - Evening 1 Seminar für Statistik, ETH Zürich All data used during the course can be downloaded from the following ftp server: ftp://stat.ethz.ch/u/sfs/spsskurs/
SPSS 12 Data Analysis Basics Linda E. Lucek, Ed.D. LindaL@niu.edu 815-753-9516
 SPSS 12 Data Analysis Basics Linda E. Lucek, Ed.D. LindaL@niu.edu 815-753-9516 Technical Advisory Group Customer Support Services Northern Illinois University 120 Swen Parson Hall DeKalb, IL 60115 SPSS
Excel 2007: Basics Learning Guide
 Excel 2007: Basics Learning Guide Exploring Excel At first glance, the new Excel 2007 interface may seem a bit unsettling, with fat bands called Ribbons replacing cascading text menus and task bars. This
ASSIGNMENT 4 PREDICTIVE MODELING AND GAINS CHARTS
 DATABASE MARKETING Fall 2015, max 24 credits Dead line 15.10. ASSIGNMENT 4 PREDICTIVE MODELING AND GAINS CHARTS PART A Gains chart with excel Prepare a gains chart from the data in \\work\courses\e\27\e20100\ass4b.xls.
MATLAB Basics MATLAB numbers and numeric formats
 MATLAB Basics MATLAB numbers and numeric formats All numerical variables are stored in MATLAB in double precision floating-point form. (In fact it is possible to force some variables to be of other types
Data Mining: Exploring Data. Lecture Notes for Chapter 3. Slides by Tan, Steinbach, Kumar adapted by Michael Hahsler
 Data Mining: Exploring Data Lecture Notes for Chapter 3 Slides by Tan, Steinbach, Kumar adapted by Michael Hahsler Topics Exploratory Data Analysis Summary Statistics Visualization What is data exploration?
Below is a very brief tutorial on the basic capabilities of Excel. Refer to the Excel help files for more information.
 Excel Tutorial Below is a very brief tutorial on the basic capabilities of Excel. Refer to the Excel help files for more information. Working with Data Entering and Formatting Data Before entering data
PART-A Questions. 2. How does an enumerated statement differ from a typedef statement?
 1. Distinguish & and && operators. PART-A Questions 2. How does an enumerated statement differ from a typedef statement? 3. What are the various members of a class? 4. Who can access the protected members
CD-ROM Appendix E: Matlab
 CD-ROM Appendix E: Matlab Susan A. Fugett Matlab version 7 or 6.5 is a very powerful tool useful for many kinds of mathematical tasks. For the purposes of this text, however, Matlab 7 or 6.5 will be used
NICK COLLIER - REPAST DEVELOPMENT TEAM
 DATA COLLECTION FOR REPAST SIMPHONY JAVA AND RELOGO NICK COLLIER - REPAST DEVELOPMENT TEAM 0. Before We Get Started This document is an introduction to the data collection system introduced in Repast Simphony
Descriptive Statistics
 Y520 Robert S Michael Goal: Learn to calculate indicators and construct graphs that summarize and describe a large quantity of values. Using the textbook readings and other resources listed on the web
STATS8: Introduction to Biostatistics. Data Exploration. Babak Shahbaba Department of Statistics, UCI
 STATS8: Introduction to Biostatistics Data Exploration Babak Shahbaba Department of Statistics, UCI Introduction After clearly defining the scientific problem, selecting a set of representative members
Tutorial 3: Graphics and Exploratory Data Analysis in R Jason Pienaar and Tom Miller
 Tutorial 3: Graphics and Exploratory Data Analysis in R Jason Pienaar and Tom Miller Getting to know the data An important first step before performing any kind of statistical analysis is to familiarize
Object systems available in R. Why use classes? Information hiding. Statistics 771. R Object Systems Managing R Projects Creating R Packages
 Object systems available in R Statistics 771 R Object Systems Managing R Projects Creating R Packages Douglas Bates R has two object systems available, known informally as the S3 and the S4 systems. S3
Tutorial 2: Reading and Manipulating Files Jason Pienaar and Tom Miller
 Tutorial 2: Reading and Manipulating Files Jason Pienaar and Tom Miller Most of you want to use R to analyze data. However, while R does have a data editor, other programs such as excel are often better
ADD-INS: ENHANCING EXCEL
 CHAPTER 9 ADD-INS: ENHANCING EXCEL This chapter discusses the following topics: WHAT CAN AN ADD-IN DO? WHY USE AN ADD-IN (AND NOT JUST EXCEL MACROS/PROGRAMS)? ADD INS INSTALLED WITH EXCEL OTHER ADD-INS
GeoGebra Statistics and Probability
 GeoGebra Statistics and Probability Project Maths Development Team 2013 www.projectmaths.ie Page 1 of 24 Index Activity Topic Page 1 Introduction GeoGebra Statistics 3 2 To calculate the Sum, Mean, Count,
SPSS Introduction. Yi Li
 SPSS Introduction Yi Li Note: The report is based on the websites below http://glimo.vub.ac.be/downloads/eng_spss_basic.pdf http://academic.udayton.edu/gregelvers/psy216/spss http://www.nursing.ucdenver.edu/pdf/factoranalysishowto.pdf
Using SPSS, Chapter 2: Descriptive Statistics
 1 Using SPSS, Chapter 2: Descriptive Statistics Chapters 2.1 & 2.2 Descriptive Statistics 2 Mean, Standard Deviation, Variance, Range, Minimum, Maximum 2 Mean, Median, Mode, Standard Deviation, Variance,
CITY UNIVERSITY LONDON. BEng Degree in Computer Systems Engineering Part II BSc Degree in Computer Systems Engineering Part III PART 2 EXAMINATION
 No: CITY UNIVERSITY LONDON BEng Degree in Computer Systems Engineering Part II BSc Degree in Computer Systems Engineering Part III PART 2 EXAMINATION ENGINEERING MATHEMATICS 2 (resit) EX2005 Date: August
WESTMORELAND COUNTY PUBLIC SCHOOLS 2011 2012 Integrated Instructional Pacing Guide and Checklist Computer Math
 Textbook Correlation WESTMORELAND COUNTY PUBLIC SCHOOLS 2011 2012 Integrated Instructional Pacing Guide and Checklist Computer Math Following Directions Unit FIRST QUARTER AND SECOND QUARTER Logic Unit
Tutorial Program. 1. Basics
 1. Basics Working environment Dealing with matrices Useful functions Logical operators Saving and loading Data management Exercises 2. Programming Basics graphics settings - ex Functions & scripts Vectorization
Describing, Exploring, and Comparing Data
 24 Chapter 2. Describing, Exploring, and Comparing Data Chapter 2. Describing, Exploring, and Comparing Data There are many tools used in Statistics to visualize, summarize, and describe data. This chapter