TECHNICAL ANALYSIS INDICATORS
|
|
|
- Gertrude James
- 7 years ago
- Views:
Transcription
1 TECHNICAL ANALYSIS INDICATORS
2 Objective Technical indicators use mathematical formulae to compute certain values which can be used to identify bullish and bearish trends in the market. These have been discussed in this chapter.

3 Agenda Indicators Volume Accumulation/Distribution On Balance Volume Price and Volume Trend Trend Bollinger bands Moving Averages Parabolic SAR Standard Deviation Oscillator Average Directional Index Average True Range DeMarker Envelopes MACD RSI Stochastic Market Profile
4 Technical Indicators Based on mathematical calculations on price and/or volume Values obtained are thus used to forecast probable price changes There are many technical indicators already developed Types Volume Oscillator Trend/ Momentum
5 Accumulation Distribution Determined by the changes in price and volume Volume acts as a weighting coefficient at the change of price Increase => Accumulation (buying) of security, => Upward trend of prices Decreases =>Distribution (selling) of security, => Downward price movement A/D(i) =((CLOSE(i) - LOW(i)) - (HIGH(i) - CLOSE(i)) * VOLUME(i) (HIGH(i) - LOW(i)) + A/D(i-1)
6 Example

7 Bullish
8 Bearish
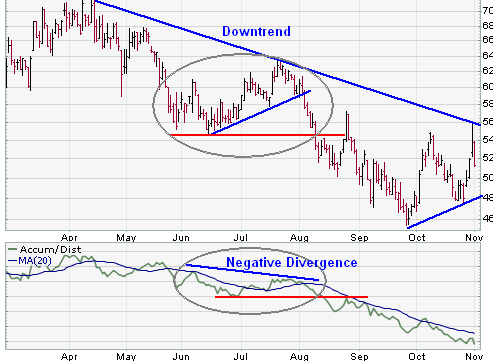
9 On Balance Volume Joe Granville introduced On Balance Volume (OBV) indicator Measure positive and negative volume flow Concept: Volume precedes price Rising volume can indicate the presence of smart money flowing into a security Numerical value of OBV is not important, but direction of the line Calculation OBV = Yesterday's OBV + Today's Volume OBV = Yesterday's OBV - Today's Volume Line can then be compared with the price chart of the underlying security to look for divergences or confirmation

10 OBV: Example
11 Price and Volume Trend Growing sum of values of the trade volume calculated regarding the change of closing prices A part of the current volume is added or subtracted Depends on the movement of price in respective time period PVT is considered more precise than OBV in showing the dynamics of trade volume Trend matters more than value Calculation

12 PVT Example

13 Bollinger Bands Bollinger Bands consist of a middle band with two outer bands A simple moving average forms the middle line They are two standard deviations above and below the moving average Buy signal => Price closes below lower band, and Sell signal=> Price closes above the upper band Assumes that prices cant move beyond outer bonds Bands contract => big move is coming, but not sure whether up or down Bands should contain 88-89% of the price action 13

14 Bollinger Bands Example Sell signal Buy signals

15 W Bottom
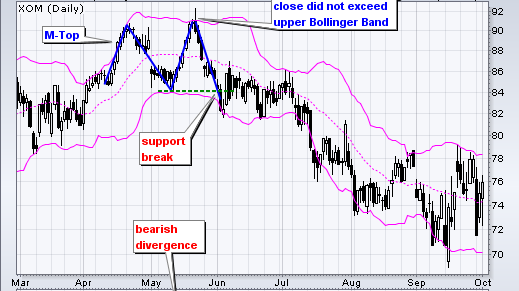
16 M Top
17 Moving Averages Moving averages smooth the price data to form a trend following indicator Define the current direction with a lag MA can be taken of Top, Bottom, Close or Open Two most popular types are Simple, Exponential, Smoothed, Linear weighted Moving Average (EMA)
18 Moving Averages Helps in identifying the trend Commonly used Moving Averages 5 (Weekly), 21 (Monthly), 200(Yearly) Can also be used as envelope 200 DMA is used as a very good resistance or Support
19 Adding Weights of Average Latest price has more importance than the previous prices Weights are added to price in such a way that the newer prices get more importance in calculating the average This method is called Weighted Moving Average
20 Moving Average: Example
21 Crossover Trading
22 Crossover Trading When the faster moving average crosses over the slower average, a corresponding buy or sell signal can be generated Example: If 10 Moving Average increases to more than 30 Moving Average, a BUY trade can be performed Example: If 10 Moving Average decreases to less than 30 Moving Average, a SELL trade can be performed
23 Parabolic SAR Developed by Welles Wilder, known as Stop And Reversal SAR sets trailing price stops for long or short positions Parabolic SAR is more popular for setting stops than for establishing direction or trend Establishing the trend first, and then trading with Parabolic SAR in the direction of the trend Trend is up => buy when the indicator moves below the price Trend is down=> sell when the indicator moves above the price The Parabolic SAR works best during strong trending periods, Estimates occur roughly 30% of the time
24 Example
25 Use The dotted lines below the price establish the trailing stop for a long position and The lines above establish the trailing stop for a short position There are two variables: the step and the maximum step The higher the step is set, the more sensitive the indicator will be to price changes If the step is set too high, the indicator will fluctuate above and below the price too often, making interpretation difficult The maximum step controls the adjustment of the SAR as the price moves The lower the maximum step is set, the further the trailing stop will be from the price Wilder recommends setting the step at.02 and the maximum step at.20
26 Standard Error Envelope whose bands are obtained by the calculation of the beta and alpha coefficients of linear regression Used to measure the strength of a trend, and it is interpreted in a simple way When they begin to widen, this is a sign that the trend is beginning to lose strength because the market is overbought or oversold, and Measures should therefore be taken expecting a reversal As for ranging markets, they have a large envelope in which the prices tend to fluctuate
27 Example
28 Stochastic A momentum indicator that shows the location of the close relative to the high-low range over a set number of periods Doesn't follow price, it doesn't follow volume or anything like that. It follows the speed or the momentum of price. As a rule, the momentum changes direction before price bullish and bearish divergences Measures the level of the close relative to the high-low range over a given period of time Low readings (below 20) indicate that price is near its low over a given time period High readings (above 80) indicate that price is near its high over a give time period

29 Example

30 Types
31 Overbought and Oversold Overbought Oversold
32 Uses Can also be used to identify turns near support or resistance A break above 20 to signal an upturn and successful support test A break below 80 to signal a downturn and resistance failure Settings on the Stochastic Oscillator depend on personal preference, trading style and timeframe Shorter look-back period will produce a choppy oscillator with many overbought and oversold readings Longer look-back period will provide a smoother oscillator with fewer overbought and oversold readings In conjunction with other technical analysis tools. Volume, support/resistance and breakouts can be used to confirm or refute signals produced
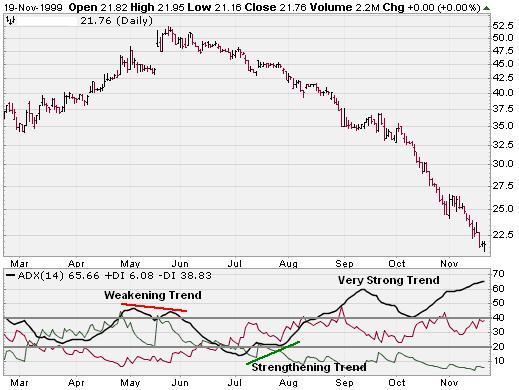
33 Average Directional Index (ADX) Evaluates the strength of a current trend, be it up or down Oscillator that fluctuates between 0 and 100 Readings above 60 are relatively rare Low readings, below 20, indicate a weak trend High readings, above 40, indicate a strong trend Does not grade the trend as bullish or bearish, but merely assesses the strength of the current trend When ADX begins to strengthen from below 20 and moves above 20, it is a sign that the trading range is ending and a trend is developing

34 ADX ADX is derived from two other indicators, Positive Directional Indicator (+DI) and Negative Directional Indicator (-DI) Buy and sell signals can be generated by +DI/-DI crosses A buy signal occurs when +DI moves above DI A sell signal when -DI moves above the +DI. Be careful, though When a security is in a trading range, this system may produce many whipsaws +DI/-DI crosses should be used in conjunction with other aspects of technical analysis Increasing the number of periods will smooth the ADX line (making it less volatile), and display more significant readings
35 Example

36 Moving Average Convergence- Divergence (MACD) Developed by Gerald Appel in the late seventies One of the simplest and most effective momentum indicators available Calculation =Shorter MA-Longer MA Trend following and Momentum Fluctuates above and below the zero line Moving averages converge, cross and diverge Goes below zero => Sell Signal Goes above zero => buy Signal

37 MACD Example

38 Signal Line Crossover
39 Relative Strength Index (RSI) J. Welles Wilder developed the Relative Strength Index (RSI) in 1978 Extremely popular indicator Momentum oscillator that measures speed and change of price movements RSI oscillates between zero and 100 RSI is overbought => above 70 and Oversold=> below 30 Signals can be generated by looking for Divergences, failure swings and centerline crossovers RSI can also be used to identify the general trend Generally period is taken as 14 RSI = /(1+RS) RS= Average Gain/ Average Loss

40 RSI Example
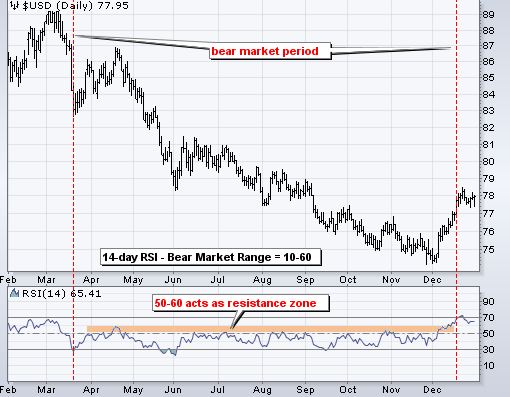
41 RSI: Resistance
42 Divergence When the indicator and the price move in such a way that they do not follow their standard movement, it is called as Divergence In divergence, we assume that the indicator rightly depicts the trend, and the price will soon adjust its direction to match with the indicator values

43 Divergence

44 RSI: Divergence
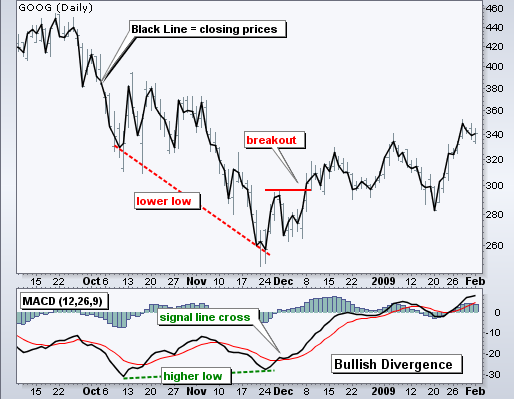
45 Bullish Divergence

46 DeMarker Developed by Tom Demarker for identifying High-risk buying or selling areas in a given market DeMark >.7 => downward price turn Demark <.3 => price will shortly turn upward Determine when to enter a market
47 DeMarker: Example
48 Average True Range (ATR) Introduced by Welles Wilder (1978) Shows volatility of the market Reflects the degree of interest or disinterest in a move Used as a component of numerous other indicators and trading systems Low value => Weaker Trend High Value => Strong Trend
49 ATR: Example
50 Market Profile Chicago Board of Trade has a registered trademark and holds exclusive copyrights to the Market Profile charting technique Assumptions The purpose of all markets is to facilitate trade The markets are self regulating. The regulating constraints include price, time, and volume The markets, as they attempt to facilitate trade, will use price probes to "advertise" for sellers or buyers The reaction to these probes provides valuable clues about the strength or weakness of the market
51 Market Profile TPO (Time-Price Opportunity) Helps traders to examine days such as normal, trend, neutral, and long-term market activity charts The half-hour segment represents the price range that developed over that time period Market's acceptance of price is where 70% of the day's volume occurred. => day's value area Internal structure of the markets Designed to offer logical, statistically based analysis of price, time, and volume
52 Mix & Match No Indicator will work on one product all the time Ideally should use 2-3 indicators at one time Common Strategies One to identify trend (If any) and then take another to take position One to enter into position another to close position Envelop of MA s (21 day top to 21 day bottom) Stochastic with ADX RSI with Bollinger RSI with Moving Averages 3 different indicators, work if 3 give same signal Back test it before using Don t Marry a indicator, If not working move on to next
MATHEMATICAL TRADING INDICATORS
 MATHEMATICAL TRADING INDICATORS The mathematical trading methods provide an objective view of price activity. It helps you to build up a view on price direction and timing, reduce fear and avoid overtrading.
Chapter 2.3. Technical Indicators
 1 Chapter 2.3 Technical Indicators 0 TECHNICAL ANALYSIS: TECHNICAL INDICATORS Charts always have a story to tell. However, sometimes those charts may be speaking a language you do not understand and you
Technical Indicators Tutorial - Forex Trading, Currency Forecast, FX Trading Signal, Forex Training Cour...
 Page 1 Technical Indicators Tutorial Technical Analysis Articles Written by TradingEducation.com Technical Indicators Tutorial Price is the primary tool of technical analysis because it reflects every
Disclaimer: The authors of the articles in this guide are simply offering their interpretation of the concepts. Information, charts or examples
 Disclaimer: The authors of the articles in this guide are simply offering their interpretation of the concepts. Information, charts or examples contained in this lesson are for illustration and educational
Chapter 2.3. Technical Analysis: Technical Indicators
 Chapter 2.3 Technical Analysis: Technical Indicators 0 TECHNICAL ANALYSIS: TECHNICAL INDICATORS Charts always have a story to tell. However, from time to time those charts may be speaking a language you
Technical Analysis. Technical Analysis. Schools of Thought. Discussion Points. Discussion Points. Schools of thought. Schools of thought
 The Academy of Financial Markets Schools of Thought Random Walk Theory Can t beat market Analysis adds nothing markets adjust quickly (efficient) & all info is already in the share price Price lies in
8 Day Intensive Course Lesson 5 Stochastics & Bollinger Bands
 8 Day Intensive Course Lesson 5 Stochastics & Bollinger Bands A)Trading with Stochastic Trading With Stochastic What is stochastic? Stochastic is an oscillator that works well in range-bound markets.[/i]
Stochastic Oscillator.
 Stochastic Oscillator. By Jay Lakhani www.4x4u.net George Lane was the originator of the stochastic indicator in the 1960 s; the indicator tracks the market momentum. Lane observed that as prices rise
A GUIDE TO WL INDICATORS
 A GUIDE TO WL INDICATORS GETTING TECHNICAL ABOUT TRADING: USING EIGHT COMMON INDICATORS TO MAKE SENSE OF TRADING What s a technical indicator and why should I use them? What s the market going to do next?
6.14. Oscillators and Indicators.
 6.14. Oscillators and Indicators. What is Momentum? The word momentum has two meanings to market technicians, one of them is a generic concept about how prices move, and the second one is a specific indicator.
Charting Glossary Version 1 September 2008
 Charting Glossary Version 1 September 2008 i Contents 1 Price...1 2 Charts...1 2.1 Line, Step, Scatter, Mountain charts... 1 2.2 Bar Charts (Open/High/Low/Close charts)... 1 2.3 Candle charts... 2 2.4
How I Trade Profitably Every Single Month without Fail
 How I Trade Profitably Every Single Month without Fail First of all, let me take some time to introduce myself to you. I am Kelvin and I am a full time currency trader. I have a passion for trading and
Professional Trader Series: Moving Average Formula & Strategy Guide. by John Person
 Professional Trader Series: Moving Average Formula & Strategy Guide by John Person MOVING AVERAGE FORMULAS & STRATEGY GUIDE In an online seminar conducted for the Chicago Board of Trade, I shared how to
Nest Pulse Impact Document
 Nest Pulse Impact Document July 25, 2012 1 Document Information DOCUMENT CONTROL INFORMATION DOCUMENT VERSION REVIEWER REVIEW NOTES Omnesys Nest Plus Nest Pulse Impact Document VERSION NOTES This Nest
atching Currency Moves with The Schaff Trend Cycle Indicator
 JULY/AUGUST 2002. VOLUME 4 CRunning a trend indicator through a cycle oscillator creates an effective entry technique into today s strongly trending currency markets, says Doug Schaff, a 20-year veteran
THE MACD: A COMBO OF INDICATORS FOR THE BEST OF BOTH WORLDS
 THE MACD: A COMBO OF INDICATORS FOR THE BEST OF BOTH WORLDS By Wayne A. Thorp Moving averages are trend-following indicators that don t work well in choppy markets. Oscillators tend to be more responsive
My Techniques for making $150 a Day Trading Forex *Note for my more Advanced Strategies check out my site: Click Here
 My Techniques for making $150 a Day Trading Forex *Note for my more Advanced Strategies check out my site: Click Here The Strategy We will be looking at 2 different ways to day trade the Forex Markets.
ChartGenie USER GUIDE
 1. Using This Manual This manual is designed to familiarize new users with the Applet charting tool interface. Through this manual, user will learn and understand the various features and functions offered.
RISK DISCLOSURE STATEMENT / DISCLAIMER AGREEMENT
 RISK DISCLOSURE STATEMENT / DISCLAIMER AGREEMENT Trading any financial market involves risk. This report and all and any of its contents are neither a solicitation nor an offer to Buy/Sell any financial
NEDBANK PRIVATE WEALTH STOCKBROKERS Graphical Analysis Manual
 This advanced charting application displays interactive, feature-rich, automatically-updated financial charts; The application also provides you with the ability to perform advanced technical analysis
TECHNICAL CHARTS UNDERSTANDING TECHNICAL CHARTS
 TECHNICAL CHARTS UNDERSTANDING TECHNICAL CHARTS Overview is an advanced charting application specifically designed to display interactive, feature rich, auto updated financial charts. The application provides
A Practical Guide to Technical Indicators; (Part 1) Moving Averages
 Moving Averages") A Practical Guide to Technical Indicators; (Part 1) Moving Averages By S.A Ghafari Over the past decades, attempts have been made by traders and researchers aiming to find a reliable method to predict
A Practical Guide to Technical Indicators; (Part 1) Moving Averages By S.A Ghafari Over the past decades, attempts have been made by traders and researchers aiming to find a reliable method to predict
Leon Wilson Trading Success
 Leon Wilson Trading Success A talk given by Mary de la Lande to the BullCharts User Group Meeting on 13 February 2008 1. Who is Leon Wilson? His Books and where to get them. 2. Book 1: The Business of
Why the E.A.S.Y. Method?
 Why the E.A.S.Y. Method? Mark Douglas, author of Trading in the Zone, states: The best traders have developed an edge and more importantly, they trust their edge. Why the E.A.S.Y. Method? My trading edge
Understanding the market
 Understanding the market Technical Analysis Approach: part I Xiaoguang Wang President, Purdue Quantitative Finance Club PhD Candidate, Department of Statistics Purdue University wang913@purdue.edu Outline
High Probability Trading Triggers for Gold & Silver
 Welcome to a CBOT Online Seminar High Probability Trading Triggers for Gold & Silver Presented by: John Person Sponsored by Interactive Brokers Live Presentation Starts at 3:30 PM Chicago Time NOTE: Futures
Alerts & Filters in Power E*TRADE Pro Strategy Scanner
 Alerts & Filters in Power E*TRADE Pro Strategy Scanner Power E*TRADE Pro Strategy Scanner provides real-time technical screening and backtesting based on predefined and custom strategies. With custom strategies,
TECHNICAL ANALYSIS. Handbook. 2003 Bloomberg L.P. All rights reserved.
 TECHNICAL ANALYSIS Handbook 2003 Bloomberg L.P. All rights reserved. There are two principles of analysis used to forecast price movements in the financial markets -- fundamental analysis and technical
GO Markets Trading Tools
 GO Markets Trading Tools Expert Advisors One of the most popular features of MetaTrader4 and the reason it is the world leader in Forex trading is because of the ability to use Expert Advisors. EAs are
VBM-ADX40 Method. (Wilder, J. Welles from Technical Analysis of Stocks and Commodities, February 1986.)
") VBM-ADX40 Method " I ve found that the most important thing in trading is always doing the right thing, whether or not you win or lose this is market savvy money management... I would go so far as to say
VBM-ADX40 Method " I ve found that the most important thing in trading is always doing the right thing, whether or not you win or lose this is market savvy money management... I would go so far as to say
Using Bollinger Bands. by John Bollinger
 Article Text Copyright (c) Technical Analysis Inc. 1 Stocks & Commodities V. 10:2 (47-51): Using Bollinger Bands by John Bollinger Using Bollinger Bands by John Bollinger Trading bands, which are lines
Technical Indicators Explained
 Chapter I. Technical Indicators Explained In This Chapter The information in this chapter is provided to help you learn how to use the technical indicators that are available for charting on the AIQ TradingExpert
Using Formations To Identify Profit Opportunities
 Using Formations To Identify Profit Opportunities Using Formations To Identify Profit Opportunities The concepts and strategies discussed may not be suitable for all investors. It is important that investors
ID ING WHEN TO BUY AND SELL USING THE STOCHASTIC OSCILLATOR
 ID ING WHEN TO BUY AND SELL USING THE STOCHASTIC OSCILLATOR By Wayne A. Thorp Stochastics work best with those securities that are currently trading within a particular range and may prove useful in identifying
ChartFilter Stock Tools Training Guide
 ChartFilter Stock Tools Training Guide Disclaimer MHP Systems Inc. is not responsible for investments made as a result of using this program. The purchaser of the license for use of this program is responsible
6. Get Top Trading Signals with the RSI
 INTERMEDIATE 6. Get Top Trading Signals with the RSI The Relative Strength Index, or RSI, is one of the most popular momentum indicators in technical analysis. The RSI is an oscillator that moves between
How to use Hamzei Analytics CI and DCI Indicators By Fari Hamzei
 How to use Hamzei Analytics CI and DCI Indicators By Fari Hamzei A key element of your success in trading is early detection of the trend before the next big move occurs. Seeing the next trend in prices,
GMMA 2.0 User Guide. August 2010 Edition PF-30-01-02
 GMMA 2.0 User Guide GMMA 2.0 User Guide August 2010 Edition PF-30-01-02 Support Worldwide Technical Support and Product Information www.nirvanasystems.com Nirvana Systems Corporate Headquarters 7000 N.
ADX breakout scanning ADX breakouts can signal momentum setups as well as exit conditions for intraday and swing traders. FIGURE 1: AFTER ADX > 40
 TRADING STRATEGIES ADX breakout scanning ADX breakouts can signal momentum setups as well as exit conditions for intraday and swing traders. BY KEN CALHOUN FIGURE 1: AFTER ADX > 40 Spotting volatility
Definitions to Basic Technical Analysis Terms. www.recognia.com
 Definitions to Basic Technical Analysis Terms www.recognia.com A Alert An alert is a notification sent when a significant event occurs in one or more investments of importance to a trader. Recognia sends
STREET SMARTS I. Planetary 2 Library. Introduction: Benefits: L I B R A R I E S
 Planetary 2 Library STREET SMARTS I Introduction: In today s world of computer trading, the small speculator often feels at a disadvantage to traders and corporations that have access to more powerful
The Moving Average. 2004 W. R. Booker II. All rights reserved forever and ever. And ever.
 The Moving Average By Rob Booker 2004 W. R. Booker II. All rights reserved forever and ever. And ever. The information contained in this ebook is designed to teach you methods of watching forex quotes
Verizon is a Buy. Plain and simple... A stock does not make the new 52-Week high list unless it is in a very powerful price up trend.
 Verizon is a Buy In this week s newsletter we are going to explore the Prime Trade Select trade selection process outlined in Chapter 1 of the WOW weekly option manual. The best place to start the trade
THE CYCLE TRADING PATTERN MANUAL
 TIMING IS EVERYTHING And the use of time cycles can greatly improve the accuracy and success of your trading and/or system. THE CYCLE TRADING PATTERN MANUAL By Walter Bressert There is no magic oscillator
NEST STARTER PACK. Omnesys Technologies. Nest Starter Pack. February, 2012. https://plus.omnesysindia.com Page 1 of 36
 Omnesys Technologies Nest Starter Pack February, 2012 https://plus.omnesysindia.com Page 1 of 36 Document Information DOCUMENT CONTROL INFORMATION DOCUMENT Nest Starter Pack User Manual VERSION 1.1 VERSION
APPLICATION PLATFORMS:
 APPLICATION PLATFORMS: FIRST CHARTING WEB FIRST CHARTING DESK FIRST CHARTING MOBILE WE PROVIDE: NSE CHARTING APP MCX CHARTING APP BOTH MCX/NSE CHART APP PROFESSIONAL TECHNICAL ANALYSIS CHARTING TOOLS:
BROKER SERVICES AND PLATFORM
 BROKER SERVICES AND PLATFORM A broker is an individual who executes buy and sell orders and get commission in the form of SPREAD (I will talk about SPREAD in the subsequent lessons). You trade through
Trading Medium-Term Divergences
 TRADING SYSTEMS Spotting Trend Reversals Trading Medium-Term Divergences Detect medium-term divergences by using the zero-lagging exponential moving average, support and resistance lines, and trendlines.
The Building Blocks for Succeeding with Forex Trading
 The Building Blocks for Succeeding with Forex Trading This e-book was created by traders and for traders with the aim of equipping traders with the right skills of earning big returns from trading forex
A Powerful Day Trading Strategy For Futures And Forex Markets Markus Heitkoetter
 A Powerful Day Trading Strategy For Futures And Forex Markets Markus Heitkoetter Agenda How To Configure Your Charts The Three (3) Best Indicators The Best Timeframe A Powerful Day Trading Strategy When
Heikin-Ashi-two-Bar-Strategy Guide to Strategic and Tactical Forex Trading Pull the Trigger and Hit your Targets
 Heikin-Ashi-two-Bar-Strategy Guide to Strategic and Tactical Forex Trading Pull the Trigger and Hit your Targets Currency: EUR/JPY, GBP/JPY Time frame: 5 min Indicators: BB 14, 2, ADX 14, SSD 5, 3, 3,
FREEFOREXEBOOK.ORG. Forex Trading
 FREEFOREXEBOOK.ORG Forex Trading Index Index 2 I - Forex Advantages 3 II 5 Myths about Forex Trading 5 III How Can I Start Making Money on Forex? 7 III.1 Educate Yourself 7 III.2 Plan How You Will Trade
CHART TRADING GUIDE 1
 CHART TRADING GUIDE 1 How to understand chart trading This guide is designed to teach you the basics of chart trading- the chart patterns that are covered in this booklet can be used for short and medium
Using Order Book Data
 Q3 2007 Using Order Book Data Improve Automated Model Performance by Thom Hartle TradeFlow Charts and Studies - Patent Pending TM Reprinted from the July 2007 issue of Automated Trader Magazine www.automatedtrader.net
Highly Active Manual FX Trading Strategy. 1.Used indicators. 2. Theory. 2.1. Standard deviation (stddev Indicator - standard MetaTrader 4 Indicator)
") Highly Active Manual FX Trading Strategy This strategy based on a mixture of two styles of trading: forex scalping, trend following short-term strategy. You can use it for any currency. Timeframe M15.
Highly Active Manual FX Trading Strategy This strategy based on a mixture of two styles of trading: forex scalping, trend following short-term strategy. You can use it for any currency. Timeframe M15.
SAIF-2011 Report. Rami Reddy, SOA, UW_P
 1) Title: Market Efficiency Test of Lean Hog Futures prices using Inter-Day Technical Trading Rules 2) Abstract: We investigated the effectiveness of most popular technical trading rules on the closing
Basic Forex forecast methods: Technical analysis and fundamental analysis
 Forex forecasting Basic Forex forecast methods: Technical analysis and fundamental analysis This article provides insight into the two major methods of analysis used to forecast the behavior of the Forex
Indicators. Applications and Pitfalls. Adam Grimes
 Indicators Applications and Pitfalls Adam Grimes CIO, Waverly Advisors, LLC October 6, 2015 Outline A little history lesson What indicators are and what they can do even more important what they can not
Trend Determination - a Quick, Accurate, & Effective Methodology
 Trend Determination - a Quick, Accurate, & Effective Methodology By; John Hayden Over the years, friends who are traders have often asked me how I can quickly determine a trend when looking at a chart.
Day Trade System EZ Trade FOREX
 Day Trade System The EZ Trade FOREX Day Trading System is mainly used with four different currency pairs; the EUR/USD, USD/CHF, GBP/USD and AUD/USD, but some trades are also taken on the USD/JPY. It uses
A Quick Tutorial in MACD: Basic Concepts. By Gerald Appel and Marvin Appel
 A Quick Tutorial in MACD: Basic Concepts By Gerald Appel and Marvin Appel The Moving Average Convergence-Divergence Indicator (MACD) has been a staple of technical analysis since Gerald invented it more
TOMORROW'S TRADING TECHNOLOGY. 100% automated Fibonacci support and resistance levels that you can count on every single trading day in an instant.
 TOMORROW'S TRADING TECHNOLOGY 100% automated Fibonacci support and resistance levels that you can count on every single trading day in an instant. ProTrader Table of Contents 1. Areas A. Fibonacci Confluence
Chapter 1 Introduction Disclaimer: Forex Involves risk. So if you lose money you can't blame us we told you trading involves risk.
 By Casey Stubbs -Winners Edge Trading.com Table of Contents Chapter 1. Introduction Chapter 2.. Trading Plan Chapter 3.. Money Management Chapter 4. Moving Average Strategy Chapter 5. Stochastic Strategy
Forex Volatility Patterns
 Spotting Early Breakouts Forex Volatility Patterns BRUCE WALDMAN Want to catch 40 to 00 pips in each trade? Here s how you can find those entry and exit signals to make your forex trading a success. C
Take it E.A.S.Y.! Dean Malone 4X Los Angeles Group - HotComm January 2007
 Take it E.A.S.Y.! Dean Malone 4X Los Angeles Group - HotComm January 2007 Dean Malone Partner of Compass Foreign Exchange, LLC. Co-Founder of Forex Signal Service.com. Previous Senior National for 4X Made
STOCK TRADING INDICATORS EXPLAINED. How To Make Profit Trading Stocks Using Indicators
 STOCK TRADING INDICATORS EXPLAINED How To Make Profit Trading Stocks Using Indicators Contents What are Indicators?... 4 The ADX Indicator... 5 How to Use ADX Indicator... 5 Technical Indicator ADX...
Bringing Some High Energy into the New Year
 Bringing Some High Energy into the New Year NYMEX crude oil futures experienced a significant price increase in 2011, albeit with high volatility, like many asset classes in the period. NYMEX crude oil
Beginner s Guide To Trading
 Beginner s Guide To Trading With Alessio Rastani LeadingTrader.com 1 Alessio Rastani 2 Alessio Rastani I am dreaming of a recession Governments don t rule the world, Goldman Sachs rules the world 3 Alessio
THE A-Z GUIDE TO E-MINI FUTURES TRADING
 THE A-Z GUIDE TO E-MINI FUTURES TRADING 1.800.800.3840 2 PAST PERFORMANCE IS NOT NECESSARILY INDICATIVE OF FUTURE PERFORMANCE. THE RISK OF LOSS IN TRADING FUTURES CONTRACTS OR COMMODITY OPTIONS CAN BE
Understanding the Technical Market Indicators
 Understanding the Technical Market Indicators Revised: October 2009 Article Written By: Md Saeed Ul Hoque Golden Gate University San Francisco, CA Sharif Gias Assistant Professor of Finance University
Stop Investing and Start Trading. How I Trade Technical Strategies Over Fundamental Strategies
 Stop Investing and Start Trading How I Trade Technical Strategies Over Fundamental Strategies PREPARATION PRIOR TO OPENING MARKET 1. On Daily Log Sheet record NAV [Net Asset Value] of portfolio. 2. Note
Finanzdienstleistungen (Praxis) Algorithmic Trading
 Algorithmic Trading") Finanzdienstleistungen (Praxis) Algorithmic Trading Definition A computer program (Software) A process for placing trade orders like Buy, Sell It follows a defined sequence of instructions At a speed and
Finanzdienstleistungen (Praxis) Algorithmic Trading Definition A computer program (Software) A process for placing trade orders like Buy, Sell It follows a defined sequence of instructions At a speed and
Retracements With TMV
 A Series Of Indicators Used As One Trade Breakouts And Retracements With TMV Making good trading decisions involves finding indicators that cut through the market noise. But how do you do it without collapsing
Presents. The Trading Information Revealed Here is not the Same as the WizardTrader.com Methods -- But Together They Pack a Powerful Punch
 Presents Killer Patterns Now You Can Have These Trading Gems -- Free! The Trading Information Revealed Here is not the Same as the WizardTrader.com Methods -- But Together They Pack a Powerful Punch 1
NEURAL networks [5] are universal approximators [6]. It
![NEURAL networks [5] are universal approximators [6]. It](/thumbs/25/6270299.jpg "NEURAL networks [5] are universal approximators [6]. It") Proceedings of the 2013 Federated Conference on Computer Science and Information Systems pp. 183 190 An Investment Strategy for the Stock Exchange Using Neural Networks Antoni Wysocki and Maciej Ławryńczuk
Proceedings of the 2013 Federated Conference on Computer Science and Information Systems pp. 183 190 An Investment Strategy for the Stock Exchange Using Neural Networks Antoni Wysocki and Maciej Ławryńczuk
Commodity Channel Index
 Commodity (CCI) Developed by Donald Lambert, the Commodity (CCI) was designed to identify cyclical turns in commodities but can be applied to shares as well. The Commodity Channel Index uses a typical
The Use of Trend Lines and Charting Patterns in Trading the Forex Markets
 The Use of Trend Lines and Charting Patterns in Trading the Forex Markets The use of Trends and Trend Lines forms the basis of establishing the support and resistance levels and charting patterns that
Trading with the High Performance Intraday Analysis Indicator Suite
 Trading with the High Performance Intraday Analysis Indicator Suite PowerZone Trading indicators can provide detailed information about the conditions of the intraday market that may be used to spot unique
ForexIndicator.org. Presents. Written By Kelvin Lee
 ForexIndicator.org Presents Written By Kelvin Lee All rights reserved. No part of this publication may be reproduced, stored in a retrieval system, or transmitted, in any form or by any means, electronic,
Advanced Trading Systems Collection MACD DIVERGENCE TRADING SYSTEM
 MACD DIVERGENCE TRADING SYSTEM 1 This system will cover the MACD divergence. With this trading system you can trade any currency pair (I suggest EUR/USD and GBD/USD when you start), and you will always
8 Day Intensive Course Lesson 3
 8 Day Intensive Course Lesson 3 A) What are Fibonacci Retracements? Fibonacci Retracements What are Fibonacci retracements? Levels at which the market is expected to retrace to after a strong trend. Based
Trade Stocks Like A Pro
 Trade Stocks Like A Pro 5 TIPS Plus 3 Picks International Traders Expo New York By Dr. Charles B. Schaap, Jr. 5 Tips Tip #1: Use ADX to Trade Power Trends Tip #2: Use RSI (50/50 Strategy) for Timing the
How Well Do Traditional Momentum Indicators Work? Cynthia A. Kase, CMT President, Kase and Company, Inc., CTA October 10, 2006
 How Well Do Traditional Momentum Indicators Work? Cynthia A. Kase, CMT President, Kase and Company, Inc., CTA October 10, 2006 1.0 Introduction Most market technicians believe traditional momentum indicators,
EUR/USD Trading Strategy
 EUR/USD Trading Strategy TRADING SIGNALS TRADING EDUCATION TRADING STRATEGIES Kathy Lien & Boris Schlossberg www.bkforex.com TRADING SIGNALS & TRADING EDUCATION Risk Disclosure BKForex LLC is a registered
Trading with ATR Price Projections.
 By Nitin Suvarna Trading with ATR Price Projections. J. Welles Wilder developed "Average True Range" (ATR) as a tool for a more precise calculation of price activity and volatility. True Range measure
Moving Average Method Part 2 by www.surefire-trading.com. Ty Young
 Moving Average Method Part 2 by www.surefire-trading.com Ty Young Hi everyone, this is Ty Young with Surefire-Trading.com. In our last lesson, MA Method Part 1, we demonstrated how Moving Averages could
Exit Strategies for Stocks and Futures
 Exit Strategies for Stocks and Futures Presented by Charles LeBeau E-mail clebeau2@cox.net or visit the LeBeau web site at www.traderclub.com Disclaimer Each speaker at the TradeStationWorld Conference
Investment, Trading, and Portfolio Management. An Interactive Qualifying Project Report. Submitted to the Faculty of the
 Investment, Trading, and Portfolio Management An Interactive Qualifying Project Report Submitted to the Faculty of the WORCESTER POLYTECHNIC INSTITUTE in partial fulfillment of the requirements for the
FxPro Quant. Strategy Builder. User Manual. Making the creation of Expert Advisors as easy as it gets! v.3
 FxPro Quant Strategy Builder Making the creation of Expert Advisors as easy as it gets! User Manual v.3 Table of Contents 1. What Expert Advisors (EAs) are 3 2. Why Use an Expert Advisor (EA) 3 2.1. Organise
CYCLE TIMING CAN IMPROVE YOUR TIMING PERFORMANCE by Walter Bressert, CTA
 CYCLE TIMING CAN IMPROVE YOUR TIMING PERFORMANCE by Walter Bressert, CTA The HOLY GRAIL OF TRADING is: Trade with the trend; if up, buy the dips; if down, sell the rallies. With cycles you can identify
DVAN SmartLines on TradeStation
 DVAN SmartLines on TradeStation This document is intended as an introduction and user guide to the apps available to Divergence Analysis users on TradeStation. For more information, please contact info@divergenceanalysis.com
INTRODUCTION - TIPS - STRATEGY
 EBOOK INTRODUCTION - TIPS - STRATEGY Table of Contents 1. What are Binary Options 2. The flow of decisions in a Trade 3. Advantagesw 4. Risk Management 5. What You Need to Succeed 6. Risk Tolerance 7.
A STUDY ON EQUITY SHARE PRICE MOVEMENT OF SUN PHARMACEUTICALS INDUSTRIES LIMITED
 International Research Journal of Engineering and Technology (IRJET) e-issn: 3-006 Volume: 0 Issue: 06 Sep-0 www.irjet.net p-issn: 3-00 A STUDY ON EQUITY SHARE PRICE MOVEMENT OF SUN PHARMACEUTICALS INDUSTRIES
Contrarian investing and why it works
 Contrarian investing and why it works Definition Contrarian a trader whose reasons for making trade decisions are based on logic and analysis and not on emotional reaction. What is a contrarian? A Contrarian
Thinking Man s Trader
 Thinking Man s Trader Advanced Trader s Package Trading is a three dimensional world and the Advanced Trader s Package covers all three. Dimension three: Market Dynamics, conditions and change of conditions
Timing the Trade How to Buy Right before a Huge Price Advance
 Timing the Trade How to Buy Right before a Huge Price Advance By now you should have read my first two ebooks and learned about the life cycle of a market, stock, or ETF, and discovered the best indicators
I've been reading a lot and still haven't quite found the scan code I'm seeking.
 of 0 /22/203 5:23 PM questions tags users badges unanswered search questions tags users 6 I've been reading a lot and still haven't quite found the scan code I'm seeking. I'm looking for a scan that will
How To Determine If Technical Currency Trading Is Profitable For Individual Currency Traders
 Is Technical Analysis Profitable for Individual Currency Traders? Boris S. Abbey and John A. Doukas * Journal of Portfolio Management, 2012, 39, 1,142-150 Abstract This study examines whether technical
Trading Binary Options Strategies and Tactics
 Trading Binary Options Strategies and Tactics Binary options trading is not a gamble or a guessing game. By using both fundamental and technical market analysis, you are able to get a better understanding
Understanding the market with PVSRA
 Understanding the market with PVSRA PVSRA PVSRA stands for Price, Volume, Support, Resistance Analysis. Price includes consideration of individual candlestick configurations as well as the pattern, or