Understanding the market
|
|
|
- Caitlin Crawford
- 9 years ago
- Views:
Transcription
1 Understanding the market Technical Analysis Approach: part I Xiaoguang Wang President, Purdue Quantitative Finance Club PhD Candidate, Department of Statistics Purdue University [email protected]
2 Outline Why Technical Analysis? Philosophy of technical analysis Fundamental assumptions Definitions of trend, support and resistance Different Charting styles Reversal and Continuation patterns Principle of Confirmation and Divergence MetaTrader4 introduction Conclusion
3 Question: How to trade successfully in the market? Profits significantly out-beat risk-free rate or the return of market index Statistically stable performance in a long run The worst loss is still affordable
4 Trading formula Expected profits = (Target price entry price)*p{success} (Entry price stop price)*p{failure} Decision making: Determine (Entry price, Target price, Stop Price) such that the expected profits can be maximized.
5 The role of Technical Analysis Help you make the selection among the three choices at any fixed time t: 1. Open a position 2. Close a position 3. Do nothing
6 The history of Technical Analysis Dow Theory: Charles H. Dow published the first stock market average on July 3, The ABC of Stock Speculation, S.A. Nelson, (The first book the term Dow Theory was used.) Dow Theory, Robert Rhea, Elliott Wave Theory: The wave principle was published in 1938 by Charles J. Collins, which was based on the original work of Ralph Nelson Elliott. William D. Gann: Geometric angels and percentages. Most work was published during the 1950s and 60s. For more information:
7 Philosophy of Technical Analysis Market action discounts everything. Prices move in trends: A trend in motion is more likely to continue than to reverse. (An adaptation of Newton s first law of motion.) History repeats itself.
8 Basic foundations behind technical analysis Price discounts everything Price movements are not totally random The market has Three trends (Dow) Major trends have three phase (Dow) Volume must confirm the trend A trend is assumed to be in effect until it gives definite signals that it has reversed The market is more psychological than logical
9 Doubts and Criticisms The doubts and criticisms have a history as long as that of the theory: Can the past be used to predict the future? Signals are always too late? Analyst Bias: subjective interpretation; art vs. science Trader s Remorse: Not all signals and patterns work Always another level: Bullish or Bearish?
10 Description vs. Prediction What is more important than why! Technical analysis at least is an effective description of the market prices. It helps us know what the market is saying at the moment. It is a popular language used by traders to describe the market.
11 Definitions Trend: An upper trend is a series of successively higher peaks and troughs; a downtrend is just the opposite, while horizontal peaks and troughs would identify a sideways price trend (trendless). Remark: It is the direction of those peaks and troughs that constitutes market trend.
12 Example of trends
13 Support and resistance Support is a level or area on the chart under the market where buying interest is sufficiently strong to overcome selling pressure and a decline is halted and prices turn back up. Resistance is a level or area over the market where selling pressure overcomes buying pressure and a price advance is turned back. Tested support and resistance are more reliable. Previous peaks and troughs are potential supports and resistances. Some other candidates can be those levels or areas indicated by indicators such as MA, trend channels, percentages and so on.
14 Examples of supports and resistances
15 More examples
16 Remarks on supports and resistance Finding supports and resistance plays the key role of technical analysis. This is the hardest part in developing a trading strategy based on technical analysis. All the indicators and tools are to help you in two perspectives: 1. evaluate the strength of potential supports and resistances. 2. evaluate the spot probability of price going up vs. going down at the moment. Good trading opportunities are those levels that satisfy the 3:1 rule and have a high odds ratio.
17 Charting Ways to describe or plot the market prices. Different types of charts: Bar Chart Candle-stick Chart Point and Figure (OX chart) Market profile Pro-Sticks chart Goal: keep the basic trend or shape of historical prices while omit most prices that not important in technical analysis perspective.
18 Good references Candlestick: OX Chart: school:chart_analysis:pnf_charts Market Profile ProStick
19 Bar Chart and Candlestick Chart
20 Candle types
21
22
23 Summary for Candle types Long white candlesticks indicate that the Bulls controlled the ball (trading) for most of the game. Long black candlesticks indicate that the Bears controlled the ball (trading) for most of the game. Small candlesticks indicate that neither team could move the ball and prices finished about where they started. A long lower shadow indicates that the Bears controlled the ball for part of the game, but lost control by the end and the Bulls made an impressive comeback. A long upper shadow indicates that the Bulls controlled the ball for part of the game, but lost control by the end and the Bears made an impressive comeback. A long upper and lower shadow indicates that the both the Bears and the Bulls had their moments during the game, but neither could put the other away, resulting in a standoff.
24 Drawbacks of Candle Chart Omit all the information except for HLOC within a time interval (one candle), some of which, however, might be important, especially the statistical information of the price magnitude change (Market Profile), assigned volume information such as the prices that most volume concentrate on (Pro-Stick). Chart can be further contracted, especially when price moves in a very narrow range for a long time (OX Chart).

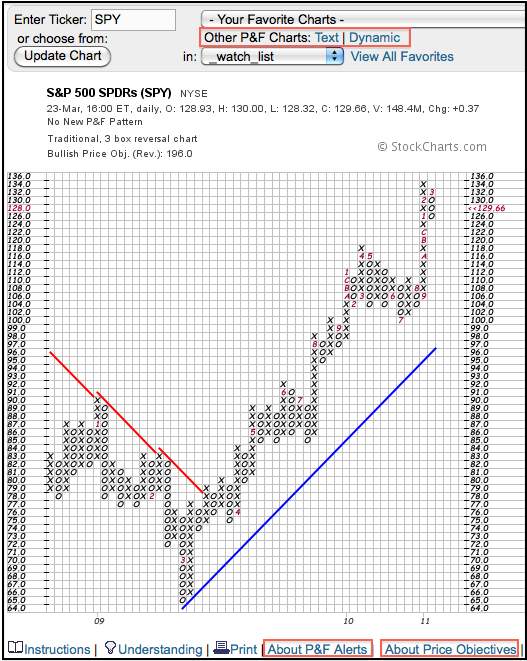
25 OX Chart Focus on the magnitude changes of prices rather than the changes of prices on time domain.

26 More on OX Chart You can apply similar patterns used in candlesticks chart to the OX chart
27

28 OX chart used for target price predictions

29 Bull trap and Bear trap

30 Bullish Catapult
31 Summary for OX Chart Filter insignificant price movements and noise Focus on important price movements Remove the time aspect from the analysis process Make support/resistance levels much easier to identify Provide automatic and subjective trendlines
32 Market Profile A chart that displays market data using Time Price Opportunities (TPOs). A TPO is a price that the market traded at during a specific period. The typical market profile chart splits the trading day into thirty minute segments or periods. The market data for each period is displayed on the basis of a normal distribution.
33 Foundations behind
34
35 One can combine the candle chart together with the Market Profile
36 Combination
37 Summary on Market Profile Focus on the time-based distributional information of price changes within a time interval More detailed version of Candle chart Still not directly reflect much on the assigned volume information of the price changes
38 Pro-Stick The introduction of ProSticks attempts to reduce the limitations of Market Profile and other technical analysis and charting tools while, at the same time, integrates the elements of volume and time into traditional technical analysis and charting. ProSticks has two variations: ProSticks-By- Time and ProSticks-By-Volume
39 ProStick-by-Time & ProStick-by-Volume The Modal Point in a ProStick bar represents the most heavily transacted price for the particular time interval. ProSticks-By-Time calculates the Modal Point similar to the way Market Profile builds its bell-curve distribution. The Modal Point is then simply the price with the most number of transacted 5-minute intervals for all transacted prices in the trading interval ProSticks-By-Volume calculates the Modal Point simply by taking the most heavily traded price for the trading day (or other trading intervals). The Modal Point is thus the price that had the most shares traded for that particular day. The Active Range for both ProSticks-By-Time and ProSticks-By-Volume is computed by first calculating the mean of the entire distribution. Then the first standard deviation away from the mean in either direction is added together to form the Active Range. The Active Range equals approximately 68 percent of the entire distribution
40 ProStick vs. Candlestick
41
42
43 Summary for ProStick Combine the advantages of both Candlestick and Market Profile Help to more accurately find support and resistant points Can be used to confirm or deny signals indicated by candlestick theories It is more reasonable to take Modal Point as reference compared to close price or H/L price when do technical analysis.
44 Price Patterns Classification and description of sideways market movements Market price curve = trend_1 + pattern_1 + trend_2 + pattern_2 + + trend_i + pattern_i +. Reversal Patterns & Continuation Patterns Volume often plays an important role in determining the reliability of patterns Most price patterns also have certain measuring techniques that help determine the minimum price objectives.
45 Reversal Patterns A prerequisite for any reversal pattern is the existence of a prior trend The first signal of an impending trend reversal is often the breaking of an important trendlines The larger the pattern, the greater the subsequent move Topping patterns are usually shorter in duration and more volatile than bottoms Bottoms usually have smaller price ranges and take longer to build Volume is usually more important on the upside
46 Major reversal patterns The Head and Shoulder (H&S) Triple tops and bottoms Double tops and bottoms Spike (V) tops and bottoms Rounding pattern
47 Head and Shoulder Prices should not move across the Neckline again, otherwise it would be treated as a failed head and shoulder

48 Volume matters!

49 Non-standard head and shoulder
50 Triple Tops and Bottoms A slight variation of head and shoulder The volume tends to decline with each successive peak at the top and should increase at the breakdown point.
51 Double Tops and Bottoms The pattern has two peaks (A and C) at about the same level. The pattern is complete when the middle trough at point B is broken on a closing basis. Volume is usually lighter on the second peak C and picks up on the breakdown D. A return move back to the lower line is not unusual. The minimum measuring target is the height of the top projected downward from the breakdown point.
52
53 Extensions: Divergence Sometimes the second or third peak can be significantly higher than the previous peak, thus a double or triple top pattern fails. But this still can be treated as a reversal pattern as there is obvious evidence of divergence between the price curve and some indicator such as MACD.


54
55 Abuse of Double tops and bottoms Remark: The neckline must be crossed before confirming a reversal double tops or bottoms The price levels should be high or low enough to be considered as reversal patterns
56 Rounding tops or bottoms
57 Spike (V) Tops and Bottoms
58 Continuation patterns These patterns usually indicate that the sideways price action on the chart in nothing more than a pause in the prevailing trend and the next move will be in the same direction as the trend that preceded the formation. Continuation patterns are usually shorterterm in duration and are more accurately classified as near-term or intermediate patterns.
59 Triangles
60 Triangles
61 Triangles

62 Volume matters!
63 Diamond pattern Broadening pattern + Triangle Mainly considered as continuation pattern, but can show up at the bottom or top Bullish or Bearish prediction depends on the breakout direction Profit target is the height of the diamond
64 Diamond pattern
65 Diamond pattern
66 Diamond pattern
67 Flag patterns Most frequently seen continuation patterns Volume increase at the breakout point Target profit depend on the flag pole

68 Flag Patterns
69 Pennant
70 Rectangle A flat flag sometimes can be treated as a rectangle pattern. The rectangle pattern usually shows up on long term chart (daily or monthly chart). The volume pattern of rectangle is different from other continuation patterns since rectangle usually have wider price swings.

71 Rectangle Patterns
72 Rectangle
73 Rectangle
74 Principle of Confirmation Confirmation refers to the comparison of all technical signals and indicators to ensure that most of those indicators are pointing in the same direction and are confirming one another. Divergence is the opposite of confirmation and refers to a situation where different delivery months or related markets or technical indicators fail to confirm one another. It is one of the best early warning signals of impending trend reversals.
75 Confirmation of price trends or patterns Volume and open interest Technical signals Comparable market index or products Fundamental factors Other supports or resistances indicated by some previous (historical) price patterns or trends.
76 Technical Indicators Trend detective indicators: Moving Average systems, Bollinger Bands, parabolic SAR, Commodity Channel Index, ZigZag Oscillation indicators: MACD, RSI, RVI, Stochastic Oscillator, William s percent range Volume indicators: Volumes, On balance volume, Accumulation, Distribution.
77 MetaTrader 4 Download: Technical analysis Simulation trading account Algorithmic Trading with MQL4
78 Part II: Preview More on indicators Real market practice: currency market X Trader introduction Algorithmic trading Comprehensive list of indicators Technical analysis based statistical Modeling Axiomatic thoughts on technical analysis
79 Thank you! Questions? PQFC: Join us now!
Technical Analysis. Technical Analysis. Schools of Thought. Discussion Points. Discussion Points. Schools of thought. Schools of thought
 The Academy of Financial Markets Schools of Thought Random Walk Theory Can t beat market Analysis adds nothing markets adjust quickly (efficient) & all info is already in the share price Price lies in
Alerts & Filters in Power E*TRADE Pro Strategy Scanner
 Alerts & Filters in Power E*TRADE Pro Strategy Scanner Power E*TRADE Pro Strategy Scanner provides real-time technical screening and backtesting based on predefined and custom strategies. With custom strategies,
Disclaimer: The authors of the articles in this guide are simply offering their interpretation of the concepts. Information, charts or examples
 Disclaimer: The authors of the articles in this guide are simply offering their interpretation of the concepts. Information, charts or examples contained in this lesson are for illustration and educational
FOREX analysing made easy
 FOREX analysing made easy UNDERSTANDING TECHNICAL ANALYSIS An educational tool by Blackwell Global Contents Technical Analysis 2 Line Chart 3 Bar Chart 4 Candlestick Chart 5 Support and Resistance 6 Fibonacci
MATHEMATICAL TRADING INDICATORS
 MATHEMATICAL TRADING INDICATORS The mathematical trading methods provide an objective view of price activity. It helps you to build up a view on price direction and timing, reduce fear and avoid overtrading.
8 Day Intensive Course Lesson 5 Stochastics & Bollinger Bands
 8 Day Intensive Course Lesson 5 Stochastics & Bollinger Bands A)Trading with Stochastic Trading With Stochastic What is stochastic? Stochastic is an oscillator that works well in range-bound markets.[/i]
Using Formations To Identify Profit Opportunities
 Using Formations To Identify Profit Opportunities Using Formations To Identify Profit Opportunities The concepts and strategies discussed may not be suitable for all investors. It is important that investors
Technical Analysis of the Futures Markets:
 Technical Analysis of the Futures Markets: A Comprehensive Quide to Trading Methods and Applications John J. Murphy New York Institute of Finance A Prentice-Hall Company Introduction, xiii Acknowledgments,
The Use of Trend Lines and Charting Patterns in Trading the Forex Markets
 The Use of Trend Lines and Charting Patterns in Trading the Forex Markets The use of Trends and Trend Lines forms the basis of establishing the support and resistance levels and charting patterns that
Leon Wilson Trading Success
 Leon Wilson Trading Success A talk given by Mary de la Lande to the BullCharts User Group Meeting on 13 February 2008 1. Who is Leon Wilson? His Books and where to get them. 2. Book 1: The Business of
Definitions to Basic Technical Analysis Terms. www.recognia.com
 Definitions to Basic Technical Analysis Terms www.recognia.com A Alert An alert is a notification sent when a significant event occurs in one or more investments of importance to a trader. Recognia sends
Timing the Trade How to Buy Right before a Huge Price Advance
 Timing the Trade How to Buy Right before a Huge Price Advance By now you should have read my first two ebooks and learned about the life cycle of a market, stock, or ETF, and discovered the best indicators
AN INTRODUCTION TO THE CHART PATTERNS
 AN INTRODUCTION TO THE CHART PATTERNS AN INTRODUCTION TO THE CHART PATTERNS www.dukascopy.com CONTENTS TECHNICAL ANALYSIS AND CHART PATTERNS CHARACTERISTICS OF PATTERNS PATTERNS Channels Rising Wedge Falling
Technical Analysis. Chart Formations. Brought to you by: FX-ebooks.com. Forex ebooks Library
 Technical Analysis Chart Formations Brought to you by: FX-ebooks.com Forex ebooks Library 1 Forex Mentor by Peter Bain The new Leading Professional Currency Trading System shows you how to trade currencies
Technical Indicators Tutorial - Forex Trading, Currency Forecast, FX Trading Signal, Forex Training Cour...
 Page 1 Technical Indicators Tutorial Technical Analysis Articles Written by TradingEducation.com Technical Indicators Tutorial Price is the primary tool of technical analysis because it reflects every
Technical Indicators Explained
 Chapter I. Technical Indicators Explained In This Chapter The information in this chapter is provided to help you learn how to use the technical indicators that are available for charting on the AIQ TradingExpert
TECHNICAL ANALYSIS GLOSSARY
 TECHNICAL ANALYSIS GLOSSARY A ABC: Elliott Wave terminology for a three-wave countertrend price movement. Wave A is the first price wave against the trend of the market. Wave B is a corrective wave to
CHART TRADING GUIDE 1
 CHART TRADING GUIDE 1 How to understand chart trading This guide is designed to teach you the basics of chart trading- the chart patterns that are covered in this booklet can be used for short and medium
Chapter 2.3. Technical Analysis: Technical Indicators
 Chapter 2.3 Technical Analysis: Technical Indicators 0 TECHNICAL ANALYSIS: TECHNICAL INDICATORS Charts always have a story to tell. However, from time to time those charts may be speaking a language you
GO Markets Trading Tools
 GO Markets Trading Tools Expert Advisors One of the most popular features of MetaTrader4 and the reason it is the world leader in Forex trading is because of the ability to use Expert Advisors. EAs are
Channel Lines. Charts of futures price
 File A2-20 April 2005 www.extension.iastate.edu/agdm Charting Commodity Futures Channel Lines. Charts of futures price movements can guide agricultural producers in timing farm marketings and can be of
Pattern Recognition Software Guide
 Pattern Recognition Software Guide 2010 Important Information This material is for general information only and is not intended to provide trading or investment advice. All analysis and resulting conclusions
atching Currency Moves with The Schaff Trend Cycle Indicator
 JULY/AUGUST 2002. VOLUME 4 CRunning a trend indicator through a cycle oscillator creates an effective entry technique into today s strongly trending currency markets, says Doug Schaff, a 20-year veteran
CHART PATTERNS. www.tff-onlinetrading.com
 CHART PATTERNS Technical analysis, as you have seen in our Trading Academy videos so far, is not just about charts. It does, however, rely heavily on them and often uses chart patterns to assist in making
Stochastic Oscillator.
 Stochastic Oscillator. By Jay Lakhani www.4x4u.net George Lane was the originator of the stochastic indicator in the 1960 s; the indicator tracks the market momentum. Lane observed that as prices rise
Candlesticks For Support And Resistance
 NOVICE TRADER Candlesticks For Support And Resistance Even as you read this, the candlestick charting technique, with its origins in Japan, is being absorbed into the ways of Western technical analysis.
APPLICATION PLATFORMS:
 APPLICATION PLATFORMS: FIRST CHARTING WEB FIRST CHARTING DESK FIRST CHARTING MOBILE WE PROVIDE: NSE CHARTING APP MCX CHARTING APP BOTH MCX/NSE CHART APP PROFESSIONAL TECHNICAL ANALYSIS CHARTING TOOLS:
Chart Patterns Tutorial - Forex Trading, Currency Forecast, FX Trading Signal, Forex Training Course, E...
 Page 1 Chart Patterns Tutorial Technical Analysis Articles Written by TradingEducation.com Chart Patterns Tutorial Traders have debated the merits of "technical analysis" versus "fundamental analysis"
The 15 50 Trading System
 Main Premise: This is considered to be one of the most straight forward systems for a live trading style for day- and/or intraday trading. The 50 SMA is one of the most commonly used moving average numbers
Trend Analysis From Fibonacci to Gann Ichimoku versus MACD Proprietary Signals
 Trend Analysis From Fibonacci to Gann Ichimoku versus MACD Proprietary Signals Cornelius Luca Luca Global Research Banco Best Lisbon 2010 From Fibonacci to Gann Who is Fibonacci? Leonardo of Pisa (1170s
Class 2: Buying Stock & Intro to Charting. Buying Stock
 Class 2: Buying Stock & Intro to Charting Today s Class Buying Stock Intro to Charting Real World Analysis Buying Stock What Is a Stock? Share of ownership in a company Publicly traded Holds monetary value
Presents. The Trading Information Revealed Here is not the Same as the WizardTrader.com Methods -- But Together They Pack a Powerful Punch
 Presents Killer Patterns Now You Can Have These Trading Gems -- Free! The Trading Information Revealed Here is not the Same as the WizardTrader.com Methods -- But Together They Pack a Powerful Punch 1
Understanding Classic Chart Patterns Recognia Inc.
 Understanding Classic Chart Patterns Recognia Inc. www.recognia.com 2009 Copyright Recognia Inc. Table of Contents Introduction...3 Head and Shoulders Top...5 Head and Shoulders Bottom... 10 Symmetrical
High Probability Trading Triggers for Gold & Silver
 Welcome to a CBOT Online Seminar High Probability Trading Triggers for Gold & Silver Presented by: John Person Sponsored by Interactive Brokers Live Presentation Starts at 3:30 PM Chicago Time NOTE: Futures
A Primer On Technical Analysis. Written by. Available at
 A Primer On Technical Analysis Written by Available at Page 1 of 23 Overview Technical Analysis (Versus Fundamental Analysis) Technical analysis is a method of forecasting price movements by looking at
CURRENCY TRADING Using Swing Breakouts in Forex Trading
 CURRENCY TRADING Using Swing Breakouts in Forex Trading 28 MAY 2009 Doug Schaff discusses the use of intermediate swing highs and swing lows to develop a shortterm approach to trading the currency markets.
Technical Analysis Fibonacci Levels
 Technical Analysis Fibonacci Levels Retracements A retracement is a pullback within the context of a trend. Dip After a rise from 0 to 1, short term market participants start to take profit. This drives
Pattern Recognition and Prediction in Equity Market
 Pattern Recognition and Prediction in Equity Market Lang Lang, Kai Wang 1. Introduction In finance, technical analysis is a security analysis discipline used for forecasting the direction of prices through
Stock Breakout Profits Strategy
 Stock Breakout Profits Strategy Introduction Welcome and thank you for downloading the Stock Breakout Profits system. The Stock Breakout Profits is a complete trading strategy for trading not only the
Using Bollinger Bands. by John Bollinger
 Article Text Copyright (c) Technical Analysis Inc. 1 Stocks & Commodities V. 10:2 (47-51): Using Bollinger Bands by John Bollinger Using Bollinger Bands by John Bollinger Trading bands, which are lines
WELCOME TO Trading Boot Camp Day 2
 Icoachtrader Consulting Service www.icoachtrader.weebly.com WELCOME TO Trading Boot Camp Day 2 David Ha Ngo Trading Coach Phone: 1.650.899.1088 Email: [email protected] The information presented is
RISK DISCLOSURE STATEMENT / DISCLAIMER AGREEMENT
 RISK DISCLOSURE STATEMENT / DISCLAIMER AGREEMENT Trading any financial market involves risk. This report and all and any of its contents are neither a solicitation nor an offer to Buy/Sell any financial
How I Trade Profitably Every Single Month without Fail
 How I Trade Profitably Every Single Month without Fail First of all, let me take some time to introduce myself to you. I am Kelvin and I am a full time currency trader. I have a passion for trading and
Why the E.A.S.Y. Method?
 Why the E.A.S.Y. Method? Mark Douglas, author of Trading in the Zone, states: The best traders have developed an edge and more importantly, they trust their edge. Why the E.A.S.Y. Method? My trading edge
Basic Forex forecast methods: Technical analysis and fundamental analysis
 Forex forecasting Basic Forex forecast methods: Technical analysis and fundamental analysis This article provides insight into the two major methods of analysis used to forecast the behavior of the Forex
A GUIDE TO WL INDICATORS
 A GUIDE TO WL INDICATORS GETTING TECHNICAL ABOUT TRADING: USING EIGHT COMMON INDICATORS TO MAKE SENSE OF TRADING What s a technical indicator and why should I use them? What s the market going to do next?
Chapter 2.3. Technical Indicators
 1 Chapter 2.3 Technical Indicators 0 TECHNICAL ANALYSIS: TECHNICAL INDICATORS Charts always have a story to tell. However, sometimes those charts may be speaking a language you do not understand and you
VBM-ADX40 Method. (Wilder, J. Welles from Technical Analysis of Stocks and Commodities, February 1986.)
") VBM-ADX40 Method " I ve found that the most important thing in trading is always doing the right thing, whether or not you win or lose this is market savvy money management... I would go so far as to say
VBM-ADX40 Method " I ve found that the most important thing in trading is always doing the right thing, whether or not you win or lose this is market savvy money management... I would go so far as to say
Indicators. Applications and Pitfalls. Adam Grimes
 Indicators Applications and Pitfalls Adam Grimes CIO, Waverly Advisors, LLC October 6, 2015 Outline A little history lesson What indicators are and what they can do even more important what they can not
FUTURES STRATEGY: Short-term CCI p. 10. ADJUSTING TO stock index futures shift p. 14. STRADDLES, STRANGLES, and volatility p. 16
 May 2009 Volume 3, No. 5 FUTURES STRATEGY: Short-term CCI p. 10 ADJUSTING TO stock index futures shift p. 14 STRADDLES, STRANGLES, and volatility p. 16 FEAR AND LOATHING in the options market p. 20 TRADING
NEST STARTER PACK. Omnesys Technologies. Nest Starter Pack. February, 2012. https://plus.omnesysindia.com Page 1 of 36
 Omnesys Technologies Nest Starter Pack February, 2012 https://plus.omnesysindia.com Page 1 of 36 Document Information DOCUMENT CONTROL INFORMATION DOCUMENT Nest Starter Pack User Manual VERSION 1.1 VERSION
New Trendlens Indicators & Functions
 New Trendlens Indicators & Functions There are 83 new indicators and functions available in TrendLens. Formation Functions Highest Value The Highest Value formation function looks back bar count number
Charting Made Easy. Wiley Trading
 Brochure More information from http://www.researchandmarkets.com/reports/2329600/ Charting Made Easy. Wiley Trading Description: Here is a treasure trove of easy to use tools for mapping your course through
Picking a Trading Timeframe Before You Make a Trade Identifying the Trend Randomness of Financial Markets The Thought Demons of Traders
 ASIA PACIFIC S PREEMINENT TRADING MAGAZINE VOLUME 2 ISSUE 1 www.traders-journal.com SG$8.80 / A$13.80 / HK$68 / RM$19.80 Picking a Trading Timeframe Before You Make a Trade Identifying the Trend Randomness
THE A-Z GUIDE TO E-MINI FUTURES TRADING
 THE A-Z GUIDE TO E-MINI FUTURES TRADING 1.800.800.3840 2 PAST PERFORMANCE IS NOT NECESSARILY INDICATIVE OF FUTURE PERFORMANCE. THE RISK OF LOSS IN TRADING FUTURES CONTRACTS OR COMMODITY OPTIONS CAN BE
New York Traders Expo 2012
 New York Traders Expo 2012 with JAMES CHEN, CTA, CMT Director of Technical Research and Education All rights reserved, FXDD Inc. 2010 Today s Topic: High Probability Strategies for Trading Forex www.fxdd.com
www.60seconds2profit.com
 TABLE OF CONTENTS I. 60 Second Binary Options- Make 75% a Minute II. Binary Options Basics III. Why Trade Binary Options IV. What are 60 Second Binary Options V. How to Trade 60 Second Binary Options VI.
Secrets for profiting in bull and bear markets Sam Weinstein
 Secrets for profiting in bull and bear markets Sam Weinstein 1. Check market indicators for overall direction 2. Scan the industry groups to know which one to zero in 3. Cull out the stocks with the most
Investors Intelligence Using Point & Figure Charts
 Investors Intelligence Using Point & Figure Charts www.investorsintelligence.com, January 2005 Point and figure (p&f) charts provide a simple, yet disciplined method of identifying current or emerging
What You Don t Know About Candlesticks
 Researching candlesticks yields some surprises. In When Candles Work Best What You Don t Know About Candlesticks by Thomas N. Bulkowski writing my latest book, Encyclopedia Of Candlestick Charts, I made
Charting Glossary Version 1 September 2008
 Charting Glossary Version 1 September 2008 i Contents 1 Price...1 2 Charts...1 2.1 Line, Step, Scatter, Mountain charts... 1 2.2 Bar Charts (Open/High/Low/Close charts)... 1 2.3 Candle charts... 2 2.4
The 3-Steps System To Win At Trading Trading Broadening Top/Bottom Patterns The Hamster On The Wheel
 ASIA PACIFIC S PREEMINENT TRADING MAGAZINE TM www.tradersjournal.com Volume 5 Issue 9 The 3-Steps System To Win At Trading Trading Broadening Top/Bottom Patterns The Hamster On The Wheel ISSN 1793-2149
Highly Active Manual FX Trading Strategy. 1.Used indicators. 2. Theory. 2.1. Standard deviation (stddev Indicator - standard MetaTrader 4 Indicator)
") Highly Active Manual FX Trading Strategy This strategy based on a mixture of two styles of trading: forex scalping, trend following short-term strategy. You can use it for any currency. Timeframe M15.
Highly Active Manual FX Trading Strategy This strategy based on a mixture of two styles of trading: forex scalping, trend following short-term strategy. You can use it for any currency. Timeframe M15.
Elliott-Wave Fibonacci Spread Trading
 Elliott-Wave Fibonacci Spread Trading Presented by Ryan Sanden The inevitable disclaimer: Nothing presented constitutes a recommendation to buy or sell any security. While the methods described are believed
How Well Do Traditional Momentum Indicators Work? Cynthia A. Kase, CMT President, Kase and Company, Inc., CTA October 10, 2006
 How Well Do Traditional Momentum Indicators Work? Cynthia A. Kase, CMT President, Kase and Company, Inc., CTA October 10, 2006 1.0 Introduction Most market technicians believe traditional momentum indicators,
I Really Trade. Trading Patterns for Stocks & Commodities. Introducing The False Break Buy and Sell Pattern
 2008 Trading Patterns for Stocks & Commodities It doesn t matter if you are a longterm investor, short swing trader or day trader, you are always looking for an advantageous spot to enter your position.
CONTENT 1. 2. 5-8 9 5. 6. 7.
 User Manual TM CONTENT 1. 2. 3. 4. 5. 6. 7. 8. 9. Introduction The Autochartist Interface Analysis Toolbar (A) Pattern Display (B) Search Pane (C) Results Pane (Completed Patterns) (D) Results Pane (Emerging
Autochartist Intro Guide
 Autochartist Intro Guide CONTENT 1. 2. 3. 4. 5. 6. 7. 8. 9. 10. Getting Started with Autochartist Autochartist Pattern Results Column Headings Creating Custom Searches Trending Pattern Types Trending Pattern
Reading Price Charts Bar by Bar
 Reading Price Charts Bar by Bar The Technical Analysis of Price Action forthe Serious Trader AL BROOKS WILEY John Wiley & Sons, Inc. Contents Preface xlii CHAPTER 1 Price Action 1 Trend Bars and Doji Bars
Chart Patterns Trader. Trader SUPPLEMENT. Understanding and Trading Classic Chart Patterns. By: Kevin Matras Zacks Investment Research, Inc
 Chart Patterns Trader Trader SUPPLEMENT Understanding and Trading Classic Chart Patterns By: Kevin Matras Zacks Investment Research, Inc Table of Contents Introduction.........................................................................
6.14. Oscillators and Indicators.
 6.14. Oscillators and Indicators. What is Momentum? The word momentum has two meanings to market technicians, one of them is a generic concept about how prices move, and the second one is a specific indicator.
6. Get Top Trading Signals with the RSI
 INTERMEDIATE 6. Get Top Trading Signals with the RSI The Relative Strength Index, or RSI, is one of the most popular momentum indicators in technical analysis. The RSI is an oscillator that moves between
Metatrader 4 Edition. Version 1.XX
 Dynamic Sync Trading System Metatrader 4 Edition Version 1.XX Free Forex Studio http://www.f-fx.com http://www.forexsync.com 1 Contents I. Welcome...3 II. III. General Setup Procedures...4 System Overview...5
Understanding the market with PVSRA
 Understanding the market with PVSRA PVSRA PVSRA stands for Price, Volume, Support, Resistance Analysis. Price includes consideration of individual candlestick configurations as well as the pattern, or
My Techniques for making $150 a Day Trading Forex *Note for my more Advanced Strategies check out my site: Click Here
 My Techniques for making $150 a Day Trading Forex *Note for my more Advanced Strategies check out my site: Click Here The Strategy We will be looking at 2 different ways to day trade the Forex Markets.
Day Trade System EZ Trade FOREX
 Day Trade System The EZ Trade FOREX Day Trading System is mainly used with four different currency pairs; the EUR/USD, USD/CHF, GBP/USD and AUD/USD, but some trades are also taken on the USD/JPY. It uses
Golden Penny Stock Millionaires Golden Market Secrets For Trading Penny Stocks:
 Golden Penny Stock Millionaires Golden Market Secrets For Trading Penny Stocks: Introduction: Greetings; Hey, I m William Bell, stock analyst with the Golden Penny Stock Millionaires Financial Trading
ChartFilter Stock Tools Training Guide
 ChartFilter Stock Tools Training Guide Disclaimer MHP Systems Inc. is not responsible for investments made as a result of using this program. The purchaser of the license for use of this program is responsible
Professional Trader Series: Moving Average Formula & Strategy Guide. by John Person
 Professional Trader Series: Moving Average Formula & Strategy Guide by John Person MOVING AVERAGE FORMULAS & STRATEGY GUIDE In an online seminar conducted for the Chicago Board of Trade, I shared how to
THE CYCLE TRADING PATTERN MANUAL
 TIMING IS EVERYTHING And the use of time cycles can greatly improve the accuracy and success of your trading and/or system. THE CYCLE TRADING PATTERN MANUAL By Walter Bressert There is no magic oscillator
The 5 Exit Heroes. Exiting Your Forex Trades For Maximum Profits
 The 5 Exit Heroes Exiting Your Forex Trades For Maximum Profits IMPORTANT : As an added bonus for downloading this report, you also received additional free training videos. To access your bonuses, go
How to use Hamzei Analytics CI and DCI Indicators By Fari Hamzei
 How to use Hamzei Analytics CI and DCI Indicators By Fari Hamzei A key element of your success in trading is early detection of the trend before the next big move occurs. Seeing the next trend in prices,
Trading Medium-Term Divergences
 TRADING SYSTEMS Spotting Trend Reversals Trading Medium-Term Divergences Detect medium-term divergences by using the zero-lagging exponential moving average, support and resistance lines, and trendlines.
The Magic Momentum Method of Trading the Forex Market
 The Magic Momentum Method of Trading the Forex Market WELCOME! Welcome to one of the easiest methods of trading the Forex market which you can use to trade most currencies, most time frames and which can
Trade Forex with Support and Resistance Strategies. By Walter Peters, Phd. BestMetatraderBroker.com
 Trade Forex with Support and Resistance Strategies By Walter Peters, Phd. BestMetatraderBroker.com 1 Important Risk Disclaimer ALL INFORMATION CONTAINED IN THIS COURSE IS FOR EDUCATIONAL PURPOSES ONLY
Commodities & Forex Classical Chart Patterns Report
 TWO WAYS TO SHARE: Commodities & Forex Classical Chart Patterns Report Week of August 24, 2014 1. Patterns in Play (CANADIAN $, EURO, AUSTRALIAN $, EUR-JPY, COFFEE, SOYBEANS, BRAZIL EQUITY INDEX, JAPANESE
Contrarian investing and why it works
 Contrarian investing and why it works Definition Contrarian a trader whose reasons for making trade decisions are based on logic and analysis and not on emotional reaction. What is a contrarian? A Contrarian
TOMORROW'S TRADING TECHNOLOGY. 100% automated Fibonacci support and resistance levels that you can count on every single trading day in an instant.
 TOMORROW'S TRADING TECHNOLOGY 100% automated Fibonacci support and resistance levels that you can count on every single trading day in an instant. ProTrader Table of Contents 1. Areas A. Fibonacci Confluence
The Truth About 60 Second Binary Options TABLE OF CONTENTS. I. 60 Second Binary Options- Make 75% a Minute. Binary Options Basics
 TABLE OF CONTENTS I. 60 Second Binary Options- Make 75% a Minute II. Binary Options Basics III. Why Trade Binary Options IV. What are 60 Second Binary Options V. How to Trade 60 Second Binary Options VI.
Heikin-Ashi-two-Bar-Strategy Guide to Strategic and Tactical Forex Trading Pull the Trigger and Hit your Targets
 Heikin-Ashi-two-Bar-Strategy Guide to Strategic and Tactical Forex Trading Pull the Trigger and Hit your Targets Currency: EUR/JPY, GBP/JPY Time frame: 5 min Indicators: BB 14, 2, ADX 14, SSD 5, 3, 3,
Understanding the Technical Market Indicators
 Understanding the Technical Market Indicators Revised: October 2009 Article Written By: Md Saeed Ul Hoque Golden Gate University San Francisco, CA Sharif Gias Assistant Professor of Finance University
FOREIGN EXCHANGE CYCLES:
 January 1999 FOREIGN EXCHANGE CYCLES: Get Ready to Sell the Upcoming Cycle Top in the Dollar versus the Deutschemark Trade Sell the Dollar-Mark on a break below last week's low of 1.6625 and look for 5
Technical Analysis Module NATIONAL STOCK EXCHANGE OF INDIA LIMITED
 Technical Analysis Module NATIONAL STOCK EXCHANGE OF INDIA LIMITED Test Details: Sr. No. Name of Module * Candidates have the option to take the tests in English, Gujarati or Hindi languages. # Candidates
Intra-Day Trading Techniques. Pristine.com Presents. Greg Capra. book, Tools and Tactics for the Master Day Trader
 Pristine.com Presents Intra-Day Trading Techniques With Greg Capra Co-Founder of Pristine.com, and Co-Author of the best selling book, Tools and Tactics for the Master Day Trader Copyright 2001, Pristine
Forex Volatility Patterns
 Spotting Early Breakouts Forex Volatility Patterns BRUCE WALDMAN Want to catch 40 to 00 pips in each trade? Here s how you can find those entry and exit signals to make your forex trading a success. C
The Intraday Bias Indicator
 Wednesday, June 13, 2012 Issue 41 Wednesday, August 8, 2012 Intraday Time Analysis Erik Skyba, CMT Senior Quantitative Analyst [email protected] Features Studies/Files Included: Focus: Technical
Chapter 2.1. Charting Basics
 Chapter 2.1 Charting Basics 0 Contents CHARTING BASICS Charts are a forex trader s best friend. As a Forex trader, you will most likely utilize your price charts more than any other available tool. Since
ForexIndicator.org. Presents. Written By Kelvin Lee
 ForexIndicator.org Presents Written By Kelvin Lee All rights reserved. No part of this publication may be reproduced, stored in a retrieval system, or transmitted, in any form or by any means, electronic,
Action Forex Company Limited 2010
 1 2 Sponsored by 3 TABLE OF CONTENTS TABLE OF CONTENTS... 4 INTRODUCTION... 5 CHAPTER 1 CHART ANALYSIS IN CURRENCY TRADING... 6 1.1 - IMPORTANCE OF CHART ANALYSIS IN CURRENCY TRADING... 6 1.2 - BASIC CHART
Swing Trading Tactics
 Pristine.com Presents Swing Trading Tactics With Oliver L. Velez Founder of Pristine.com, and Author of the best selling book, Tools and Tactics for the Master Day Trader Copyright 2001, Pristine Capital