I've been reading a lot and still haven't quite found the scan code I'm seeking.
|
|
|
- August Reed
- 7 years ago
- Views:
Transcription
1 of 0 /22/203 5:23 PM questions tags users badges unanswered search questions tags users 6 I've been reading a lot and still haven't quite found the scan code I'm seeking. I'm looking for a scan that will bring up stocks at the beginning of an uptrend where the 3 Day EMA crosses above the 26 Day EMA. As a side note, I follow the Elder Impuse system and I like to trade within Keltner Channels. I see a lot of crossover code on this forum, but when I run these scans, invariably the stock is already well into its uptrend and sometimes even too far above the 3 Day EMA for me to go long - so it just goes on a watch list for a possible pullback to the 3/26 EMA zone. So here is what I came up with - can you help me tweak it so I get better results? Thanks - this site is terrific!!! [type = stock] and [country = us] and [daily volume > ] and [close > 20.00] and [close < ema(3)] and [close >= ema(26)] uptrend ema crossover scan edited Feb 02 '2 at 09:04 ta4u 5.2k 2 23 asked Jan 27 '2 at 6: Answers: oldest newest most voted Hi, quote from your previous post.

2 2 of 0 /22/203 5:23 PM 3 "..I am looking for stocks where either the 3 and 26 EMAs or 3 and 3 EMAs have just crossed over (3 above 26, o 3 above 3). I also need the stock to be trading in between the 3 and 26 or 3 and 3 EMAs.." I see what you are trying to do, however this approach really won't work, due to the fact that for the 3EMA to rise the stock price has to be above the 3EMA. Same for the 3/26 crossover to occur the stock price would have to be above both. Thus we need a different approach to get a hit a little earlier in the trend change, ie closer to the bottom and before the actual 3/26 crossover. I would suggest looking at comparing say the 3SMA against the 3EMA and look for a crossover there which would give you an earlier signal. I'll think about it more over the weekend, interesting problem. Cheers Gord link answered Jan 28 '2 at 2:34 Gord 7.2k 2 3, when you wait for an MA crossover, even with the faster emas vs smas, you are pretty much giving up th rewards of a more risky earlier entry for the confirmation of the MA crossover. In effect, you are paying for information The reason a high percentage of the ema crossover trades look good is that the crossover condition has eliminated stocks where buyers failed to follow through. If you want to catch pre-follow through situations, look at your scan results and find the events they have in common

3 3 of 0 /22/203 5:23 PM just before the crossover. How did buyers show they were gaining strength? Here are two possibilities: This picks the ema 3 turning up after falling a few days. It can only happen with at least one higher close: and [ema(3,close) > day ago ema(3,close)] and [ema(3,close) < 3 days ago ema(3,close)] This picks a close above a recent lowest high, which must happen for a rally to proceed: and [close > min(3,high)] You can play with the parameters, of course. There will be some overlap because an ema crossover can occur simultaneously with these events, but usually they would occur a day or two before. But you should get more hits than you would with a crossover scan. The trick is to pick which ones will follow through - that is, to see the future which th crossover scan shows you after the fact. For that you might want to visually inspect Price Performance versus a relevant index (it should be generally rising) or a volume indicator like MFI, Force Index or CMF. Remember, indicators are created by aggregating price action, and so are normally late. The earliest possible signals but the hardest to learn to read, are in price action itself. You want to see recent price action that shows.) buyers are becoming active (up closes, closes above highs, and best of all closes above highs on noticeably higher volume) and 2. sellers are pretty much done - after big volume down days, further down days, if any, are on lower volume, or on high or low volume, prices just stop going down. Sorry to just run on. Hope that helps some. link answered Feb 05 '2 at 5:37 markd 2.k 3 22 Thanks for the response - What you say makes a lot of sense. I often find I run the crossover scans, find good candidates, and then wait for them to retrace a bit back to the 3 EMA zone so I can get back in later on. And yes -- I am now seriously watching Force Index and volume more closely to see if they validate what is occurring with the EMA turning up/ crossovers. Again thank you for your insight. This conversation and exploration of various scanning possibilities has taught me a great deal about writing scans, price action, & volume. (Feb 05 '2 at 8:20 4 Hi, a couple of comments. Are you matching your scan parameters to your trading time frame? If you wan to capture the very beginning of a trend the 3 and 26 won't work because it takes quite a few days to turn them. On the other hand, once turned, they may be good choices for longer term trades. If you want to get in early, you could try much shorter term crossovers, e.g. 3x3 and [ema(3,close) x ema(3,close)] To get in even earlier, test for a close crossing a falling ema and [close x ema(3,close)] and [ema(3,close) < 5 days ago ema(3,close)] To further put things in your favor, also test for a rising longer term moving average and [ema(50, close) > 0 days ago ema(50,close) I've also noticed recently, although I haven't tested extensively, that a close above the lowest open when the short term MA is falling can be followed by a change of trend, sometimes after a test of the low, so:
![happen for a rally to proceed: and [close > min(3,high)] You can play with the parameters, of course.](/docs-images/44/19852302/images/page_3.jpg "There will be some overlap because an ema crossover can occur simultaneously with these events, but usually they would occur a day or two before.")
4 4 of 0 /22/203 5:23 PM [group is sp500] and [ema(3,close) < 5 days ago ema(3,close)] and [close > open] and [close > day ago min(7, open)] A final note: I'm defining trend here really as a leg or a swing in a larger up trend, assuming that's what your are looking for. Also, I've noticed higher volume, higher priced stocks tend to form more regular patterns (most of the time). If you want the lower price bang for the buck, the per cent changes for in the money options can be pretty good although that cuts both ways. link edited Jan 27 '2 at 8:46 answered Jan 27 '2 at 8:43 markd 2.k 3 22 I like to trade off the daily charts, but use weekly charts as my compass. I pretty much only look at 3, 26 and 200 EMAs across both timeframes. I find that when I run my originally submitted scan, I mostly get stocks that are in fact pulling back to the zone between the 3 and 26 EMAs, but that also seem poised to fall rather than trending back up towards the upper Keltner channel. I'll try out some of your suggestions and see how the results jive with Elder's Impulse system. Thanks!! Off to work... (Jan 27 '2 at 9:0 4 I'm going to add a chart image below so you can see where I am hoping to get in to a developing Long stock trade. I mentioned before that I am actually a momentum trader and I like to trade Keltner and MA channels. Ultimately, I am looking for stocks where either the 3 and 26 EMAs or 3 and 3 EMAs have just crossed over (3 above 26, or 3 above 3). I also need the stock to be trading in between the 3 and 26 or 3 and 3 EMAs (either a pullback or a fres breakout). So... I wonder if there is some way to incorporate Keltner Channels into the scan code and look for trades that are a certain percentage above or near the central Keltner 20 MA? (FYI - I use 20, 2.5 for my Keltner Channels). Hmmmm...lots to think about - any ideas wise ones? Here's a chart showing where I'd like to enter...

5 5 of 0 /22/203 5:23 PM
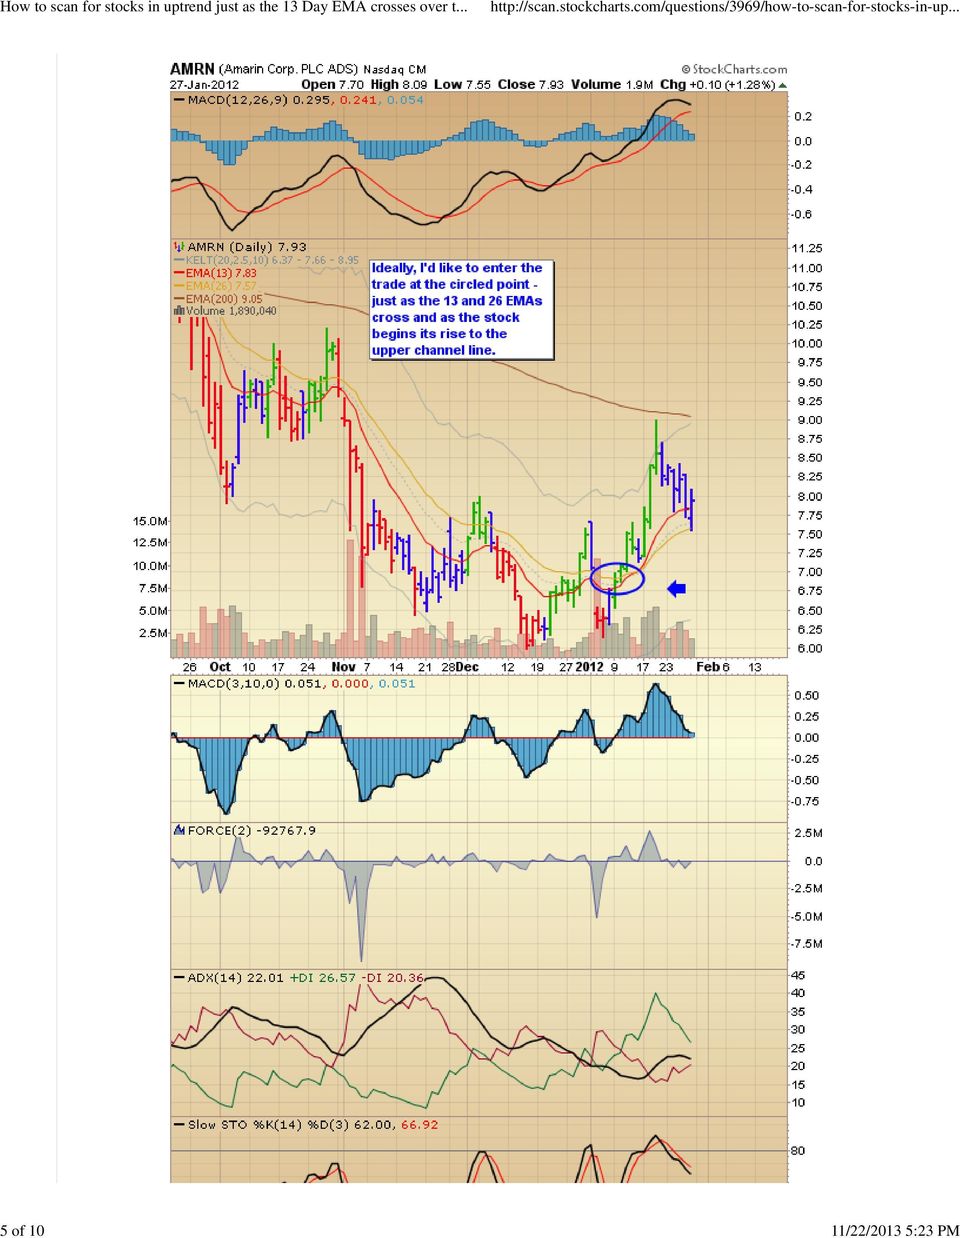
6 6 of 0 /22/203 5:23 PM link answered Jan 28 '2 at 0:46 edited Jan 28 '2 at 2:07 ekwong k I would just note here that you are looking for a long entry in a stock that is in a long term down trend (200 MA declining). Obviously there will be a point where this kind of trade will work, but as long as the trend is down the odds are against you because rallies tend to be shorter both in duration and points during a down trend. Your method of waiting for a moving average cross is a problem in this situation because you are using up extra time waiting for MAs to cross when you don't have time to spare. You could add a line for 200 MA or 50 MA rising (> 20 or 5 days ago) to up your odds. markd (Jan 28 '2 at 22:03 3 if you are a short term trader like myself your entry is perfect! Your entry is backed up by many indicators: There is a classic double bottom pattern in play Bullish divergance on the MACD Rising trend line on the MACD close to the zero line MACD crossover on the day you picked. This is one of the highest probability trades you can make. Professional are not afraid to enter on a high probability trade like this! The reason why they enter early is so the can sell to others in the run up. Trust me, I trade for a living, not for kicks like others who are discretionary gamblers ;) The 3,0,6 MACD is used by Linda Raschke. John Murphy has said that she is one of the best, if not THE best trader in world so she must be doing something right ;) One thing I would suggest is that you pick one indicator and master it. Too many indicators creates analysis paralysis Peace and happy trading :)

7 7 of 0 /22/203 5:23 PM link edited Feb 05 '2 at 9:44 answered Feb 05 '2 at 9:40 Love_To_Trade 5.8k 9 8 So far I tried the following much shorter term crossovers (3 / 3 EMA) as suggested using the following scan: [type = stock] and [country = us] and [daily volume > ] and [close > 20.00] and [ema(3,close) x ema(3,close)] The results were good and I even found a Bull Flag formation setting up! Nice. I'll try the other suggestions next. I'm a momentum channel trader - I just can't help myself. link answered Jan 27 '2 at 9: Ok - I got 9 stunning and relevant results with the following scan - kind of a mish-mash of your ideas - am I getting this right This formula is now called the Whopper Jr. in my list of favorite scans...thanks!
![[close > 20.00] and [ema(3,close) x ema(3,close)] The results were good and I even found a Bull Flag formation setting up! Nice. I'll try the other suggestions next.](/docs-images/44/19852302/images/page_7.jpg "I'm a momentum channel trader - I just can't help myself.")
8 8 of 0 /22/203 5:23 PM [type = stock] and [country = us] and [daily volume > ] and [close > 20.00] and [close x ema(3,close)] and [ema(3,close) < 5 days ago ema(3,close)] and [ema(50, close) > 0 days ago ema(50,close)] (Jan 27 '2 at 9:25 I modified the TAZ scan above with 3/ 3 EMA parameters - but I'm still not catching stocks at the beginning of an uptrend - instead the scan brings back stocks that are pulling back to the 3/3 EMA zone near the top of the trend. That's good too (maybe for shorting candidates) - but still not quite what I'm looking for. Any other suggestions for modifying the code below to catch a stock at the beginning of an uptrend with 3/3 EMAs? [type = stock] and [country = us] and[daily ema(60,daily volume) > 50000] and [daily high < yesterday's daily high] and [yesterday's daily high < 2 days ago daily high] and [ema(3, close) > ema(3, close)]and [daily close > daily ema(3,daily close)]and [daily close < daily ema(3,daily close)]and [daily close > daily ema(200,daily close)]and [weekly ema(3,weekly close) > weekly ema(3,weekly close)]and [ADX Line(0) > 20.0]and [close >= 5] link answered Jan 28 '2 at 06: You might want to test your scans by moving back the scan date (time traveling) to see if you are really at the top of an up trend when you get the signal or at the beginning of a much bigger move. When you run the scan, use the Starting "0" days before Last market close (date) feature at the top of the advanced scan page and set the "0" to 0, 20, 30, etc. days back and see what you get. markd (Jan 28 '2 at 2:52 I realized my last chart example wasn't ideal as the entry was below the 200 EMA - so here is a better chart (link) so you can again see what I am shooting for. I'd still appreciate any scanning advice - so far all of the suggestions have been great and are getting me closer and closer to my goal. Keep in mind I am looking for the 3/ 36 EMAs (OR 3/ 3 EMAs ) to cross above the 200 or 50 EMA/ or SMA. By the way, I use Elder Impulse and Keltner Channels, as well as Force Index. FYI - I've been toying around with both PPOs and Range scans too - with so-so results. Thanks! This has been really challenging! LINK FOR CHART : link answered Jan 29 '2 at 09: I wonder if you would feel comfortable with a slight modification to your approach to catch an earlier entry. You have Slow Stochastic on your chart - you could include it in your scan and [min(7,slow Stoch %K(4,3)) < 20] That insures a good dip preceding entry; then, test for close above both emas:
 - but still not quite what I'm looking for.")
9 9 of 0 /22/203 5:23 PM and [close > ema(3,close] and [close > ema(26,close] (or test for just one or either one - watch your "or" syntax) This could get you in before the emas cross over. If you don't want to give up the crossover, maybe use it as confirmation after entry. Just an idea. markd (Jan 29 '2 at 6:44 Thanks again - just tried out the above (scan listed below) and came up with 2 candidates - one of which I am already trading! SWN. How funny. I can see that I can modify this scan a bit more so I'll let you know what I come up with too... [type = stock] and [country = us] and[daily ema(60,daily volume) > ] and [daily high < yesterday's daily high] and [yesterday's daily high < 2 days ago daily high] and [ADX Line(0) > 20.0]and [close >= 5] and [min(7,slow Stoch %K(4,3) < 20] and [close > ema(3,close)] and [close > ema(3,close)] (Jan 29 '2 at 7:06, looks like you tweaking some ideas and getting closer to what you want. Note I've given you another 0 points so you can now save a chart and upload it. Links to charts are nice and other users can see how you set up the chart but if you change the chart and save it the posted link will then pull up the new chart. Sometimes its nice just to have a picture that doesn't change. happy scanning Gord (Jan 30 '2 at 3:45 [type = stock] and [country = us] and [daily ppo line(3,26,9) crosses 0] and [daily ppo line(,26,9) >= ] and [daily ppo line(,3,9) <= ] link answered Feb 05 '2 at 0:25 ekwong 7.5k UPDATE #2: Somebody else just asked how to run a scan that displays stocks where the price is withing 2% of the 50 day moving average - so I changed it to +/-.3% of the 3 EMA and came up with this beauty - It's catching about 20 stocks within the 3/ 26 EMA range - I'm getting closer...i would appreciate some feedback if you have time (does any of it seem redundant?) [type = stock] and [daily ema(20,daily volume) > ] and [close >= ema(3,close) * 0.997] and [close <= ema(3,close) *.003] and [Close >=0] and [Close <=30] link edited Feb 05 '2 at 0:34 answered Feb 05 '2 at 0: This scan is fine. In the end you want to define your parameters -- whether the uptrend indicator is a 3x3 or 3x26, and whether your value zone is 3-26 or some other combination. There's no right or wrong answer on this. ekwong (Feb 05 '2 at 0:36 Thanks for the feedback and you are correct - I need to nail down my parameters once and for all - 3/ 3/ 26/ what have

10 0 of 0 /22/203 5:23 PM you...glad you approve. (Feb 05 '2 at 0:40 2 next page» Your answer [hide preview] Login/Signup to Post Your Answer about faq privacy support contact

Guidelines to use with Fibonacciqueen trade setups!!!
 Guidelines to use with Fibonacciqueen trade setups!!! Updated January 2014 As far as the price analysis that I run every day in the markets, there are three different types of Fibonacci price relationships
Stochastic Oscillator.
 Stochastic Oscillator. By Jay Lakhani www.4x4u.net George Lane was the originator of the stochastic indicator in the 1960 s; the indicator tracks the market momentum. Lane observed that as prices rise
A Practical Guide to Technical Indicators; (Part 1) Moving Averages
 Moving Averages") A Practical Guide to Technical Indicators; (Part 1) Moving Averages By S.A Ghafari Over the past decades, attempts have been made by traders and researchers aiming to find a reliable method to predict
A Practical Guide to Technical Indicators; (Part 1) Moving Averages By S.A Ghafari Over the past decades, attempts have been made by traders and researchers aiming to find a reliable method to predict
FOREIGN EXCHANGE CYCLES:
 January 1999 FOREIGN EXCHANGE CYCLES: Get Ready to Sell the Upcoming Cycle Top in the Dollar versus the Deutschemark Trade Sell the Dollar-Mark on a break below last week's low of 1.6625 and look for 5
Disclaimer: The authors of the articles in this guide are simply offering their interpretation of the concepts. Information, charts or examples
 Disclaimer: The authors of the articles in this guide are simply offering their interpretation of the concepts. Information, charts or examples contained in this lesson are for illustration and educational
4 Hour MACD Forex Strategy
 4 Hour MACD Forex Strategy Welcome to the 4 Hour MACD Forex Strategy. This strategy is aimed at simplicity as well as high probability trades. I have been in the equity market for almost ten years now
Timing the Trade How to Buy Right before a Huge Price Advance
 Timing the Trade How to Buy Right before a Huge Price Advance By now you should have read my first two ebooks and learned about the life cycle of a market, stock, or ETF, and discovered the best indicators
Heikin-Ashi-two-Bar-Strategy Guide to Strategic and Tactical Forex Trading Pull the Trigger and Hit your Targets
 Heikin-Ashi-two-Bar-Strategy Guide to Strategic and Tactical Forex Trading Pull the Trigger and Hit your Targets Currency: EUR/JPY, GBP/JPY Time frame: 5 min Indicators: BB 14, 2, ADX 14, SSD 5, 3, 3,
How To Use Multiple Time Frames For Setups. by Chris Vermeulen
 by Chris Vermeulen A couple months ago I started providing more of my intraday charts in hopes to educate traders on current market conditions so they feel like they are "in the zone" for trading. It's
Module 6.3 Client Catcher The Sequence (Already Buying Leads)
") Module 6.3 Client Catcher The Sequence (Already Buying Leads) Welcome to Module 6.3 of the Client Catcher entitled The Sequence. I recently pulled over 300 of the local lead generation explosion members
Module 6.3 Client Catcher The Sequence (Already Buying Leads) Welcome to Module 6.3 of the Client Catcher entitled The Sequence. I recently pulled over 300 of the local lead generation explosion members
8 Day Intensive Course Lesson 3
 8 Day Intensive Course Lesson 3 A) What are Fibonacci Retracements? Fibonacci Retracements What are Fibonacci retracements? Levels at which the market is expected to retrace to after a strong trend. Based
Understanding the market with PVSRA
 Understanding the market with PVSRA PVSRA PVSRA stands for Price, Volume, Support, Resistance Analysis. Price includes consideration of individual candlestick configurations as well as the pattern, or
Table of Contents. Preface. Chapter 1: TRADING BASICS. Chapter 2: BASIC TOOLS. Chapter 3: ADX. Chapter 4: ACCUMULATION LINE
 Table of Contents Preface Chapter 1: TRADING BASICS Chapter 2: BASIC TOOLS Chapter 3: ADX Chapter 4: ACCUMULATION LINE Chapter 5: AVERAGE TRUE RANGE Chapter 6: CANDLESTICKS Chapter 7: MACD Chapter 8: MOVING
Pin bars: advanced material
 Pin bars: advanced material Lincoln (a.k.a. lwoo034 at Forexfactory.com forums) This tutorial focuses on more advanced pin bar setups. It should only be read after the introductory tutorial as it continues
Presents. The Trading Information Revealed Here is not the Same as the WizardTrader.com Methods -- But Together They Pack a Powerful Punch
 Presents Killer Patterns Now You Can Have These Trading Gems -- Free! The Trading Information Revealed Here is not the Same as the WizardTrader.com Methods -- But Together They Pack a Powerful Punch 1
STREET SMARTS I. Planetary 2 Library. Introduction: Benefits: L I B R A R I E S
 Planetary 2 Library STREET SMARTS I Introduction: In today s world of computer trading, the small speculator often feels at a disadvantage to traders and corporations that have access to more powerful
Advanced Trading Systems Collection MACD DIVERGENCE TRADING SYSTEM
 MACD DIVERGENCE TRADING SYSTEM 1 This system will cover the MACD divergence. With this trading system you can trade any currency pair (I suggest EUR/USD and GBD/USD when you start), and you will always
Building the Forex Traders Foundation. Greg Michalowski Email: greg@fxdd.com www.livestream.com/fxdd Twitter: gregmikefx
 Building the Forex Traders Foundation Greg Michalowski Email: greg@fxdd.com www.livestream.com/fxdd Twitter: gregmikefx Disclaimer Disclaimer High Risk Warning: All news, opinions, research, data, or other
Technical Analysis. Technical Analysis. Schools of Thought. Discussion Points. Discussion Points. Schools of thought. Schools of thought
 The Academy of Financial Markets Schools of Thought Random Walk Theory Can t beat market Analysis adds nothing markets adjust quickly (efficient) & all info is already in the share price Price lies in
I Day. article. In. you but. I just. Entry. Trend. I risk. 2.5% per. equity. a "runner" trading
 Emini Day Trading How I Day Trade for a Living I wish I had a simple answer for you but I don't. Trading is hard, very hard probably the hardest thing you' 'll ever try to do in your life and that's why
How to see the market context using CCI Written by Buzz
 How to see the market context using CCI Written by Buzz Towards the end of September 2003, I decided to stop trading the S&P e-mini for a while and focus on the Russell 2000 e-mini. The swings seemed to
Pivot Point Trading. If you would rather work the pivot points out by yourself, the formula I use is below:
 Pivot Point Trading You are going to love this lesson. Using pivot points as a trading strategy has been around for a long time and was originally used by floor traders. This was a nice simple way for
Secrets for profiting in bull and bear markets Sam Weinstein
 Secrets for profiting in bull and bear markets Sam Weinstein 1. Check market indicators for overall direction 2. Scan the industry groups to know which one to zero in 3. Cull out the stocks with the most
VBM-ADX40 Method. (Wilder, J. Welles from Technical Analysis of Stocks and Commodities, February 1986.)
") VBM-ADX40 Method " I ve found that the most important thing in trading is always doing the right thing, whether or not you win or lose this is market savvy money management... I would go so far as to say
VBM-ADX40 Method " I ve found that the most important thing in trading is always doing the right thing, whether or not you win or lose this is market savvy money management... I would go so far as to say
Trading Lessons from the Intraday Frame (study)
") 1 Daily "Idealized Trades" Report Trading Lessons from the Intraday Frame (study) 1 2 SPY's 1-min Power Trend Chart (Additional Trades) 2 3 Lessons to Learn from Today's Trading Day Let's start as usual
1 Daily "Idealized Trades" Report Trading Lessons from the Intraday Frame (study) 1 2 SPY's 1-min Power Trend Chart (Additional Trades) 2 3 Lessons to Learn from Today's Trading Day Let's start as usual
Day Trading the Dow Jones, DJI
 Day Trading the Dow Jones, DJI Enter a trade on a confirmation of a break of the 100EMA, which is when the price pulls back towards the 100MA and then continues in the direction of the breakout. Stay in
Thinking Man s Trader
 Thinking Man s Trader Advanced Trader s Package Trading is a three dimensional world and the Advanced Trader s Package covers all three. Dimension three: Market Dynamics, conditions and change of conditions
Forex Scalping Cheat Sheets
 Forex Scalping Cheat Sheets By Jason Fielder IMPORTANT: As an added bonus for downloading this report, you also received additional Forex trading reports and videos. To access your bonuses, go to: http://www.triadformula.com/blog/download-cheat-sheets/
marketsurvival.net guide: The advanced guide to fibonacci trading How to trade stocks and Forex with Fibonacci numbers
 marketsurvival.net guide: The advanced guide to fibonacci trading How to trade stocks and Forex with Fibonacci numbers Contents FOREWORD... 5 PART 1. INTRODUCTION...7 WHY IS USING THE FIBONACCI TOOLS BETTER
Trend Determination - a Quick, Accurate, & Effective Methodology
 Trend Determination - a Quick, Accurate, & Effective Methodology By; John Hayden Over the years, friends who are traders have often asked me how I can quickly determine a trend when looking at a chart.
Professional Trader Series: Moving Average Formula & Strategy Guide. by John Person
 Professional Trader Series: Moving Average Formula & Strategy Guide by John Person MOVING AVERAGE FORMULAS & STRATEGY GUIDE In an online seminar conducted for the Chicago Board of Trade, I shared how to
How I Trade Profitably Every Single Month without Fail
 How I Trade Profitably Every Single Month without Fail First of all, let me take some time to introduce myself to you. I am Kelvin and I am a full time currency trader. I have a passion for trading and
The Moving Average. 2004 W. R. Booker II. All rights reserved forever and ever. And ever.
 The Moving Average By Rob Booker 2004 W. R. Booker II. All rights reserved forever and ever. And ever. The information contained in this ebook is designed to teach you methods of watching forex quotes
Using ADX to Trade Breakouts, Pullbacks, and Reversal Patterns. By Puneet Jain CFTe
 Using ADX to Trade Breakouts, Pullbacks, and Reversal Patterns By Puneet Jain CFTe (with DMI) ADX (Average Directional Index) is an indicator that measures trend strength shows trend direction. ADX tells
BunnyGirl s FAQ Rev 1.0
 BunnyGirl s FAQ Rev 1.0 Basic Entry & Exit Conditions Pairs traded EUR-USD, GBP-USD & USD-CHF. EUR-JPY traded sometimes. Other pairs have been tested for this strategy but were deemed not suitable. 5 WMA
Moving Average Method Part 2 by www.surefire-trading.com. Ty Young
 Moving Average Method Part 2 by www.surefire-trading.com Ty Young Hi everyone, this is Ty Young with Surefire-Trading.com. In our last lesson, MA Method Part 1, we demonstrated how Moving Averages could
Alerts & Filters in Power E*TRADE Pro Strategy Scanner
 Alerts & Filters in Power E*TRADE Pro Strategy Scanner Power E*TRADE Pro Strategy Scanner provides real-time technical screening and backtesting based on predefined and custom strategies. With custom strategies,
Earn Money Sharing YouTube Videos
 Earn Money Sharing YouTube Videos Get Started FREE! Make money every time you share a video, also make money every time the videos you have shared get watched! Unleash The Viral Power of Social Media To
The Force 5min system
 The Force 5min system Original Version Traders, Detailed below is my newest strategy. I invite eveyone to try it out as it does produce good profits if traded correctly. By good profits I mean you make
Sample 2014 Trades 1
 Sample 2014 Trades 1 Sample 2014 Trades By Doc Severson Copyright 2015 by Doc Severson All Rights Reserved This training program, or parts thereof, may not be reproduced in any form without the prior written
Trading with the Intraday Multi-View Indicator Suite
 Trading with the Intraday Multi-View Indicator Suite PowerZone Trading, LLC indicators can provide detailed information about the conditions of the intraday market that may be used to spot unique trading
THE CRAIG HARRIS METHOD
 THE CRAIG HARRIS METHOD (The Natural Flow of the Market) BASIC RULES If you haven t already, you will want to watch these videos to get acquainted with the basics of this method: http://www.the-natural-flow.com/back/backfut.html
The Magic Momentum Method of Trading the Forex Market
 The Magic Momentum Method of Trading the Forex Market WELCOME! Welcome to one of the easiest methods of trading the Forex market which you can use to trade most currencies, most time frames and which can
This tutorial was originally titled "Secrets to Successful Short-Term Trading" and was recorded at the Online Trading Expo
 This tutorial was originally titled "Secrets to Successful Short-Term Trading" and was recorded at the Online Trading Expo Day Trading Wizard Using High Probability Support and Resistance Levels with Tony
CHART TRADING GUIDE 1
 CHART TRADING GUIDE 1 How to understand chart trading This guide is designed to teach you the basics of chart trading- the chart patterns that are covered in this booklet can be used for short and medium
THE CYCLE TRADING PATTERN MANUAL
 TIMING IS EVERYTHING And the use of time cycles can greatly improve the accuracy and success of your trading and/or system. THE CYCLE TRADING PATTERN MANUAL By Walter Bressert There is no magic oscillator
Chapter 28 LIQUIDATION
 Chapter 28 LIQUIDATION Knowing when to liquidate a trade is at least as important as knowing when to enter a trade. Since most traders are on the right side of a trade going in, then the problem would
Market Update Toronto 2 spots left / New York still open New High New Low 2 nd edition Specials
 Books & Trades #220 October 16, 2014 Market Update Toronto 2 spots left / New York still open New High New Low 2 nd edition Specials Dear Friend, Books & Trades sent out on September 25 was titled The
TOMORROW'S TRADING TECHNOLOGY. 100% automated Fibonacci support and resistance levels that you can count on every single trading day in an instant.
 TOMORROW'S TRADING TECHNOLOGY 100% automated Fibonacci support and resistance levels that you can count on every single trading day in an instant. ProTrader Table of Contents 1. Areas A. Fibonacci Confluence
Elder-disk for TeleChart (TC2005 / TC2007) Version 2.01
 Version 2.01") Elder-disk for TeleChart (TC2005 / TC2007) Version 2.01 Thank you for purchasing this Elder-disk. It was developed by Dr. Alexander Elder, the author of TRADING FOR A LIVING, COME INTO MY TRADING ROOM,
Elder-disk for TeleChart (TC2005 / TC2007) Version 2.01 Thank you for purchasing this Elder-disk. It was developed by Dr. Alexander Elder, the author of TRADING FOR A LIVING, COME INTO MY TRADING ROOM,
Retracements With TMV
 A Series Of Indicators Used As One Trade Breakouts And Retracements With TMV Making good trading decisions involves finding indicators that cut through the market noise. But how do you do it without collapsing
Ed Heath s Guerilla Swing Trading Plan (as of 1/22/13)
") Ed Heath s Guerilla Swing Trading Plan (as of 1/22/13) Synopsis: I call my trading style Guerilla Swing Trading. I trade upward momentum stocks that have pulled back for a buying opportunity and my goal
Ed Heath s Guerilla Swing Trading Plan (as of 1/22/13) Synopsis: I call my trading style Guerilla Swing Trading. I trade upward momentum stocks that have pulled back for a buying opportunity and my goal
Trading with the High Performance Intraday Analysis Indicator Suite
 Trading with the High Performance Intraday Analysis Indicator Suite PowerZone Trading indicators can provide detailed information about the conditions of the intraday market that may be used to spot unique
Technical Analysis Fibonacci Levels
 Technical Analysis Fibonacci Levels Retracements A retracement is a pullback within the context of a trend. Dip After a rise from 0 to 1, short term market participants start to take profit. This drives
Understanding the market
 Understanding the market Technical Analysis Approach: part I Xiaoguang Wang President, Purdue Quantitative Finance Club PhD Candidate, Department of Statistics Purdue University wang913@purdue.edu Outline
MATHEMATICAL TRADING INDICATORS
 MATHEMATICAL TRADING INDICATORS The mathematical trading methods provide an objective view of price activity. It helps you to build up a view on price direction and timing, reduce fear and avoid overtrading.
Day Trade System EZ Trade FOREX
 Day Trade System The EZ Trade FOREX Day Trading System is mainly used with four different currency pairs; the EUR/USD, USD/CHF, GBP/USD and AUD/USD, but some trades are also taken on the USD/JPY. It uses
Forex Success Formula Presents Forex Success Mini Forex Success Formula Presents Forex Success Mini
 Forex Success Formula Presents Forex Success Mini - 1 www.forexsuccessformula.com/forextradingblog Risk Disclosure Statement The contents of this e-book are for informational purposes only. No Part of
Mark Minervini. Interview with Tim Bourquin
 Mark Minervini Interview with Tim Bourquin Mark Minervini is one of America s most successful stock traders; a veteran on Wall Street with nearly 30 years of experience. He won the 1997 U.S. Investing
SECRETS OF FOREX SCALPING: Cheat Sheets
 SECRETS OF FOREX SCALPING: Cheat Sheets Reviewed and recommended by Rita Lasker & Green Forex Group Disclaimer Please be aware of the loss, risk, personal or otherwise consequences of the use and application
SP500 September 2011 Outlook
 SP500 September 2011 Outlook This document is designed to provide the trader and investor of the Standard and Poor s 500 with an overview of the seasonal tendency as well as the current cyclic pattern
PART 1 CROSSING EMA. I will pause between the two parts for questions, but if I am not clear enough at any stage please feel free to interrupt.
 PART 1 CROSSING EMA Good evening everybody, I d like to start by introducing myself. My name is Andrew Gebhardt and I am part of Finex LLP, a small Investment Manager which amongst other endeavours also
Reading Gaps in Charts to Find Good Trades
 Reading Gaps in Charts to Find Good Trades One of the most rewarding and challenging things I have done in my 40-year trading career is teach elementary school students the basics of technical analysis
Using Order Book Data
 Q3 2007 Using Order Book Data Improve Automated Model Performance by Thom Hartle TradeFlow Charts and Studies - Patent Pending TM Reprinted from the July 2007 issue of Automated Trader Magazine www.automatedtrader.net
atching Currency Moves with The Schaff Trend Cycle Indicator
 JULY/AUGUST 2002. VOLUME 4 CRunning a trend indicator through a cycle oscillator creates an effective entry technique into today s strongly trending currency markets, says Doug Schaff, a 20-year veteran
PRUDENT TRADER! METHODS FOR! INDIVIDUAL STOCK SELECTION
 PRUDENT TRADER METHODS FOR INDIVIDUAL STOCK SELECTION 1 of 15 TABLE OF CONTENTS TABLE OF CONTENTS 2 INTRODUCTION 3 STOCK WATCH LIST 5 THE STOCK SCREENS 8 TRADING MASTERS SCREEN 10 STOCK SCREENS- OTHER
TRADING WITH THE GUPPY MULTIPLE MOVING AVERAGE
 TRADING WITH THE GUPPY MULTIPLE MOVING AVERAGE By Daryl Guppy 2003 Director www.guppytraders.com Author Market Trading Tactics, Better Stock Trading This Guppy Multiple Moving Average (GMMA) indicator
I found a gorgeous swing on a 240-minute bar chart of the euro FX against the US dollar FX chart. Let's take a look at it:
 Tips for Traders 4/13/2009 10:38:00 AM The Right Way to Use Lines in Trading I have been working with lines as my main trading tool for more than 38 years now. Lines are simple, lines A trader e-mailed
Chapter 1 Introduction Disclaimer: Forex Involves risk. So if you lose money you can't blame us we told you trading involves risk.
 By Casey Stubbs -Winners Edge Trading.com Table of Contents Chapter 1. Introduction Chapter 2.. Trading Plan Chapter 3.. Money Management Chapter 4. Moving Average Strategy Chapter 5. Stochastic Strategy
A GUIDE TO WL INDICATORS
 A GUIDE TO WL INDICATORS GETTING TECHNICAL ABOUT TRADING: USING EIGHT COMMON INDICATORS TO MAKE SENSE OF TRADING What s a technical indicator and why should I use them? What s the market going to do next?
CYCLE TIMING CAN IMPROVE YOUR TIMING PERFORMANCE by Walter Bressert, CTA
 CYCLE TIMING CAN IMPROVE YOUR TIMING PERFORMANCE by Walter Bressert, CTA The HOLY GRAIL OF TRADING is: Trade with the trend; if up, buy the dips; if down, sell the rallies. With cycles you can identify
Technical Indicators Tutorial - Forex Trading, Currency Forecast, FX Trading Signal, Forex Training Cour...
 Page 1 Technical Indicators Tutorial Technical Analysis Articles Written by TradingEducation.com Technical Indicators Tutorial Price is the primary tool of technical analysis because it reflects every
Elliott-Wave Fibonacci Spread Trading
 Elliott-Wave Fibonacci Spread Trading Presented by Ryan Sanden The inevitable disclaimer: Nothing presented constitutes a recommendation to buy or sell any security. While the methods described are believed
Trading Power Trends with ADX
 Trading Power Trends with ADX By Dr. Charles B. Schaap, Jr. International Trader s Expo New York City 18 February 2014 Disclaimer The information in this lecture is for educational purposes. No particular
My Favorite Futures Setups. By John F. Carter www.tradethemarkets.com
 My Favorite Futures Setups By John F. Carter www.tradethemarkets.com Recognizing Momentum Incredibly easy to do in hindsight. Get in Before the Move? I m a big believer in not chasing markets. By the time
Everything is a series of facts surrounded by other circumstances.
 Following are several trade ideas based upon the concepts we employ to observe the twoway auction process. This serves as a list of various market situations and criteria to help Intensive traders distill
3 New Books: Trading Price Action TRENDS Trading Price Action TRADING RANGES Trading Price Action REVERSALS. Available on Amazon and Wiley
 3 New Books: Trading Price Action TRENDS Trading Price Action TRADING RANGES Trading Price Action REVERSALS Available on Amazon and Wiley Traders run it, I provide content Free articles Free detailed analysis
8 Day Intensive Course Lesson 5 Stochastics & Bollinger Bands
 8 Day Intensive Course Lesson 5 Stochastics & Bollinger Bands A)Trading with Stochastic Trading With Stochastic What is stochastic? Stochastic is an oscillator that works well in range-bound markets.[/i]
Why the E.A.S.Y. Method?
 Why the E.A.S.Y. Method? Mark Douglas, author of Trading in the Zone, states: The best traders have developed an edge and more importantly, they trust their edge. Why the E.A.S.Y. Method? My trading edge
NO PART OF THIS E-BOOK MAY BE REPRODUCED FOR PERSONAL OR COMMERCIAL PURPOSE WITHOUT THE EXPRESS PERMISSION OF MARKET GEEKS LLC www.marketgeeks.
 NO PART OF THIS E-BOOK MAY BE REPRODUCED FOR PERSONAL OR COMMERCIAL PURPOSE WITHOUT THE EXPRESS PERMISSION OF MARKET GEEKS LLC www.marketgeeks.com TABLE OF CONTENTS Introduction 2 My Story 3 Years Later
Methods to Trade Forex Successfully for Quick Profits
 Methods to Trade Forex Successfully for Quick Profits This article is devoted to the techniques that are used to trade Forex on an intraday basis for quick profits. The aim is to make the trading a successful
LIVE@ W O R K B O O K
 LIVE @ W O R K B O O K SHORT SKIRT TRADING The Most Bang for the Buck in the Least Amount of Time. By Linda Raschke COVERING: INDICES, DAY TRADING AND MONEY MANAGEMENT Linda will teach the "Short Skirt"
Forex Success Formula. Presents. Secure Your Money. www.forexsuccessformula.com - 1 -
 Forex Success Formula Presents Secure Your Money www.forexsuccessformula.com - 1 - Risk Disclosure Statement The contents of this e-book are for informational purposes only. No Part of this publication
Chapter 2.3. Technical Analysis: Technical Indicators
 Chapter 2.3 Technical Analysis: Technical Indicators 0 TECHNICAL ANALYSIS: TECHNICAL INDICATORS Charts always have a story to tell. However, from time to time those charts may be speaking a language you
Trading Binary Options Strategies and Tactics
 Trading Binary Options Strategies and Tactics Binary options trading is not a gamble or a guessing game. By using both fundamental and technical market analysis, you are able to get a better understanding
5min Forex Trade Strategy Imran Sait Version 1.2 updated on 16 th Nov 2007
 5min Forex Trade Strategy Imran Sait Version 1.2 updated on 16 th Nov 2007 ( Works on All Time Frames and for all Pairs - Best used on 5Min/15min/ for short term Trades and 30min/1Hr/4hr/daily for Long
Short Selling With PennyStocker.com. Table of Contents
 Table of Contents Chapter 1 Introduction Chapter 2 Make Money When Penny Stocks Go Down What Is Shorting? Taking Advantage of Pumps and Dumps Charting Your Way to Success Chapter 3 The Fabulous Four The
Free Report. My Top 10 Tips to Betting Like a Pro With Zero Risk
 Free Report My Top 10 Tips to Betting Like a Pro With Zero Risk Legal Disclaimer: EVERY EFFORT HAS BEEN MADE TO ACCURATELY REPRESENT THIS PRODUCT AND IT'S POTENTIAL. EVEN THOUGH THIS INDUSTRY IS ONE OF
BULLS ON WALL ST. 60 DAY TRADING BOOTCAMP
 BULLS ON WALL ST. 60 DAY TRADING BOOTCAMP Lead Instructor Kunal Desai Assistant Instructors Maribeth Willoughby Dr. Andrew Menaker Course Description This 60 day course teaches a setup based system to
I would like to thank everyone who has helped me to, finally get to the end of the beginning of my trading.
 I would like to thank everyone who has helped me to, finally get to the end of the beginning of my trading. Davin Clark, Chris Shea Toni Turner-short-term trading in the new stock market. John Carter-mastering
Airplane Buying Cheat Sheet. How To Get A Discount On Your Next Airplane:
 Airplane Buying Cheat Sheet Disclaimer: Make sure you always get professional legal advice & used licenced technicians when you are doing your inspections. This information is used at your own risk...
How long have you been trading? The Discerning Trader: Linda Bradford Raschke
 Stocks & Commodities V. 11:9 (360-366): The Discerning Trader: Linda Bradford Raschke by Thom Hartle The Discerning Trader: Linda Bradford Raschke Contrary to popular opinion, dreams can come true. For
Trading The Euro: Box It, Squeeze It, Love It, Leave It
 Trading The Euro: Box It, Squeeze It, Love It, Leave It by: John Carter Think inside the box when trading currency pairs, and identify boxes on currency charts to create better trading setups. [Editor
Leon Wilson Trading Success
 Leon Wilson Trading Success A talk given by Mary de la Lande to the BullCharts User Group Meeting on 13 February 2008 1. Who is Leon Wilson? His Books and where to get them. 2. Book 1: The Business of
Trader s Guide. Updated March 2014
 Trader s Guide Updated March 2014 Welcome to this basic introduction to the Trigger Trade Report, FTMDaily s unique stock trading system. This simple guide will explain how to get started using our trading
My Techniques for making $150 a Day Trading Forex *Note for my more Advanced Strategies check out my site: Click Here
 My Techniques for making $150 a Day Trading Forex *Note for my more Advanced Strategies check out my site: Click Here The Strategy We will be looking at 2 different ways to day trade the Forex Markets.
A Quick Tutorial in MACD: Basic Concepts. By Gerald Appel and Marvin Appel
 A Quick Tutorial in MACD: Basic Concepts By Gerald Appel and Marvin Appel The Moving Average Convergence-Divergence Indicator (MACD) has been a staple of technical analysis since Gerald invented it more
No duplication of transmission of the material included within except with express written permission from the author.
 Copyright Option Genius LLC. All Rights Reserved No duplication of transmission of the material included within except with express written permission from the author. Be advised that all information is
THE MOST POWERFUL DAY TRADING SETUP PERIOD!
 THE MOST POWERFUL DAY TRADING SETUP PERIOD! In this pdf I will show you how I combine my institutional numbers with my 40-60 number count 9 and 13 setups. Below you will find my concrete rules on when
http://asiatopforex.blogspot.com
 Asia Top Forex Trading Systems Tutorials All trading examples in this group are for educational purposes only. I will post updates on current charts but any trading decisions are yours. The following systems