Voyagers and Voyeurs Supporting Social Data Analysis
|
|
|
- Bertram Lawrence Shields
- 7 years ago
- Views:
Transcription
1 Voyagers and Voyeurs Supporting Social Data Analysis Jeffrey Heer Computer Science Department Stanford University CIDR 2009 Monterey, CA 5 January 2009
2 A Tale of Two Visualizations

3 vizster
4 Observations Groups spent more time in front of the visualization than individuals. Friends encouraged each other to unearth relationships, probe community boundaries, and challenge reported information. Social play resulted in informal analysis, often driven by story-telling of group histories.

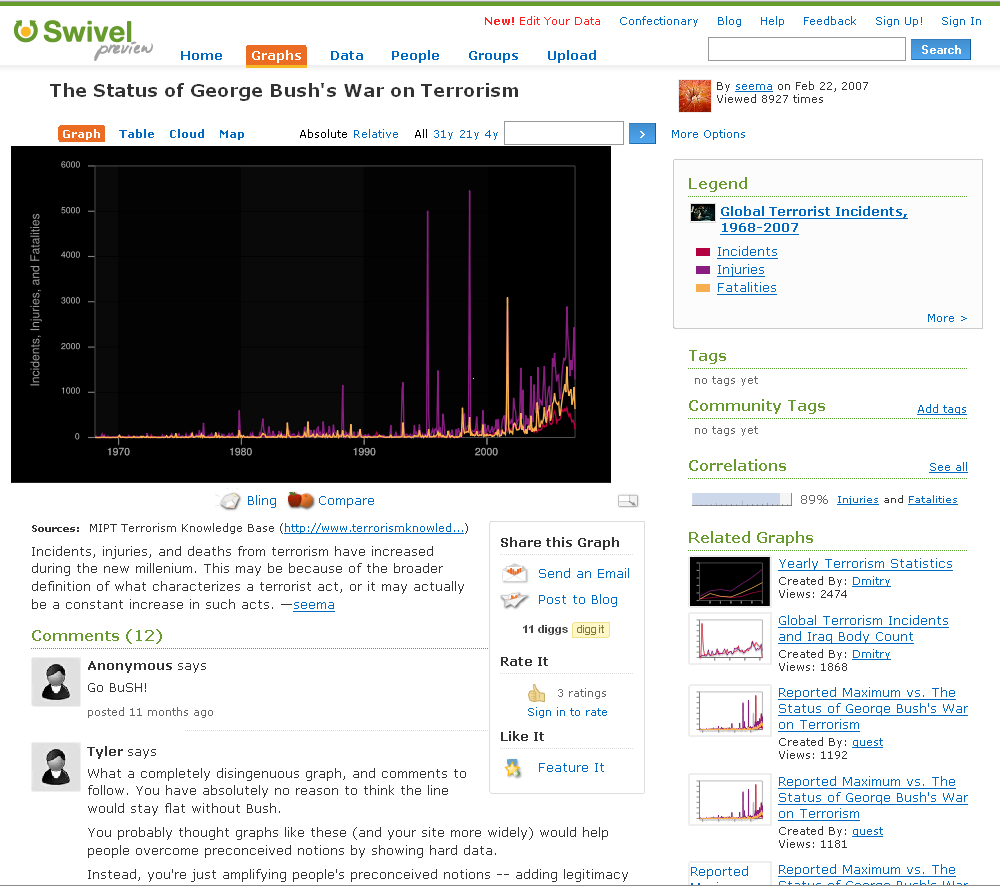
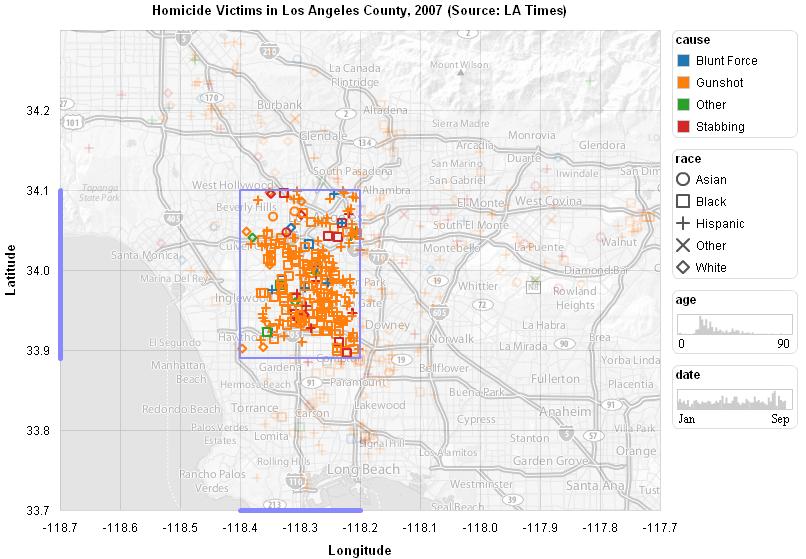
5 NameVoyager The Baby Name Voyager

6

7

8

9
10 Social Data Analysis Visual sensemaking can be social as well as cognitive. Analysis of data coupled with social interpretation and deliberation. How can user interfaces catalyze and support collaborative visual analysis?
11 sense.us A Web Application for Collaborative Visualization of Demographic Data

12


13 Voyagers and Voyeurs Complementary faces of analysis Voyager focus on visualized data Active engagement with the data Serendipitous comment discovery Voyeur focus on comment listings Investigate others explorations Find people and topics of interest Catalyze new explorations
14 Out of the Lab, Into the Wild
15
16
17 Wikimapia.org

18 DecisionSite posters Spotfire Decision Site Posters

19 Tableau Server
20
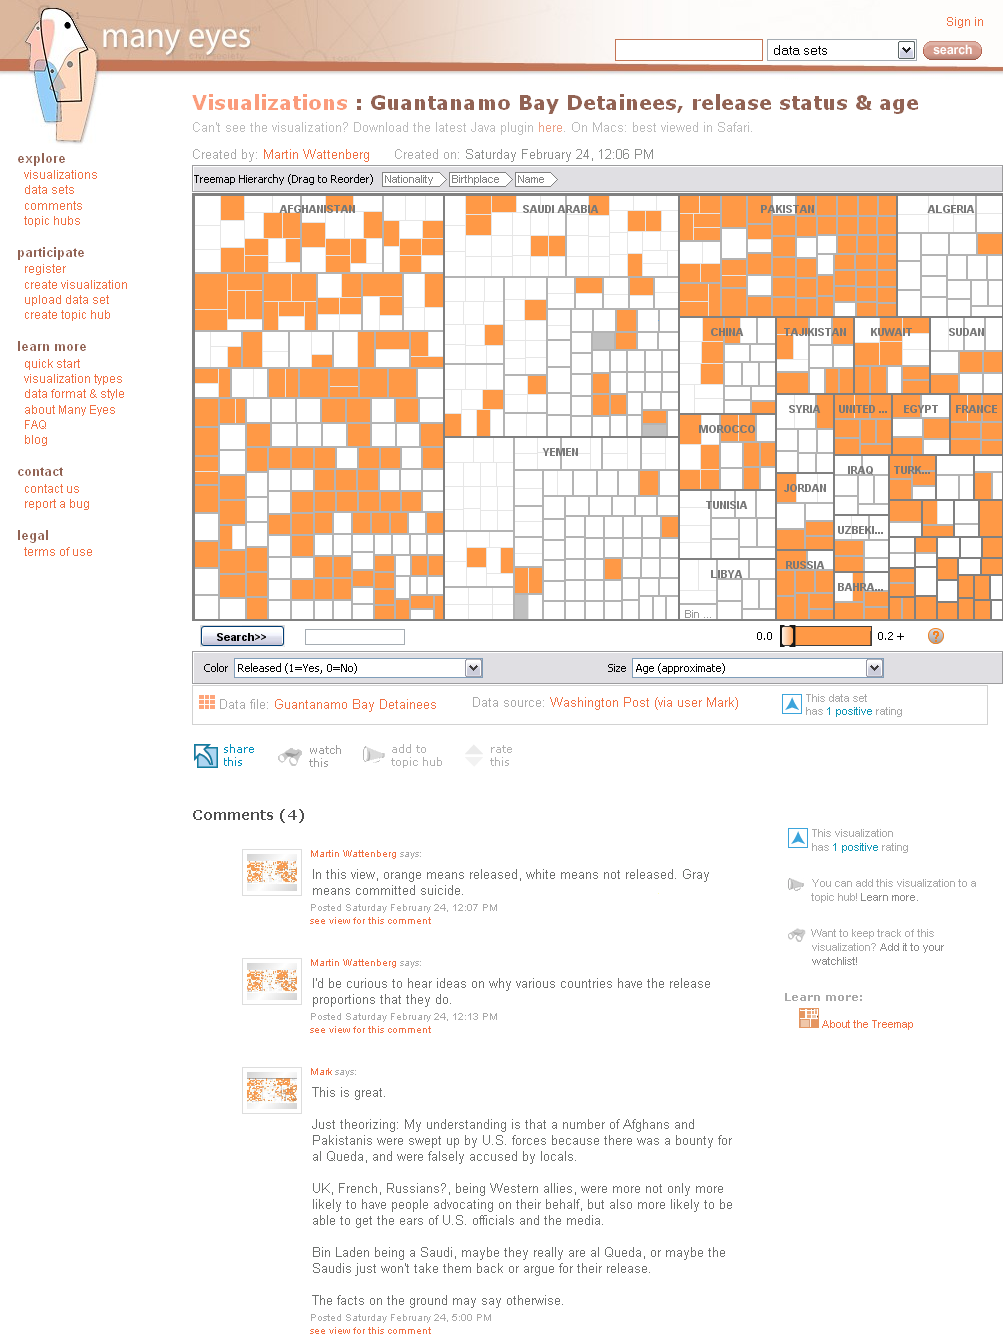
21 Many-Eyes
22 Social Data Analysis In Action 1. Discussion and Debate 2. Text is Data, Too 3. Data Integrity and Cleaning 4. Integrating Data in Context 5. Pointing and Naming For each, some thoughts on future directions. I asked my colleagues: if you could give database researchers a wish list, what would it be?
23 Discussion and Debate

24

25
26
27 Tableau X-Box / Quest Diag? Valley of Death
28
29

30
31 Content Analysis of Comments Observation Question Hypothesis Data Integrity Linking Socializing System Design Testing Tips To-Do Affirmation Sense.us Percentage Service Many-Eyes Percentage Feature prevalence from content analysis (min Cohen s =.74) High co-occurrence of Observations, Questions, and Hypotheses


32 WANTED: Structured Conversation Reduce the cost of synthesizing contributions Wikipedia: Shared Revisions NASA ClickWorkers: Statistics
33 WANTED: Structured Conversation Reduce the cost of synthesizing contributions Can we represent data, visualizations, and social activity in a unified data model?
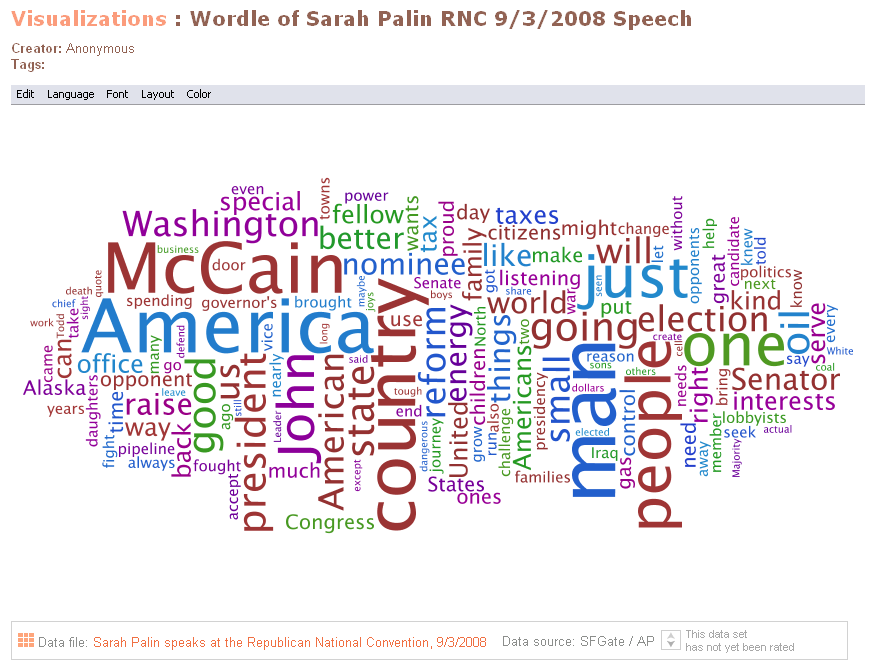
34 Text is Data, Too
35 Visualization Popularity Tag Cloud Bubble Graph Word Tree Bar Chart Maps Network Diagram Treemap Matrix Chart Line Graph Scatterplot Stacked Graph Pie Chart Histogram Many-Eyes Service Swivel Percentage Percentage Over 1/3 of Many-Eyes visualizations use free text
36

37 Alberto Gonzales
38 WANTED: Better Tools for Text Statistical Analysis of text (with ties to source!) Entity Extraction Aggregation and Comparison of texts Get a global view of documents We can do better than Tag Clouds (!?) Use text analysis tools to enable analysis of structured conversation by the community.
39 Data Integrity and Cleaning

40 No cooks in 1910? There may have been cooks then. But maybe not.

41 The great postmaster scourge of 1910? Or just a bug in the data?

42
43
44 Content Analysis of Comments Observation Question Hypothesis Data Integrity Linking Socializing System Design Testing Tips To-Do Affirmation Sense.us Percentage Service Many-Eyes Percentage 16% of sense.us comments and 10% of Many-Eyes comments reference data quality or integrity.
45 WANTED: Data Cleaning Tools Reshape data, reformat rows & columns Handle missing data: label, repair, interpolate Entity resolution and de-duplication Group related values into aggregates Assist table lookups & data transforms Provide tools in situ to leverage collective Transparency requires provenance
46 Integrating Data in Context

47

48
49 College Drug Use
50 College Drug Use

51 Harry Potter is Freaking Popular

52
53 WANTED: In-Situ Data Integration Search for and suggest related data or views User input for types, schema matching, or data Apply in context of the current task But record mappings for future use Record provenance: chain of data sources Examples: Google Web Tables, Pay-As-You-Go, Stanford Vispedia, Utah VisTrails
54 Pointing and Naming
55 Look at that spike.
56 Look at the spike for Turkey.

57 Look at the spike in the middle.
58 Free-form Data-aware
59 Visual Queries Model selections as declarative queries over interface elements or underlying data ( lon AND lon )AND ( lat AND lat )
60 Visual Queries Model selections as declarative queries over interface elements or underlying data Applicable to dynamic, time-varying data Retarget selection across visual encodings Support social navigation and data mining
61 WANTED: Data-Aware Annotation Meta-queries linking annotations to views Visually specifying notification triggers Annotating data aggregates (use lineage?) Unified model (again!) to facilitate reference How to make it work at scale? How else to use machine-readable annotations? Can annotations be used to steer data mining?
62 Conclusion
63 Social Data Analysis Collective analysis of data supported by social interaction. 1. Discussion and Debate 2. Text is Data, Too 3. Data Integrity and Cleaning 4. Integrating Data in Context 5. Pointing and Naming
64 Summary As visualization becomes common on the web, opportunities for collaborative analysis abound. Weave visualizations into the web: data access, visualization creation, view sharing and pointing. Support discovery, discussion, and integration of contributions to leverage the collective. Improve both processes and technologies for communication and dissemination.
65 Parting Thoughts Visualizations may have a catalytic effect on social interaction around data. Encourage participation by minimizing or offsetting interaction costs. Provide incentives by fostering the personal relevance of the data.
66 Berkeley: Maneesh Agrawala, Wes Willett, danah boyd, Marti Hearst, Joe IBM: Martin Wattenberg, Fernanda PARC: Stu Tableau: Jock Mackinlay, Chris Stolte, Christian Chabot
67 Voyagers and Voyeurs Supporting Social Data Analysis Jeffrey Heer Stanford University
68 With a collaborative spirit, with a collaborative platform where people can upload data, explore data, compare solutions, discuss the results, build consensus, we can engage passionate people, local communities, media and this will raise - incredibly - the amount of people who can understand what is going on. And this would have fantastic outcomes: the engagement of people, especially new generations; it would increase knowledge, unlock statistics, improve transparency and accountability of public policies, change culture, increase numeracy, and in the end, improve democracy and welfare. Enrico Giovannini, Chief Statistician, OECD. June 2007.
Understanding Data: A Comparison of Information Visualization Tools and Techniques
 Understanding Data: A Comparison of Information Visualization Tools and Techniques Prashanth Vajjhala Abstract - This paper seeks to evaluate data analysis from an information visualization point of view.
research topics in Data Visualization Jeffrey Heer Stanford University
 research topics in Data Visualization Jeffrey Heer Stanford University Set A Set B Set C Set D X Y X Y X Y X Y 10 8.04 10 9.14 10 7.46 8 6.58 8 6.95 8 8.14 8 6.77 8 5.76 13 7.58 13 8.74 13 12.74 8 7.71
Analysis and Comparison of Data Visualization using two Popular Tools: Many Eyes and Swivel.
 Analysis and Comparison of Data Visualization using two Popular Tools: Many Eyes and Swivel. Radmila Berger, Iosif Berger, Irina Ilyaguyeva, Vera Gabidova Abstract We analyze and compare visualization
Survey Public Visualization Services
 Survey Public Visualization Services Stefan Kölbl Markus Unterleitner Benedict Wright Graz University of Technology A-8010 Graz, Austria 4 May 2012 Abstract This survey is about public visualization services.
Information Visualization Evaluation and User Study
 Evaluation for Information Visualization Enrico Bertini http://www.dis.uniroma1.it/~beliv06/infovis-eval.html Information Visualization Evaluation and User Study CSE591 Visual Analytics Lujin Wang Component/system
Many Eyes: A Site for Visualization at Internet Scale
 Many Eyes: A Site for Visualization at Internet Scale Fernanda B. Viégas, Martin Wattenberg, Frank van Ham, Jesse Kriss, Matt McKeon Abstract We describe the design and deployment of Many Eyes, a public
Web Data Visualization
 Web Data Visualization Department of Communication PhD Student Workshop Web Mining for Communication Research April 22-25, 2014 http://weblab.com.cityu.edu.hk/blog/project/workshops Jie Qin & Hexin Chen
Visualization Software
 Visualization Software Maneesh Agrawala CS 294-10: Visualization Fall 2007 Assignment 1b: Deconstruction & Redesign Due before class on Sep 12, 2007 1 Assignment 2: Creating Visualizations Use existing
XpoLog Center Suite Log Management & Analysis platform
 XpoLog Center Suite Log Management & Analysis platform Summary: 1. End to End data management collects and indexes data in any format from any machine / device in the environment. 2. Logs Monitoring -
A Guide to Preparing Your Data for Tableau
 White Paper A Guide to Preparing Your Data for Tableau Written in collaboration with Chris Love, Alteryx Grand Prix Champion Consumer Reports, which runs more than 1.8 million surveys annually, saved thousands
Voyagers and Voyeurs: Supporting Asynchronous Collaborative Information Visualization
 Voyagers and Voyeurs: Supporting Asynchronous Collaborative Information Visualization Jeffrey Heer Berkeley Institute of Design and Computer Science Division University of California, Berkeley Berkeley
Visualization methods for patent data
 Visualization methods for patent data Treparel 2013 Dr. Anton Heijs (CTO & Founder) Delft, The Netherlands Introduction Treparel can provide advanced visualizations for patent data. This document describes
All Visualizations Documentation
 All Visualizations Documentation All Visualizations Documentation 2 Copyright and Trademarks Licensed Materials - Property of IBM. Copyright IBM Corp. 2013 IBM, the IBM logo, and Cognos are trademarks
Enterprise Data Visualization and BI Dashboard
 Strengths Key Features and Benefits Ad-hoc Visualization and Data Discovery Prototyping Mockups Dashboards The application is web based and can be installed on any windows or linux server. There is no
Connecting the Dots in Visual Analysis
 Connecting the Dots in Visual Analysis Yedendra B. Shrinivasan Eindhoven University of Technology The Netherlands David Gotz IBM Research USA Jie Lu IBM Research USA ABSTRACT During visual analysis, users
Collaborative Visualization for Supporting the Analysis of Mobile Device Data
 Collaborative Visualization for Supporting the Analysis of Mobile Device Data Thomas Ludwig, Tino Hilbert and Volkmar Pipek Abstract Visualizations are mainly used for providing easy access to complex
How Mathematicians Connect: Visualizing the Mathematics Genealogy Project
 How Mathematicians Connect: Visualizing the Mathematics Genealogy Project Mark Horowitz, Amy Skinner, Julie Pignataro, Kendra K. Levine ischool of Drexel University mdh47@drexel.edu, als92@drexel.edu,
Tableau Your Data! Wiley. with Tableau Software. the InterWorks Bl Team. Fast and Easy Visual Analysis. Daniel G. Murray and
 Tableau Your Data! Fast and Easy Visual Analysis with Tableau Software Daniel G. Murray and the InterWorks Bl Team Wiley Contents Foreword xix Introduction xxi Part I Desktop 1 1 Creating Visual Analytics
BBBT Podcast Transcript
 BBBT Podcast Transcript About the BBBT Vendor: The Boulder Brain Trust, or BBBT, was founded in 2006 by Claudia Imhoff. Its mission is to leverage business intelligence for industry vendors, for its members,
Information & Data Visualization. Yasufumi TAKAMA Tokyo Metropolitan University, JAPAN ytakama@sd.tmu.ac.jp
 Information & Data Visualization Yasufumi TAKAMA Tokyo Metropolitan University, JAPAN ytakama@sd.tmu.ac.jp 1 Introduction Contents Self introduction & Research purpose Social Data Analysis Related Works
PBI365: Data Analytics and Reporting with Power BI
 POWER BI FOR BUSINESS ANALYSTS AND POWER USERS 3 DAYS PBI365: Data Analytics and Reporting with Power BI AUDIENCE FORMAT COURSE DESCRIPTION Business Analysts, Statisticians and Data Scientists Instructor-led
Data Collection. Acquisition. Cleaning. Integration. Visualization. Analysis. Presentation. Jeffrey Heer Stanford University.
 CS448G :: 4 Apr 2011 Data Collection Acquisition Cleaning Integration Visualization Analysis Presentation Jeffrey Heer Stanford University Dissemination cabspotting.org Wikipedia History Flow (IBM) 1 Information
Data Visualization. or Graphical Data Presentation. Jerzy Stefanowski Instytut Informatyki
 Data Visualization or Graphical Data Presentation Jerzy Stefanowski Instytut Informatyki Data mining for SE -- 2013 Ack. Inspirations are coming from: G.Piatetsky Schapiro lectures on KDD J.Han on Data
The Definitive Guide to Preparing Your Data for Tableau
 The Definitive Guide to Preparing Your Data for Tableau Speed Your Time to Visualization If you re like most data analysts today, creating rich visualizations of your data is a critical step in the analytic
Business Intelligence as a Service for the G-Cloud
 Service Definition The name of the Service is: Business Intelligence as a Service An overview of Business Intelligence (BI) as a Service The BI service supports intelligent decisions by business users
<no narration for this slide>
 1 2 The standard narration text is : After completing this lesson, you will be able to: < > SAP Visual Intelligence is our latest innovation
CIS4930/6930 Data Science: Large-scale Advanced Data Analysis Fall 2011. Daisy Zhe Wang CISE Department University of Florida
 CIS4930/6930 Data Science: Large-scale Advanced Data Analysis Fall 2011 Daisy Zhe Wang CISE Department University of Florida 1 Vital Information Instructor: Daisy Zhe Wang Office: E456 Class time: Tuesdays
JRefleX: Towards Supporting Small Student Software Teams
 JRefleX: Towards Supporting Small Student Software Teams Kenny Wong, Warren Blanchet, Ying Liu, Curtis Schofield, Eleni Stroulia, Zhenchang Xing Department of Computing Science University of Alberta {kenw,blanchet,yingl,schofiel,stroulia,xing}@cs.ualberta.ca
Digital Asset Management in Museums
 Digital Asset Management in Museums Workflows and Integration Chris Hoffman (chris.hoffman@berkeley.edu) Research IT, UC Berkeley Introductions Definitions o o Outline How they digital asset management
Uptime Cloud Monitor Case Study. FeedMagnet
 Uptime Cloud Monitor Case Study FeedMagnet FeedMagnet uses IDERA s Uptime Cloud Monitor s server monitoring to troubleshoot issues and diagnose poor performance with the combination of real-time and historical
CIS 467/602-01: Data Visualization
 CIS 467/602-01: Data Visualization Maps Dr. David Koop Assignment 3 http://www.cis.umassd.edu/ ~dkoop/cis467/assignment3.html Networks and Maps Little East Women's Basketball data Network of games with
Dynamic Visualization and Time
 Dynamic Visualization and Time Markku Reunanen, marq@iki.fi Introduction Edward Tufte (1997, 23) asked five questions on a visualization in his book Visual Explanations: How many? How often? Where? How
VISUAL ANALYSIS OF DOCUMENT TRIAGE DATA
 Zhao Geng, Robert S. Laramee Visual Computing Group, Computer Science Department, Swansea University, Swansea, U.K. {cszg, r.s.laramee}@swansea.ac.uk Fernando Loizides, George Buchanan Centre for HCI Design,
Visualizing Big Data. Activity 1: Volume, Variety, Velocity
 Visualizing Big Data Mark Frydenberg Computer Information Systems Department Bentley University mfrydenberg@bentley.edu @checkmark OBJECTIVES A flood of information online from tweets, news feeds, status
Interactive information visualization in a conference location
 Interactive information visualization in a conference location Maria Chiara Caschera, Fernando Ferri, Patrizia Grifoni Istituto di Ricerche sulla Popolazione e Politiche Sociali, CNR, Via Nizza 128, 00198
Slide 1 Investigative Reporting and Data Visualization at the high school level
 Script: Investigative Reporting and Data Visualization Faculty member: Mike Jenner Slide 1 Investigative Reporting and Data Visualization at the high school level Slide 2 Investigative journalism can turn
CSE 512: Data Visualization Course Overview & Curriculum Content
 CSE 512: Data Visualization Course Overview & Curriculum Content The world is awash with increasing amounts of data, and we must keep afloat with our relatively constant perceptual and cognitive abilities.
Visual Analytics on Public Sector Open Access Data
 Visual Analytics on Public Sector Open Access Data Dr. Andreas S. Maniatis Commercial Manager / Head of BI CyberStream LTD Big Data and Business Analytics: Theory and Practice Wednesday, October 24 th
SalesLogix Advanced Analytics
 SalesLogix Advanced Analytics SalesLogix Advanced Analytics Benefits Snapshot Increase organizational and customer intelligence by analyzing data from across your business. Make informed business decisions
Collaboration. Michael McCabe Information Architect mmccabe@gig-werks.com. black and white solutions for a grey world
 Collaboration Michael McCabe Information Architect mmccabe@gig-werks.com black and white solutions for a grey world Slide Deck & Webcast Recording links Questions and Answers We will answer questions at
A Measurement Study of Two Web-based Collaborative Visual Analytics Systems
 A Measurement Study of Two Web-based Collaborative Visual Analytics Systems Kristi Morton 1, Magdalena Balazinska 1, Dan Grossman 1, Robert Kosara 2,3, Jock Mackinlay 3, and Alon Halevy 4 1 University
STAT REVIEW/EXECUTIVE DASHBOARD TASK ORDER EXECUTIVE DASHBOARD SYNTHESIS OF BEST PRACTICES
 STAT REVIEW/EXECUTIVE DASHBOARD TASK ORDER EXECUTIVE DASHBOARD SYNTHESIS OF BEST PRACTICES October 26, 2011 This publication was produced for review by the United States Agency for International Development.
2014 Capstone Project - Project Proposal. Mail+ Explore, Reflect, Reminisce on Your Email Archive. Zening Qu, Jessie Liyin Xue, Yeaseul Kim
 2014 Capstone Project - Project Proposal Mail+ Explore, Reflect, Reminisce on Your Email Archive Qu, Jessie Liyin Xue, Yeaseul Kim Human Centered Design & Engineering University of Washington Mail+ is
A GENERAL TAXONOMY FOR VISUALIZATION OF PREDICTIVE SOCIAL MEDIA ANALYTICS
 A GENERAL TAXONOMY FOR VISUALIZATION OF PREDICTIVE SOCIAL MEDIA ANALYTICS Stacey Franklin Jones, D.Sc. ProTech Global Solutions Annapolis, MD Abstract The use of Social Media as a resource to characterize
Server Load Prediction
 Server Load Prediction Suthee Chaidaroon (unsuthee@stanford.edu) Joon Yeong Kim (kim64@stanford.edu) Jonghan Seo (jonghan@stanford.edu) Abstract Estimating server load average is one of the methods that
Oracle Big Data SQL Technical Update
 Oracle Big Data SQL Technical Update Jean-Pierre Dijcks Oracle Redwood City, CA, USA Keywords: Big Data, Hadoop, NoSQL Databases, Relational Databases, SQL, Security, Performance Introduction This technical
Sisense. Product Highlights. www.sisense.com
 Sisense Product Highlights Introduction Sisense is a business intelligence solution that simplifies analytics for complex data by offering an end-to-end platform that lets users easily prepare and analyze
Senior Business Intelligence/Engineering Analyst
 We are very interested in urgently hiring 3-4 current or recently graduated Computer Science graduate and/or undergraduate students and/or double majors. NetworkofOne is an online video content fund. We
Evaluating the impact of research online with Google Analytics
 Public Engagement with Research Online Evaluating the impact of research online with Google Analytics The web provides extensive opportunities for raising awareness and discussion of research findings
City of St. Petersburg, Florida Fiscal & Budget Transparency Tool User Guide. Last Updated: March 2015
 City of St. Petersburg, Florida Fiscal & Budget Transparency Tool User Guide Last Updated: March 2015 St. Petersburg s Fiscal and Budget Transparency Tool allows you to explore budget and historical finances
TACOMA POWER UTILITY TECHNOLOGY SERVICES
 TACOMA POWER UTILITY TECHNOLOGY SERVICES REQUEST FOR INFORMATION NATURAL RESOURCES OPERATIONAL ANALYTICS SPECIFICATION NO. PS16-0021F City of Tacoma Tacoma Power / Utility Technology Services REQUEST FOR
A Visualization is Worth a Thousand Tables: How IBM Business Analytics Lets Users See Big Data
 White Paper A Visualization is Worth a Thousand Tables: How IBM Business Analytics Lets Users See Big Data Contents Executive Summary....2 Introduction....3 Too much data, not enough information....3 Only
Data Visualization Techniques
 Data Visualization Techniques From Basics to Big Data with SAS Visual Analytics WHITE PAPER SAS White Paper Table of Contents Introduction.... 1 Generating the Best Visualizations for Your Data... 2 The
Microsoft SharePoint 2010
 Tips & Tricks (page 1/5) 1. You should check out a document only if you want to make sure that no one else can change it until you check it back in. If you want to collaborate on a document, do not check
GETTING STARTED WITH R AND DATA ANALYSIS
 GETTING STARTED WITH R AND DATA ANALYSIS [Learn R for effective data analysis] LEARN PRACTICAL SKILLS REQUIRED FOR VISUALIZING, TRANSFORMING, AND ANALYZING DATA IN R One day course for people who are just
Easily Identify Your Best Customers
 IBM SPSS Statistics Easily Identify Your Best Customers Use IBM SPSS predictive analytics software to gain insight from your customer database Contents: 1 Introduction 2 Exploring customer data Where do
TABLEAU COURSE CONTENT. Presented By 3S Business Corporation Inc www.3sbc.com Call us at : 281-823-9222 Mail us at : info@3sbc.com
 TABLEAU COURSE CONTENT Presented By 3S Business Corporation Inc www.3sbc.com Call us at : 281-823-9222 Mail us at : info@3sbc.com Introduction and Overview Why Tableau? Why Visualization? Level Setting
Information Visualization Multivariate Data Visualization Krešimir Matković
 Information Visualization Multivariate Data Visualization Krešimir Matković Vienna University of Technology, VRVis Research Center, Vienna Multivariable >3D Data Tables have so many variables that orthogonal
WebFOCUS RStat. RStat. Predict the Future and Make Effective Decisions Today. WebFOCUS RStat
 Information Builders enables agile information solutions with business intelligence (BI) and integration technologies. WebFOCUS the most widely utilized business intelligence platform connects to any enterprise
Wonderware SmartGlance
 Wonderware SmartGlance Features 01 SUMMARY Mobile Reporting offered by Schneider Electric provides real-time access to critical KPIs and process or operational data via popular smart phones and tablets.
Information Visualisation and Visual Analytics for Governance and Policy Modelling
 Information Visualisation and Visual Analytics for Governance and Policy Modelling Jörn Kohlhammer 1, Tobias Ruppert 1, James Davey 1, Florian Mansmann 2, Daniel Keim 2 1 Fraunhofer IGD, Fraunhoferstr.
Application Of Business Intelligence In Agriculture 2020 System to Improve Efficiency And Support Decision Making in Investments.
 Application Of Business Intelligence In Agriculture 2020 System to Improve Efficiency And Support Decision Making in Investments Anuraj Gupta Department of Electronics and Communication Oriental Institute
How to Create Dashboards. Published 2014-08
 How to Create Dashboards Published 2014-08 Table of Content 1. Introduction... 3 2. What you need before you start... 3 3. Introduction... 3 3.1. Open dashboard Example 1... 3 3.2. Example 1... 4 3.2.1.
JAVASCRIPT CHARTING. Scaling for the Enterprise with Metric Insights. 2013 Copyright Metric insights, Inc.
 JAVASCRIPT CHARTING Scaling for the Enterprise with Metric Insights 2013 Copyright Metric insights, Inc. A REVOLUTION IS HAPPENING... 3! Challenges... 3! Borrowing From The Enterprise BI Stack... 4! Visualization
www.tekclasses.com +91-8970005497/+91-7411642061 info@tekclasses.com / contact@tekclasses.com TABLEAU TRAINING DURATION 30hrs
 TABLEAU TRAINING DURATION 30hrs AVAILABLE BATCHES WEEKDAYS (6.30AM TO 7.30AM) & WEEKENDS (10AM TO 1PM) MODE OF TRAINING AVAILABLE ONLINE INSTRUCTOR LED CLASSROOM TRAINING (MARATHAHALLI, BANGALORE) SELF
Turning Data into Information Tools, Tips, and Training
 A Summer Series Sponsored by Erin Gore, Institutional Data Council Chair; Berkeley Policy Analysts Roundtable, Business Process Analysis Working Group (BPAWG) and Cal Assessment Network (CAN) Web Data
Exercises for Data Visualisation for Analysis in Scholarly Research
 Exercises for Data Visualisation for Analysis in Scholarly Research Exercise 1: exploring network visualisations 1. In your browser, go to http://bit.ly/11qqxuj 2. Scroll down the page to the network graph.
How To Analyze Data
 Interaction Breakthroughs in Wrangling Data Joe Hellerstein Jeffrey Heer Sean Kandel BACKGROUND: A SMALL PROJECT d p = data people http://deepresearch.org Computing is free. Storage is free. Data is abundant.
Tableau Tutorial. User Documentation. Archit Sood, Neha Sinha, Shashank Dewjee, and Wei Zhao
 Tableau Tutorial User Documentation Archit Sood, Neha Sinha, Shashank Dewjee, and Wei Zhao Table of Contents Introduction... 2 Tableau desktop (Business analytics anyone can use)... 2 Tableau server...
Principles of Data Visualization for Exploratory Data Analysis. Renee M. P. Teate. SYS 6023 Cognitive Systems Engineering April 28, 2015
 Principles of Data Visualization for Exploratory Data Analysis Renee M. P. Teate SYS 6023 Cognitive Systems Engineering April 28, 2015 Introduction Exploratory Data Analysis (EDA) is the phase of analysis
Myths and Strategies of Defect Causal Analysis
 Proceedings: Pacific Northwest Software Quality Conference, October 2006 Myths and Strategies of Defect Causal Analysis David N. Card Q-Labs, Inc. dca@q-labs.com Biography David N. Card is a fellow of
CS171 Visualization. The Visualization Alphabet: Marks and Channels. Alexander Lex alex@seas.harvard.edu. [xkcd]
![CS171 Visualization. The Visualization Alphabet: Marks and Channels. Alexander Lex alex@seas.harvard.edu. [xkcd]](/thumbs/39/19465011.jpg "CS171 Visualization. The Visualization Alphabet: Marks and Channels. Alexander Lex alex@seas.harvard.edu. [xkcd]") CS171 Visualization Alexander Lex alex@seas.harvard.edu The Visualization Alphabet: Marks and Channels [xkcd] This Week Thursday: Task Abstraction, Validation Homework 1 due on Friday! Any more problems
CS171 Visualization Alexander Lex alex@seas.harvard.edu The Visualization Alphabet: Marks and Channels [xkcd] This Week Thursday: Task Abstraction, Validation Homework 1 due on Friday! Any more problems
Business Intelligence and Process Modelling
 Business Intelligence and Process Modelling F.W. Takes Universiteit Leiden Lecture 2: Business Intelligence & Visual Analytics BIPM Lecture 2: Business Intelligence & Visual Analytics 1 / 72 Business Intelligence
Implementing a Data Warehouse with Microsoft SQL Server 2012 MOC 10777
 Implementing a Data Warehouse with Microsoft SQL Server 2012 MOC 10777 Course Outline Module 1: Introduction to Data Warehousing This module provides an introduction to the key components of a data warehousing
Medical Data Review and Exploratory Data Analysis using Data Visualization
 Paper PP10 Medical Data Review and Exploratory Data Analysis using Data Visualization VINOD KERAI, ROCHE, WELWYN, UKINTRODUCTION Drug Development has drastically changed in the last few decades. There
Graphical Overlays: Using Layered Elements to Aid Chart Reading
 Graphical s: Using Layered Elements to Aid Chart Reading Nicholas Kong and Maneesh Agrawala 1 Original chart 2 Chart with gridlines 3 Line to illustrate trend 4 Mean line Fig. 1. In this chart of the European
Visualizations. Cyclical data. Comparison. What would you like to show? Composition. Simple share of total. Relative and absolute differences matter
 Visualizations Variable width chart Table or tables with embedded charts Bar chart horizontal Circular area chart per item Many categories Cyclical data Non-cyclical data Single or few categories Many
INFO 424, UW ischool 11/8/2007
 Today s Lecture Case Studies in Interactive Infovis Design Spence, Information Visualization Chapters 2 & 6.1, 6.2, 6.5 Thursday 8 Nov 2007 Polle Zellweger User-centered design process Overview Applied
Access to a unified real-time solution enables your company to make informed decisions and maximize profitability.
 FEATURES OVERVIEW The Operational Networked Elements (ONE) platform serves as the base infrastructure and information integration for B2W Estimate and the B2W Operational Suite unifying resources across
Beginning Oracle. Application Express 4. Doug Gault. Timothy St. Hilaire. Karen Cannell. Martin D'Souza. Patrick Cimolini
 Beginning Oracle Application Express 4 Doug Gault Karen Cannell Patrick Cimolini Martin D'Souza Timothy St. Hilaire Contents at a Glance About the Authors Acknowledgments iv xv xvil 0 Chapter 1: An Introduction
Sizing the Horizon: The Effects of Chart Size and Layering on the Graphical Perception of Time Series Visualizations
 Sizing the Horizon: The Effects of Chart Size and Layering on the Graphical Perception of Time Series Visualizations Jeffrey Heer 1, Nicholas Kong 2, and Maneesh Agrawala 2 1 Computer Science Department
Part 2: Data Visualization How to communicate complex ideas with simple, efficient and accurate data graphics
 Part 2: Data Visualization How to communicate complex ideas with simple, efficient and accurate data graphics Why visualize data? The human eye is extremely sensitive to differences in: Pattern Colors
Cours de Visualisation d'information InfoVis Lecture. Multivariate Data Sets
 Cours de Visualisation d'information InfoVis Lecture Multivariate Data Sets Frédéric Vernier Maître de conférence / Lecturer Univ. Paris Sud Inspired from CS 7450 - John Stasko CS 5764 - Chris North Data
BI Requirements Checklist
 The BI Requirements Checklist is designed to provide a framework for gathering user requirements for BI technology. The framework covers, not only the obvious BI functions, but also the follow-up actions
Flexible Web Visualization for Alert-Based Network Security Analytics
 Flexible Web Visualization for Alert-Based Network Security Analytics Lihua Hao 1, Christopher G. Healey 1, Steve E. Hutchinson 2 1 North Carolina State University, 2 U.S. Army Research Laboratory lhao2@ncsu.edu
Enterprise Resource Planning Analysis of Business Intelligence & Emergence of Mining Objects
 Enterprise Resource Planning Analysis of Business Intelligence & Emergence of Mining Objects Abstract: Build a model to investigate system and discovering relations that connect variables in a database
How To Identify Technical Debt In Java (Tty) On A Microsoft Powerbook (V0.2.2) On An Ipa (Microsoft) Microsoft Microsoft (Powerbook) On Microsoft.Com (V1
 On A Microsoft Powerbook (V0.2.2) On An Ipa (Microsoft) Microsoft Microsoft (Powerbook) On Microsoft.Com (V1") visualization and representation for scientific analysis Seminar Foundations in Empirical Software Engineering Dominik Münch Institut für Informatik Software & Systems Engineering ization The use of computer-supported,
visualization and representation for scientific analysis Seminar Foundations in Empirical Software Engineering Dominik Münch Institut für Informatik Software & Systems Engineering ization The use of computer-supported,
Big Data and Healthcare Payers WHITE PAPER
 Knowledgent White Paper Series Big Data and Healthcare Payers WHITE PAPER Summary With the implementation of the Affordable Care Act, the transition to a more member-centric relationship model, and other
Practical Data Visualization
 Practical Data Visualization March 18, 2015 COMPSCI 216: Everything Data Angela Zoss Data Visualization Coordinator Data and Visualization Services WHY VISUALIZE? Preserve complexity Anscombe s Quartet
INCREMENTAL, APPROXIMATE DATABASE QUERIES AND UNCERTAINTY FOR EXPLORATORY VISUALIZATION. Danyel Fisher Microso0 Research
 INCREMENTAL, APPROXIMATE DATABASE QUERIES AND UNCERTAINTY FOR EXPLORATORY VISUALIZATION Danyel Fisher Microso0 Research Exploratory Visualiza9on Ini9al Query Process query Get a response Change parameters
Innovative Information Visualization of Electronic Health Record Data: a Systematic Review
 Innovative Information Visualization of Electronic Health Record Data: a Systematic Review Vivian West, David Borland, W. Ed Hammond February 5, 2015 Outline Background Objective Methods & Criteria Analysis
Tutorial for proteome data analysis using the Perseus software platform
 Tutorial for proteome data analysis using the Perseus software platform Laboratory of Mass Spectrometry, LNBio, CNPEM Tutorial version 1.0, January 2014. Note: This tutorial was written based on the information
What s new in TIBCO Spotfire 6.5
 What s new in TIBCO Spotfire 6.5 Contents Introduction... 3 TIBCO Spotfire Analyst... 3 Location Analytics... 3 Support for adding new map layer from WMS Server... 3 Map projections systems support...
White Paper April 2006
 White Paper April 2006 Table of Contents 1. Executive Summary...4 1.1 Scorecards...4 1.2 Alerts...4 1.3 Data Collection Agents...4 1.4 Self Tuning Caching System...4 2. Business Intelligence Model...5
MicroStrategy Desktop
 MicroStrategy Desktop Quick Start Guide MicroStrategy Desktop is designed to enable business professionals like you to explore data, simply and without needing direct support from IT. 1 Import data from
Understanding and Evaluating the BI Platform by Cindi Howson
 Understanding and Evaluating the BI Platform by Cindi Howson All rights reserved. Reproduction in whole or part prohibited except by written permission. Product and company names mentioned herein may be
Create a free CRM with Google Apps
 Create a free CRM with Google Apps By Richard Ribuffo Contents Introduction, pg. 2 Part One: Getting Started, pg. 3 Creating Folders, pg. 3 Clients, pg. 4 Part Two: Google Forms, pg. 6 Creating The Form,
CSU, Fresno - Institutional Research, Assessment and Planning - Dmitri Rogulkin
 My presentation is about data visualization. How to use visual graphs and charts in order to explore data, discover meaning and report findings. The goal is to show that visual displays can be very effective
INTRAFOCUS. DATA VISUALISATION An Intrafocus Guide
 DATA VISUALISATION An Intrafocus Guide September 2011 Table of Contents What is Data Visualisation?... 2 Where is Data Visualisation Used?... 3 The Market View... 4 What Should You Look For?... 5 The Key
SBI2013: Building BI Solutions using Excel and SharePoint 2013
 UNDERSTANDING MICROSOFT'S BI TOOLSET 3 DAYS SBI2013: Building BI Solutions using Excel and AUDIENCE FORMAT COURSE DESCRIPTION Business Analysts and Excel Power Users Instructor-led training with hands-on