Six Sigma: Capability Measures, Specifications & Control Charts
|
|
|
- Joan Baldwin
- 9 years ago
- Views:
Transcription
1 Six Sigma: Capability Measures, Specifications & Control Charts Short Examples Series using Risk Simulator For more information please visit: or contact us at:

2 Six Sigma Statistical and Unit Capability Measures, Specification Levels and Control Charts File Names: Six Sigma Statistical Capability; Six Sigma Unit Capability, and Six Sigma Control Charts Location: Modeling Toolkit Six Sigma Brief Description: These two Six Sigma models illustrate how to obtain the various capability measures such as the capability index (Cpk and Cp), yields, defects per million opportunities (DPMO) and others Requirements: Modeling Toolkit, Risk Simulator Modeling Toolkit Functions Used: B2SixSigmaStatCP, B2SixSigmaStatCPK, B2SixSigmaStatDPU, B2SixSigmaStatDPMO, B2SixSigmaStatProcessSigma, B2SixSigmaUnitDPU, B2SixSigmaUnitDPMO, B2SixSigmaUnitYield, B2SixSigmaUnitCPK, B2SixSigmaUnitProcessSigma Capability Measures (Cp and Cpk) and Specification Levels (USL and LSL) Capability measures in Six Sigma are the central analytics in quality control. Defective Proportion Units (DPUs) are the number of defects observed with respect to the total opportunities or outcomes, and can be measured with respect to a million opportunities (defective parts per million, DPPM, or also known as the defects per million opportunities, DPMO). Process Capability Index or Cpk takes into account the offcentered distribution and analyzing it as a centered process producing a similar level of defects (defined as the ratio between permissible deviation, measured from the mean value to the nearest specific limit of acceptability, and the actual one-sided 3 sigma spread of the process). Simplistically, it measures how many times you can fit three standard deviations of the process between the mean of the process and the nearest specification limit. Assuming that the process is stable and predictable, if you can do this once, Cpk is 1, and your process probably needs attention. If you can do it 1.5 times, your process is excellent, and you are on the path to being able to discontinue final inspection. If you can do it 2 times, you have an outstanding process. If Cpk is negative, the process mean is outside the specification limits. Cpk of at least 1.33 is desired. Finally, the sigma of the process is determined. Typically, this process sigma value can be used to compare before and after effects of some quality improvement program, or to see if the process is up to par in terms of a target sigma level. This statistical capability model uses as inputs, the statistical properties of the process, including the observed mean and standard deviation (sigma), as well as predefined lower and upper specification limits (LSLs and USLs). In contrast, the Unit Capability model computes some of the same capability measures but uses actual number of defects and population size. In addition, the Cp index is computed, which relates to the potential of the process to meet specification, regardless of where the process distribution falls. The process may not be performing within specifications, but the index tells you how the process will perform if you can shift the distribution mean to the desired target (without changing the distribution). If we have a Cp of 2.0, it has the potential to be a Six Sigma process. In contrast, Cpk
 and Specification Levels (USL")
3 actually compares the distribution of the data to the specification limits to determine its actual performance. If we have a Cpk of 2.0, you have a Six Sigma process. As discussed, a Cpk of at least 1.33 is desired, and 1.5 is excellent. See Figure 1. Figure 1: Six Sigma capability modeling Quality Control Charts Sometimes the specification limits are not set; instead, statistical control limits are computed based on the actual data collected (e.g., the number of defects in a manufacturing line). For instance, in Figure 2, we see 20 sample experiments or samples taken at various times of a manufacturing process. The number of samples taken varied over time, and the number of defective parts were also gathered. The upper control limit (UCL) and lower control limit (LCL) are computed, as are the central line (CL) and other sigma levels. The resulting chart is called a control chart, and if the process if out of control, the actual defect line will be outside of the UCL and LCL lines. Typically, when the LCL is a negative value, we set the floor as zero, as illustrated in Figure 2.

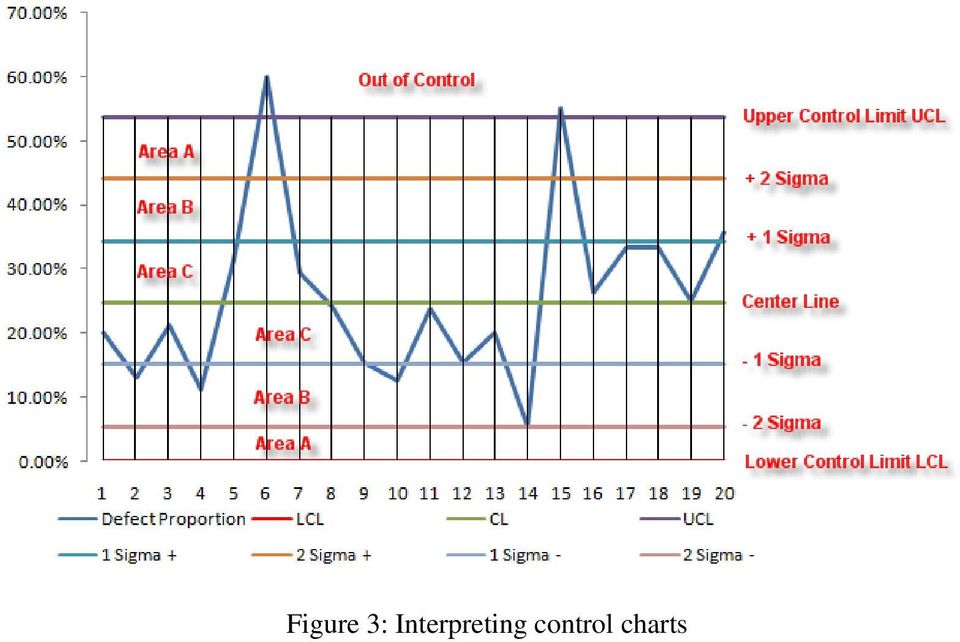
4 Figure 2: Example quality control p-chart In the interpretation of a control chart, by adding in the +/ 1 and 2 sigma lines, we can divide the control charts into several areas or zones, as illustrated in Figure 3. The following are rules of thumb that typically apply to control charts to determine if the process is out of control: If one point is beyond Area A If two out of three consecutive points are in Area A or beyond If four out of five consecutive points are in Area B or beyond If eight consecutive points are in Area C or beyond Additionally, a potential structural shift can be detected if any one of the following occurs: At least 10 out of 11 sequential points are on one side of the CL At least 12 out of 14 sequential points are on one side of the CL At least 14 out of 17 sequential points are on one side of the CL At least 16 out of 20 sequential points are on one side of the CL The Modeling Toolkit presents several control chart types, and each type is used under different circumstances: X chart: used when the variable has raw data values and there are multiple measurements in a sample experiment, and multiple experiments are run, and the average of the collected data is of interest

5 R chart: used when the variable has raw data values and there are multiple measurements in a sample experiment, and multiple experiments are run, and the range of the collected data is of interest XmR chart: used when the variable has raw data values and is a single measurement taken in each sample experiment, and multiple experiments are run, and the actual value of the collected data is of interest P-chart: used when the variable of interest is an attribute (e.g., defective or non-defective) and the data collected are in proportions of defects (or number of defects in a specific sample) and there are multiple measurements in a sample experiment, and multiple experiments are run, and the average proportion of defects of the collected data is of interest, also, the number of samples collected in each experiment differs NP-chart: used when the variable of interest is an attribute (e.g., defective or non-defective) and the data collected are in proportions of defects (or number of defects in a specific sample) and there are multiple measurements in a sample experiment, and multiple experiments are run, and the average proportion of defects of the collected data is of interest, also, the number of samples collected in each experiment is constant for all experiments C-chart: used when the variable of interest is an attribute (e.g., defective or non-defective) and the data collected are in total number of defects (actual count in units) and there are multiple measurements in a sample experiment, and multiple experiments are run, and the average number of defects of the collected data is of interest, also, the number of samples collected in each experiment are the same U-chart: used when the variable of interest is an attribute (e.g., defective or non-defective) and the data collected are in total number of defects (actual count in units) and there are multiple measurements in a sample experiment, and multiple experiments are run, and the average number of defects of the collected data is of interest, also, the number of samples collected in each experiment differs
 and the data collected are in proportions of defects (or number of defects in a specific sample) and there are multiple measurements in a sample experiment, and multiple")
6 Figure 3: Interpreting control charts
Confidence Intervals for Cp
 Chapter 296 Confidence Intervals for Cp Introduction This routine calculates the sample size needed to obtain a specified width of a Cp confidence interval at a stated confidence level. Cp is a process
Confidence Intervals for Cpk
 Chapter 297 Confidence Intervals for Cpk Introduction This routine calculates the sample size needed to obtain a specified width of a Cpk confidence interval at a stated confidence level. Cpk is a process
STATISTICAL QUALITY CONTROL (SQC)
") Statistical Quality Control 1 SQC consists of two major areas: STATISTICAL QUALITY CONTOL (SQC) - Acceptance Sampling - Process Control or Control Charts Both of these statistical techniques may be applied
Statistical Quality Control 1 SQC consists of two major areas: STATISTICAL QUALITY CONTOL (SQC) - Acceptance Sampling - Process Control or Control Charts Both of these statistical techniques may be applied
SPC Response Variable
 SPC Response Variable This procedure creates control charts for data in the form of continuous variables. Such charts are widely used to monitor manufacturing processes, where the data often represent
Individual Moving Range (I-MR) Charts. The Swiss Army Knife of Process Charts
 Charts. The Swiss Army Knife of Process Charts") Individual Moving Range (I-MR) Charts The Swiss Army Knife of Process Charts SPC Selection Process Choose Appropriate Control Chart ATTRIBUTE type of data CONTINUOUS DEFECTS type of attribute data DEFECTIVES
Individual Moving Range (I-MR) Charts The Swiss Army Knife of Process Charts SPC Selection Process Choose Appropriate Control Chart ATTRIBUTE type of data CONTINUOUS DEFECTS type of attribute data DEFECTIVES
SPC Demonstration Tips
 Tip Sheet SPC Demonstration Tips Key Points to Cover When Demonstrating Ignition SPC Downtime In general, the SPC Module is designed with a great level of flexibility to support a wide variety of production
Control Charts for Variables. Control Chart for X and R
 Control Charts for Variables X-R, X-S charts, non-random patterns, process capability estimation. 1 Control Chart for X and R Often, there are two things that might go wrong in a process; its mean or its
Statistical Process Control (SPC) Training Guide
 Training Guide") Statistical Process Control (SPC) Training Guide Rev X05, 09/2013 What is data? Data is factual information (as measurements or statistics) used as a basic for reasoning, discussion or calculation. (Merriam-Webster
Statistical Process Control (SPC) Training Guide Rev X05, 09/2013 What is data? Data is factual information (as measurements or statistics) used as a basic for reasoning, discussion or calculation. (Merriam-Webster
Instruction Manual for SPC for MS Excel V3.0
 Frequency Business Process Improvement 281-304-9504 20314 Lakeland Falls www.spcforexcel.com Cypress, TX 77433 Instruction Manual for SPC for MS Excel V3.0 35 30 25 LSL=60 Nominal=70 Capability Analysis
THE PROCESS CAPABILITY ANALYSIS - A TOOL FOR PROCESS PERFORMANCE MEASURES AND METRICS - A CASE STUDY
 International Journal for Quality Research 8(3) 399-416 ISSN 1800-6450 Yerriswamy Wooluru 1 Swamy D.R. P. Nagesh THE PROCESS CAPABILITY ANALYSIS - A TOOL FOR PROCESS PERFORMANCE MEASURES AND METRICS -
Software Quality. Unit 2. Advanced techniques
 Software Quality Unit 2. Advanced techniques Index 1. Statistical techniques: Statistical process control, variable control charts and control chart for attributes. 2. Advanced techniques: Quality function
Capability Analysis Using Statgraphics Centurion
 Capability Analysis Using Statgraphics Centurion Neil W. Polhemus, CTO, StatPoint Technologies, Inc. Copyright 2011 by StatPoint Technologies, Inc. Web site: www.statgraphics.com Outline Definition of
Statistical Process Control Basics. 70 GLEN ROAD, CRANSTON, RI 02920 T: 401-461-1118 F: 401-461-1119 www.tedco-inc.com
 Statistical Process Control Basics 70 GLEN ROAD, CRANSTON, RI 02920 T: 401-461-1118 F: 401-461-1119 www.tedco-inc.com What is Statistical Process Control? Statistical Process Control (SPC) is an industrystandard
STATISTICAL REASON FOR THE 1.5σ SHIFT Davis R. Bothe
 STATISTICAL REASON FOR THE 1.5σ SHIFT Davis R. Bothe INTRODUCTION Motorola Inc. introduced its 6σ quality initiative to the world in the 1980s. Almost since that time quality practitioners have questioned
Figure 1: Working area of the plastic injection moulding company. Figure 2: Production volume, quantity of defected parts, and DPPM
 1. Title : BLACK DOT DEFECT REDUCTION IN PLASTIC INJECTION MOULDING PROCESS 2. Student Name: Mr. Itthiwat Rattanabunditsakun / ID: 557 12290 21 Advisor Name: Assoc. Prof. Parames Chutima, Ph.D. 3. Problem
Appling Process Capability Analysis in Measuring Clinical Laboratory Quality - A Six Sigma Project
 Proceedings of the 2014 International Conference on Industrial Engineering and Operations Management Bali, Indonesia, January 7 9, 2014 Appling Process Capability Analysis in Measuring Clinical Laboratory
Optimization: Optimal Pricing with Elasticity
 Optimization: Optimal Pricing with Elasticity Short Examples Series using Risk Simulator For more information please visit: www.realoptionsvaluation.com or contact us at: [email protected]
Statistical Quality Control
 Statistical Quality Control CHAPTER 6 Before studying this chapter you should know or, if necessary, review 1. Quality as a competitive priority, Chapter 2, page 00. 2. Total quality management (TQM) concepts,
Product Quality Management
 Product Quality Management Deborah Baly, Ph.D Sr. Director, Commercial Product Quality Management, GNE/ROCHE 1 Presentation Outline: Product Quality Management Regulatory landscape and need for integrated
Advanced Topics in Statistical Process Control
 Advanced Topics in Statistical Process Control The Power of Shewhart s Charts Second Edition Donald J. Wheeler SPC Press Knoxville, Tennessee Contents Preface to the Second Edition Preface The Shewhart
Statistical Process Control OPRE 6364 1
 Statistical Process Control OPRE 6364 1 Statistical QA Approaches Statistical process control (SPC) Monitors production process to prevent poor quality Acceptance sampling Inspects random sample of product
Learning Objectives. Understand how to select the correct control chart for an application. Know how to fill out and maintain a control chart.
 CONTROL CHARTS Learning Objectives Understand how to select the correct control chart for an application. Know how to fill out and maintain a control chart. Know how to interpret a control chart to determine
THE SIX SIGMA BLACK BELT PRIMER
 INTRO-1 (1) THE SIX SIGMA BLACK BELT PRIMER by Quality Council of Indiana - All rights reserved Fourth Edition - September, 2014 Quality Council of Indiana 602 West Paris Avenue West Terre Haute, IN 47885
Control CHAPTER OUTLINE LEARNING OBJECTIVES
 Quality Control 16Statistical CHAPTER OUTLINE 16-1 QUALITY IMPROVEMENT AND STATISTICS 16-2 STATISTICAL QUALITY CONTROL 16-3 STATISTICAL PROCESS CONTROL 16-4 INTRODUCTION TO CONTROL CHARTS 16-4.1 Basic
Solutions. Quality & Productivity SPC OEE MONITORING TRACEABILITY WIP TRACKING. SPC Charts. Email Alarms. Data Collection.
 Quality & Productivity Solutions SPC OEE MONITORING TRACEABILITY WIP TRACKING SPC Charts Email Alarms Data Collection Gauge Interfacing Production Reports Monitoring FACSMonitor gives you the opportunity
Lean Six Sigma Analyze Phase Introduction. TECH 50800 QUALITY and PRODUCTIVITY in INDUSTRY and TECHNOLOGY
 TECH 50800 QUALITY and PRODUCTIVITY in INDUSTRY and TECHNOLOGY Before we begin: Turn on the sound on your computer. There is audio to accompany this presentation. Audio will accompany most of the online
CHAPTER 13. Control Charts
 13.1 Introduction 1 CHAPTER 13 Control Charts This chapter discusses a set of methods for monitoring process characteristics over time called control charts and places these tools in the wider perspective
Managerial Statistics Module 10
 Title : STATISTICAL PROCESS CONTROL (SPC) Period : 4 hours I. Objectives At the end of the lesson, students are expected to: 1. define statistical process control 2. describe the fundamentals of SPC and
The G Chart in Minitab Statistical Software
 The G Chart in Minitab Statistical Software Background Developed by James Benneyan in 1991, the g chart (or G chart in Minitab) is a control chart that is based on the geometric distribution. Benneyan
Application of JM-SPC program for statistical control of foundry production processes
 A R C H I V E S of F O U N D R Y E N G I N E E R I N G Published quarterly as the organ of the Foundry Commission of the Polish Academy of Sciences ISSN (1897-3310) Volume 8 Issue 3/2008 153 158 30/3 Application
Process Quality. BIZ2121-04 Production & Operations Management. Sung Joo Bae, Assistant Professor. Yonsei University School of Business
 BIZ2121-04 Production & Operations Management Process Quality Sung Joo Bae, Assistant Professor Yonsei University School of Business Disclaimer: Many slides in this presentation file are from the copyrighted
A Study on Code Peer Review Process Monitoring using Statistical Process Control
 A Study on Code Peer Review Process Monitoring using Statistical Process Control Alhassan Muhammad Abubakar Faculty of Computing, Universiti Teknologi Malaysia, 81310, Skudai, Johor Email: [email protected]
Simulation and Lean Six Sigma
 Hilary Emmett, 22 August 2007 Improve the quality of your critical business decisions Agenda Simulation and Lean Six Sigma What is Monte Carlo Simulation? Loan Process Example Inventory Optimization Example
THE OPEN SOURCE SOFTWARE R IN THE STATISTICAL QUALITY CONTROL
 1. Miriam ANDREJIOVÁ, 2. Zuzana KIMÁKOVÁ THE OPEN SOURCE SOFTWARE R IN THE STATISTICAL QUALITY CONTROL 1,2 TECHNICAL UNIVERSITY IN KOŠICE, FACULTY OF MECHANICAL ENGINEERING, KOŠICE, DEPARTMENT OF APPLIED
Leading Indicators for Project Management
 Leading Indicators for Project Management Project Headlights Dave Card [email protected] Agenda Motivation Headlights Strategies for Leading Indicators Common Leading Indicators Back-up Lights Summary
Six Sigma Acronyms. 2-1 Do Not Reprint without permission of
 Six Sigma Acronyms $k Thousands of dollars $M Millions of dollars % R & R Gauge % Repeatability and Reproducibility ANOVA Analysis of Variance AOP Annual Operating Plan BB Black Belt C & E Cause and Effects
z-scores AND THE NORMAL CURVE MODEL
 z-scores AND THE NORMAL CURVE MODEL 1 Understanding z-scores 2 z-scores A z-score is a location on the distribution. A z- score also automatically communicates the raw score s distance from the mean A
DISCRETE MODEL DATA IN STATISTICAL PROCESS CONTROL. Ester Gutiérrez Moya 1. Keywords: Quality control, Statistical process control, Geometric chart.
 VI Congreso de Ingeniería de Organización Gijón, 8 y 9 de septiembre 005 DISCRETE MODEL DATA IN STATISTICAL PROCESS CONTROL Ester Gutiérrez Moya Dpto. Organización Industrial y Gestión de Empresas. Escuela
3. Deployment CHAMPION (CENTER MANAGER) Master Black Belt. Black Belt (GE-TS group) Black Belt (AUTOMATION group) Black Belt (GE-PS group)
 Master Black Belt. Black Belt (GE-TS group) Black Belt (AUTOMATION group) Black Belt (GE-PS group)") Quality Improvement The Six Sigma Way Mala Murugappan and Gargi Keeni Tata Consultancy Services Abstract Six Sigma provides an effective mechanism to focus on customer requirements, through improvement
Quality Improvement The Six Sigma Way Mala Murugappan and Gargi Keeni Tata Consultancy Services Abstract Six Sigma provides an effective mechanism to focus on customer requirements, through improvement
I/A Series Information Suite AIM*SPC Statistical Process Control
 I/A Series Information Suite AIM*SPC Statistical Process Control PSS 21S-6C3 B3 QUALITY PRODUCTIVITY SQC SPC TQC y y y y y y y y yy y y y yy s y yy s sss s ss s s ssss ss sssss $ QIP JIT INTRODUCTION AIM*SPC
This document contains a collection of formulas and constants useful for SPC chart construction. It assumes you are already familiar with SPC.
 SPC Formulas ad Tables 1 This documet cotais a collectio of formulas ad costats useful for SPC chart costructio. It assumes you are already familiar with SPC. Termiology Geerally, a bar draw over a symbol
Six Sigma. Breakthrough Strategy or Your Worse Nightmare? Jeffrey T. Gotro, Ph.D. Director of Research & Development Ablestik Laboratories
 Six Sigma Breakthrough Strategy or Your Worse Nightmare? Jeffrey T. Gotro, Ph.D. Director of Research & Development Ablestik Laboratories Agenda What is Six Sigma? What are the challenges? What are the
SPC Data Visualization of Seasonal and Financial Data Using JMP WHITE PAPER
 SPC Data Visualization of Seasonal and Financial Data Using JMP WHITE PAPER SAS White Paper Table of Contents Abstract.... 1 Background.... 1 Example 1: Telescope Company Monitors Revenue.... 3 Example
1 Variation control in the context of software engineering involves controlling variation in the
 1 Variation control in the context of software engineering involves controlling variation in the A) process applied B) resources expended C) product quality attributes D) all of the above 2 There is no
Statistical process control analysis based on software Q-das
 American Journal of Theoretical and Applied Statistics 2014; 3(4): 90-95 Published online July 20, 2014 (http://www.sciencepublishinggroup.com/j/ajtas) doi: 10.11648/j.ajtas.20140304.12 ISSN: 2326-8999
Attributes Acceptance Sampling Understanding How it Works
 Attributes Acceptance Sampling Understanding How it Works Dan O Leary CBE, CQE, CRE, CSSBB, CIRM, LLC 603-209-0600 [email protected] Copyright 2008, 2009 by, LLC Acceptance Sampling 1 Instructor
USE OF SHEWART CONTROL CHART TECHNIQUE IN MONITORING STUDENT PERFORMANCE
 Bulgarian Journal of Science and Education Policy (BJSEP), Volume 8, Number 2, 2014 USE OF SHEWART CONTROL CHART TECHNIQUE IN MONITORING STUDENT PERFORMANCE A. A. AKINREFON, O. S. BALOGUN Modibbo Adama
Applied Reliability ------------------------------------------------------------------------------------------------------------ Applied Reliability
 Applied Reliability Techniques for Reliability Analysis with Applied Reliability Tools (ART) (an EXCEL Add-In) and JMP Software AM216 Class 6 Notes Santa Clara University Copyright David C. Trindade, Ph.
A Study of Process Variability of the Injection Molding of Plastics Parts Using Statistical Process Control (SPC)
") Paper ID #7829 A Study of Process Variability of the Injection Molding of Plastics Parts Using Statistical Process Control (SPC) Dr. Rex C Kanu, Ball State University Dr. Rex Kanu is the coordinator of
Paper ID #7829 A Study of Process Variability of the Injection Molding of Plastics Parts Using Statistical Process Control (SPC) Dr. Rex C Kanu, Ball State University Dr. Rex Kanu is the coordinator of
PROCESS VARIABILITY REDUCTION THROUGH STATISTICAL PROCESS CONTROL FOR QUALITY IMPROVEMENT. 1.3 Process Capability. 1.
 International Journal for Quality research UDK- 005.6.642.2 Short Scientific Paper (1.03) PROCESS VARIABILITY REDUCTION THROUGH STATISTICAL PROCESS CONTROL FOR QUALITY IMPROVEMENT B.P. Mahesh 1) M.S. Prabhuswamy
User's Guide. CHARTrunner Lean. Version 1.0
 User's Guide CHARTrunner Lean Version 1.0 PQ Systems copyright notice Copyright 2006-2011 Productivity-Quality Systems, Inc. Productivity-Quality Systems, Inc. is also known as PQ Systems, Inc. All rights
Principles of Managing Operations (PMO)
") Principles of Managing Operations (PMO) Session 1: Operations Management Foundations Define the science and practice of operations management (OM) Answer the question why OM should be studied Describe
Principles of Managing Operations (PMO) Session 1: Operations Management Foundations Define the science and practice of operations management (OM) Answer the question why OM should be studied Describe
THIS PAGE WAS LEFT BLANK INTENTIONALLY
 SAMPLE EXAMINATION The purpose of the following sample examination is to present an example of what is provided on exam day by ASQ, complete with the same instructions that are given on exam day. The test
Operations Management OPM-301-TE
 Operations Management OPM-301-TE This TECEP focuses on the process of transforming inputs through a value-added process to produce goods and services. Topics covered include value chains, performance measurement,
Faster Turnaround Time
 Faster Turnaround Time by Angelo Pellicone and Maude Martocci North Shore University Hospital (NSUH) in Manhasset, NY, is part of the North Shore-Long Island Jewish Health System in Great Neck, NY. In
Chapter 10: Fixed Income Analysis. Joel Barber. Department of Finance. Florida International University. Miami, FL 33199
 Chapter 10: Fixed Income Analysis Joel Barber Department of Finance Florida International University Miami, FL 33199 Mortgage Mortgage Backed Security Amortization of Mortgage timet interest: im t 1 timet
Technique Review Short Run SPC
 With consumers' tastes changing frequently, companies are forced to adopt small batch production schedules. To conduct SPC studies on these short runs, where the batch may get over before sufficient data
1) Write the following as an algebraic expression using x as the variable: Triple a number subtracted from the number
 Write the following as an algebraic expression using x as the variable: Triple a number subtracted from the number") 1) Write the following as an algebraic expression using x as the variable: Triple a number subtracted from the number A. 3(x - x) B. x 3 x C. 3x - x D. x - 3x 2) Write the following as an algebraic expression
1) Write the following as an algebraic expression using x as the variable: Triple a number subtracted from the number A. 3(x - x) B. x 3 x C. 3x - x D. x - 3x 2) Write the following as an algebraic expression
Benchmarking Student Learning Outcomes using Shewhart Control Charts
 Benchmarking Student Learning Outcomes using Shewhart Control Charts Steven J. Peterson, MBA, PE Weber State University Ogden, Utah This paper looks at how Shewhart control charts a statistical tool used
Control Charts - SigmaXL Version 6.1
 Control Charts - SigmaXL Version 6.1 Control Charts: Overview Summary Report on Test for Special Causes Individuals & Moving Range Charts Use Historical Groups to Display Before VS After Improvement X-Bar
Process Capability Analysis Using MINITAB (I)
") Process Capability Analysis Using MINITAB (I) By Keith M. Bower, M.S. Abstract The use of capability indices such as C p, C pk, and Sigma values is widespread in industry. It is important to emphasize
Process Capability Analysis Using MINITAB (I) By Keith M. Bower, M.S. Abstract The use of capability indices such as C p, C pk, and Sigma values is widespread in industry. It is important to emphasize
δ Charts for Short Run Statistical Process Control
 50 Received April 1992 Revised July 1993 δ Charts for Short Run Statistical Process Control Victor E. Sower Sam Houston State University, Texas, USA, Jaideep G. Motwani Grand Valley State University, Michigan,
How To Measure Performance
 Better Quality Through Better Measurement Asia Pacific Forum on Quality Improvement in Health Care Robert Lloyd, PhD, Mary Seddon, MD and Richard Hamblin Wednesday 19 September 2012 2008 R. C. Lloyd &
Modifying Integrated Model for Manufacturing Process Improvement
 Modifying Integrated Model for Manufacturing Process Improvement Nguyen Van Hop. 1, Sumate N. 2, Patantip N. 3, and Sitawatch N. 4 1, 2, 3, 4. Industrial Engineering Program Sirindhorn International Institute
10 CONTROL CHART CONTROL CHART
 Module 10 CONTOL CHT CONTOL CHT 1 What is a Control Chart? control chart is a statistical tool used to distinguish between variation in a process resulting from common causes and variation resulting from
CAPABILITY PROCESS ASSESSMENT IN SIX SIGMA APPROACH
 METALLURGY AND FOUNDRY ENGINEERING Vol. 33, 007, No. Andrzej Czarski * CAPABILITY PROCESS ASSESSMENT IN SIX SIGMA APPROACH 1. INTRODUCTION We can state that statistical methods belong to a quality tools
Software Reliability Measuring using Modified Maximum Likelihood Estimation and SPC
 Software Reliaility Measuring using Modified Maximum Likelihood Estimation and SPC Dr. R Satya Prasad Associate Prof, Dept. of CSE Acharya Nagarjuna University Guntur, INDIA K Ramchand H Rao Dept. of CSE
STATISTICAL METHODS FOR QUALITY CONTROL
 statistics STATISTICAL METHODS FOR QUALITY CONTROL CONTENTS STATISTICS IN PRACTICE: DOW CHEMICAL U.S.A. 1 STATISTICAL PROCESS CONTROL Control Charts x Chart: Process Mean and Standard Deviation Known x
THE INTERNATIONAL JOURNAL OF BUSINESS & MANAGEMENT
 THE INTERNATIONAL JOURNAL OF BUSINESS & MANAGEMENT Process Performance Analysis in the Production Process of Medical Bottles Dr. Kabaday Nihan Research Asistant, Department of Production Management, Business
Monitoring Software Reliability using Statistical Process Control: An Ordered Statistics Approach
 Monitoring Software Reliability using Statistical Process Control: An Ordered Statistics Approach Bandla Srinivasa Rao Associate Professor. Dept. of Computer Science VRS & YRN College Dr. R Satya Prasad
DATA MONITORING AND ANALYSIS PROGRAM MANUAL
 DATA MONITORING AND ANALYSIS PROGRAM MANUAL LBNL/PUB-5519 (3), Rev. 0 Effective Date: Orlando Lawrence Berkeley National Laboratory LBNL/PUB-5519 (3), Rev. 0 Page 2 of 22 REVISION HISTORY Revision Date
Concepts of Variables. Levels of Measurement. The Four Levels of Measurement. Nominal Scale. Greg C Elvers, Ph.D.
 Concepts of Variables Greg C Elvers, Ph.D. 1 Levels of Measurement When we observe and record a variable, it has characteristics that influence the type of statistical analysis that we can perform on it
Getting Started with Statistics. Out of Control! ID: 10137
 Out of Control! ID: 10137 By Michele Patrick Time required 35 minutes Activity Overview In this activity, students make XY Line Plots and scatter plots to create run charts and control charts (types of
Lesson 1: Comparison of Population Means Part c: Comparison of Two- Means
 Lesson : Comparison of Population Means Part c: Comparison of Two- Means Welcome to lesson c. This third lesson of lesson will discuss hypothesis testing for two independent means. Steps in Hypothesis
p-charts in the Quality Control of the Grading Process in the High Education
 PANOECONOMICUS, 2006, 3, str. 335-347 UDC 378.4:371.26 p-charts in the Quality Control of the Grading Process in the High Education Mirko Savić Summary: European countries are making efforts to change
Pharmaceutical Product Quality, Quality by Design, cgmp, and Quality Metrics
 Pharmaceutical Product Quality, Quality by Design, cgmp, and Quality Metrics Lawrence X. Yu, Ph.D. Deputy Director Office of Pharmaceutical Quality Center for Drug Evaluation and Research Food and Drug
Applied Business Improvement. Introduction to ABI and Statgraphics Centurion
 Introduction to ABI and Statgraphics Centurion 1 Nobody gives a hoot about profits. Deming Successful Businesses Disagree.. Statgraphics Centurion TM and ABI can HELP your business INCREASE PROFIT Statgraphics
A Test Of The M&M Capital Structure Theories Richard H. Fosberg, William Paterson University, USA
 A Test Of The M&M Capital Structure Theories Richard H. Fosberg, William Paterson University, USA ABSTRACT Modigliani and Miller (1958, 1963) predict two very specific relationships between firm value
Food Industry. www.ats global.com
 Food Industry Significantly reduces scrap and rework cost Image driven inspection Web based analysis and reporting Eliminates paper checklists Real-time attribute data collection Easy-to-use operator interface
THE SIX SIGMA YELLOW BELT SOLUTIONS TEXT
 THE SIX SIGMA YELLOW BELT SOLUTIONS TEXT 2014 by Bill Wortman - All rights reserved SECTION II SIX SIGMA FUNDAMENTALS - SAMPLE QUESTIONS 2.1. The DPMO for a process is 860. What is the approximate six
A Multi-Stream Process Capability Assessment Using a Nonconformity Ratio Based Desirability Function
 A Multi-Stream Process Capability Assessment Using a Nonconformity Ratio Based Desirability Function Thesis for the Acquisition of the Degree of a Doctor in Natural Sciences of the University of Dortmund
Control chart, run chart, upper control limit, lower control limit, Statistical process control
 CONTROL CHARTS ABSTRACT Category: Monitoring - Control ΚEYWORDS Control charts (G) are line graphs in which data are plotted over time, with the addition of two horizontal lines, called control limits,
Lean Six Sigma and its application within the Criminal Justice Sector
 Lean Six Sigma and its application within the Criminal Justice Sector Ian J Seath OR51 Conference, tember 2009 1 Agenda What is Lean Six Sigma? How can it add value? Applications in a CJ environment Example
The normal approximation to the binomial
 The normal approximation to the binomial In order for a continuous distribution (like the normal) to be used to approximate a discrete one (like the binomial), a continuity correction should be used. There
Six Sigma Project Charter
 rev 12 Six Sigma Project Charter Name of project: Reduce the time of producing admissions dashboard reports Green belt: Yes Submitted by: Xingming Yu e-mail: [email protected] Date submitted: May 21, 212
The Impact of Lean Six Sigma on the Overall Results of Companies
 The Impact of Lean Six Sigma on the Overall Results of Companies Corina DUMITRESCU 1 Marilena DUMITRACHE 2 ABSTRACT Lean Six Sigma represents a management approach for driving innovating processes inside
Moving from Quality Control to Quality Assurance (Proactive Compliance!)
") Moving from Quality Control to Quality Assurance (Proactive Compliance!) Guy Wingate, VP & Compliance Officer Global Manufacturing & Supply, GlaxoSmithKline Disclaimer The views and opinions expressed
Moving from Quality Control to Quality Assurance (Proactive Compliance!) Guy Wingate, VP & Compliance Officer Global Manufacturing & Supply, GlaxoSmithKline Disclaimer The views and opinions expressed
Sequential Skills. Strands and Major Topics
 Sequential Skills This set of charts lists, by strand, the skills that are assessed, taught, and practiced in the Skills Tutorial program. Each Strand ends with a Mastery Test. You can enter correlating
STATISTICAL PROCESS CONTROL
 SOFTWARE ACQUISITION GOLD PRACTICE TM STATISTICAL PROCESS CONTROL FOCUS AREA: QUALITY - Measurement DESCRIPTION OF THE PRACTICE: SUMMARY DESCRIPTION Statistical Process Control (SPC) can be applied to