StarLogo Nova Cookbook
|
|
|
- Percival Marsh
- 9 years ago
- Views:
Transcription
1 StarLogo Nova Cookbook 1. Basic Set-up 2. Add or rename breeds 3. Giving your agents built in traits 4. Creating new traits for your agents 5. Basic wiggle walk and random walk 6. Basic geometry coordinates 7. Headings 8. Tilt screen to see in 3d 9. Copy and paste code 10. Loops 11. Sliders - basic (# of turtles) and percentage (% of turtles that are purple) 12. Change the terrain color during setup 13. Change the terrain color as the program is running 14. Making turtles react to patch color 15. Scatter turtles randomly on a certain terrain color 16. Collisions -- create/delete turtles on collision, set or modify traits 17. Stop code 18. Data boxes 19. Line graph 20. Hide and show graph 21. Chase another breed 22. Run away from another breed

2 Basic Setup These blocks to set up your world should be placed on the world tab. Usually, you want to delete everyone (agents tab) and to clear terrain (environment tab) before creating your new world. To create turtles, use the larger create block from the agents tab the create do - - so you can set agent traits. Type in the number of turtles you want to create, and select Turtle from the drop- down menu. It is also common to scatter the agents by attaching a scatter everyone (from the agents drawer) underneath the create block. If you only want to scatter a certain type of agent, you can put a simple scatter block under the word do in the create/do block. You tube GUTS channel: Flower Power 1:10-3:20 demonstrates a setup block (no scatter or traits); 3:50 4:15 makes turtles move forward 3 on setup

3 Adding or Renaming Breeds To add or rename a breed, go to the interface and click on the edit breeds button. You can rename the turtle breed or click on add breed to create another breed. Each breed that you add also adds a page (tab) where you can place blocks that will control that breed.

4 Setting the built- in traits for your agents. You can give your turtles traits (from the traits drawer) by setting them in a create- do block when you create the turtles. You can type in a number in a blank space, for example to set the size or coordinate, but don t try to type anything else - - if you try to type in words like red to set the color of the block, it will not work. Instead, you need to drag a color or built- in shape block from the traits drawer into the blank space, and use the drop- down menu in that block to set those traits.

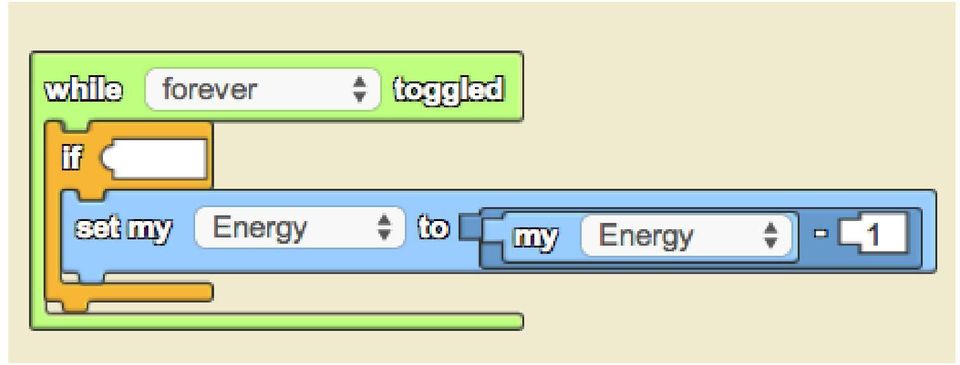
5 Creating a new trait for agents. In addition to using the build in traits, you can also give your agents other traits. All agents of that breed will have the trait and it can be set at startup. First, go to the interface screen and select the edit breeds button. Then, choose data and give your trait a name, then click OK. Get a set my traits block from the traits drawer and use the drop- down menu on select the new trait, and give it an initial value. Use an if or collision block to trigger a change in energy. Be sure to use the agent s existing energy and add or subtract from it to change the energy gradually as the program runs.

6
7 Wiggle Walk & Random Walk To make your agents move in a natural way, you can use the wiggle walk or the random walk. In the wiggle walk, agents move forward but randomly turn a little bit to the right then a little bit to the left at each step. Randomness in the amount that they turn causes them to wander across the world. Change the size of the random turns to make them walk in a mostly straight line or walk in tight random patterns. The random walk just has the turtles set their heading to a random number, then step forward. Guts You Tube channel: Flower Turtles 4:40 6:40 Shows how to get out forever, while toggled, put in forward and left movement, pen down

8 Basic geometry coordinates in Nova: Nova creates spaceland as a grid that is 101 patches high and 101 patches wide, with 0,0 in the center. As a default, agents are setup in the center of the screen (and at ground level, z = 0). They can be randomly scattered by using the scatter and scatter everyone blocks from the agent drawer, or by using this formula: To randomly scatter turtles over a limited part of blockland: To change where the turtles scatter, change the x or y coordinate in this formula. For example, to scatter them randomly on the lower half of the screen, change the y-coordinate to return a random number between 0-50, and then subtract 50.

9 Headings in Nova: If you create a single turtle, its default heading will be 0 degrees. If you create two turtles, the first will face 0 degrees and the second will face 180 degrees;; if you create 4, they will each face a compass direction, as illustrated below (by having turtles move with pen down).

10 The code that creates this demonstration pattern is here: Additional turtles will set up on default to evenly divide the circle by the number of turtles creates turtles will each face 1 degree apart in the circle. You can change the default heading by using the set my to from the traits drawer, within a create/do block or in a procedure or collision block: You can also have the turtles face in a general direction (with some degree of randomness) by using a formula to set the heading. This formula will set the turtle s heading between 0 and 180, or facing the upper half of the screen.
 by using a formula to set the heading.")
11 Tilt screen to see in 3d: In some models, like the greenhouse model, it is difficult to see what is happening on the interface using a two- dimensional or overhead view. Two dimensional view of greenhouse model (with cars and bus): To tilt the screen up on edge and view it as a three- dimensional interface, click on the green part of the interface (blockland) then hold down the option key while you click the mouse or keypad, and drag down the screen (toward the bottom) to tilt blockland. It is easy to lose your place - - if you do, just click reset camera at the top of the interface to restore the aerial view and try again. Three- dimensional view:

12 Another way to have a view of spaceland based on the perspective of an agent or breed is to drag a take camera button from the agents drawer into the create/do block where you create the agent you want to have the camera. In this example, the clownfish takes the camera, and on setup, the interface looks like this:

13 Cut, Copy and Paste code: It can be very useful to copy a long piece of code that exists for one agent, and change the specific settings to apply to a different agent, or to move code created on one tab to another tab. Click and drag your mouse or touchpad to make a box (shown by a dotted green line) around the entire block of code you want to copy. (Nova will only copy a complete block of code, so if you want only a piece of a block, detach it from the larger block before copying). Then, click copy (at the bottom left of the screen, beneath the drawers). Finally, click paste to copy your code, creating additional copies by clicking paste again. Nova will sometimes paste the code on the extreme upper right of the tab use the horizontal and vertical scroll bars to find it.
. Finally, click paste to copy your code, creating additional copies by clicking paste again.")
14 Loops: Any button created using the while toggled will be a loop, continuing to execute the commands in order (top to bottom) until the button is toggled off. So, putting a series of movement commands inside a while forever toggled will make the turtles move in a wiggle until the forever button is toggled off. You can also use a block from the logic drawer, while to have agents continue a behavior only as long as a certain condition is true. You can use a repeat block, from the logic drawer, to get turtles to perform a command or series of commands a set number of times.

15

16 Adding a Slider Sliders are useful for changing a value that you will use inside your model. To create a slider, go to the interface screen, click Edit Widgets on the upper left, and then click the red New Widget buttons to call the Create Widget screen. Select horizontal slider (upper right), name your slider, and click Add Widget Your slider will appear on the interface drag it where you want it, and set the minimum and maximum values by typing in the desired numbers be sure to hit the return (enter) key after typing in your desired values while still on this screen. Then click Edit Widgets again to return to the interface screen. Now, go to the setup block on the world page where you created your turtles. In the Interface drawer, scroll down to select the slider value block. Put it into the create block where you set the number of turtles, and select the name of your slider.
 key after typing in your desired values while still on this screen. Then click Edit Widgets again to return to the interface screen.")
17 The number of turtles you create on setup should now reflect the slider setting. To use a slider to create a percent: Follow the directions above to create and name a slider. Be sure to set the slider maximum value to 100. Put the slider value block into the code to replace number you want to use as a variable, using the following formula:

18 Change the color of the terrain on setup Nova does not allow the terrain color to be changed directly, so to change it you must create a turtle to do the work and then delete that turtle. On setup, create a turtle, set it to a large size, set its x and y coordinates to the beginning corner of the desired patch to re-color, and set its heading toward the end of the desired patch. Put a stamp command from the terrain drawer, with a my color block from the traits drawer, and a forward command (movement drawer) inside a repeat block (logic drawer) to have the turtle walk along, stamping the desired terrain color. Then, delete the turtle. For example, you can make the top half of spaceland look like the sky: Call the make sky procedure in the set-up block, after clearing the terrain, deleting everyone, and clearing any data boxes or graphs, and before creating the actual agents for the model. To make earth or the ground in that model, follow a very similar procedure, changing the y-coordinate to -25, and the color to brown.

19 To change the color of the terrain as the program is running: Create a widget to push when you want the terrain to change, for example, if you want it to appear that flowers get planted randomly in the landscape at a certain point (see the entry for Hiding and Showing Graphs for a review of how to create widgets). Here, the widget is named plant flowers and is a when pushed widget. In that widget, create an agent (it can be an agent you use elsewhere, or a separate breed) and set its size to zero. Then, in a repeat block (repeat as many times as you like), set the agent to random x and y coordinate, to a visible size, have it stamp a color, then set its size to zero. Delete the agent at the end of the widget s code.
 and set its size to zero.")
20 To make turtles react to patch color: To make your turtles react to a certain condition, like the color of a patch, use conditional blocks from the logic drawer. When you want agents to change their behavior if a certain condition is true, use the if block. For example: This code will make the turtles turn left if they hit a red patch on the terrain. You can have agents follow different sets of commands, depending on whether a condition is true or false, by using the if else block (from the logic drawer).

21 This code allows you to set the percent of turtles created on setup that are red, and set the color of the rest of the turtles to blue. GUTS you tube channel Bumper Turtles: Conditionals code for turtles to react to patch color at 3:15 4:10
22 To scatter turtles according to terrain color: If you have created a terrain color on set-up and want to scatter your agents randomly within that particular color or exclude them from a particular color, you can create a scatter procedure that calls itself, or a recursion. For example, in this water pumping model, the turtles (acting as groundwater) need to scatter randomly on the bottom half of the screen only (the earth, which has been colored brown), and not in the sky, which is cyan. Drag a procedure block onto the turtle tab, and name it. Put a simple scatter first, and then add a conditional ( if ) block from the logic drawer. Ask the turtle to look at the terrain color, and if it has scattered onto the wrong color (cyan) it calls the scatter procedure again (recursion). Don t forget to call this procedure in the setup block on the world page. You can also use recursion and set the x and y coordinates to random numbers, to accomplish the same goal. Here, the turtles (consumers) need to scatter randomly except in the yellow portion of the terrain.
23 Again, the procedure must be called in the setup block, as well as in itself.
24 Collisions Turtles will simply walk through each other unless you tell them to react to a collision. Using the collision blocks, you can have various events occur when agents collide, with each other or with a different breed. To show the spread of an infection, for example, you might want blue (healthy) turtles to turn red (infected) when they collide with a red turtle. Use a collision block (from the detection drawer) and select Turtle from the drop- down menu. Then, have the colliding turtle check whether it is colliding with (the collidee) is red. If so, the colliding turtle should turn red: If you want a collision between breeds, you should pay attention to where you are placing the collision block. For example, you might want to make a shark to appear to eat a turtle on collision. Put the collision block on the shark page, and delete the collidee or turtle.
25 Stop code When you are using a model to collect data, it is useful to have the model stop running after a set period of time, so the data can be recorded. You need to run the model long enough to see results, but not so long that repeated trials of the same experiment become burdensome. To have a model stop after 500 ticks, use a conditional logic block inside each use of the while forever toggled in your code. For example, this code will call all the procedures and will update the data box for 500 ticks. The program will then stop running (although the forever button is still pushed), and the data can be recorded before the next trial of the experiment begins.
26 Data boxes: To have the computer count agents for you, create and name a data box. Nova automatically opens a new project with a data box called score but you can create as many others as you would like. On the interface, check Edit Widgets and then click the red button to create a New Widget. Choose Data Box and name your widget, then click Add Widget. Drag your widget where you want it on the interface page, and click the Edit Widgets button again to exit this screen. Look in the interface drawer for two blocks: when forever toggled and set data box to and drag them onto the world tab. Use the drop- down menu to select the title of your data box. Then, from the detection drawer, add a block that will allow you to count the agents, or as in this example, the agents with a particular characteristic:
27 The world agent will count the turtles within a certain number of steps from itself (located in the center of the screen, at 0,0), so be sure to use a number that will count all turtles on the 101 x 101 step screen. If you want to clear the data box on setup, use the set data box code to set the data box to 0. Be sure to place this box above the blocks creating the turtles.
28 Line graph Creating a line graph is similar to creating a data box, with just a few more steps. On the interface, click the edit widgets button and create a new widget. Select line graph, name your graph, and click Add Widget. Place your graph on the interface (you cannot resize it, although another cookbook entry explains how to hide or show a graph). While you are still on the gray screen to edit widgets, double click at the bottom of the graph on series 1 to name the series. Click on the colored square to choose the color of the line in the graph, and click Accept. Click on add series to create another input into the graph, name it, and choose the color of the line. When you have created all relevant series, click edit widgets to exit the editing screen.
29 Get a when forever toggled block and a block called add data to line graph from the interface drawer, and place them on the World tab. Use the drop- down menu to select the name of your line graph and to select the first series in your graph. Put a count within command from the detection drawer into the y- axis slot. The world agent will count the agents within a certain number of steps from the center of the screen, so use 200 steps to cover the entire screen. Get a clock block from the environment drawer and place it in the slot for the x- axis. Repeat this process for each series in your graph. You can also clear the graph on setup by using the clear graph block from the interface drawer. Be sure to place this block above the create agents blocks.
30
31 Hide and show graphs: Since the graphs cannot be resized in Nova, they can block the view of the interface (blockland). You can solve this problem by creating a widget to hide and show the graphs. On the interface, click Edit Widgets and then the red button to Create a New Widget. Select Push button on the upper left, name your widget, and click Add Widget. Create another Push button widget called Show graph, place the buttons where you want them on the interface, and then click the Edit Widgets button again to exit this screen. To create the code to make these widgets work, go to the world tab, open the interface drawer and select the when pushed block and a hide block. Use the drop-down menus to select first the name of your new push button ( Hide graphs ) and then the name of your graph ( heat ). Add a hide block for each additional graph ( co2 levels ). Follow the same procedure for your show graphs button.
32 Chase: Instead of having agents always move in a random wiggle, you can make a predator agent chase the closest prey agent. In this example, create a procedure on the tab for your predator agent (mountain lion) using the face towards and forward blocks from the movement drawer, and a nearest within steps from the detection drawer. Put them together so you are asking the mountain lion to face towards the nearest rabbit (prey) within 100 steps, and move forward 1. The lion will follow the nearest rabbit until it catches (and eats) it, and then will choose another rabbit to follow: You can call this procedure inside a forever button, so the lion is always moving forward straight toward the nearest rabbit. Or, you can use an if/else logic block to have the lion move in a wiggle unless a rabbit is nearby, and then follow the chase procedure.
33 This second method allows you to change the speed and the energy loss for the lion, depending on whether it is chasing a rabbit or just wandering around.
34 Run Away: To make the prey breed wander around unless a predator is nearby, create a basic move or wiggle procedure for your prey (rabbits) on the prey tab and call the procedure in a forever block. Create another procedure for them to run away, and call this procedure in the same forever block, below the wiggle procedure. A rabbit will follow its wiggle procedure (which is called first in the forever block) until a lion comes within 10 steps. Then, the rabbit executes the runaway procedure, where it faces towards the nearest lion, then turns around and takes a small step away (there is no block to ask the rabbit to face away from the lion, it can only face towards it and then turn around). It will continue to take small steps away from the lion until the lion is more than 10 steps away, when the rabbit will wiggle again.
Excel -- Creating Charts
 Excel -- Creating Charts The saying goes, A picture is worth a thousand words, and so true. Professional looking charts give visual enhancement to your statistics, fiscal reports or presentation. Excel
MODULE 1 (COMPUTER MODELING AND SIMULATION) INTRODUCTION. Module Name: Introduction to Computer Modeling and Simulation
 INTRODUCTION. Module Name: Introduction to Computer Modeling and Simulation") MODULE 1 (COMPUTER MODELING AND SIMULATION) INTRODUCTION Module Name: Introduction to Computer Modeling and Simulation Content of this Introduction: 1. Overview of the Module 2. Prerequisite knowledge
MODULE 1 (COMPUTER MODELING AND SIMULATION) INTRODUCTION Module Name: Introduction to Computer Modeling and Simulation Content of this Introduction: 1. Overview of the Module 2. Prerequisite knowledge
Introduction to the TI-Nspire CX
 Introduction to the TI-Nspire CX Activity Overview: In this activity, you will become familiar with the layout of the TI-Nspire CX. Step 1: Locate the Touchpad. The Touchpad is used to navigate the cursor
Create a Poster Using Publisher
 Contents 1. Introduction 1. Starting Publisher 2. Create a Poster Template 5. Aligning your images and text 7. Apply a background 12. Add text to your poster 14. Add pictures to your poster 17. Add graphs
How to make a line graph using Excel 2007
 How to make a line graph using Excel 2007 Format your data sheet Make sure you have a title and each column of data has a title. If you are entering data by hand, use time or the independent variable in
3D-GIS in the Cloud USER MANUAL. August, 2014
 3D-GIS in the Cloud USER MANUAL August, 2014 3D GIS in the Cloud User Manual August, 2014 Table of Contents 1. Quick Reference: Navigating and Exploring in the 3D GIS in the Cloud... 2 1.1 Using the Mouse...
Scientific Graphing in Excel 2010
 Scientific Graphing in Excel 2010 When you start Excel, you will see the screen below. Various parts of the display are labelled in red, with arrows, to define the terms used in the remainder of this overview.
DOING MORE WITH WORD: MICROSOFT OFFICE 2010
 University of North Carolina at Chapel Hill Libraries Carrboro Cybrary Chapel Hill Public Library Durham County Public Library DOING MORE WITH WORD: MICROSOFT OFFICE 2010 GETTING STARTED PAGE 02 Prerequisites
Intermediate PowerPoint
 Intermediate PowerPoint Charts and Templates By: Jim Waddell Last modified: January 2002 Topics to be covered: Creating Charts 2 Creating the chart. 2 Line Charts and Scatter Plots 4 Making a Line Chart.
Interactive Excel Spreadsheets:
 Interactive Excel Spreadsheets: Constructing Visualization Tools to Enhance Your Learner-centered Math and Science Classroom Scott A. Sinex Department of Physical Sciences and Engineering Prince George
Instructions for Creating a Poster for Arts and Humanities Research Day Using PowerPoint
 Instructions for Creating a Poster for Arts and Humanities Research Day Using PowerPoint While it is, of course, possible to create a Research Day poster using a graphics editing programme such as Adobe
CATIA Basic Concepts TABLE OF CONTENTS
 TABLE OF CONTENTS Introduction...1 Manual Format...2 Log on/off procedures for Windows...3 To log on...3 To logoff...7 Assembly Design Screen...8 Part Design Screen...9 Pull-down Menus...10 Start...10
Instructions for Formatting APA Style Papers in Microsoft Word 2010
 Instructions for Formatting APA Style Papers in Microsoft Word 2010 To begin a Microsoft Word 2010 project, click on the Start bar in the lower left corner of the screen. Select All Programs and then find
Windows XP Pro: Basics 1
 NORTHWEST MISSOURI STATE UNIVERSITY ONLINE USER S GUIDE 2004 Windows XP Pro: Basics 1 Getting on the Northwest Network Getting on the Northwest network is easy with a university-provided PC, which has
Publisher 2010 Cheat Sheet
 April 20, 2012 Publisher 2010 Cheat Sheet Toolbar customize click on arrow and then check the ones you want a shortcut for File Tab (has new, open save, print, and shows recent documents, and has choices
Eye Tracking Instructions
 Eye Tracking Instructions [1] Check to make sure that the eye tracker is properly connected and plugged in. Plug in the eye tracker power adaptor (the green light should be on. Make sure that the yellow
WEB TRADER USER MANUAL
 WEB TRADER USER MANUAL Web Trader... 2 Getting Started... 4 Logging In... 5 The Workspace... 6 Main menu... 7 File... 7 Instruments... 8 View... 8 Quotes View... 9 Advanced View...11 Accounts View...11
ACS Version 10.6 - Check Layout Design
 ACS Version 10.6 - Check Layout Design Table Of Contents 1. Check Designer... 1 About the Check Design Feature... 1 Selecting a Check Template... 2 Adding a Check Template... 2 Modify a Check Template...
FREE FALL. Introduction. Reference Young and Freedman, University Physics, 12 th Edition: Chapter 2, section 2.5
 Physics 161 FREE FALL Introduction This experiment is designed to study the motion of an object that is accelerated by the force of gravity. It also serves as an introduction to the data analysis capabilities
Excel Tutorial. Bio 150B Excel Tutorial 1
 Bio 15B Excel Tutorial 1 Excel Tutorial As part of your laboratory write-ups and reports during this semester you will be required to collect and present data in an appropriate format. To organize and
Microsoft Word 2010. Quick Reference Guide. Union Institute & University
 Microsoft Word 2010 Quick Reference Guide Union Institute & University Contents Using Word Help (F1)... 4 Window Contents:... 4 File tab... 4 Quick Access Toolbar... 5 Backstage View... 5 The Ribbon...
Handout: Word 2010 Tips and Shortcuts
 Word 2010: Tips and Shortcuts Table of Contents EXPORT A CUSTOMIZED QUICK ACCESS TOOLBAR... 2 IMPORT A CUSTOMIZED QUICK ACCESS TOOLBAR... 2 USE THE FORMAT PAINTER... 3 REPEAT THE LAST ACTION... 3 SHOW
This activity will show you how to draw graphs of algebraic functions in Excel.
 This activity will show you how to draw graphs of algebraic functions in Excel. Open a new Excel workbook. This is Excel in Office 2007. You may not have used this version before but it is very much the
Making Visio Diagrams Come Alive with Data
 Making Visio Diagrams Come Alive with Data An Information Commons Workshop Making Visio Diagrams Come Alive with Data Page Workshop Why Add Data to A Diagram? Here are comparisons of a flow chart with
Microsoft Windows Overview Desktop Parts
 Microsoft Windows Overview Desktop Parts Icon Shortcut Icon Window Title Bar Menu Bar Program name Scroll Bar File Wallpaper Folder Start Button Quick Launch Task Bar or Start Bar Time/Date function 1
Task Card #2 SMART Board: Notebook
 Task Card #2 SMART Board: Notebook Objectives: Participants will learn how to utilize the SMART Notebook. Table of Contents: Launching The SMART Notebook Page 1 Entering Text Page 1 Top Toolbar Page 2
Communicate: In Print
 Communicate: In Print A simple guide Work areas Communicate: In Print has two different modes in which to edit your documents: Create and Adjust modes. These are easily interchangeable and the toolbars
Select the Crow s Foot entity relationship diagram (ERD) option. Create the entities and define their components.
 option. Create the entities and define their components.") Α DESIGNING DATABASES WITH VISIO PROFESSIONAL: A TUTORIAL Microsoft Visio Professional is a powerful database design and modeling tool. The Visio software has so many features that we can t possibly demonstrate
Α DESIGNING DATABASES WITH VISIO PROFESSIONAL: A TUTORIAL Microsoft Visio Professional is a powerful database design and modeling tool. The Visio software has so many features that we can t possibly demonstrate
USER MANUAL (PRO-CURO LITE, PRO & ENT) [SUPPLIED FOR VERSION 3]
![USER MANUAL (PRO-CURO LITE, PRO & ENT) [SUPPLIED FOR VERSION 3]](/thumbs/39/19325006.jpg "USER MANUAL (PRO-CURO LITE, PRO & ENT) [SUPPLIED FOR VERSION 3]") Pro-curo Software Ltd USER MANUAL (PRO-CURO LITE, PRO & ENT) [SUPPLIED FOR VERSION 3] CONTENTS Everyday use... 3 Logging on... 4 Main Screen... 5 Adding locations... 6 Working with locations... 7 Duplicate...
Pro-curo Software Ltd USER MANUAL (PRO-CURO LITE, PRO & ENT) [SUPPLIED FOR VERSION 3] CONTENTS Everyday use... 3 Logging on... 4 Main Screen... 5 Adding locations... 6 Working with locations... 7 Duplicate...
Microsoft Word Track Changes
 Microsoft Word Track Changes This document is provided for your information only. You SHOULD NOT upload a document into imedris that contains tracked changes. You can choose to use track changes for your
Excel 2007 A Beginners Guide
 Excel 2007 A Beginners Guide Beginner Introduction The aim of this document is to introduce some basic techniques for using Excel to enter data, perform calculations and produce simple charts based on
Advanced Programming with LEGO NXT MindStorms
 Advanced Programming with LEGO NXT MindStorms Presented by Tom Bickford Executive Director Maine Robotics Advanced topics in MindStorms Loops Switches Nested Loops and Switches Data Wires Program view
Microsoft PowerPoint 2011
 Microsoft PowerPoint 2011 Starting PowerPoint... 2 Creating Slides in Your Presentation... 3 Beginning with the Title Slide... 3 Inserting a New Slide... 3 Adding an Image to a Slide... 4 Downloading Images
Inking in MS Office 2013
 VIRGINIA TECH Inking in MS Office 2013 Getting Started Guide Instructional Technology Team, College of Engineering Last Updated: Fall 2013 Email [email protected] if you need additional assistance after
Epson Brightlink Interactive Board and Pen Training. Step One: Install the Brightlink Easy Interactive Driver
 California State University, Fullerton Campus Information Technology Division Documentation and Training Services Handout Epson Brightlink Interactive Board and Pen Training Downloading Brightlink Drivers
Microsoft PowerPoint 2010
 Microsoft PowerPoint 2010 Starting PowerPoint... 2 PowerPoint Window Properties... 2 The Ribbon... 3 Default Tabs... 3 Contextual Tabs... 3 Minimizing and Restoring the Ribbon... 4 The Backstage View...
Getting Started in Tinkercad
 Getting Started in Tinkercad By Bonnie Roskes, 3DVinci Tinkercad is a fun, easy to use, web-based 3D design application. You don t need any design experience - Tinkercad can be used by anyone. In fact,
SMART NOTEBOOK 10. Instructional Technology Enhancing ACHievement
 SMART NOTEBOOK 10 Instructional Technology Enhancing ACHievement TABLE OF CONTENTS SMART Notebook 10 Themes... 3 Page Groups... 4 Magic Pen... 5 Shape Pen... 6 Tables... 7 Object Animation... 8 Aligning
Excel 2003 A Beginners Guide
 Excel 2003 A Beginners Guide Beginner Introduction The aim of this document is to introduce some basic techniques for using Excel to enter data, perform calculations and produce simple charts based on
Appointments: Calendar Window
 Appointments Appointments: Calendar Window Purpose The Appointment Calendar window is the automated equivalent of a paper appointment book. You can make appointments, confirm appointments, and view appointments
Guide To Creating Academic Posters Using Microsoft PowerPoint 2010
 Guide To Creating Academic Posters Using Microsoft PowerPoint 2010 INFORMATION SERVICES Version 3.0 July 2011 Table of Contents Section 1 - Introduction... 1 Section 2 - Initial Preparation... 2 2.1 Overall
Excel 2007: Basics Learning Guide
 Excel 2007: Basics Learning Guide Exploring Excel At first glance, the new Excel 2007 interface may seem a bit unsettling, with fat bands called Ribbons replacing cascading text menus and task bars. This
Getting Started on the Computer With Mouseaerobics! Windows XP
 This handout was modified from materials supplied by the Bill and Melinda Gates Foundation through a grant to the Manchester City Library. Getting Started on the Computer With Mouseaerobics! Windows XP
Data Visualization. Prepared by Francisco Olivera, Ph.D., Srikanth Koka Department of Civil Engineering Texas A&M University February 2004
 Data Visualization Prepared by Francisco Olivera, Ph.D., Srikanth Koka Department of Civil Engineering Texas A&M University February 2004 Contents Brief Overview of ArcMap Goals of the Exercise Computer
WORDPAD TUTORIAL WINDOWS 7
 WORDPAD TUTORIAL WINDOWS 7 Quick Access bar Home Tab Triangles = More Commands Groups on the Home tab Right paragraph margin Left paragraph Margin & Indent Paragraphs Ruler Hover the mouse pointer over
INTRODUCTION TO DESKTOP PUBLISHING
 INTRODUCTION TO DESKTOP PUBLISHING Desktop publishing uses page layout software and a personal computer to combine text, type, drawings, and images on a page to create books, newsletters, marketing brochures,
REFERENCE GUIDE 1. INTRODUCTION
 1. INTRODUCTION Scratch is a new programming language that makes it easy to create interactive stories, games, and animations and share your creations with others on the web. This Reference Guide provides
The main imovie window is divided into six major parts.
 The main imovie window is divided into six major parts. 1. Project Drag clips to the project area to create a timeline 2. Preview Window Displays a preview of your video 3. Toolbar Contains a variety of
Creating and Using Links and Bookmarks in PDF Documents
 Creating and Using Links and Bookmarks in PDF Documents After making a document into a PDF, there may be times when you will need to make links or bookmarks within that PDF to aid navigation through the
Using Microsoft Word. Working With Objects
 Using Microsoft Word Many Word documents will require elements that were created in programs other than Word, such as the picture to the right. Nontext elements in a document are referred to as Objects
Google Sites. How to create a site using Google Sites
 Contents How to create a site using Google Sites... 2 Creating a Google Site... 2 Choose a Template... 2 Name Your Site... 3 Choose A Theme... 3 Add Site Categories and Descriptions... 3 Launch Your Google
Excel 2007 Basic knowledge
 Ribbon menu The Ribbon menu system with tabs for various Excel commands. This Ribbon system replaces the traditional menus used with Excel 2003. Above the Ribbon in the upper-left corner is the Microsoft
Intro to 3D Animation Using Blender
 Intro to 3D Animation Using Blender Class Instructor: Anthony Weathersby Class Objectives A primer in the areas of 3D modeling and materials An introduction to Blender and Blender s toolset Course Introduction
Guide to Viewing Maps in Google Earth
 Guide to Viewing Maps in Google Earth The BCT made the decision to provide the GIS (Geographic Information System) resources for Bat Groups in the form of Google Earth maps because they do not require
Intro to Excel spreadsheets
 Intro to Excel spreadsheets What are the objectives of this document? The objectives of document are: 1. Familiarize you with what a spreadsheet is, how it works, and what its capabilities are; 2. Using
Data representation and analysis in Excel
 Page 1 Data representation and analysis in Excel Let s Get Started! This course will teach you how to analyze data and make charts in Excel so that the data may be represented in a visual way that reflects
Microsoft Excel 2010 Charts and Graphs
 Microsoft Excel 2010 Charts and Graphs Email: [email protected] Web Page: http://training.health.ufl.edu Microsoft Excel 2010: Charts and Graphs 2.0 hours Topics include data groupings; creating
1.0-Scratch Interface 1.1. Valuable Information
 1.0-Scratch Interface 1.1 Valuable Information The Scratch Interface is divided to three: 1. Stage 2. Sprite/background properties 3. Scratch Action Blocks Building the game by designing the sprites and
Experiment 3: Magnetic Fields of a Bar Magnet and Helmholtz Coil
 MASSACHUSETTS INSTITUTE OF TECHNOLOGY Department of Physics 8.02 Spring 2009 Experiment 3: Magnetic Fields of a Bar Magnet and Helmholtz Coil OBJECTIVES 1. To learn how to visualize magnetic field lines
Microsoft Word 2010 Tutorial
 1 Microsoft Word 2010 Tutorial Microsoft Word 2010 is a word-processing program, designed to help you create professional-quality documents. With the finest documentformatting tools, Word helps you organize
SMART Board Beginning
 SMART Board Beginning Downloading the Software... 2 600 Series SMART Board... 2 800 Series SMART Board... 3 SMART Board Cleaning Options... 4 SMART Board Pens... 4 SMART Board Help... 4 Using the On Screen
PowerPoint. Basics. Project
 PowerPoint 2010 Basics Project PRESENTED BY THE TECHNOLOGY TRAINERS OF THE MONROE COUNTY LIBRARY SYSTEM EMAIL: [email protected] MONROE COUNTY LIBRARY SYSTEM 734-241-5770 840 SOUTH ROESSLER
Sample Table. Columns. Column 1 Column 2 Column 3 Row 1 Cell 1 Cell 2 Cell 3 Row 2 Cell 4 Cell 5 Cell 6 Row 3 Cell 7 Cell 8 Cell 9.
 Working with Tables in Microsoft Word The purpose of this document is to lead you through the steps of creating, editing and deleting tables and parts of tables. This document follows a tutorial format
WebEx Sharing Resources
 WebEx Sharing Resources OTS PUBLICATION: WX0 REVISED: 4/8/06 04 TOWSON UNIVERSITY OFFICE OF TECHNOLOGY SERVICES =Shortcut =Advice =Caution Introduction During a WebEx session, the host has the ability
Creating Fill-able Forms using Acrobat 8.0: Part 1
 Creating Fill-able Forms using Acrobat 8.0: Part 1 The first step in creating a fill-able form in Adobe Acrobat is to generate the form with all its formatting in a program such as Microsoft Word. Then
WHAT S NEW IN WORD 2010 & HOW TO CUSTOMIZE IT
 WHAT S NEW IN WORD 2010 & HOW TO CUSTOMIZE IT The Ribbon... 2 Default Tabs... 2 Contextual Tabs... 2 Minimizing and Restoring the Ribbon... 3 Customizing the Ribbon... 3 A New Graphic Interface... 5 Live
Experiment 5: Magnetic Fields of a Bar Magnet and of the Earth
 MASSACHUSETTS INSTITUTE OF TECHNOLOGY Department of Physics 8.02 Spring 2005 Experiment 5: Magnetic Fields of a Bar Magnet and of the Earth OBJECTIVES 1. To examine the magnetic field associated with a
Gestation Period as a function of Lifespan
 This document will show a number of tricks that can be done in Minitab to make attractive graphs. We work first with the file X:\SOR\24\M\ANIMALS.MTP. This first picture was obtained through Graph Plot.
Presentations and PowerPoint
 V-1.1 PART V Presentations and PowerPoint V-1.2 Computer Fundamentals V-1.3 LESSON 1 Creating a Presentation After completing this lesson, you will be able to: Start Microsoft PowerPoint. Explore the PowerPoint
Welcome to CorelDRAW, a comprehensive vector-based drawing and graphic-design program for the graphics professional.
 Workspace tour Welcome to CorelDRAW, a comprehensive vector-based drawing and graphic-design program for the graphics professional. In this tutorial, you will become familiar with the terminology and workspace
Pacman 3D. Suggestions Multiple levels Powerups that let Pacman chase and eat Ghosts; ghosts need to respawn
 Mario 3D Mario is a classic game featuring a side scrolling 2D Mario character that can jump to avoid moving enemies and collect coins. In this 3D version, you will program a Mario like character to respond
SMARTstuff. The first rule for using an interactive whiteboard is very simple and of the utmost importance: Have faith in yourself you can do this!
 SMARTstuff The first rule for using an interactive whiteboard is very simple and of the utmost importance: Have faith in yourself you can do this! Getting Started This booklet will cover the following
OneNote 2013 Tutorial
 VIRGINIA TECH OneNote 2013 Tutorial Getting Started Guide Instructional Technology Team, College of Engineering Last Updated: Spring 2014 Email [email protected] if you need additional assistance after
Graphing in excel on the Mac
 Graphing in excel on the Mac Quick Reference for people who just need a reminder The easiest thing is to have a single series, with y data in the column to the left of the x- data. Select the data and
Adding Comments in Microsoft Excel 2003
 Adding Comments in Microsoft Excel 2003 Introduction Microsoft Excel has a very useful facility which allows you to add explanatory notes to your worksheet. These can be used, for example, to explain what
HOWTO annotate documents in Microsoft Word
 HOWTO annotate documents in Microsoft Word Introduction This guide will help new users markup, make corrections, and track changes in a Microsoft Word document. These instructions are for Word 2007. The
Tutorial for Tracker and Supporting Software By David Chandler
 Tutorial for Tracker and Supporting Software By David Chandler I use a number of free, open source programs to do video analysis. 1. Avidemux, to exerpt the video clip, read the video properties, and save
Integrated Invoicing and Debt Management System for Mac OS X
 Integrated Invoicing and Debt Management System for Mac OS X Program version: 6.3 110401 2011 HansaWorld Ireland Limited, Dublin, Ireland Preface Standard Invoicing is a powerful invoicing and debt management
CREATING SCENERY WITH THE PHOENIX RC CREATOR PROGRAM
 TUTORIAL 1 CREATING SCENERY WITH THE PHOENIX RC CREATOR PROGRAM This document is copyrighted to the author and may only be reproduced or copied with the author s consent. It is free for distribution on
Windows 95. 2a. Place the pointer on Programs. Move the pointer horizontally to the right into the next window.
 Word Processing Microsoft Works Windows 95 The intention of this section is to instruct basic word processing skills such as creating, editing, formatting, saving and closing a new document. Microsoft
Welcome to Bridgit @ CSU The Software Used To Data Conference.
 Welcome to Bridgit @ CSU The Software Used To Data Conference. Overview SMART Bridgit software is a client/server application that lets you share programs and information with anyone, anywhere in the world.
Microsoft Outlook 2007
 Outline View... 2 Quick Navigation... 3 View several dates at a time... 3 Show Navigation s on the Right Side... 3 Scheduling an Appointment on Your... 4 All Day Events... 4 Mark an Appointment as Private...
Experiment 3: Magnetic Fields of a Bar Magnet and Helmholtz Coil
 MASSACHUSETTS INSTITUTE OF TECHNOLOGY Department of Physics 8.02 Spring 2006 Experiment 3: Magnetic Fields of a Bar Magnet and Helmholtz Coil OBJECTIVES 1. To learn how to visualize magnetic field lines
Getting Started with Excel 2008. Table of Contents
 Table of Contents Elements of An Excel Document... 2 Resizing and Hiding Columns and Rows... 3 Using Panes to Create Spreadsheet Headers... 3 Using the AutoFill Command... 4 Using AutoFill for Sequences...
Excel Level Two. Introduction. Contents. Exploring Formulas. Entering Formulas
 Introduction Excel Level Two This workshop introduces you to formulas, functions, moving and copying data, using autofill, relative and absolute references, and formatting cells. Contents Introduction
In this session, we will explain some of the basics of word processing. 1. Start Microsoft Word 11. Edit the Document cut & move
 WORD PROCESSING In this session, we will explain some of the basics of word processing. The following are the outlines: 1. Start Microsoft Word 11. Edit the Document cut & move 2. Describe the Word Screen
App Inventor Tutorial 4 Cat & Mouse Game
 App Inventor Tutorial 4 Cat & Mouse Game This is an app that will let you get familiar with using image sprites, canvas, sound, clock and the accelerometer (Movement Sensor) within a Game in App Inventor.
Creating a Poster in PowerPoint 2010. A. Set Up Your Poster
 View the Best Practices in Poster Design located at http://www.emich.edu/training/poster before you begin creating a poster. Then in PowerPoint: (A) set up the poster size and orientation, (B) add and
Manual: I. Getting Started:
 Manual: I. Getting Started: II. Layout: Download the Latest version of Laser trading platform from http://sharktraders.com/nyse-nasdaq-amex/platforms-nyse/laser/ Install to the appropriate directory (it
SolidWorks Tutorial 3 MAGNETIC BLOCK
 SolidWorks Tutorial 3 MAGNETIC BLOCK Magnetic Block In this exercise you will make a magnetic block. To do so, you will create a few parts, which you will assemble. You will learn the following new applications
Creating a PowerPoint Poster using Windows
 Creating a PowerPoint Poster using Windows Copyright 2001 Michael Dougherty ([email protected]) Purpose The purpose of this tutorial is to illustrate how to create a 3 x 4 ft. poster using PowerPoint. This
Microsoft Access 2010 handout
 Microsoft Access 2010 handout Access 2010 is a relational database program you can use to create and manage large quantities of data. You can use Access to manage anything from a home inventory to a giant
Microsoft Word defaults to left justified (aligned) paragraphs. This means that new lines automatically line up with the left margin.
 paragraphs. This means that new lines automatically line up with the left margin.") Microsoft Word Part 2 Office 2007 Microsoft Word 2007 Part 2 Alignment Microsoft Word defaults to left justified (aligned) paragraphs. This means that new lines automatically line up with the left margin.
Microsoft Word Part 2 Office 2007 Microsoft Word 2007 Part 2 Alignment Microsoft Word defaults to left justified (aligned) paragraphs. This means that new lines automatically line up with the left margin.
Dealing with Data in Excel 2010
 Dealing with Data in Excel 2010 Excel provides the ability to do computations and graphing of data. Here we provide the basics and some advanced capabilities available in Excel that are useful for dealing
Online Tools Training Lesson Plan
 Online Tools Training Lesson Plan Reading grade 5 Assessment Development, OSPI, Washington State Table of Contents Purpose Statement... 2 Disclaimer... 2 Lesson Objectives... 2 Lesson Overview... 2 Lesson
Why Use OneNote? Creating a New Notebook
 Why Use OneNote? OneNote is the ultimate virtual notebook that enables users to create notes in various formats, shares those notes, sync those notes with the cloud and collaborate with others. You can
Drawing a histogram using Excel
 Drawing a histogram using Excel STEP 1: Examine the data to decide how many class intervals you need and what the class boundaries should be. (In an assignment you may be told what class boundaries to
Creating a Guided Tour with Google Earth
 Creating a Guided Tour with Google Earth Before creating a tour, first orient yourself to basic Google Earth functions. To start, download Google Earth to your desktop. This is free through earth.google.com.
Windows 8.1 Update 1 Supplement
 Illustrated Series Guide to Windows 8.1 Update 1 Changes June 2014 Table of Contents (CTRL+Click a link to navigate directly to Part 1, 2, 3, or 4.) Part 1: What Version of Windows Am I Using? Part 2: