Introduction to Technical Analysis. Andrew Wilkinson
|
|
|
- Jocelyn Snow
- 7 years ago
- Views:
Transcription
1 Introduction to Technical Analysis Andrew Wilkinson 1

2 Risk Disclosure Futures are not suitable for all investors. The amount you may lose may be greater than your initial investment. Before trading futures, please read the CFTC Risk Disclosure. For a copy, call (203) Any strategies discussed, including examples using actual securities and price data, are strictly for illustrative and educational purposes only and are not to be construed as an endorsement, recommendation or solicitation to buy or sell securities or commodities. Past performance is not a guarantee of future results. Interactive Brokers LLC is a member of NYSE, FINRA, SIPC. 2

3 Technical versus Fundamental Technical Analysis of internals Price Volume Pattern Support Resistance Recognition Fundamental Analysis of externals Economy Management SWOT Strengths Weakness Opportunities Threats Buy/ Sell recommendation 3

4 Technical versus Fundamental Fundamental analysis leads to price predictions using valuation ratios Technical analysis uses trend and pattern recognition to predict prices 4

5 What s in a Chart? Charts show the price performance of an underlying asset or security Get overview with at least a 6 month picture Consider your timeframe carefully Charts express prices as lines, bars or candlesticks 5

6 Chart Types Trader Work Station (TWS) displays prices as a: Line Joins closing prices between each specified timeframe Bar Uses an open/high/low/close convention Candlestick More weight attached to session direction Volume and Open Interest Analyst pays attention to the volume associated with move within a given session 6

7 What s the Aim? Define the big picture trend if there is one Compare health of underlying to a benchmark Search for shorter term opportunities Understand the likelihood of immediate up or down movement Define range Establish entry or exit points Determine warning signs of a breach of trend or a pattern reversal 7

8 Trendlines Straight line joining two or more price points Support line depicts upward trend Resistance depicts an area above current price that investors may find hard to breach Both can be horizontal lines Investors may eyeball the trend 8

9 Trendlines A B A = 200 target is = 1050 B = 200 target is = 550 9

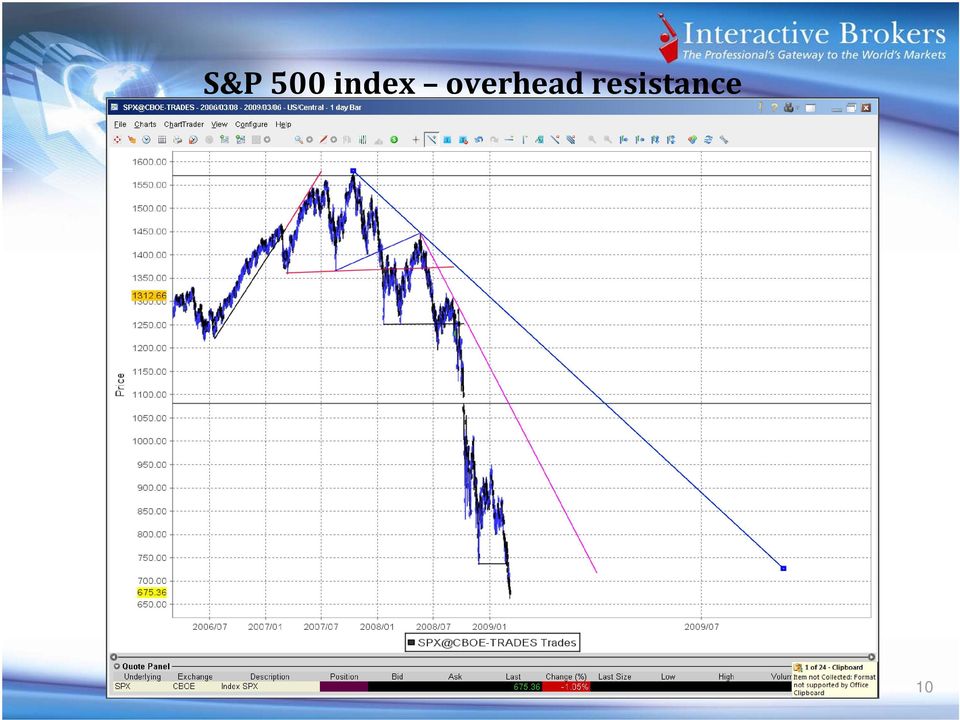
10 S&P 500 index overhead resistance 10
11 Chart Patterns Trendlines show prevailing up or down trend Parallel lines depict trading channel Patterns emerge Continuation Reversal Triangle Head & shoulders Wedge Pennant & flags 11

12 Triangles Continuation Reversal Continuation 12

13 Wedge 13

14 Pennants and Flags Flags and pennants work best on intra-day charts and sometimes need the technician to use a loose interpretation 14

15 Studies TWS has a variety of commonly used technical indicators Within a chart, select Charts and Add Study For brief description of any study, use the search box on the IB website 15

16 Moving Averages One of the simplest forms of analysis Compares average price for x days against a shorter period of y days Buy when more sensitive shorter moving average rises faster than longer period Sell when shorter moving average falls faster than longer period Different securities, indices and instruments require different length of data (one size does not fit all) Common periods are 5, 9, 21, 50, 90 and
 Common periods are 5, 9, 21,")
17 17

18 ADX/DMI Strength of trend indicator Uses two filters (DMI+ and DMI ) The net of these two values is smoothed to create Average Directional Index This index rises to confirm trending prices ADX returns values Optimal performance when ADX is between

19 19

20 MACD Moving Average Convergence Divergence Employs exponential moving averages Subtracts longer moving average from shorter moving average to create MACD Uses an even shorter exponential moving average to create signal line MACD passing up and down through signal line generates buy and sell signals MACD minus signal also creates histogram also a reliable technical indicator 20

21 21
22 Parabolic SAR Stop and Reverse May depict the current trend Initially established as a point at which prevailing position should be closed Rising dots below price are long exits Falling dots above price are short exits 22
23 23
24 Pivot Points TWS creates two resistance points above price Two support prices below price Both use previous days high, low and closing prices Pivot point is calculated using a five point system Some traders use these to cluster buy and sell orders for day trading Need to know when either is giving way 24
25 25
26 Relative Strength Indicator (RSI) Looks at a set of user defined data and compares number of up bars versus down bars to create an index Indicator oscillates between and confirms market strength Overbought readings range between Oversold readings range 0 20 Warning: Some of the best moves occur in these ranges! Useful for finding divergence between price and RSI to show false moves 26
27 27
28 Stochastic Oscillator Creates two lines %k and %d %k looks at most recent closing price and compares to the lowest reading from a specified range and divides by overall period range %d moving average of %k Buy and sell indications occur when %k crosses %d Again useful for confirmation of price action at lows (highs) 28
29 29
30 On Balance Volume Volume is a key component to trend development Creates a single line below the chart to show cumulative volume allowing for price direction Daily volume is ADDED when price closes up Volume total is SUBTRACTED when prices fall Use to gauge whether higher volume is supporting up or down trend Drawback is price settlement 30
31 31
32 Accumulate/Distribution Enhanced version of OBV Doesn t consider daily price change Focus on location of close relative to range of closes before adding or subtracting day s volume total AD line should follow prices Cumulative buying should see line rise Selling en masse should see line decline Looking for divergence between declining prices and accumulation of volume 32
33 33
34 Fibonacci Numbers Series of mathematical relationships Technician believes that history will repeat itself Prices move in predictable waves after a move has been established Key retracement points: 23.6% 38.2% 50% 61.8% 76.4% 34
35 Fibonacci Numbers 35
36 Conclusion Technical analysis is the study of prices Chartist identifies patterns to make predictions Patterns can be numerically evaluated and give rise to numerous studies Valuable work, but you must be prepared to apply various studies to different asset classes and time frames 36
37 Questions? 37
MATHEMATICAL TRADING INDICATORS
 MATHEMATICAL TRADING INDICATORS The mathematical trading methods provide an objective view of price activity. It helps you to build up a view on price direction and timing, reduce fear and avoid overtrading.
Technical Analysis. Technical Analysis. Schools of Thought. Discussion Points. Discussion Points. Schools of thought. Schools of thought
 The Academy of Financial Markets Schools of Thought Random Walk Theory Can t beat market Analysis adds nothing markets adjust quickly (efficient) & all info is already in the share price Price lies in
Disclaimer: The authors of the articles in this guide are simply offering their interpretation of the concepts. Information, charts or examples
 Disclaimer: The authors of the articles in this guide are simply offering their interpretation of the concepts. Information, charts or examples contained in this lesson are for illustration and educational
Chapter 2.3. Technical Indicators
 1 Chapter 2.3 Technical Indicators 0 TECHNICAL ANALYSIS: TECHNICAL INDICATORS Charts always have a story to tell. However, sometimes those charts may be speaking a language you do not understand and you
NEDBANK PRIVATE WEALTH STOCKBROKERS Graphical Analysis Manual
 This advanced charting application displays interactive, feature-rich, automatically-updated financial charts; The application also provides you with the ability to perform advanced technical analysis
Professional Trader Series: Moving Average Formula & Strategy Guide. by John Person
 Professional Trader Series: Moving Average Formula & Strategy Guide by John Person MOVING AVERAGE FORMULAS & STRATEGY GUIDE In an online seminar conducted for the Chicago Board of Trade, I shared how to
Stochastic Oscillator.
 Stochastic Oscillator. By Jay Lakhani www.4x4u.net George Lane was the originator of the stochastic indicator in the 1960 s; the indicator tracks the market momentum. Lane observed that as prices rise
A GUIDE TO WL INDICATORS
 A GUIDE TO WL INDICATORS GETTING TECHNICAL ABOUT TRADING: USING EIGHT COMMON INDICATORS TO MAKE SENSE OF TRADING What s a technical indicator and why should I use them? What s the market going to do next?
8 Day Intensive Course Lesson 5 Stochastics & Bollinger Bands
 8 Day Intensive Course Lesson 5 Stochastics & Bollinger Bands A)Trading with Stochastic Trading With Stochastic What is stochastic? Stochastic is an oscillator that works well in range-bound markets.[/i]
Understanding the market
 Understanding the market Technical Analysis Approach: part I Xiaoguang Wang President, Purdue Quantitative Finance Club PhD Candidate, Department of Statistics Purdue University wang913@purdue.edu Outline
How I Trade Profitably Every Single Month without Fail
 How I Trade Profitably Every Single Month without Fail First of all, let me take some time to introduce myself to you. I am Kelvin and I am a full time currency trader. I have a passion for trading and
Leon Wilson Trading Success
 Leon Wilson Trading Success A talk given by Mary de la Lande to the BullCharts User Group Meeting on 13 February 2008 1. Who is Leon Wilson? His Books and where to get them. 2. Book 1: The Business of
Technical Analysis of the Futures Markets:
 Technical Analysis of the Futures Markets: A Comprehensive Quide to Trading Methods and Applications John J. Murphy New York Institute of Finance A Prentice-Hall Company Introduction, xiii Acknowledgments,
Technical Analysis. Chart Formations. Brought to you by: FX-ebooks.com. Forex ebooks Library
 Technical Analysis Chart Formations Brought to you by: FX-ebooks.com Forex ebooks Library 1 Forex Mentor by Peter Bain The new Leading Professional Currency Trading System shows you how to trade currencies
Charting Glossary Version 1 September 2008
 Charting Glossary Version 1 September 2008 i Contents 1 Price...1 2 Charts...1 2.1 Line, Step, Scatter, Mountain charts... 1 2.2 Bar Charts (Open/High/Low/Close charts)... 1 2.3 Candle charts... 2 2.4
6.14. Oscillators and Indicators.
 6.14. Oscillators and Indicators. What is Momentum? The word momentum has two meanings to market technicians, one of them is a generic concept about how prices move, and the second one is a specific indicator.
Chapter 2.3. Technical Analysis: Technical Indicators
 Chapter 2.3 Technical Analysis: Technical Indicators 0 TECHNICAL ANALYSIS: TECHNICAL INDICATORS Charts always have a story to tell. However, from time to time those charts may be speaking a language you
Technical Indicators Tutorial - Forex Trading, Currency Forecast, FX Trading Signal, Forex Training Cour...
 Page 1 Technical Indicators Tutorial Technical Analysis Articles Written by TradingEducation.com Technical Indicators Tutorial Price is the primary tool of technical analysis because it reflects every
Trading with the High Performance Intraday Analysis Indicator Suite
 Trading with the High Performance Intraday Analysis Indicator Suite PowerZone Trading indicators can provide detailed information about the conditions of the intraday market that may be used to spot unique
Using Order Book Data
 Q3 2007 Using Order Book Data Improve Automated Model Performance by Thom Hartle TradeFlow Charts and Studies - Patent Pending TM Reprinted from the July 2007 issue of Automated Trader Magazine www.automatedtrader.net
BROKER SERVICES AND PLATFORM
 BROKER SERVICES AND PLATFORM A broker is an individual who executes buy and sell orders and get commission in the form of SPREAD (I will talk about SPREAD in the subsequent lessons). You trade through
atching Currency Moves with The Schaff Trend Cycle Indicator
 JULY/AUGUST 2002. VOLUME 4 CRunning a trend indicator through a cycle oscillator creates an effective entry technique into today s strongly trending currency markets, says Doug Schaff, a 20-year veteran
High Probability Trading Triggers for Gold & Silver
 Welcome to a CBOT Online Seminar High Probability Trading Triggers for Gold & Silver Presented by: John Person Sponsored by Interactive Brokers Live Presentation Starts at 3:30 PM Chicago Time NOTE: Futures
Retracement Or Reversal. Kennsei Trading, Inc. Chief Trader Dinger dinger@kennseitrading.com www.hotstocksforincome.com
 Retracement Or Reversal Kennsei Trading, Inc. Chief Trader Dinger dinger@kennseitrading.com www.hotstocksforincome.com Retracement Or Reversal Most of us have wondered, at some point, whether a decline
Commodity Channel Index
 Commodity (CCI) Developed by Donald Lambert, the Commodity (CCI) was designed to identify cyclical turns in commodities but can be applied to shares as well. The Commodity Channel Index uses a typical
TECHNICAL CHARTS UNDERSTANDING TECHNICAL CHARTS
 TECHNICAL CHARTS UNDERSTANDING TECHNICAL CHARTS Overview is an advanced charting application specifically designed to display interactive, feature rich, auto updated financial charts. The application provides
Using Formations To Identify Profit Opportunities
 Using Formations To Identify Profit Opportunities Using Formations To Identify Profit Opportunities The concepts and strategies discussed may not be suitable for all investors. It is important that investors
Trading with the Intraday Multi-View Indicator Suite
 Trading with the Intraday Multi-View Indicator Suite PowerZone Trading, LLC indicators can provide detailed information about the conditions of the intraday market that may be used to spot unique trading
Charting Made Easy. Wiley Trading
 Brochure More information from http://www.researchandmarkets.com/reports/2329600/ Charting Made Easy. Wiley Trading Description: Here is a treasure trove of easy to use tools for mapping your course through
SAIF-2011 Report. Rami Reddy, SOA, UW_P
 1) Title: Market Efficiency Test of Lean Hog Futures prices using Inter-Day Technical Trading Rules 2) Abstract: We investigated the effectiveness of most popular technical trading rules on the closing
Alerts & Filters in Power E*TRADE Pro Strategy Scanner
 Alerts & Filters in Power E*TRADE Pro Strategy Scanner Power E*TRADE Pro Strategy Scanner provides real-time technical screening and backtesting based on predefined and custom strategies. With custom strategies,
Using Bollinger Bands. by John Bollinger
 Article Text Copyright (c) Technical Analysis Inc. 1 Stocks & Commodities V. 10:2 (47-51): Using Bollinger Bands by John Bollinger Using Bollinger Bands by John Bollinger Trading bands, which are lines
Indicators. Applications and Pitfalls. Adam Grimes
 Indicators Applications and Pitfalls Adam Grimes CIO, Waverly Advisors, LLC October 6, 2015 Outline A little history lesson What indicators are and what they can do even more important what they can not
The 5 Exit Heroes. Exiting Your Forex Trades For Maximum Profits
 The 5 Exit Heroes Exiting Your Forex Trades For Maximum Profits IMPORTANT : As an added bonus for downloading this report, you also received additional free training videos. To access your bonuses, go
Day Trade System EZ Trade FOREX
 Day Trade System The EZ Trade FOREX Day Trading System is mainly used with four different currency pairs; the EUR/USD, USD/CHF, GBP/USD and AUD/USD, but some trades are also taken on the USD/JPY. It uses
Definitions to Basic Technical Analysis Terms. www.recognia.com
 Definitions to Basic Technical Analysis Terms www.recognia.com A Alert An alert is a notification sent when a significant event occurs in one or more investments of importance to a trader. Recognia sends
2 DAY MANAGEMENT DEVELOPMENT PROGRAM ON TECHNICAL ANALYSIS FOR SUCCESSFUL TRADING/ INVESTING
 NSE Management Development Programme Series 2015-16 2 DAY MANAGEMENT DEVELOPMENT PROGRAM ON TECHNICAL ANALYSIS FOR SUCCESSFUL TRADING/ INVESTING An initiative under P R O G R A M M E OBJECTIVE Technical
An Objective Leading Indicator Fibonacci Retracements
 An Objective Leading Indicator Fibonacci Retracements This article explains how to use Fibonacci as a leading indicator, combining it with other technical analysis tools to provide precise, objective entry
Nexgen Software Services
 Nexgen Software Services Trading Guide June 2016 2016 Nexgen Software Services Inc. Please read and understand the following disclaimers before proceeding: Futures, FX and SECURITIES and or options trading
Why the E.A.S.Y. Method?
 Why the E.A.S.Y. Method? Mark Douglas, author of Trading in the Zone, states: The best traders have developed an edge and more importantly, they trust their edge. Why the E.A.S.Y. Method? My trading edge
THE MACD: A COMBO OF INDICATORS FOR THE BEST OF BOTH WORLDS
 THE MACD: A COMBO OF INDICATORS FOR THE BEST OF BOTH WORLDS By Wayne A. Thorp Moving averages are trend-following indicators that don t work well in choppy markets. Oscillators tend to be more responsive
The Building Blocks for Succeeding with Forex Trading
 The Building Blocks for Succeeding with Forex Trading This e-book was created by traders and for traders with the aim of equipping traders with the right skills of earning big returns from trading forex
The 15 50 Trading System
 Main Premise: This is considered to be one of the most straight forward systems for a live trading style for day- and/or intraday trading. The 50 SMA is one of the most commonly used moving average numbers
Action Forex Company Limited 2010
 1 2 Sponsored by 3 TABLE OF CONTENTS TABLE OF CONTENTS... 4 INTRODUCTION... 5 CHAPTER 1 CHART ANALYSIS IN CURRENCY TRADING... 6 1.1 - IMPORTANCE OF CHART ANALYSIS IN CURRENCY TRADING... 6 1.2 - BASIC CHART
NEST STARTER PACK. Omnesys Technologies. Nest Starter Pack. February, 2012. https://plus.omnesysindia.com Page 1 of 36
 Omnesys Technologies Nest Starter Pack February, 2012 https://plus.omnesysindia.com Page 1 of 36 Document Information DOCUMENT CONTROL INFORMATION DOCUMENT Nest Starter Pack User Manual VERSION 1.1 VERSION
TECHNICAL ANALYSIS GLOSSARY
 TECHNICAL ANALYSIS GLOSSARY A ABC: Elliott Wave terminology for a three-wave countertrend price movement. Wave A is the first price wave against the trend of the market. Wave B is a corrective wave to
CONTENT 1. 2. 5-8 9 5. 6. 7.
 User Manual TM CONTENT 1. 2. 3. 4. 5. 6. 7. 8. 9. Introduction The Autochartist Interface Analysis Toolbar (A) Pattern Display (B) Search Pane (C) Results Pane (Completed Patterns) (D) Results Pane (Emerging
Technical Indicators Explained
 Chapter I. Technical Indicators Explained In This Chapter The information in this chapter is provided to help you learn how to use the technical indicators that are available for charting on the AIQ TradingExpert
The Use of Trend Lines and Charting Patterns in Trading the Forex Markets
 The Use of Trend Lines and Charting Patterns in Trading the Forex Markets The use of Trends and Trend Lines forms the basis of establishing the support and resistance levels and charting patterns that
THE CYCLE TRADING PATTERN MANUAL
 TIMING IS EVERYTHING And the use of time cycles can greatly improve the accuracy and success of your trading and/or system. THE CYCLE TRADING PATTERN MANUAL By Walter Bressert There is no magic oscillator
FOREX analysing made easy
 FOREX analysing made easy UNDERSTANDING TECHNICAL ANALYSIS An educational tool by Blackwell Global Contents Technical Analysis 2 Line Chart 3 Bar Chart 4 Candlestick Chart 5 Support and Resistance 6 Fibonacci
Technical Analysis Fibonacci Levels
 Technical Analysis Fibonacci Levels Retracements A retracement is a pullback within the context of a trend. Dip After a rise from 0 to 1, short term market participants start to take profit. This drives
Candlesticks For Support And Resistance
 NOVICE TRADER Candlesticks For Support And Resistance Even as you read this, the candlestick charting technique, with its origins in Japan, is being absorbed into the ways of Western technical analysis.
Exit Strategies for Stocks and Futures
 Exit Strategies for Stocks and Futures Presented by Charles LeBeau E-mail clebeau2@cox.net or visit the LeBeau web site at www.traderclub.com Disclaimer Each speaker at the TradeStationWorld Conference
Timing the Trade How to Buy Right before a Huge Price Advance
 Timing the Trade How to Buy Right before a Huge Price Advance By now you should have read my first two ebooks and learned about the life cycle of a market, stock, or ETF, and discovered the best indicators
RISK DISCLOSURE STATEMENT / DISCLAIMER AGREEMENT
 RISK DISCLOSURE STATEMENT / DISCLAIMER AGREEMENT Trading any financial market involves risk. This report and all and any of its contents are neither a solicitation nor an offer to Buy/Sell any financial
More informed trading Technical Analysis: Trading Using Multiple Time-frames
 Technical Analysis: Trading Using Multiple Time-frames Intermediate Level Introduction 1 Stock markets worldwide function because, at any given time, some traders want to buy whilst others want to sell.
ChartFilter Stock Tools Training Guide
 ChartFilter Stock Tools Training Guide Disclaimer MHP Systems Inc. is not responsible for investments made as a result of using this program. The purchaser of the license for use of this program is responsible
TECHNICAL ANALYSIS. Handbook. 2003 Bloomberg L.P. All rights reserved.
 TECHNICAL ANALYSIS Handbook 2003 Bloomberg L.P. All rights reserved. There are two principles of analysis used to forecast price movements in the financial markets -- fundamental analysis and technical
Advanced Trading Systems Collection MACD DIVERGENCE TRADING SYSTEM
 MACD DIVERGENCE TRADING SYSTEM 1 This system will cover the MACD divergence. With this trading system you can trade any currency pair (I suggest EUR/USD and GBD/USD when you start), and you will always
Trade Stocks Like A Pro
 Trade Stocks Like A Pro 5 TIPS Plus 3 Picks International Traders Expo New York By Dr. Charles B. Schaap, Jr. 5 Tips Tip #1: Use ADX to Trade Power Trends Tip #2: Use RSI (50/50 Strategy) for Timing the
CHART PATTERNS. www.tff-onlinetrading.com
 CHART PATTERNS Technical analysis, as you have seen in our Trading Academy videos so far, is not just about charts. It does, however, rely heavily on them and often uses chart patterns to assist in making
Stop Investing and Start Trading. How I Trade Technical Strategies Over Fundamental Strategies
 Stop Investing and Start Trading How I Trade Technical Strategies Over Fundamental Strategies PREPARATION PRIOR TO OPENING MARKET 1. On Daily Log Sheet record NAV [Net Asset Value] of portfolio. 2. Note
Pattern Recognition Software Guide
 Pattern Recognition Software Guide 2010 Important Information This material is for general information only and is not intended to provide trading or investment advice. All analysis and resulting conclusions
Chapter 1 Introduction Disclaimer: Forex Involves risk. So if you lose money you can't blame us we told you trading involves risk.
 By Casey Stubbs -Winners Edge Trading.com Table of Contents Chapter 1. Introduction Chapter 2.. Trading Plan Chapter 3.. Money Management Chapter 4. Moving Average Strategy Chapter 5. Stochastic Strategy
Basic Forex forecast methods: Technical analysis and fundamental analysis
 Forex forecasting Basic Forex forecast methods: Technical analysis and fundamental analysis This article provides insight into the two major methods of analysis used to forecast the behavior of the Forex
The Intraday Bias Indicator
 Wednesday, June 13, 2012 Issue 41 Wednesday, August 8, 2012 Intraday Time Analysis Erik Skyba, CMT Senior Quantitative Analyst TSLabs@TradeStation.com Features Studies/Files Included: Focus: Technical
Daily Close Above 1.1116 Would Signal More Protracted Retracement Phase
 12 June 2009 USD/CAD on Verge of Bullish Trend Reversal Global FX Strategy George Davis, CMT Chief Technical Analyst RBC Dominion Securities Inc. +1 416 842 6633 george.davis@rbccm.com Daily Close Above
TOMORROW'S TRADING TECHNOLOGY. 100% automated Fibonacci support and resistance levels that you can count on every single trading day in an instant.
 TOMORROW'S TRADING TECHNOLOGY 100% automated Fibonacci support and resistance levels that you can count on every single trading day in an instant. ProTrader Table of Contents 1. Areas A. Fibonacci Confluence
THE A-Z GUIDE TO E-MINI FUTURES TRADING
 THE A-Z GUIDE TO E-MINI FUTURES TRADING 1.800.800.3840 2 PAST PERFORMANCE IS NOT NECESSARILY INDICATIVE OF FUTURE PERFORMANCE. THE RISK OF LOSS IN TRADING FUTURES CONTRACTS OR COMMODITY OPTIONS CAN BE
Verizon is a Buy. Plain and simple... A stock does not make the new 52-Week high list unless it is in a very powerful price up trend.
 Verizon is a Buy In this week s newsletter we are going to explore the Prime Trade Select trade selection process outlined in Chapter 1 of the WOW weekly option manual. The best place to start the trade
ChartGenie USER GUIDE
 1. Using This Manual This manual is designed to familiarize new users with the Applet charting tool interface. Through this manual, user will learn and understand the various features and functions offered.
Trend Determination - a Quick, Accurate, & Effective Methodology
 Trend Determination - a Quick, Accurate, & Effective Methodology By; John Hayden Over the years, friends who are traders have often asked me how I can quickly determine a trend when looking at a chart.
Forex day trading system
 Forex day trading system Show me the money by Domino Hi my forex traders friends, I created this mini-ebook to give you many details about my forex day trading system and some ideas. I hope it can helps
Trading the Daniel Code Numbers
 Trading the Daniel Code Numbers INTRODUCTION... 2 ABOUT THE DC NUMBERS... 2 BEFORE YOU START... 2 GETTING STARTED... 2 Set-Up Bars... 3 DC Number Sequences... 4 Reversal Signals... 4 DC TRADING METHODOLOGY...
STREET SMARTS I. Planetary 2 Library. Introduction: Benefits: L I B R A R I E S
 Planetary 2 Library STREET SMARTS I Introduction: In today s world of computer trading, the small speculator often feels at a disadvantage to traders and corporations that have access to more powerful
Nest Pulse Impact Document
 Nest Pulse Impact Document July 25, 2012 1 Document Information DOCUMENT CONTROL INFORMATION DOCUMENT VERSION REVIEWER REVIEW NOTES Omnesys Nest Plus Nest Pulse Impact Document VERSION NOTES This Nest
Introducing the Fibonacci Retracement Channel Indicator
 Issue 45 Wednesday, December 12, 2012 Introducing the Fibonacci Retracement Channel Indicator Frederic Palmliden, CMT Senior Quantitative Analyst TSLabs@TradeStation.com Features Studies/Files Included:
How Well Do Traditional Momentum Indicators Work? Cynthia A. Kase, CMT President, Kase and Company, Inc., CTA October 10, 2006
 How Well Do Traditional Momentum Indicators Work? Cynthia A. Kase, CMT President, Kase and Company, Inc., CTA October 10, 2006 1.0 Introduction Most market technicians believe traditional momentum indicators,
2 Day Executive Workshop on Technical Analysis
 National Stock Exchange of India Limited 2 Day Executive Workshop on Technical Analysis OVERVIEW Technical Analysis is a science worth exploring for each market participant. Given the volatile nature of
Larry Williams Indicators
 Larry Williams Indicators Larry Williams Indicators - Williams COT NetPositions OI... 2 Larry Williams Indicators - Williams COT Comm Index... 3 Larry Williams Indicators - Williams COT LrgSpec Index...
BULL'S EYE TRADING. by Joe Duffy. A trading champion's guide to pinpointing tops and bottoms in any market
 BULL'S EYE TRADING A trading champion's guide to pinpointing tops and bottoms in any market by Joe Duffy Trading futures and options does involve financial risk. Contact us for a discussion of the potential
marketsurvival.net guide: The advanced guide to fibonacci trading How to trade stocks and Forex with Fibonacci numbers
 marketsurvival.net guide: The advanced guide to fibonacci trading How to trade stocks and Forex with Fibonacci numbers Contents FOREWORD... 5 PART 1. INTRODUCTION...7 WHY IS USING THE FIBONACCI TOOLS BETTER
Chart Patterns Tutorial - Forex Trading, Currency Forecast, FX Trading Signal, Forex Training Course, E...
 Page 1 Chart Patterns Tutorial Technical Analysis Articles Written by TradingEducation.com Chart Patterns Tutorial Traders have debated the merits of "technical analysis" versus "fundamental analysis"
How to use Hamzei Analytics CI and DCI Indicators By Fari Hamzei
 How to use Hamzei Analytics CI and DCI Indicators By Fari Hamzei A key element of your success in trading is early detection of the trend before the next big move occurs. Seeing the next trend in prices,
Chart Patterns Trader. Trader SUPPLEMENT. Understanding and Trading Classic Chart Patterns. By: Kevin Matras Zacks Investment Research, Inc
 Chart Patterns Trader Trader SUPPLEMENT Understanding and Trading Classic Chart Patterns By: Kevin Matras Zacks Investment Research, Inc Table of Contents Introduction.........................................................................
Trading Power Trends with ADX
 Trading Power Trends with ADX By Dr. Charles B. Schaap, Jr. International Trader s Expo New York City 18 February 2014 Disclaimer The information in this lecture is for educational purposes. No particular
Copyright 2010 by Kelvin Lee
 All rights reserved. No part of this publication may be reproduced, stored in a retrieval system, or transmitted, in any form or by any means, electronic, mechanical, photocopying, recording or otherwise,
VBM-ADX40 Method. (Wilder, J. Welles from Technical Analysis of Stocks and Commodities, February 1986.)
") VBM-ADX40 Method " I ve found that the most important thing in trading is always doing the right thing, whether or not you win or lose this is market savvy money management... I would go so far as to say
VBM-ADX40 Method " I ve found that the most important thing in trading is always doing the right thing, whether or not you win or lose this is market savvy money management... I would go so far as to say
My Techniques for making $150 a Day Trading Forex *Note for my more Advanced Strategies check out my site: Click Here
 My Techniques for making $150 a Day Trading Forex *Note for my more Advanced Strategies check out my site: Click Here The Strategy We will be looking at 2 different ways to day trade the Forex Markets.
4 Hour MACD Forex Strategy
 4 Hour MACD Forex Strategy Welcome to the 4 Hour MACD Forex Strategy. This strategy is aimed at simplicity as well as high probability trades. I have been in the equity market for almost ten years now
Using ADX to Trade Breakouts, Pullbacks, and Reversal Patterns. By Puneet Jain CFTe
 Using ADX to Trade Breakouts, Pullbacks, and Reversal Patterns By Puneet Jain CFTe (with DMI) ADX (Average Directional Index) is an indicator that measures trend strength shows trend direction. ADX tells
Technical Analysis Workshop Series Session Seven Fibonacci Trading Part 1
 Technical Analysis Workshop Series Session Seven Fibonacci Trading Part 1 DISCLOSURES & DISCLAIMERS This research material has been prepared by NUS Invest. NUS Invest specifically prohibits the redistribution
Autochartist Intro Guide
 Autochartist Intro Guide CONTENT 1. 2. 3. 4. 5. 6. 7. 8. 9. 10. Getting Started with Autochartist Autochartist Pattern Results Column Headings Creating Custom Searches Trending Pattern Types Trending Pattern
CHART TRADING GUIDE 1
 CHART TRADING GUIDE 1 How to understand chart trading This guide is designed to teach you the basics of chart trading- the chart patterns that are covered in this booklet can be used for short and medium
Trend Analysis From Fibonacci to Gann Ichimoku versus MACD Proprietary Signals
 Trend Analysis From Fibonacci to Gann Ichimoku versus MACD Proprietary Signals Cornelius Luca Luca Global Research Banco Best Lisbon 2010 From Fibonacci to Gann Who is Fibonacci? Leonardo of Pisa (1170s
Binary Options Trading Strategy. Professional Binary Trading Manual Strategy
 Binary Options Trading Strategy Professional Binary Trading Manual Strategy U.S. Government Required Disclaimer - Commodity Futures Trading Commission Futures and Options trading has large potential rewards,
Guide to Trading Indices
 Guide to Trading Indices About Logic Investments Logic Investments was founded in 2009 to provide a relationship-based advisory investment service to clients who want a more traditional, reliable and personal
New York Traders Expo 2012
 New York Traders Expo 2012 with JAMES CHEN, CTA, CMT Director of Technical Research and Education All rights reserved, FXDD Inc. 2010 Today s Topic: High Probability Strategies for Trading Forex www.fxdd.com
Chapter 4.2. Technical Analysis: Fibonacci
 1 Chapter 4.2 Technical Analysis: Fibonacci 0 Contents TECHNICAL ANALYSIS: FIBONACCI Fibonacci analysis is the study of identifying potential support and resistance levels in the future based on past price