Storing, analyzing, and presenting Stata output. Julian Reif University of Chicago Stata Conference Boston July 15, 2010
|
|
|
- Elizabeth Flowers
- 7 years ago
- Views:
Transcription
1 1 Storing, analyzing, and presenting Stata output Julian Reif University of Chicago Stata Conference Boston July 15, 2010
2 Handling Stata output Storing regsave, svret Analyzing Excel PivotTables Presenting texsave (LaTeX tables) 2
3 Why use these Stata commands? Copy/pasting results is slow and error-prone With these commands, write one Stata script to: Run analyses Store and manipulate results Output results into a table linked to a paper, MS Excel, etc. These commands separate the storing of results from the outputting of results 3
4 4 Storing output
5 Storing output Stata commands usually store output in e() and r(). qui sysuse auto, clear. qui summ price. return list scalars: r(n) = 74 r(sum_w) = 74 r(mean) = r(var) = r(sd) = r(min) = 3291 r(max) = r(sum) = Modules regsave and svret convert these into Stata datasets Results can then be manipulated with standard Stata commands 5
6 Use svret to store returned results svret stores returned results Can save macros and scalars stored in e(), r(), and s() Syntax: svret [classlist] [, long type(type) format(%fmt) keep(returnlist)] where classlist is one or more of the following: e, r, s, all, type can be one of the following: all, scalars, or macros, and returnlist is a list of returned results currently in memory, e.g., r(n). 6
7 svret: example 1. sysuse auto, clear (1978 Automobile Data). summ price. list Variable Obs Mean Std. Dev. Min Max price svret, long format(%8.2fc) variable contents 1. r(n) r(var) 8,699, r(max) 15, r(mean) 6, r(min) 3, r(sd) 2, r(sum) 456, r(sum_w) 74 7
8 Use regsave to store regression output regsave stores regression output Coefficients, standard errors Optionally: p-values, t-stats, confidence intervals, covariances, and more User can optionally specify: Coefficient and variance-covariance matrices Labels Table format (Abbreviated) syntax: regsave [coeflist] [using filename] [, tstat pval ci level(#) addlabel(string) addvar(string) table(name, *) *] 8
9 regsave: example 1. sysuse auto, clear (1978 Automobile Data).. regress price mpg trunk Source SS df MS Number of obs = 74 F( 2, 71) = Model Prob > F = Residual R-squared = Adj R-squared = Total Root MSE = price Coef. Std. Err. t P> t [95% Conf. Interval] mpg trunk _cons regsave, tstat pval ci.. list var coef stderr tstat pval ci_lower ci_upper N r2 1. mpg trunk _cons
10 10 Analyzing output
11 Large sets of results can be conveniently analyzed in Excel PivotTables (Instructions for MS Office Excel 2007) Step 1: Open Microsoft Office Excel Step 2: Click Data->From text Import outsheeted results Click Finish, then Ok Step 3: Click Insert->PivotTable, then Ok Step 4: Arrange PivotTable as desired 11
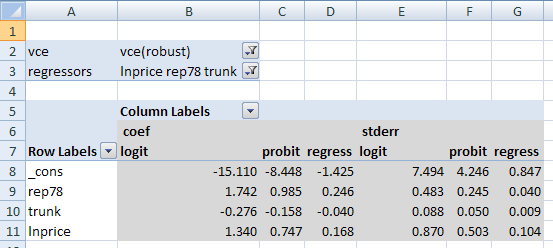
12 regsave: example 2 sysuse auto, clear tempfile tmpfile gen lnprice = ln(price) local replace "replace" foreach reg in "probit" "logit" "regress" { foreach regressors in "lnprice" "lnprice rep78" "lnprice rep78 trunk" { foreach stderr in "vce(robust)" "vce(cluster foreign)" "" { `reg foreign `regressors, `stderr regsave using "`tmpfile ", p \\\ addlabel(vce,`stderr,regressors,`regressors,reg,`reg ) `replace } } } local replace "append" * Format and outsheet results for use in PivotTable use "`tmpfile ", clear replace var = subinstr(var,"foreign:","",.) outsheet using results.txt, replace 12

13 PivotTable: view 1 13
14 PivotTable: view 2 14
15 15 Presenting output
16 regsave can create standard tables. qui sysuse auto.dta, clear.. qui regress price mpg trunk headroom length.. qui regsave using results, table(reg, parentheses(stderr) format(%8.2fc)) replace.. qui areg price mpg trunk headroom length, absorb(foreign).. qui regsave using results, table(areg, parentheses(stderr) format(%8.2fc)) append.. use results, clear.. list var reg areg 1. mpg_coef mpg_stderr (87.75) (82.30) 3. trunk_coef trunk_stderr (119.82) (112.24) 5. headroom_coef headroom_stderr (486.01) (453.11) 7. length_coef length_stderr (27.03) (28.04) 9. _cons_coef 6, _cons_stderr (6,036.94) (6,126.44) 11. N r
17 regsave can create standard tables cont d. replace var = "" if strpos(var,"stderr") (5 real changes made).. replace var = subinstr(var,"_coef","",.) (5 real changes made).. list var reg areg 1. mpg (87.75) (82.30) 3. trunk (119.82) (112.24) 5. headroom (486.01) (453.11) 7. length (27.03) (28.04) 9. _cons 6, (6,036.94) (6,126.44) 11. N r
18 Use texsave to create LaTeX tables texsave creates LaTeX tables Supports booktabs package 100% compatible with Scientific Workplace Supports titles, footnotes, borderlines and many LaTeX options (Abbreviated) syntax: texsave [varlist] using filename [if] [in] [, title(string) size(numlist) marker(string) hlines(numlist) footnote(*) booktabs frag replace *] 18

19 texsave: example 1. sysuse auto.dta, clear (1978 Automobile Data). texsave make mpg trunk if price > 8000 using "table.tex", title(mpg and trunk space) footnote("*variable trunk is measu > red in cubic feet") replace 19
20 texsave: example 2 sysuse auto, clear tempfile tmpfile gen lnprice = ln(price) local replace "replace" foreach reg in "probit" "logit" "scobit" { `reg foreign lnprice rep78 trunk regsave using "`tmpfile ", addlabel(regression,"`reg ") \\\ table(`reg, asterisk(5 1) parentheses(stderr) format(%8.3fc)) `replace local replace "append" } * Create and format LaTeX table use "`tmpfile ", clear replace var = subinstr(var,"foreign:","",1) replace var = subinstr(var,"_coef","",1) replace var = "" if strpos(var,"stderr")!=0 replace var = "lnalpha" if strpos(var,"lnalpha")!=0 label variable var "Variable name" local fn "A */** next to coefficient indicates significance at the 5/1\% level." texsave using "table.tex", title(my regressions) booktabs hlines(10) \\\ autonumber footnote("`fn ") varlabels replace 20

21 texsave: example 2 s table 21
22 Advanced texsave options frag Create a table that can be linked to a LaTeX document via /input{} command marker, align, location Give the table a tag and specify its alignment and location headerlines(string), footlines(string), headlines(string) Insert additional LaTeX code before, after, or in the header of your table Many LaTeX table formatting options also available Alignment and size of footnote Font styles (italics, bold-faced, etc.) 22
23 Feedback and feature requests welcome 23
outreg help pages Write formatted regression output to a text file After any estimation command: (Text-related options)
") outreg help pages OUTREG HELP PAGES... 1 DESCRIPTION... 2 OPTIONS... 3 1. Text-related options... 3 2. Coefficient options... 4 3. Options for t statistics, standard errors, etc... 5 4. Statistics options...
outreg help pages OUTREG HELP PAGES... 1 DESCRIPTION... 2 OPTIONS... 3 1. Text-related options... 3 2. Coefficient options... 4 3. Options for t statistics, standard errors, etc... 5 4. Statistics options...
MODEL I: DRINK REGRESSED ON GPA & MALE, WITHOUT CENTERING
 Interpreting Interaction Effects; Interaction Effects and Centering Richard Williams, University of Notre Dame, http://www3.nd.edu/~rwilliam/ Last revised February 20, 2015 Models with interaction effects
MULTIPLE REGRESSION EXAMPLE
 MULTIPLE REGRESSION EXAMPLE For a sample of n = 166 college students, the following variables were measured: Y = height X 1 = mother s height ( momheight ) X 2 = father s height ( dadheight ) X 3 = 1 if
Title. Syntax. stata.com. fp Fractional polynomial regression. Estimation
 Title stata.com fp Fractional polynomial regression Syntax Menu Description Options for fp Options for fp generate Remarks and examples Stored results Methods and formulas Acknowledgment References Also
<next> <PDF version> Tutorial: Automated table generation and reporting with Stata. Ben Jann, ETH Zurich, jannb@ethz.ch.
 Tutorial: Automated table generation and reporting with Stata Ben Jann, ETH Zurich, jannb@ethz.ch November 2008 Required user packages: - mat2txt - estwrite - estout
Interaction effects between continuous variables (Optional)
") Interaction effects between continuous variables (Optional) Richard Williams, University of Notre Dame, http://www.nd.edu/~rwilliam/ Last revised February 0, 05 This is a very brief overview of this somewhat
Interaction effects between continuous variables (Optional) Richard Williams, University of Notre Dame, http://www.nd.edu/~rwilliam/ Last revised February 0, 05 This is a very brief overview of this somewhat
Marginal Effects for Continuous Variables Richard Williams, University of Notre Dame, http://www3.nd.edu/~rwilliam/ Last revised February 21, 2015
 Marginal Effects for Continuous Variables Richard Williams, University of Notre Dame, http://www3.nd.edu/~rwilliam/ Last revised February 21, 2015 References: Long 1997, Long and Freese 2003 & 2006 & 2014,
Lecture 15. Endogeneity & Instrumental Variable Estimation
 Lecture 15. Endogeneity & Instrumental Variable Estimation Saw that measurement error (on right hand side) means that OLS will be biased (biased toward zero) Potential solution to endogeneity instrumental
Syntax Menu Description Options Remarks and examples Stored results Methods and formulas References Also see
 Title stata.com summarize Summary statistics Syntax Menu Description Options Remarks and examples Stored results Methods and formulas References Also see Syntax summarize [ varlist ] [ if ] [ in ] [ weight
<next> Italian Stata Users Group meeting. Tutorial: Output processing and automatic reporting with Stata. Ben Jann, ETH Zurich, jannb@ethz.
 Italian Stata Users Group meeting Tutorial: Output processing and automatic reporting with Stata Ben Jann, ETH Zurich, jannb@ethz.ch Italian Stata Users Group meeting Florence, November 19-20, 2009 Required
IAPRI Quantitative Analysis Capacity Building Series. Multiple regression analysis & interpreting results
 IAPRI Quantitative Analysis Capacity Building Series Multiple regression analysis & interpreting results How important is R-squared? R-squared Published in Agricultural Economics 0.45 Best article of the
Lab 5 Linear Regression with Within-subject Correlation. Goals: Data: Use the pig data which is in wide format:
 Lab 5 Linear Regression with Within-subject Correlation Goals: Data: Fit linear regression models that account for within-subject correlation using Stata. Compare weighted least square, GEE, and random
xtmixed & denominator degrees of freedom: myth or magic
 xtmixed & denominator degrees of freedom: myth or magic 2011 Chicago Stata Conference Phil Ender UCLA Statistical Consulting Group July 2011 Phil Ender xtmixed & denominator degrees of freedom: myth or
Please follow the directions once you locate the Stata software in your computer. Room 114 (Business Lab) has computers with Stata software
 has computers with Stata software") STATA Tutorial Professor Erdinç Please follow the directions once you locate the Stata software in your computer. Room 114 (Business Lab) has computers with Stata software 1.Wald Test Wald Test is used
STATA Tutorial Professor Erdinç Please follow the directions once you locate the Stata software in your computer. Room 114 (Business Lab) has computers with Stata software 1.Wald Test Wald Test is used
Department of Economics Session 2012/2013. EC352 Econometric Methods. Solutions to Exercises from Week 10 + 0.0077 (0.052)
") Department of Economics Session 2012/2013 University of Essex Spring Term Dr Gordon Kemp EC352 Econometric Methods Solutions to Exercises from Week 10 1 Problem 13.7 This exercise refers back to Equation
Department of Economics Session 2012/2013 University of Essex Spring Term Dr Gordon Kemp EC352 Econometric Methods Solutions to Exercises from Week 10 1 Problem 13.7 This exercise refers back to Equation
25 Working with categorical data and factor variables
 25 Working with categorical data and factor variables Contents 25.1 Continuous, categorical, and indicator variables 25.1.1 Converting continuous variables to indicator variables 25.1.2 Converting continuous
Stata Walkthrough 4: Regression, Prediction, and Forecasting
 Stata Walkthrough 4: Regression, Prediction, and Forecasting Over drinks the other evening, my neighbor told me about his 25-year-old nephew, who is dating a 35-year-old woman. God, I can t see them getting
From the help desk: Swamy s random-coefficients model
 The Stata Journal (2003) 3, Number 3, pp. 302 308 From the help desk: Swamy s random-coefficients model Brian P. Poi Stata Corporation Abstract. This article discusses the Swamy (1970) random-coefficients
Quick Stata Guide by Liz Foster
 by Liz Foster Table of Contents Part 1: 1 describe 1 generate 1 regress 3 scatter 4 sort 5 summarize 5 table 6 tabulate 8 test 10 ttest 11 Part 2: Prefixes and Notes 14 by var: 14 capture 14 use of the
ECON 142 SKETCH OF SOLUTIONS FOR APPLIED EXERCISE #2
 University of California, Berkeley Prof. Ken Chay Department of Economics Fall Semester, 005 ECON 14 SKETCH OF SOLUTIONS FOR APPLIED EXERCISE # Question 1: a. Below are the scatter plots of hourly wages
ESTIMATING AVERAGE TREATMENT EFFECTS: IV AND CONTROL FUNCTIONS, II Jeff Wooldridge Michigan State University BGSE/IZA Course in Microeconometrics
 ESTIMATING AVERAGE TREATMENT EFFECTS: IV AND CONTROL FUNCTIONS, II Jeff Wooldridge Michigan State University BGSE/IZA Course in Microeconometrics July 2009 1. Quantile Treatment Effects 2. Control Functions
The Regression Calibration Method for Fitting Generalized Linear Models with Additive Measurement Error
 The Stata Journal (), Number, pp. 1 11 The Regression Calibration Method for Fitting Generalized Linear Models with Additive Measurement Error James W. Hardin Norman J. Arnold School of Public Health University
Failure to take the sampling scheme into account can lead to inaccurate point estimates and/or flawed estimates of the standard errors.
 Analyzing Complex Survey Data: Some key issues to be aware of Richard Williams, University of Notre Dame, http://www3.nd.edu/~rwilliam/ Last revised January 24, 2015 Rather than repeat material that is
Correlation and Regression
 Correlation and Regression Scatterplots Correlation Explanatory and response variables Simple linear regression General Principles of Data Analysis First plot the data, then add numerical summaries Look
August 2012 EXAMINATIONS Solution Part I
 August 01 EXAMINATIONS Solution Part I (1) In a random sample of 600 eligible voters, the probability that less than 38% will be in favour of this policy is closest to (B) () In a large random sample,
Using outreg2 to report regression output, descriptive statistics, frequencies and basic crosstabulations (v1.6 draft)
") Using outreg2 to report regression output, descriptive statistics, frequencies and basic crosstabulations (v1.6 draft) Oscar Torres-Reyna otorres@princeton.edu March 2014 http://dss.princeton.edu/training/
Using outreg2 to report regression output, descriptive statistics, frequencies and basic crosstabulations (v1.6 draft) Oscar Torres-Reyna otorres@princeton.edu March 2014 http://dss.princeton.edu/training/
Nonlinear Regression Functions. SW Ch 8 1/54/
 Nonlinear Regression Functions SW Ch 8 1/54/ The TestScore STR relation looks linear (maybe) SW Ch 8 2/54/ But the TestScore Income relation looks nonlinear... SW Ch 8 3/54/ Nonlinear Regression General
Addressing Alternative. Multiple Regression. 17.871 Spring 2012
 Addressing Alternative Explanations: Multiple Regression 17.871 Spring 2012 1 Did Clinton hurt Gore example Did Clinton hurt Gore in the 2000 election? Treatment is not liking Bill Clinton 2 Bivariate
Creating plots and tables of estimation results Frame 1. Creating plots and tables of estimation results using parmest and friends
 Creating plots and tables of estimation results Frame 1 Creating plots and tables of estimation results using parmest and friends Roger Newson (King s College, London, UK) roger.newson@kcl.ac.uk Why save
MODELING AUTO INSURANCE PREMIUMS
 MODELING AUTO INSURANCE PREMIUMS Brittany Parahus, Siena College INTRODUCTION The findings in this paper will provide the reader with a basic knowledge and understanding of how Auto Insurance Companies
Handling missing data in Stata a whirlwind tour
 Handling missing data in Stata a whirlwind tour 2012 Italian Stata Users Group Meeting Jonathan Bartlett www.missingdata.org.uk 20th September 2012 1/55 Outline The problem of missing data and a principled
A Simple Feasible Alternative Procedure to Estimate Models with High-Dimensional Fixed Effects
 DISCUSSION PAPER SERIES IZA DP No. 3935 A Simple Feasible Alternative Procedure to Estimate Models with High-Dimensional Fixed Effects Paulo Guimarães Pedro Portugal January 2009 Forschungsinstitut zur
Multicollinearity Richard Williams, University of Notre Dame, http://www3.nd.edu/~rwilliam/ Last revised January 13, 2015
 Multicollinearity Richard Williams, University of Notre Dame, http://www3.nd.edu/~rwilliam/ Last revised January 13, 2015 Stata Example (See appendices for full example).. use http://www.nd.edu/~rwilliam/stats2/statafiles/multicoll.dta,
Discussion Section 4 ECON 139/239 2010 Summer Term II
 Discussion Section 4 ECON 139/239 2010 Summer Term II 1. Let s use the CollegeDistance.csv data again. (a) An education advocacy group argues that, on average, a person s educational attainment would increase
Linear Regression Models with Logarithmic Transformations
 Linear Regression Models with Logarithmic Transformations Kenneth Benoit Methodology Institute London School of Economics kbenoit@lse.ac.uk March 17, 2011 1 Logarithmic transformations of variables Considering
Milk Data Analysis. 1. Objective Introduction to SAS PROC MIXED Analyzing protein milk data using STATA Refit protein milk data using PROC MIXED
 1. Objective Introduction to SAS PROC MIXED Analyzing protein milk data using STATA Refit protein milk data using PROC MIXED 2. Introduction to SAS PROC MIXED The MIXED procedure provides you with flexibility
Rockefeller College University at Albany
 Rockefeller College University at Albany PAD 705 Handout: Hypothesis Testing on Multiple Parameters In many cases we may wish to know whether two or more variables are jointly significant in a regression.
Advanced Stata Topics
 Advanced Stata Topics CEP and STICERD London School of Economics Lent Term 2009 Alexander C. Lembcke email: a.c.lembcke@lse.ac.uk Homepage: http://personal.lse.ac.uk/lembcke This is an updated version
Statistics 104 Final Project A Culture of Debt: A Study of Credit Card Spending in America TF: Kevin Rader Anonymous Students: LD, MH, IW, MY
 Statistics 104 Final Project A Culture of Debt: A Study of Credit Card Spending in America TF: Kevin Rader Anonymous Students: LD, MH, IW, MY ABSTRACT: This project attempted to determine the relationship
From this it is not clear what sort of variable that insure is so list the first 10 observations.
 MNL in Stata We have data on the type of health insurance available to 616 psychologically depressed subjects in the United States (Tarlov et al. 1989, JAMA; Wells et al. 1989, JAMA). The insurance is
1. What is the critical value for this 95% confidence interval? CV = z.025 = invnorm(0.025) = 1.96
 = 1.96") 1 Final Review 2 Review 2.1 CI 1-propZint Scenario 1 A TV manufacturer claims in its warranty brochure that in the past not more than 10 percent of its TV sets needed any repair during the first two years
1 Final Review 2 Review 2.1 CI 1-propZint Scenario 1 A TV manufacturer claims in its warranty brochure that in the past not more than 10 percent of its TV sets needed any repair during the first two years
SHORT COURSE ON Stata SESSION ONE Getting Your Feet Wet with Stata
 SHORT COURSE ON Stata SESSION ONE Getting Your Feet Wet with Stata Instructor: Cathy Zimmer 962-0516, cathy_zimmer@unc.edu 1) INTRODUCTION a) Who am I? Who are you? b) Overview of Course i) Working with
Forecasting in STATA: Tools and Tricks
 Forecasting in STATA: Tools and Tricks Introduction This manual is intended to be a reference guide for time series forecasting in STATA. It will be updated periodically during the semester, and will be
especially with continuous
 Handling interactions in Stata, especially with continuous predictors Patrick Royston & Willi Sauerbrei German Stata Users meeting, Berlin, 1 June 2012 Interactions general concepts General idea of a (two-way)
Editor Executive Editor Associate Editors Copyright Statement:
 The Stata Journal Editor H. Joseph Newton Department of Statistics Texas A & M University College Station, Texas 77843 979-845-3142 979-845-3144 FAX jnewton@stata-journal.com Associate Editors Christopher
How to set the main menu of STATA to default factory settings standards
 University of Pretoria Data analysis for evaluation studies Examples in STATA version 11 List of data sets b1.dta (To be created by students in class) fp1.xls (To be provided to students) fp1.txt (To be
Title. Syntax. stata.com. odbc Load, write, or view data from ODBC sources. List ODBC sources to which Stata can connect odbc list
 Title stata.com odbc Load, write, or view data from ODBC sources Syntax Menu Description Options Remarks and examples Also see Syntax List ODBC sources to which Stata can connect odbc list Retrieve available
The following postestimation commands for time series are available for regress:
 Title stata.com regress postestimation time series Postestimation tools for regress with time series Description Syntax for estat archlm Options for estat archlm Syntax for estat bgodfrey Options for estat
Basic Statistical and Modeling Procedures Using SAS
 Basic Statistical and Modeling Procedures Using SAS One-Sample Tests The statistical procedures illustrated in this handout use two datasets. The first, Pulse, has information collected in a classroom
Module 14: Missing Data Stata Practical
 Module 14: Missing Data Stata Practical Jonathan Bartlett & James Carpenter London School of Hygiene & Tropical Medicine www.missingdata.org.uk Supported by ESRC grant RES 189-25-0103 and MRC grant G0900724
Syntax Menu Description Options Remarks and examples Stored results Methods and formulas References Also see. level(#) , options2
 , options2") Title stata.com ttest t tests (mean-comparison tests) Syntax Syntax Menu Description Options Remarks and examples Stored results Methods and formulas References Also see One-sample t test ttest varname
Title stata.com ttest t tests (mean-comparison tests) Syntax Syntax Menu Description Options Remarks and examples Stored results Methods and formulas References Also see One-sample t test ttest varname
Data Analysis Methodology 1
 Data Analysis Methodology 1 Suppose you inherited the database in Table 1.1 and needed to find out what could be learned from it fast. Say your boss entered your office and said, Here s some software project
Sample Size Calculation for Longitudinal Studies
 Sample Size Calculation for Longitudinal Studies Phil Schumm Department of Health Studies University of Chicago August 23, 2004 (Supported by National Institute on Aging grant P01 AG18911-01A1) Introduction
The average hotel manager recognizes the criticality of forecasting. However, most
 Introduction The average hotel manager recognizes the criticality of forecasting. However, most managers are either frustrated by complex models researchers constructed or appalled by the amount of time
Using Stata 9 & Higher for OLS Regression Richard Williams, University of Notre Dame, http://www3.nd.edu/~rwilliam/ Last revised January 8, 2015
 Using Stata 9 & Higher for OLS Regression Richard Williams, University of Notre Dame, http://www3.nd.edu/~rwilliam/ Last revised January 8, 2015 Introduction. This handout shows you how Stata can be used
Module 2 Basic Data Management, Graphs, and Log-Files
 AGRODEP Stata Training April 2013 Module 2 Basic Data Management, Graphs, and Log-Files Manuel Barron 1 and Pia Basurto 2 1 University of California, Berkeley, Department of Agricultural and Resource Economics
Stata 12 Merging Guide. Nathan Favero Texas A&M University October 19, 2012
 Nathan Favero Texas A&M University October 19, 2012 Contents Best Practices, pg. 3 Using Merge & Append, pg. 4 Merge, pg. 11 Append, pg. 14 Other Useful Commands, pg. 15 Importing Data into Stata, pg.
Panel Data Analysis Fixed and Random Effects using Stata (v. 4.2)
") Panel Data Analysis Fixed and Random Effects using Stata (v. 4.2) Oscar Torres-Reyna otorres@princeton.edu December 2007 http://dss.princeton.edu/training/ Intro Panel data (also known as longitudinal
Panel Data Analysis Fixed and Random Effects using Stata (v. 4.2) Oscar Torres-Reyna otorres@princeton.edu December 2007 http://dss.princeton.edu/training/ Intro Panel data (also known as longitudinal
Nonlinear relationships Richard Williams, University of Notre Dame, http://www3.nd.edu/~rwilliam/ Last revised February 20, 2015
 Nonlinear relationships Richard Williams, University of Notre Dame, http://www.nd.edu/~rwilliam/ Last revised February, 5 Sources: Berry & Feldman s Multiple Regression in Practice 985; Pindyck and Rubinfeld
Econometrics I: Econometric Methods
 Econometrics I: Econometric Methods Jürgen Meinecke Research School of Economics, Australian National University 24 May, 2016 Housekeeping Assignment 2 is now history The ps tute this week will go through
Trade Flows and Trade Policy Analysis. October 2013 Dhaka, Bangladesh
 Trade Flows and Trade Policy Analysis October 2013 Dhaka, Bangladesh Witada Anukoonwattaka (ESCAP) Cosimo Beverelli (WTO) 1 Introduction to STATA 2 Content a. Datasets used in Introduction to Stata b.
Outline. Topic 4 - Analysis of Variance Approach to Regression. Partitioning Sums of Squares. Total Sum of Squares. Partitioning sums of squares
 Topic 4 - Analysis of Variance Approach to Regression Outline Partitioning sums of squares Degrees of freedom Expected mean squares General linear test - Fall 2013 R 2 and the coefficient of correlation
DETERMINANTS OF CAPITAL ADEQUACY RATIO IN SELECTED BOSNIAN BANKS
 DETERMINANTS OF CAPITAL ADEQUACY RATIO IN SELECTED BOSNIAN BANKS Nađa DRECA International University of Sarajevo nadja.dreca@students.ius.edu.ba Abstract The analysis of a data set of observation for 10
1.1. Simple Regression in Excel (Excel 2010).
.") .. Simple Regression in Excel (Excel 200). To get the Data Analysis tool, first click on File > Options > Add-Ins > Go > Select Data Analysis Toolpack & Toolpack VBA. Data Analysis is now available under
.. Simple Regression in Excel (Excel 200). To get the Data Analysis tool, first click on File > Options > Add-Ins > Go > Select Data Analysis Toolpack & Toolpack VBA. Data Analysis is now available under
Using Stata for Categorical Data Analysis
 Using Stata for Categorical Data Analysis NOTE: These problems make extensive use of Nick Cox s tab_chi, which is actually a collection of routines, and Adrian Mander s ipf command. From within Stata,
Data exploration with Microsoft Excel: analysing more than one variable
 Data exploration with Microsoft Excel: analysing more than one variable Contents 1 Introduction... 1 2 Comparing different groups or different variables... 2 3 Exploring the association between categorical
Multiple Linear Regression
 Multiple Linear Regression A regression with two or more explanatory variables is called a multiple regression. Rather than modeling the mean response as a straight line, as in simple regression, it is
Development of the nomolog program and its evolution
 Development of the nomolog program and its evolution Towards the implementation of a nomogram generator for the Cox regression Alexander Zlotnik, Telecom.Eng. Víctor Abraira Santos, PhD Ramón y Cajal University
eq5d: A command to calculate index values for the EQ-5D quality-of-life instrument
 The Stata Journal (2011) 11, Number 1, pp. 120 125 eq5d: A command to calculate index values for the EQ-5D quality-of-life instrument Juan Manuel Ramos-Goñi Canary Islands Health Care Service Canary Islands,
HURDLE AND SELECTION MODELS Jeff Wooldridge Michigan State University BGSE/IZA Course in Microeconometrics July 2009
 HURDLE AND SELECTION MODELS Jeff Wooldridge Michigan State University BGSE/IZA Course in Microeconometrics July 2009 1. Introduction 2. A General Formulation 3. Truncated Normal Hurdle Model 4. Lognormal
Application of the Generalized Propensity Score. Evaluation of public contributions to Piedmont enterprises
 Dipartimento di Politiche Pubbliche e Scelte Collettive POLIS Department of Public Policy and Public Choice POLIS Working paper n. 89 April 2007 Application of the Generalized Propensity Score. Evaluation
Interaction effects and group comparisons Richard Williams, University of Notre Dame, http://www3.nd.edu/~rwilliam/ Last revised February 20, 2015
 Interaction effects and group comparisons Richard Williams, University of Notre Dame, http://www3.nd.edu/~rwilliam/ Last revised February 20, 2015 Note: This handout assumes you understand factor variables,
Regression Analysis: A Complete Example
 Regression Analysis: A Complete Example This section works out an example that includes all the topics we have discussed so far in this chapter. A complete example of regression analysis. PhotoDisc, Inc./Getty
ECONOMICS 351* -- Stata 10 Tutorial 2. Stata 10 Tutorial 2
 Stata 10 Tutorial 2 TOPIC: Introduction to Selected Stata Commands DATA: auto1.dta (the Stata-format data file you created in Stata Tutorial 1) or auto1.raw (the original text-format data file) TASKS:
MEASURING THE INVENTORY TURNOVER IN DISTRIBUTIVE TRADE
 MEASURING THE INVENTORY TURNOVER IN DISTRIBUTIVE TRADE Marijan Karić, Ph.D. Josip Juraj Strossmayer University of Osijek Faculty of Economics in Osijek Gajev trg 7, 31000 Osijek, Croatia Phone: +385 31
We are going to delve into some economics today. Specifically we are going to talk about production and returns to scale.
 Firms and Production We are going to delve into some economics today. Secifically we are going to talk aout roduction and returns to scale. firm - an organization that converts inuts such as laor, materials,
is paramount in advancing any economy. For developed countries such as
 Introduction The provision of appropriate incentives to attract workers to the health industry is paramount in advancing any economy. For developed countries such as Australia, the increasing demand for
Doing Multiple Regression with SPSS. In this case, we are interested in the Analyze options so we choose that menu. If gives us a number of choices:
 Doing Multiple Regression with SPSS Multiple Regression for Data Already in Data Editor Next we want to specify a multiple regression analysis for these data. The menu bar for SPSS offers several options:
I n d i a n a U n i v e r s i t y U n i v e r s i t y I n f o r m a t i o n T e c h n o l o g y S e r v i c e s
 I n d i a n a U n i v e r s i t y U n i v e r s i t y I n f o r m a t i o n T e c h n o l o g y S e r v i c e s Linear Regression Models for Panel Data Using SAS, Stata, LIMDEP, and SPSS * Hun Myoung Park,
Using R for Linear Regression
 Using R for Linear Regression In the following handout words and symbols in bold are R functions and words and symbols in italics are entries supplied by the user; underlined words and symbols are optional
Survey Data Analysis in Stata
 Survey Data Analysis in Stata Jeff Pitblado Associate Director, Statistical Software StataCorp LP 2009 Canadian Stata Users Group Meeting Outline 1 Types of data 2 2 Survey data characteristics 4 2.1 Single
Regression step-by-step using Microsoft Excel
 Step 1: Regression step-by-step using Microsoft Excel Notes prepared by Pamela Peterson Drake, James Madison University Type the data into the spreadsheet The example used throughout this How to is a regression
Access Queries (Office 2003)
") Access Queries (Office 2003) Technical Support Services Office of Information Technology, West Virginia University OIT Help Desk 293-4444 x 1 oit.wvu.edu/support/training/classmat/db/ Instructor: Kathy
Access Queries (Office 2003) Technical Support Services Office of Information Technology, West Virginia University OIT Help Desk 293-4444 x 1 oit.wvu.edu/support/training/classmat/db/ Instructor: Kathy
SAS R IML (Introduction at the Master s Level)
") SAS R IML (Introduction at the Master s Level) Anton Bekkerman, Ph.D., Montana State University, Bozeman, MT ABSTRACT Most graduate-level statistics and econometrics programs require a more advanced knowledge
SAS R IML (Introduction at the Master s Level) Anton Bekkerman, Ph.D., Montana State University, Bozeman, MT ABSTRACT Most graduate-level statistics and econometrics programs require a more advanced knowledge
Descriptive Statistics
 Descriptive Statistics Descriptive statistics consist of methods for organizing and summarizing data. It includes the construction of graphs, charts and tables, as well various descriptive measures such
Correlated Random Effects Panel Data Models
 INTRODUCTION AND LINEAR MODELS Correlated Random Effects Panel Data Models IZA Summer School in Labor Economics May 13-19, 2013 Jeffrey M. Wooldridge Michigan State University 1. Introduction 2. The Linear
Figure 1. An embedded chart on a worksheet.
 8. Excel Charts and Analysis ToolPak Charts, also known as graphs, have been an integral part of spreadsheets since the early days of Lotus 1-2-3. Charting features have improved significantly over the
Computer Training Centre University College Cork. Excel 2013 Pivot Tables
 Computer Training Centre University College Cork Excel 2013 Pivot Tables Table of Contents Pivot Tables... 1 Changing the Value Field Settings... 2 Refreshing the Data... 3 Refresh Data when opening a
Data Tool Platform SQL Development Tools
 Data Tool Platform SQL Development Tools ekapner Contents Setting SQL Development Preferences...5 Execution Plan View Options Preferences...5 General Preferences...5 Label Decorations Preferences...6
Northern Colorado Retail Study: A shift-share analysis 2000 to 2010
 Northern Colorado Retail Study: A shift-share analysis 2000 to 2010 Everitt Real Estate Center Steven P Laposa, PhD Christopher Hannum, PhD Economics Candidate Austin Carter, Senior (Real Estate Major)
Data Mining and Data Warehousing. Henryk Maciejewski. Data Mining Predictive modelling: regression
 Data Mining and Data Warehousing Henryk Maciejewski Data Mining Predictive modelling: regression Algorithms for Predictive Modelling Contents Regression Classification Auxiliary topics: Estimation of prediction
Introduction to STATA 11 for Windows
 1/27/2012 Introduction to STATA 11 for Windows Stata Sizes...3 Documentation...3 Availability...3 STATA User Interface...4 Stata Language Syntax...5 Entering and Editing Stata Commands...6 Stata Online
Standard errors of marginal effects in the heteroskedastic probit model
 Standard errors of marginal effects in the heteroskedastic probit model Thomas Cornelißen Discussion Paper No. 320 August 2005 ISSN: 0949 9962 Abstract In non-linear regression models, such as the heteroskedastic
Stepwise Regression. Chapter 311. Introduction. Variable Selection Procedures. Forward (Step-Up) Selection
 Selection") Chapter 311 Introduction Often, theory and experience give only general direction as to which of a pool of candidate variables (including transformed variables) should be included in the regression model.
Chapter 311 Introduction Often, theory and experience give only general direction as to which of a pool of candidate variables (including transformed variables) should be included in the regression model.
Using Stata s esttab and outreg2 with MS-Word to make publication-style regression tables
 Using Stata s esttab and outreg2 with MS-Word to make publication-style regression tables by Brianne Barclay Department of Sociology/Anthropology Florida International University University Park Miami,
Competing-risks regression
 Competing-risks regression Roberto G. Gutierrez Director of Statistics StataCorp LP Stata Conference Boston 2010 R. Gutierrez (StataCorp) Competing-risks regression July 15-16, 2010 1 / 26 Outline 1. Overview
Data exploration with Microsoft Excel: univariate analysis
 Data exploration with Microsoft Excel: univariate analysis Contents 1 Introduction... 1 2 Exploring a variable s frequency distribution... 2 3 Calculating measures of central tendency... 16 4 Calculating
A Beginner s Guide to Matrix Algebra & Matrix Linear Regression Using Stata (Mata)
") A Beginner s Guide to Matrix Algebra & Matrix Linear Regression Using Stata (Mata) Jason Eichorst, Rice University jaeichorst@rice.edu Poli 503 September 8, 2009 Abstract This guide is intended for an
A Beginner s Guide to Matrix Algebra & Matrix Linear Regression Using Stata (Mata) Jason Eichorst, Rice University jaeichorst@rice.edu Poli 503 September 8, 2009 Abstract This guide is intended for an
KSTAT MINI-MANUAL. Decision Sciences 434 Kellogg Graduate School of Management
 KSTAT MINI-MANUAL Decision Sciences 434 Kellogg Graduate School of Management Kstat is a set of macros added to Excel and it will enable you to do the statistics required for this course very easily. To