ECG Filtering. Willem Einthoven s EKG machine, 1903
|
|
|
- Ella Curtis
- 9 years ago
- Views:
Transcription
1 ECG Filtering Willem Einthoven s EKG machine, 1903 ECG Filtering Three common noise sources q Baseline wander q Power line interference q Muscle noise When filtering any biomedical signal care should be taken not to alter the desired information in any way A major concern is how the QRS complex influences the output of the filter; to the filter they often pose a large unwanted impulse Possible distortion caused by the filter should be carefully quantified 1

2 Baseline Wander Baseline Wander Baseline wander, or extragenoeous lowfrequency high-bandwidth components, can be caused by: q Perspiration (effects electrode impedance) q Respiration q Body movements Can cause problems to analysis, especially when exmining the low-frequency ST-T segment Two main approaches used are linear filtering and polynomial fitting 2

3 BW Linear, time-invariant filtering Basically make a highpass filter to cut of the lowerfrequency components (the baseline wander) The cut-off frequency should be selected so as to ECG signal information remains undistorted while as much as possible of the baseline wander is removed; hence the lowest-frequency component of the ECG should be saught. This is generally thought to be definded by the slowest heart rate. The heart rate can drop to 40 bpm, implying the lowest frequency to be 0.67 Hz. Again as it is not percise, a sufficiently lower cutoff frequency of about 0.5 Hz should be used. A filter with linear phase is desirable in order to avoid phase distortion that can alter various temporal realtionships in the cardiac cycle Linear phase response can be obtained with finite impulse response, but the order needed will easily grow very high (approximately 2000) q Figure shows filters of 400 (dashdot) and 2000 (dashed) and a 5th order forward-backward filter (solid) The complexity can be reduced by for example forwardbackward IIR filtering. This has some drawbacks, however: q not real-time (the backward part...) q application becomes increasingly difficult at higher sampling rates as poles move closer to the unit circle, resulting in unstability q hard to extend to time-varying cut-offs 3

4 Another way of reducing filter complexity is by first decimating and then again interpolating the signal Decimation removes the high-frequency content, and now a lowpass filter can be used to output an estimate of the baseline wander The estimate is interpolated back to the original sampling rate and subtracted from the original signal BW Linear, time-variant filtering Baseline wander can also be of higher frequency, for example in stress tests, and in such situations using the minimal heart rate for the base can be inefficeient. By noting how the ECG spectrum shifts in frequency when heart rate increases, one may suggest coupling the cut-off frequency with the prevailing heart rate instead Schematic example of Baseline noise and the ECG Spectrum at a a) lower heart rate b) higher heart rate 4

5 How to represent the prevailing heart rate q A simple but useful way is just to estimate the length of the interval between R peaks, the RR interval q Linear interpolation for interior values Time-varying cut-off frequency should be inversely proportional to the distance between the RR peaks q In practise an upper limit must be set to avoid distortion in very short RR intervals A single prototype filter can be designed and subjected to simple transformations to yield the other filters BW Polynomial Fitting One alternative to basline removal is to fit polynomials to representative points in the ECG q q q Knots selected from a silent segment, often the best choise is the PQ interval A polynomial is fitted so that it passes through every knot in a smooth fashion This type of baseline removal requires the QRS complexes to have been identified and the PQ interval localized 5

6 Higher-order polynomials can provide a more accurate estimate but at the cost of additional computational complexity A popular approach is the cubic spline estimation technique q third-order polynomials are fitted to successive sets of triple knots q By using the third-order polynomial from the Taylor series and requiring the estimate to pass through the knots and estimating the first derivate linearly, a solution can be found q Performance is critically dependent on the accuracy of knot detection, PQ interval detection is difficult in more noisy conditions Polynomial fitting can also adapt to the heart rate (as the heart rate increases, more knots are available), but performs poorly when too few knots are available Baseline Wander Comparsion An comparison of the methods for baseline wander removal at a heart rate of 120 beats per minute a) Original ECG b) time-invariant filtering c) heart rate dependent filtering d) cubic spline fitting 6
, but performs poorly when too few knots are available Baseline Wander Comparsion An comparison of the methods for")
7 Power Line Interference Electromagnetic fields from power lines can cause 60 Hz sinusoidal interference, possibly accompanied by some of its harmonics Such noise can cause problems interpreting lowamplitude waveforms and spurious waveforms can be introduced. Naturally precautions should be taken to keep power lines as far as possible or shield and ground them, but this is not always possible PLI Linear Filtering A very simple approach to filtering power line interference is to create a filter defined by a comple-conjugated pair of zeros that lie on the unit circle at the interfering frequency ω 0 q This notch will of course also attenuate ECG waveforms constituted by frequencies close to ω 0 q The filter can be improved by adding a pair of complex-conjugated poles positioned at the same angle as the zeros, but at a radius. The radius then determines the notch bandwidth. q Another problem presents; this causes increased transient response time, resulting in a ringing artifact after the transient 7

8 Pole-zero diagram for two second-order IIR filters with identical locations of zeros, but with radiuses of 0.75 and 0.95 More sophisticated filters can be constructed for, for example a narrower notch However, increased frequency resolution is always traded for decreased time resolution, meaning that it is not possible to design a linear time-invariant filter to remove the noise without causing ringing PLI Nonlinear Filtering One possibility is to create a nonlinear filter which builds on the idea of subtracting a sinusoid, generated by the filter, from the observed signal x(n) q The amplitude of the sinusoid v(n) = sin(ω 0 n) is adapted to the power line interference of the observed signal through the use of an error function e(n) = x(n) v(n) q The error function is dependent of the DC level of x(n), but that can be removed by using for example the first difference : e (n) = e(n) e(n-1) q Now depending on the sign of e (n), the value of v(n) is updated by a negative or positive increment α, v*(n) = v(n) + α sgn(e (n)) 8
 q The amplitude of the sinusoid v(n) = sin(ω 0 n) is adapted to the power line interference of the observed signal")
9 The output signal is obtained by subtracting the interference estimate from the input, y(n) = x(n) v*(n) If α is too small, the filter poorly tracks changes in the power line interference amplitude. Conversely, too large a α causes extra noise due to the large step alterations Filter convergence: a) pure sinusoid b) output of filter with α=1 c) output of filter with α=0.2 PLI Comparison of linear and nonlinear filtering Comparison of power line interference removal: a) original signal b) scond-order IIR filter c) nonlinear filter with transient suppression, α = 10 µv 9
 output of filter with α=0.")
10 Muscle Noise Filtering Muscle noise can cause severe problems as low-amplitude waveforms can be obstructed q Especially in recordings during exercise Muscle noise is not associated with narrow band filtering, but is more difficult since the spectral content of the noise considerably overlaps with that of the PQRST complex However, ECG is a repetitive signal and thus techniques like ensemble averaging can be used q Successful reduction is restricted to one QRS morphology at a time and requires several beats to become available MN Time-varying lowpass filtering A time-varying lowpass filter with variable frequency response, for example Gaussian impulse response, may be used. q Here a width function β(n) defined the width of the gaussian, h(k,n) ~ e - β(n)k2 q The width function is designed to reflect local signal properties such that the smooth segments of the ECG are subjected to considerable filtering whereas the steep slopes (QRS) remains essentially unaltered q By making β(n) proportional to derivatives of the signal slow changes cause small β(n), resulting in slowly decaying impulse response, and vice versa. 10

11 MN Other considerations Also other already mentioned techniques may be applicable; q the time-varying lowpass filter examined with baseline wander q the method for power line interference based on trunctated series expansions However, a notable problem is that the methods tend to create artificial waves, little or no smoothing in the QRS complex or other serious distortions Muscle noise filtering remains largely an unsolved problem Conclusions Both baseline wander and powerline interference removal are mainly a question of filtering out a narrow band of lower-than-ecg frequency interference. q The main problems are the resulting artifacts and how to optimally remove the noise Muscle noise, on the other hand, is more difficult as it overlaps with actual ECG data For the varying noise types (baseline wander and muscle noise) an adaptive approach seems quite appropriate, if the detection can be done well. For power line interference, the nonlinear approach seems valid as ringing artifacts are almost unavoidable otherwise 11

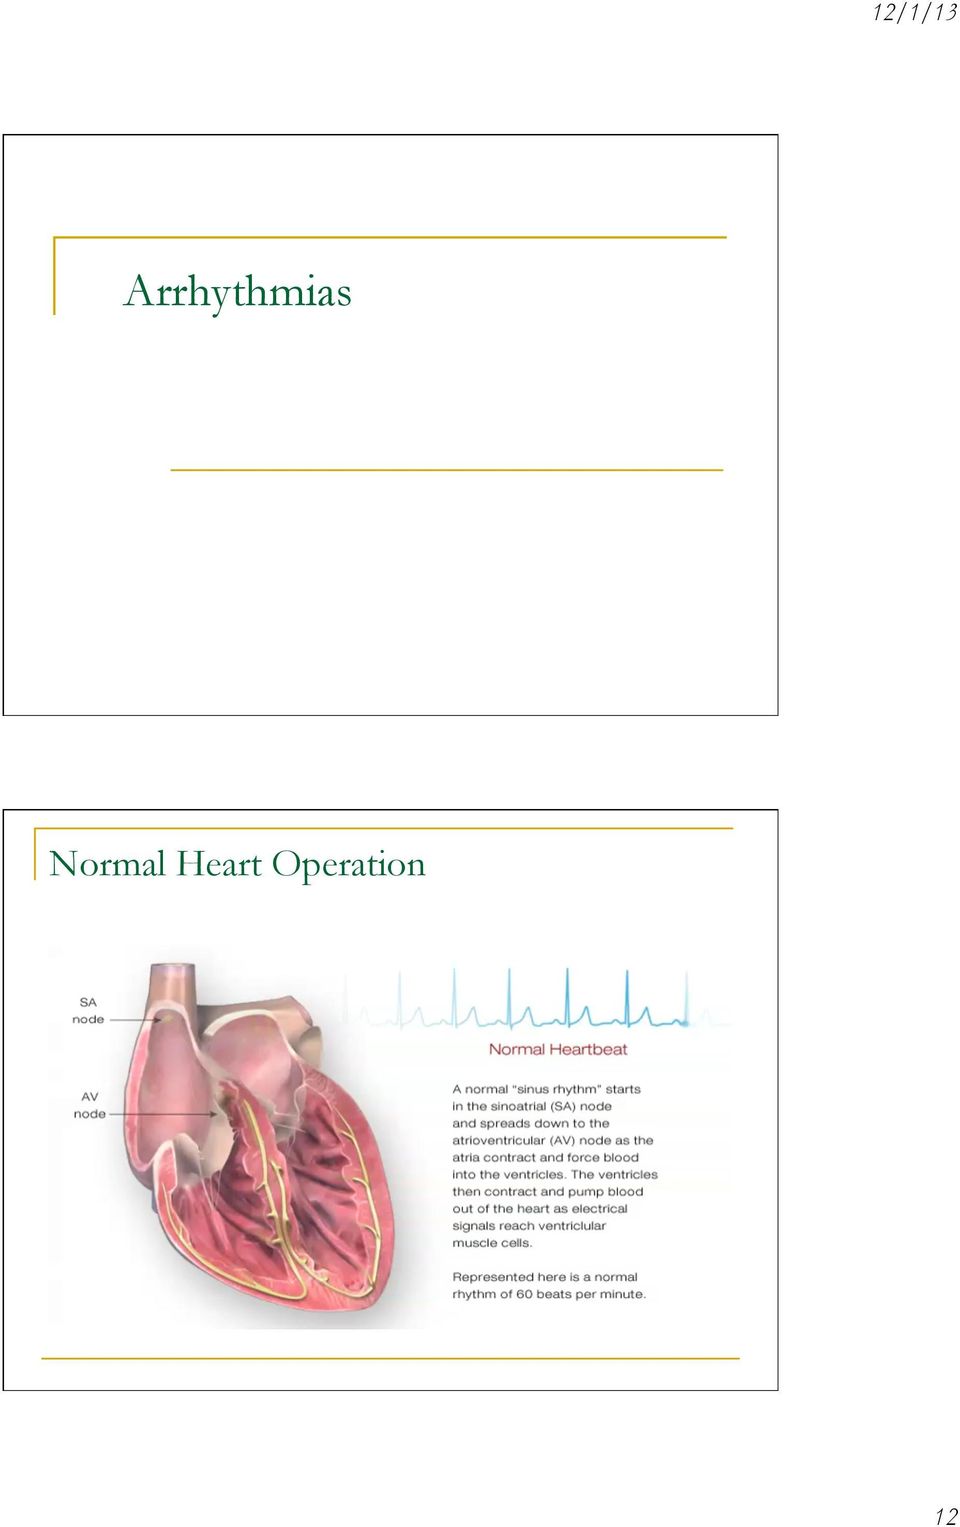
12 Arrhythmias Normal Heart Operation 12
13 Arrhythmia: Atrial Fibrillation Arrhythmias An arrhythmia is defined as any rhythm other than normal sinus rhythm Requires we accurately measure the heart rate Heart rate is best measured via QRS detection 13

14 Cardiac Cycle P Wave-Atrial Depolarization PR Segment-Indicative of the delay in the AV node PR Interval-Refers to all electrical activity in the heart before the impulse reaches the ventricles Q Wave-First negative deflection after the P wave but before the R wave R Wave-First positive deflection following the P wave S Wave-First negative deflection after the R wave QRS Complex-Signifies ventricual depolarization T Wave-Indicates ventricular repolarization (Note: Atrial repolarization wave is buried in the QRS complex). Normal Sinus Rhythm Sinus node is the pacemaker, firing at a regular rate of bpm. Each beat is conducted normally through to the ventricles Regularity: regular Rate: beats per minute P Wave: uniform shape; one P wave for each QRS PRI: seconds and constant QRS:.04 to.1 seconds 14

15 Sinus Bradycardia Sinus node is the pacemaker, firing regularly at a rate of less than 60 times per minute. Each impulse is conducted normally through to the ventricles Regularity: The R-R intervals are constant; Rhythm is regular Rate: Atrial and Ventricular rates are equal; heart rate less than 60 P Wave: Uniform P wave in front of every QRS PRI: PRI is between and constant QRS: QRS is less than.12 Sinus Tachycardia Sinus node is the pacemaker, firing regularly at a rate of greater than 100 times per minute. Each impulse is conducted normally through to the ventricles. Regularity: The R-R intervals are constant; Rhythm is regular Rate: Atrial and Ventricular rates are equal; heart rate greater than 100 P Wave: Uniform P wave in front of every QRS PRI: PRI is between and constant QRS:QRS is than.12 15

16 Atrial Flutter A single irritable focus within the atria issues an impulse that is conducted in a rapid, repetitive fashion. To protect the ventricles from receiving too many impulses, the AV node blocks some of the impulses from being conducted through to the ventricles. Regularity: Atrial rhythm is regular. Ventricular rhythm will be regular if the AV node conducts impulses through in a consistent pattern. If the pattern varies, the ventricular rate will be irregular Rate: Atrial rate is between beats per minute. Ventricular rate will depend on the ratio of impulses conducted through to the ventricles. P Wave: When the atria flutter they produce a series of well defined P waves. When seen together, these "Flutter" waves have a sawtooth appearance. PRI: Because of the unusual "Flutter" configuration of the P wave and the proximity of the wave to the QRS complex, it is often impossible to determine a PRI in the arrhythmia. Therefore, the PRI is not measured in Atrial Flutter. QRS: QRS is less than.12 seconds; measurement can be difficult if one or more flutter waves is concealed within the QRS complex. Atrial Fibrillation The atria are so irritable that a multitude of foci initiate impulses, causing the atria to depolarize repeatedly in a fibrillatory manner. The AV node blocks most of the impulses, allowing only a limited number through to the ventricles. Regularity: Atrial rhythm is unmeasurable; all atrial activity is chaotic. The ventricular rhythm is grossly irregular, having no pattern to its irregularity. Rate: Atrial rate cannot be measured because it is so chaotic; research indicates that it exceeds 350 beats per minute. The ventricular rate is significantly slower because the AV node blocks most of the impulses. If the ventricular rate is below 100 beats per minute, the rhythm is said to be "controlled"; if it is over 100 bpm, it is considered to have a "rapid ventricular response." P Wave: In this arrhythmia the atria are not depolarizing in an effective way; instead, they are fibrillating. Thus, no P wave is produced. All atrial activity is depicted as "fibrillatory" waves, or grossly chaotic undulations of the baseline. PRI: Since no P waves are visible, no PRI can be measured. QRS: QRS is less than.12 16

17 Ventricular Tachycardia An irritable focus in the ventricles fires regularly at a rate of beats per minute to override higher sites for control of the heart. Regularity: This rhythm is usually regular, although it can be slightly irregular. Rate: Atrial rate cannot be determined. The ventricular rate range is beats per minute. If the rate is below 150 bpm, it is considered a slow VT. If the rate exceeds 250 bpm, its called Ventricular Flutter. P Wave: None of the QRS complexes will be preceded by P waves; you may see dissociated P waves intermittently across the strip. PRI: Since the rhythm originates in the ventricles, there will be no PRI. QRS: The QRS complexes will be wide and bizarre, measuring at least.12 seconds. It is often difficult to differentiate between the QRS and the T wave. Ventricular Fibrillation Multiple foci in the ventricles become irritable and generate uncoordinated, chaotic impulses that cause the heart to fibrillate rather than contract. Regularity: There are no waves or complexes that can be analyzed to determine regularity. The baseline is totally chaotic. Rate: The rate cannot be determined since there are no discernible waves or complexes to measure. P Wave: There are no discernible P waves. PRI: There is no PRI. QRS: There are no discernible QRS complexes. 17

18 AV Block 2 First Degree The AV node selectively conducts some beats while blocking others. Those that are not blocked are conducted through to the ventricles, although they may encounter a slight delay in the node. Once in the ventricles, conduction proceeds normally. Regularity: If the conduction ratio is consistent, the R-R interval will be constant, and the rhythm will be regular. If the conduction ratio varies, the R-R will be irregular. Rate: Atrial rate is usually normal; since many of the atrial impulses are blocked, the ventricular rate will usually be in the bradycardia range, often one-half, one-third, or one-fourth of the atrial rate. P Wave: Upright and uniform; there are always more P waves than QRS complexes. PRI: PRI on conducted beats will be constant across the strip QRS: QRS is less than.12 AV Block 2 Second Degree As the sinus node initiates impulses, each one is delayed in the AV node a little longer than the preceding one, until one impulse is eventually blocked completely. Those impulses that are conducted travel normally through the ventricles. Regularity: Irregular; the R-R interval gets shorter as the PRI gets longer. Rate: Usually slightly slower than normal P Wave: Upright and uniform; some P waves are followed by QRS complexes. PRI: Progressively lengthens until one P wave is blocked QRS: QRS is less than.12 18

19 Third Degree Heart Block The block at the AV node is complete. The sinus beats cannot penetrate the node and thus are not conducted through to the ventricles. An escape mechanism from either the junction or the ventricles will take over to pace the ventricles. The atria and ventricles function in a totally dissociated fashion. Regularity: Regular Rate: Atrial rate is usually normal (60-100bpm); ventricular rate: if the focus is junctional, if the focus in ventricular. P Wave: Upright and uniform; more p waves than QRS complexes. PRI: No relationship between p waves and QRS complexes; p waves can occasionally be found superimposed on the QRS complex. QRS: Less than.12 seconds if the focus is junctional,.12 seconds or greater if the focus is ventricular. Asystole The heart has lost its electrical activity. There is no electrical pacemaker to initiate electrical flow. Regularity: Not measurable; there is no electrical activity. Rate: Not measurable; there is no electrical activity. P Waves: Not measurable; there is no electrical activity. PRI: Not measurable; there is no electrical activity. QRS: Not measurable; there is no electrical activity. 19

20 QRS Complex P wave: depolarization of right and left atrium QRS complex: right and left ventricular depolarization ST-T wave: ventricular repolarization 39 QRS Detection QRS detection is important in all kinds of ECG signal processing QRS detector must be able to detect a large number of different QRS morphologies QRS detector must not lock onto certain types of rhythms but treat next possible detection as if it could occur almost anywhere 40 20

21 QRS Detection Bandpass characteristics to preserve essential spectral content (e.g. enhance QRS, suppress P and T wave), typical center frequency Hz and bandwidth 5-10 Hz Enhance QRS complex from background noise, transform each QRS complex into single positive peak Test whether a QRS complex is present or not (e.g. a simple amplitude threshold) 41 Signal and Noise Problems Changes in QRS morphology q of physiological origin q due to technical problems Occurrence of noise with q large P or T waves q myopotentials q transient artifacts (e.g. electrode problems) 42 21
22 Signal and Noise Problems 43 QRS Detection Peak-and-valley picking strategy Use of local extreme values as basis for QRS detection Base of several QRS detectors Distance between two extreme values must be within certain limits to qualify as a cardiac waveform Also used in data compression of ECG signals 44 22
23 Linear Filtering To enhance QRS from background noise Examples of linear, time-invariant filters for QRS detection: q Filter that emphasizes segments of signal containing rapid transients (i.e. QRS complexes) Only suitable for resting ECG and good SNR q Filter that emphasizes rapid transients + lowpass filter 45 Linear Filtering q Family of filters, which allow large variability in signal and noise properties Suitable for long-term ECG recordings (because no multipliers) Filter matched to a certain waveform not possible in practice ð Optimize linear filter parameters (e.g. L 1 and L 2 ) Filter with impulse response defined from detected QRS complexes 46 23
24 Nonlinear Transformations To produce a single, positive-valued peak for each QRS complex q Smoothed squarer Only large-amplitude events of sufficient duration (QRS complexes) are preserved in output signal z(n). q q Envelope techniques Several others 47 Decision Rule To determine whether or not a QRS complex has occurred Fixed threshold Adaptive threshold q QRS amplitude and morphology may change drastically during a course of just a few seconds Here only amplitude-related decision rules Noise measurements 48 24
25 Decision Rule Interval-dependent QRS detection threshold q Threshold updated once for every new detection and is then held fixed during following interval until threshold is exceeded and a new detection is found Time-dependent QRS detection threshold - Improves rejection of largeamplitude T waves - Detects low-amplitude ectopic beats - Eye-closing period 49 Implement a QRS Detector & display Heart Rate Bandpass characteristics to preserve essential spectral content (e.g. enhance QRS, suppress P and T wave), typical center frequency Hz and bandwidth 5-10 Hz Enhance QRS complex from background noise, transform each QRS complex into single positive peak Test whether a QRS complex is present or not (e.g. a simple amplitude threshold) 50 25
MULTIPLE CHOICE. Choose the one alternative that best completes the statement or answers the question.
 Exam Name MULTIPLE CHOICE. Choose the one alternative that best completes the statement or answers the question. 1) What term is used to refer to the process of electrical discharge and the flow of electrical
QRS Complexes. Fast & Easy ECGs A Self-Paced Learning Program
 6 QRS Complexes Fast & Easy ECGs A Self-Paced Learning Program Q I A ECG Waveforms Normally the heart beats in a regular, rhythmic fashion producing a P wave, QRS complex and T wave I Step 4 of ECG Analysis
By the end of this continuing education module the clinician will be able to:
 EKG Interpretation WWW.RN.ORG Reviewed March, 2015, Expires April, 2017 Provider Information and Specifics available on our Website Unauthorized Distribution Prohibited 2015 RN.ORG, S.A., RN.ORG, LLC Developed
NEONATAL & PEDIATRIC ECG BASICS RHYTHM INTERPRETATION
 NEONATAL & PEDIATRIC ECG BASICS & RHYTHM INTERPRETATION VIKAS KOHLI MD FAAP FACC SENIOR CONSULATANT PEDIATRIC CARDIOLOGY APOLLO HOSPITAL MOB: 9891362233 ECG FAX LINE: 011-26941746 THE BASICS: GRAPH PAPER
BASIC CARDIAC ARRHYTHMIAS Revised 10/2001
 BASIC CARDIAC ARRHYTHMIAS Revised 10/2001 A Basic Arrhythmia course is a recommended prerequisite for ACLS. A test will be given that will require you to recognize cardiac arrest rhythms and the most common
Feature Vector Selection for Automatic Classification of ECG Arrhythmias
 Feature Vector Selection for Automatic Classification of ECG Arrhythmias Ch.Venkanna 1, B. Raja Ganapathi 2 Assistant Professor, Dept. of ECE, G.V.P. College of Engineering (A), Madhurawada, A.P., India
Understanding the Electrocardiogram. David C. Kasarda M.D. FAAEM St. Luke s Hospital, Bethlehem
 Understanding the Electrocardiogram David C. Kasarda M.D. FAAEM St. Luke s Hospital, Bethlehem Overview 1. History 2. Review of the conduction system 3. EKG: Electrodes and Leads 4. EKG: Waves and Intervals
2 Review of ECG Analysis
 2 Review of ECG Analysis In 1887, Augustus D. Waller published the first human electrocardiogram (ECG) recorded with a capillary electrometer. Subsequently, Willem Einthoven invented a more sensitive galvanometer
Electrocardiography I Laboratory
 Introduction The body relies on the heart to circulate blood throughout the body. The heart is responsible for pumping oxygenated blood from the lungs out to the body through the arteries and also circulating
HTEC 91. Topic for Today: Atrial Rhythms. NSR with PAC. Nonconducted PAC. Nonconducted PAC. Premature Atrial Contractions (PACs)
") HTEC 91 Medical Office Diagnostic Tests Week 4 Topic for Today: Atrial Rhythms PACs: Premature Atrial Contractions PAT: Paroxysmal Atrial Tachycardia AF: Atrial Fibrillation Atrial Flutter Premature Atrial
HTEC 91 Medical Office Diagnostic Tests Week 4 Topic for Today: Atrial Rhythms PACs: Premature Atrial Contractions PAT: Paroxysmal Atrial Tachycardia AF: Atrial Fibrillation Atrial Flutter Premature Atrial
The front end of the receiver performs the frequency translation, channel selection and amplification of the signal.
 Many receivers must be capable of handling a very wide range of signal powers at the input while still producing the correct output. This must be done in the presence of noise and interference which occasionally
VCA Veterinary Specialty Center of Seattle
 An electrocardiogram (ECG) is a graph of the heart`s electrical current, which allows evaluation of heart rate, rhythm and conduction. Identification of conduction problems within the heart begins with
Introduction to Electrocardiography. The Genesis and Conduction of Cardiac Rhythm
 Introduction to Electrocardiography Munther K. Homoud, M.D. Tufts-New England Medical Center Spring 2008 The Genesis and Conduction of Cardiac Rhythm Automaticity is the cardiac cell s ability to spontaneously
Arrhythmia Monitoring Algorithm
 Arrhythmia Monitoring Algorithm Application Note Introduction The ST/AR (ST and Arrhythmia) algorithm is an ECG algorithm that the HeartStart MRx and XL+ monitor/defibrillators utilize for basic and cardiotach
INTRODUCTORY GUIDE TO IDENTIFYING ECG IRREGULARITIES
 INTRODUCTORY GUIDE TO IDENTIFYING ECG IRREGULARITIES NOTICE: This is an introductory guide for a user to understand basic ECG tracings and parameters. The guide will allow user to identify some of the
SUMMARY. Additional Digital/Software filters are included in Chart and filter the data after it has been sampled and recorded by the PowerLab.
 This technique note was compiled by ADInstruments Pty Ltd. It includes figures and tables from S.S. Young (2001): Computerized data acquisition and analysis for the life sciences. For further information
Evaluation copy. Analyzing the Heart with EKG. Computer
 Analyzing the Heart with EKG Computer An electrocardiogram (ECG or EKG) is a graphical recording of the electrical events occurring within the heart. In a healthy heart there is a natural pacemaker in
ECG Signal Analysis Using Wavelet Transforms
 Bulg. J. Phys. 35 (2008) 68 77 ECG Signal Analysis Using Wavelet Transforms C. Saritha, V. Sukanya, Y. Narasimha Murthy Department of Physics and Electronics, S.S.B.N. COLLEGE (Autonomous) Anantapur 515
RAPID INTERPRETATION OF. EKG s
 Personal Quick Reference Sheets 333 (pages 333 to 346) There is no need to remove these reference pages from your book. To download and print them in full color, go to: www.themdsite.com Reference Sheets
PCM Encoding and Decoding:
 PCM Encoding and Decoding: Aim: Introduction to PCM encoding and decoding. Introduction: PCM Encoding: The input to the PCM ENCODER module is an analog message. This must be constrained to a defined bandwidth
Interpreting a rhythm strip
 3 Interpreting a rhythm strip Just the facts In this chapter, you ll learn: the components of an ECG complex and their significance and variations techniques for calculating the rate and rhythm of an ECG
the basics Perfect Heart Institue, Piyavate Hospital
 ECG INTERPRETATION: the basics Damrong Sukitpunyaroj MD Damrong Sukitpunyaroj, MD Perfect Heart Institue, Piyavate Hospital Overview Conduction Pathways Systematic Interpretation Common abnormalities in
ECG SIGNAL PROCESSING AND HEART RATE FREQUENCY DETECTION METHODS
 ECG SIGNAL PROCESSING AND HEART RATE FREQUENCY DETECTION METHODS J. Parak, J. Havlik Department of Circuit Theory, Faculty of Electrical Engineering Czech Technical University in Prague Abstract Digital
Tachyarrhythmias (fast heart rhythms)
") Patient information factsheet Tachyarrhythmias (fast heart rhythms) The normal electrical system of the heart The heart has its own electrical conduction system. The conduction system sends signals throughout
Patient information factsheet Tachyarrhythmias (fast heart rhythms) The normal electrical system of the heart The heart has its own electrical conduction system. The conduction system sends signals throughout
Normal Sinus Rhythm. Sinus Bradycardia. Sinus Tachycardia. Rhythm ECG Characteristics Example (NSR) & consistent. & consistent.
 & consistent. & consistent.") Normal Sinus Rhythm (NSR) Rate: 60-100 per minute Rhythm: R- R = P waves: Upright, similar P-R: 0.12-0.20 second & consistent P:qRs: 1P:1qRs Sinus Tachycardia Exercise Hypovolemia Medications Fever Hypoxia
Normal Sinus Rhythm (NSR) Rate: 60-100 per minute Rhythm: R- R = P waves: Upright, similar P-R: 0.12-0.20 second & consistent P:qRs: 1P:1qRs Sinus Tachycardia Exercise Hypovolemia Medications Fever Hypoxia
T = 1 f. Phase. Measure of relative position in time within a single period of a signal For a periodic signal f(t), phase is fractional part t p
, phase is fractional part t p") Data Transmission Concepts and terminology Transmission terminology Transmission from transmitter to receiver goes over some transmission medium using electromagnetic waves Guided media. Waves are guided
Data Transmission Concepts and terminology Transmission terminology Transmission from transmitter to receiver goes over some transmission medium using electromagnetic waves Guided media. Waves are guided
Lock - in Amplifier and Applications
 Lock - in Amplifier and Applications What is a Lock in Amplifier? In a nut shell, what a lock-in amplifier does is measure the amplitude V o of a sinusoidal voltage, V in (t) = V o cos(ω o t) where ω o
Frequency Response of Filters
 School of Engineering Department of Electrical and Computer Engineering 332:224 Principles of Electrical Engineering II Laboratory Experiment 2 Frequency Response of Filters 1 Introduction Objectives To
Short-time FFT, Multi-taper analysis & Filtering in SPM12
 Short-time FFT, Multi-taper analysis & Filtering in SPM12 Computational Psychiatry Seminar, FS 2015 Daniel Renz, Translational Neuromodeling Unit, ETHZ & UZH 20.03.2015 Overview Refresher Short-time Fourier
Basic Acoustics and Acoustic Filters
 Basic CHAPTER Acoustics and Acoustic Filters 1 3 Basic Acoustics and Acoustic Filters 1.1 The sensation of sound Several types of events in the world produce the sensation of sound. Examples include doors
Lecture 1-6: Noise and Filters
 Lecture 1-6: Noise and Filters Overview 1. Periodic and Aperiodic Signals Review: by periodic signals, we mean signals that have a waveform shape that repeats. The time taken for the waveform to repeat
TCOM 370 NOTES 99-4 BANDWIDTH, FREQUENCY RESPONSE, AND CAPACITY OF COMMUNICATION LINKS
 TCOM 370 NOTES 99-4 BANDWIDTH, FREQUENCY RESPONSE, AND CAPACITY OF COMMUNICATION LINKS 1. Bandwidth: The bandwidth of a communication link, or in general any system, was loosely defined as the width of
DIGITAL-TO-ANALOGUE AND ANALOGUE-TO-DIGITAL CONVERSION
 DIGITAL-TO-ANALOGUE AND ANALOGUE-TO-DIGITAL CONVERSION Introduction The outputs from sensors and communications receivers are analogue signals that have continuously varying amplitudes. In many systems
Detecting Atrial-ventricular blocks Arrhythmia based on RR-intervals on ECG Signals
 Detecting Atrial-ventricular blocks Arrhythmia based on -intervals on ECG Signals Makki Akasha abikier, Ibrahim Musa Ishag, Mohammed Izzeldin, Dong Gyu Lee, Gyoyong shon, Keun Ho Ryu Database/ioinformatics
Doppler. Doppler. Doppler shift. Doppler Frequency. Doppler shift. Doppler shift. Chapter 19
 Doppler Doppler Chapter 19 A moving train with a trumpet player holding the same tone for a very long time travels from your left to your right. The tone changes relative the motion of you (receiver) and
Time series analysis Matlab tutorial. Joachim Gross
 Time series analysis Matlab tutorial Joachim Gross Outline Terminology Sampling theorem Plotting Baseline correction Detrending Smoothing Filtering Decimation Remarks Focus on practical aspects, exercises,
Introduction to Receivers
 Introduction to Receivers Purpose: translate RF signals to baseband Shift frequency Amplify Filter Demodulate Why is this a challenge? Interference (selectivity, images and distortion) Large dynamic range
ACLS RHYTHM TEST. 2. A 74-year-old woman with chest pain. Blood pressure 192/90 and rates her pain 9/10.
 ACLS RHYTHM TEST Name Date Choose the best answer for each of the following questions. Each of the following strips is 6 seconds in length. 1. Identify the following rhythm a. Sinus bradycardia with 2
Efficient Heart Rate Monitoring
 Efficient Heart Rate Monitoring By Sanjeev Kumar, Applications Engineer, Cypress Semiconductor Corp. Heart rate is one of the most frequently measured parameters of the human body and plays an important
PHYS 331: Junior Physics Laboratory I Notes on Noise Reduction
 PHYS 331: Junior Physics Laboratory I Notes on Noise Reduction When setting out to make a measurement one often finds that the signal, the quantity we want to see, is masked by noise, which is anything
LM833,LMF100,MF10. Application Note 779 A Basic Introduction to Filters - Active, Passive,and. Switched Capacitor. Literature Number: SNOA224A
 LM833,LMF100,MF10 Application Note 779 A Basic Introduction to Filters - Active, Passive,and Switched Capacitor Literature Number: SNOA224A A Basic Introduction to Filters Active, Passive, and Switched-Capacitor
Electrocardiography Review and the Normal EKG Response to Exercise
 Electrocardiography Review and the Normal EKG Response to Exercise Cardiac Anatomy Electrical Pathways in the Heart Which valves are the a-v valves? Closure of the a-v valves is associated with which heart
Activity 4.2.3: EKG. Introduction. Equipment. Procedure
 Activity 4.2.3: EKG The following is used with permission of Vernier Software and Technology. This activity is based on the experiment Analyzing the Heart with EKG from the book Human Physiology with Vernier,
Equine Cardiovascular Disease
 Equine Cardiovascular Disease 3 rd most common cause of poor performance in athletic horses (after musculoskeletal and respiratory) Cardiac abnormalities are rare Clinical Signs: Poor performance/exercise
Hands On ECG. Sean Hubber and Crystal Lu
 Hands On ECG Sean Hubber and Crystal Lu The device. The black box contains the circuit and microcontroller, the mini tv is set on top, the bars on the sides are for holding it and reading hand voltage,
2 ECG basics. Leads and planes. Leads. Planes. from different perspectives, which are called leads and planes.
 558302.qxp 3/14/12 10:47 PM Page 12 2 ECG basics One of the most valuable diagnostic tools available, an electrocardiogram (ECG) records the heart s electrical activity as waveforms. By interpreting these
Em bedded DSP : I ntroduction to Digital Filters
 Embedded DSP : Introduction to Digital Filters 1 Em bedded DSP : I ntroduction to Digital Filters Digital filters are a important part of DSP. In fact their extraordinary performance is one of the keys
Basics of Pacing. Ruth Hickling, RN-BSN Tasha Conley, RN-BSN
 Basics of Pacing Ruth Hickling, RN-BSN Tasha Conley, RN-BSN The Cardiac Conduction System Cardiac Conduction System Review Normal Conduction Conduction QRS QRS Complex Complex RR PP ST ST segment segment
The Electrocardiogram (ECG)
") The Electrocardiogram (ECG) Preparation for RWM Lab Experiment The first ECG was measured by Augustus Désiré Waller in 1887 using Lippmann's capillary electrometer. Recorded ECG: http://www.youtube.com/watch_popup?v=q0jmfivadue&vq=large
The Electrocardiogram (ECG) Preparation for RWM Lab Experiment The first ECG was measured by Augustus Désiré Waller in 1887 using Lippmann's capillary electrometer. Recorded ECG: http://www.youtube.com/watch_popup?v=q0jmfivadue&vq=large
PRO-CPR. 2015 Guidelines: PALS Algorithm Overview. (Non-AHA supplementary precourse material)
") PRO-CPR 2015 Guidelines: PALS Algorithm Overview (Non-AHA supplementary precourse material) Please reference Circulation (from our website), the ECC Handbook, or the 2015 ACLS Course Manual for correct
PRO-CPR 2015 Guidelines: PALS Algorithm Overview (Non-AHA supplementary precourse material) Please reference Circulation (from our website), the ECC Handbook, or the 2015 ACLS Course Manual for correct
Analog and Digital Filters Anthony Garvert November 13, 2015
 Analog and Digital Filters Anthony Garvert November 13, 2015 Abstract In circuit analysis and performance, a signal transmits some form of information, such as a voltage or current. However, over a range
Adding Heart to Your Technology
 RMCM-01 Heart Rate Receiver Component Product code #: 39025074 KEY FEATURES High Filtering Unit Designed to work well on constant noise fields SMD component: To be installed as a standard component to
ANALYZER BASICS WHAT IS AN FFT SPECTRUM ANALYZER? 2-1
 WHAT IS AN FFT SPECTRUM ANALYZER? ANALYZER BASICS The SR760 FFT Spectrum Analyzer takes a time varying input signal, like you would see on an oscilloscope trace, and computes its frequency spectrum. Fourier's
A Basic Introduction to Filters Active Passive and Switched-Capacitor
 A Basic Introduction to Filters Active Passive and Switched-Capacitor 1 0 INTRODUCTION Filters of some sort are essential to the operation of most electronic circuits It is therefore in the interest of
Voltage. Oscillator. Voltage. Oscillator
 fpa 147 Week 6 Synthesis Basics In the early 1960s, inventors & entrepreneurs (Robert Moog, Don Buchla, Harold Bode, etc.) began assembling various modules into a single chassis, coupled with a user interface
Introduction to Digital Filters
 CHAPTER 14 Introduction to Digital Filters Digital filters are used for two general purposes: (1) separation of signals that have been combined, and (2) restoration of signals that have been distorted
Acoustic Terms, Definitions and General Information
 Acoustic Terms, Definitions and General Information Authored by: Daniel Ziobroski Acoustic Engineer Environmental and Acoustic Engineering GE Energy Charles Powers Program Manager Environmental and Acoustic
AN-007 APPLICATION NOTE MEASURING MAXIMUM SUBWOOFER OUTPUT ACCORDING ANSI/CEA-2010 STANDARD INTRODUCTION CEA-2010 (ANSI) TEST PROCEDURE
 TEST PROCEDURE") AUDIOMATICA AN-007 APPLICATION NOTE MEASURING MAXIMUM SUBWOOFER OUTPUT ACCORDING ANSI/CEA-2010 STANDARD by Daniele Ponteggia - [email protected] INTRODUCTION The Consumer Electronics Association (CEA),
AUDIOMATICA AN-007 APPLICATION NOTE MEASURING MAXIMUM SUBWOOFER OUTPUT ACCORDING ANSI/CEA-2010 STANDARD by Daniele Ponteggia - [email protected] INTRODUCTION The Consumer Electronics Association (CEA),
Agilent AN 1316 Optimizing Spectrum Analyzer Amplitude Accuracy
 Agilent AN 1316 Optimizing Spectrum Analyzer Amplitude Accuracy Application Note RF & Microwave Spectrum Analyzers Table of Contents 3 3 4 4 5 7 8 8 13 13 14 16 16 Introduction Absolute versus relative
The heart then repolarises (or refills) in time for the next stimulus and contraction.
 in time for the next stimulus and contraction.") Atrial Fibrillation BRIEFLY, HOW DOES THE HEART PUMP? The heart has four chambers. The upper chambers are called atria. One chamber is called an atrium, and the lower chambers are called ventricles. In
Atrial Fibrillation BRIEFLY, HOW DOES THE HEART PUMP? The heart has four chambers. The upper chambers are called atria. One chamber is called an atrium, and the lower chambers are called ventricles. In
Electronic Communications Committee (ECC) within the European Conference of Postal and Telecommunications Administrations (CEPT)
 within the European Conference of Postal and Telecommunications Administrations (CEPT)") Page 1 Electronic Communications Committee (ECC) within the European Conference of Postal and Telecommunications Administrations (CEPT) ECC RECOMMENDATION (06)01 Bandwidth measurements using FFT techniques
Page 1 Electronic Communications Committee (ECC) within the European Conference of Postal and Telecommunications Administrations (CEPT) ECC RECOMMENDATION (06)01 Bandwidth measurements using FFT techniques
Electrocardiogram analyser with a mobile phone
 Electrocardiogram analyser with a mobile phone André Baptista 1 and João Sanches 2 1 Instituto Superior Técnico, Lisbon, Portugal [email protected] 2 Systems and Robotics Institute, Instituto
Atrial & Junctional Dysrhythmias
 Atrial & Junctional Dysrhythmias Atrial & Junctional Dysrhythmias Atrial Premature Atrial Complex Wandering Atrial Pacemaker Atrial Tachycardia (ectopic) Multifocal Atrial Tachycardia Atrial Flutter Atrial
Electrocardiogram and Heart Sounds
 Electrocardiogram and Heart Sounds An introduction to the recording and analysis of electrocardiograms, and the sounds of the heart. Written by Staff of ADInstruments Introduction The beating of the heart
Adaptive Notch Filter for EEG Signals Based on the LMS Algorithm with Variable Step-Size Parameter
 5 Conference on Information Sciences and Systems, The Johns Hopkins University, March 16 18, 5 Adaptive Notch Filter for EEG Signals Based on the LMS Algorithm with Variable Step-Size Parameter Daniel
Pacers use a 5-letter code: first 3 letters most important
 PACEMAKERS 2 Pacemakers: Nomenclature Pacers use a 5-letter code: first 3 letters most important t First Letter: Chamber Paced A= Atrium V= Ventricle D= Dual (A+V) 2nd Letter: Chamber Sensed A= Atrium
GETTING STARTED WITH LABVIEW POINT-BY-POINT VIS
 USER GUIDE GETTING STARTED WITH LABVIEW POINT-BY-POINT VIS Contents Using the LabVIEW Point-By-Point VI Libraries... 2 Initializing Point-By-Point VIs... 3 Frequently Asked Questions... 5 What Are the
Introduction to Electrophysiology. Wm. W. Barrington, MD, FACC University of Pittsburgh Medical Center
 Introduction to Electrophysiology Wm. W. Barrington, MD, FACC University of Pittsburgh Medical Center Objectives Indications for EP Study How do we do the study Normal recordings Abnormal Recordings Limitations
Design of Efficient Digital Interpolation Filters for Integer Upsampling. Daniel B. Turek
 Design of Efficient Digital Interpolation Filters for Integer Upsampling by Daniel B. Turek Submitted to the Department of Electrical Engineering and Computer Science in partial fulfillment of the requirements
Uses of Derivative Spectroscopy
 Uses of Derivative Spectroscopy Application Note UV-Visible Spectroscopy Anthony J. Owen Derivative spectroscopy uses first or higher derivatives of absorbance with respect to wavelength for qualitative
#AS148 - Automated ECG Analysis
 BIOPAC Systems, Inc. 42 Aero Camino Goleta, Ca 93117 Ph (805)685-0066 Fax (805)685-0067 www.biopac.com [email protected] #AS148 - Automated ECG Analysis An electrocardiogram (ECG) is a graphical recording
Monitoring EKG. Evaluation copy
 Monitoring EKG Computer 28 An electrocardiogram, or EKG, is a graphical recording of the electrical events occurring within the heart. A typical EKG tracing consists of five identifiable deflections. Each
Agilent AN 1315 Optimizing RF and Microwave Spectrum Analyzer Dynamic Range. Application Note
 Agilent AN 1315 Optimizing RF and Microwave Spectrum Analyzer Dynamic Range Application Note Table of Contents 3 3 3 4 4 4 5 6 7 7 7 7 9 10 10 11 11 12 12 13 13 14 15 1. Introduction What is dynamic range?
Interpreting AV (Heart) Blocks: Breaking Down the Mystery
 Blocks: Breaking Down the Mystery") Interpreting AV (Heart) Blocks: Breaking Down the Mystery 2 Contact Hours Copyright 2012 by RN.com. All Rights Reserved. Reproduction and distribution of these materials is prohibited without the express
Interpreting AV (Heart) Blocks: Breaking Down the Mystery 2 Contact Hours Copyright 2012 by RN.com. All Rights Reserved. Reproduction and distribution of these materials is prohibited without the express
12-Lead EKG Interpretation. Judith M. Haluka BS, RCIS, EMT-P
 12-Lead EKG Interpretation Judith M. Haluka BS, RCIS, EMT-P ECG Grid Left to Right = Time/duration Vertical measure of voltage (amplitude) Expressed in mm P-Wave Depolarization of atrial muscle Low voltage
How To Counter Noise Noise From A Low Voltage Differential Signaling Circuit
 TDK EMC Technology Practice Section EMC Countermeasures of Low Voltage Differential Signaling Circuits TDK Corporation Magnetics Business Group Toshio Tomonari 1 Introduction Low Voltage Differential Signaling
Section Four: Pulmonary Artery Waveform Interpretation
 Section Four: Pulmonary Artery Waveform Interpretation All hemodynamic pressures and waveforms are generated by pressure changes in the heart caused by myocardial contraction (systole) and relaxation/filling
Introduction to Digital Audio
 Introduction to Digital Audio Before the development of high-speed, low-cost digital computers and analog-to-digital conversion circuits, all recording and manipulation of sound was done using analog techniques.
FAST Fourier Transform (FFT) and Digital Filtering Using LabVIEW
 and Digital Filtering Using LabVIEW") FAST Fourier Transform (FFT) and Digital Filtering Using LabVIEW Wei Lin Department of Biomedical Engineering Stony Brook University Instructor s Portion Summary This experiment requires the student to
FAST Fourier Transform (FFT) and Digital Filtering Using LabVIEW Wei Lin Department of Biomedical Engineering Stony Brook University Instructor s Portion Summary This experiment requires the student to
Transistor Characteristics and Single Transistor Amplifier Sept. 8, 1997
 Physics 623 Transistor Characteristics and Single Transistor Amplifier Sept. 8, 1997 1 Purpose To measure and understand the common emitter transistor characteristic curves. To use the base current gain
Electrophysiology Introduction, Basics. The Myocardial Cell. Chapter 1- Thaler
 Electrophysiology Introduction, Basics Chapter 1- Thaler The Myocardial Cell Syncytium Resting state Polarized negative Membrane pump Depolarization fundamental electrical event of the heart Repolarization
e-περιοδικό Επιστήμης & Τεχνολογίας e-journal of Science & Technology (e-jst) Design and Construction of a Prototype ECG Simulator
 Design and Construction of a Prototype ECG Simulator") Design and Construction of a Prototype ECG Simulator I. Valais 1, G. Koulouras 2, G. Fountos 1, C. Michail 1, D. Kandris 2 and S. Athinaios 2 1 Department of Biomedical Engineeiring, Technological Educational
Design and Construction of a Prototype ECG Simulator I. Valais 1, G. Koulouras 2, G. Fountos 1, C. Michail 1, D. Kandris 2 and S. Athinaios 2 1 Department of Biomedical Engineeiring, Technological Educational
Positive Feedback and Oscillators
 Physics 3330 Experiment #6 Fall 1999 Positive Feedback and Oscillators Purpose In this experiment we will study how spontaneous oscillations may be caused by positive feedback. You will construct an active
Understanding Mixers Terms Defined, and Measuring Performance
 Understanding Mixers Terms Defined, and Measuring Performance Mixer Terms Defined Statistical Processing Applied to Mixers Today's stringent demands for precise electronic systems place a heavy burden
Author: Dr. Society of Electrophysio. Reference: Electrodes. should include: electrode shape size use. direction.
 Standards for Reportin ng EMG Data Author: Dr. Roberto Merletti, Politecnico di Torino, Italy The Standards for Reporting EMG Data, written by Dr. Robertoo Merletti, are endorsed by the International Society
Signal-averaged electrocardiography late potentials
 SIGNAL AVERAGED ECG INTRODUCTION Signal-averaged electrocardiography (SAECG) is a special electrocardiographic technique, in which multiple electric signals from the heart are averaged to remove interference
Human ECG Laboratory Experiment By
 Human ECG Laboratory Experiment By Brittany Baierlein, Alison L., Thurow, Rachel Holsinger and Robin L. Cooper Department of Biology, University of KY, Lexington, KY 40506-0225, USA. (Some text taken directly
Module 13 : Measurements on Fiber Optic Systems
 Module 13 : Measurements on Fiber Optic Systems Lecture : Measurements on Fiber Optic Systems Objectives In this lecture you will learn the following Measurements on Fiber Optic Systems Attenuation (Loss)
The abbreviation EKG, for electrocardiogram,
 CLIN PEDIATR OnlineFirst, published on January 28, 2010 as doi:10.1177/0009922809336206 Simplified Pediatric Electrocardiogram Interpretation Clinical Pediatrics Volume XX Number X Month XXXX xx-xx 2009
A Sound Analysis and Synthesis System for Generating an Instrumental Piri Song
 , pp.347-354 http://dx.doi.org/10.14257/ijmue.2014.9.8.32 A Sound Analysis and Synthesis System for Generating an Instrumental Piri Song Myeongsu Kang and Jong-Myon Kim School of Electrical Engineering,
Estimation of Loudness by Zwicker's Method
 Estimation of Loudness by Zwicker's Method Loudness is one category in the list of human perceptions of sound. There are many methods of estimating Loudness using objective measurements. No method is perfect.
Understanding Poles and Zeros
 MASSACHUSETTS INSTITUTE OF TECHNOLOGY DEPARTMENT OF MECHANICAL ENGINEERING 2.14 Analysis and Design of Feedback Control Systems Understanding Poles and Zeros 1 System Poles and Zeros The transfer function
BIPOLAR LIMB LEADS UNIPOLAR LIMB LEADS PRECORDIAL (UNIPOLAR) LEADS VIEW OF EACH LEAD INDICATIVE ECG CHANGES
 LEADS VIEW OF EACH LEAD INDICATIVE ECG CHANGES") BIPOLAR LIMB LEADS Have both a distinctive positive and negative pole. Lead I LA (positive) RA (negative) Lead II LL (positive) RA (negative) Lead III LL (positive) LA (negative) UNIPOLAR LIMB LEADS Have
BIPOLAR LIMB LEADS Have both a distinctive positive and negative pole. Lead I LA (positive) RA (negative) Lead II LL (positive) RA (negative) Lead III LL (positive) LA (negative) UNIPOLAR LIMB LEADS Have
Electrodes placed on the body s surface can detect electrical activity, APPLIED ANATOMY AND PHYSIOLOGY. Circulatory system
 4 READING AND INTERPRETING THE ELECTROCARDIOGRAM Electrodes placed on the body s surface can detect electrical activity, which occurs in the heart. The recording of these electrical events comprises an
ECG made extra easy. medics.cc
 ElectroCardioGraphyraphy ECG made extra easy Overview Objectives for this tutorial What is an ECG? Overview of performing electrocardiography on a patient Simple physiology Interpreting the ECG Objectives
Use and Application of Output Limiting Amplifiers (HFA1115, HFA1130, HFA1135)
") Use and Application of Output Limiting Amplifiers (HFA111, HFA110, HFA11) Application Note November 1996 AN96 Introduction Amplifiers with internal voltage clamps, also known as limiting amplifiers, have
Use and Application of Output Limiting Amplifiers (HFA111, HFA110, HFA11) Application Note November 1996 AN96 Introduction Amplifiers with internal voltage clamps, also known as limiting amplifiers, have
Tx/Rx A high-performance FM receiver for audio and digital applicatons
 Tx/Rx A high-performance FM receiver for audio and digital applicatons This receiver design offers high sensitivity and low distortion for today s demanding high-signal environments. By Wayne C. Ryder
Welcome to Vibrationdata
 Welcome to Vibrationdata Acoustics Shock Vibration Signal Processing December 2004 Newsletter Ni hao Feature Articles One of my goals is to measure a wide variety of oscillating signals. In some sense,
Classification of Electrocardiogram Anomalies
 Classification of Electrocardiogram Anomalies Karthik Ravichandran, David Chiasson, Kunle Oyedele Stanford University Abstract Electrocardiography time series are a popular non-invasive tool used to classify
Lab 1: The Digital Oscilloscope
 PHYSICS 220 Physical Electronics Lab 1: The Digital Oscilloscope Object: To become familiar with the oscilloscope, a ubiquitous instrument for observing and measuring electronic signals. Apparatus: Tektronix