ECG made extra easy. medics.cc
|
|
|
- Lenard Hodges
- 9 years ago
- Views:
Transcription
1 ElectroCardioGraphyraphy ECG made extra easy

2 Overview Objectives for this tutorial What is an ECG? Overview of performing electrocardiography on a patient Simple physiology Interpreting the ECG

3 Objectives By the end of this tutorial the student should be able to: State a definition of electrocardiogram Perform an ECG on a patient, including explaining to the patient what is involved Draw a diagram of the conduction pathway of the heart Draw a simple labelled diagram of an ECG tracing List the steps involved in interpreting an ECG tracing in an orderly way Recite the normal limits of the parameters of various parts of the t ECG Interpret ECGs showing the following pathology: MI, AF, 1st 2 and 3 degree heart block, p pulmonale,, p mitrale,, Wolff- Parkinson-White syndrome, LBBB, RBBB, Left and Right axis deviation, LVH, pericarditis,, Hyper- and hypokalaemia,, prolonged QT.

4 What is an ECG? ECG = Electrocardiogram Tracing of heart s s electrical activity

5 Recording an ECG
6 Overview of procedure GRIP Greet, rapport, introduce, identify, privacy, explain procedure, permission Lay patient down Expose chest, wrists, ankles Clean electrode sites May need to shave Apply electrodes Attach wires correctly Turn on machine Calibrate to 10mm/mV Rate at 25mm/s Record and print Label the tracing Name, DoB,, hospital number, date and time, reason for recording Disconnect if adequate and remove electrodes

7 Electrode placement 10 electrodes in total are placed on the patient Firstly self-adhesive dots are attached to the patient. These have single electrical contacts on them The 10 leads on the ECG machine are then clipped onto the contacts of the dots

8 Electrode placement in 12 lead 6 are chest electrodes Called V1-6 6 or C1-6 4 are limb electrodes Right arm Left arm Left leg Right leg Ride Your Green Bike ECG Remember The right leg electrode is a neutral or dummy!

9 Electrode placement For the chest electrodes V1 4 th intercostal space right sternal edge V2 4 th intercostal space left sternal edge (to find the 4 th space, palpate the manubriosternal angle (of Louis) Directly adjacent is the 2 nd rib, with the 2 nd intercostal space directly below. Palpate inferiorly to find the 3 rd and then 4 th space V4 over the apex (5 th ICS mid-clavicular line) V3 halfway between V2 and V4 V5 at the same level as V4 but on the anterior axillary line V6 at the same level as V4 and V5 but on the mid-axillary line
 V3 halfway between V2 and V4 V5")
10 Recording the trace Different ECG machines have different buttons that you have to press. Ask one of the staff on the ward if it is a machine that you are unfamiliar with. Ask the patient to relax completely. Any skeletal muscle activity will be picked up as interference. If the trace obtained is no good, check that all the dots are stuck down properly they have a tendency to fall off.

11 Electrophysiology

12 Electrophysiology Pacemaker = sinoatrial node Impulse travels across atria Reaches AV node Transmitted along interventricular septum in Bundle of His Bundle splits in two (right and left branches) Purkinje fibres

13 Overall direction of cardiac impulse

14 How does the ECG work? Electrical impulse (wave of depolarisation) picked up by placing electrodes on patient The voltage change is sensed by measuring the current change across 2 electrodes a positive electrode and a negative electrode If the electrical impulse travels towards the positive electrode this results in a positive deflection If the impulse travels away from the positive electrode this results in a negative deflection

15 Away from the electrode = negative deflection Towards the electrode = positive deflection Direction of impulse (axis)

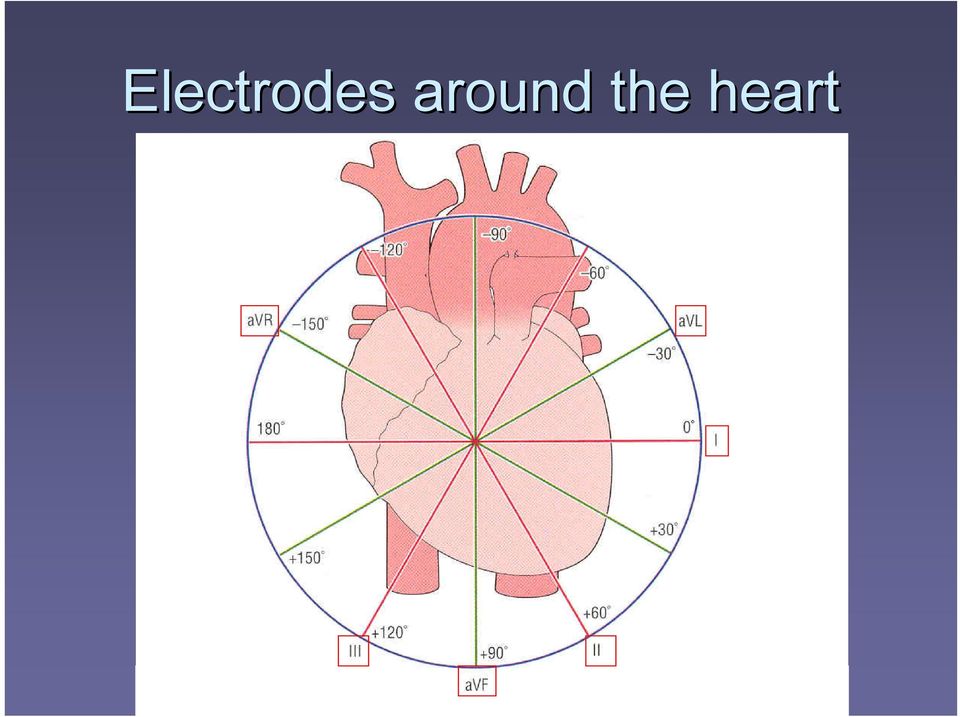
16 Types of Leads Coronal plane (Limb Leads) 1. Bipolar leads 2. Unipolar leads Transverse plane V 1 V 6 (Chest Leads) l, l l, l l l avl, avr, avf
 l, l l, l l l")
17 Electrodes around the heart
18 Leads How are the 12 leads on the ECG (I, II, III, avl, avf, avr,, V1 6) formed using only 9 electrodes (and a neutral)? - Lead I + Lead I is formed using the right arm electrode (red) as the negative electrode and the left arm (yellow) electrode as the positive
 electrode as")
19 Leads - Lead I +

20 Leads Lead II is formed using the right arm electrode (red) as the negative electrode and the left leg electrode as the positive Lead II

21 Lead II
22 Leads Lead III is formed using the left arm electrode as the negative electrode and the left leg electrode as the positive avl, avf,, and avr are composite leads, computed using the information from the other leads
23 Leads and what they tell you Limb leads Limb leads look at the heart in the coronal plane avl,, I and II = lateral II, III and avf = inferior avr = right side of the heart
24 Leads look at the heart from different directions axis
25 Leads and what they tell you Each lead can be thought of as looking at an area of myocardium Chest leads V 1 to V 6 look at the heart on the transverse plain V 1 and V 2 look at the anterior of the heart and R ventricle V 3 and V 4 = anterior and septal V 5 and V 6 = lateral and left ventricle
26 Elements of the trace
27 What do the components represent? P wave = atrial depolarisation QRS = ventricular depolarisation T = repolarisation of the ventricles
28 Interpreting the ECG
29 Interpreting the ECG Check Name DoB Time and date Indication e.g. chest pain or routine pre-op op Any previous or subsequent ECGs Is it part of a serial ECG sequence? In which case it may be numbered Calibration Rate Rhythm Axis Elements of the tracing in each lead
30 Calibration Check that your ECG is calibrated correctly Height 10mm = 1mV Look for a reference pulse which should be the rectangular looking wave somewhere near the left of the paper. It should be 10mm (10 small squares) tall Paper speed 25mm/s 25 mm (25 small squares / 5 large squares) equals one second
31 Rate If the heart rate is regular Count the number of large squares between R waves i.e. the RR interval in large squares Rate = 300 RR e.g. RR = 4 large squares 300/4 = 75 beats per minute
32 Rate If the rhythm is irregular (see next slide on rhythm to check whether your rhythm is regular or not) it may be better to estimate the rate using the rhythm strip at the bottom of the ECG (usually lead II) The rhythm strip is usually 25cm long (250mm i.e. 10 seconds) If you count the number of R waves on that strip and multiple by 6 you will get the rate
33 Rhythm Is the rhythm regular? The easiest way to tell is to take a sheet of paper and line up one edge with the tips of the R waves on the rhythm strip. Mark off on the paper the positions of 3 or 4 R wave tips Move the paper along the rhythm strip so that your first mark lines up with another R wave tip See if the subsequent R wave tips line up with the subsequent marks on your paper If they do line up, the rhythm is regular. If not, the rhythm is irregular
34 Rhythm Sinus Rhythm Definition Cardiac impulse originates from the sinus node. Every QRS must be preceded by a P wave. (This does not mean that every P wave must be followed by a QRS such as in 2 nd degree heart block where some P waves are not followed by a QRS, however every QRS is preceded by a P wave and the rhythm originates in the sinus node, hence it is a sinus rhythm. It could be said that it is not a normal sinus rhythm)
35 Rhythm Sinus arrhythmia There is a change in heart rate depending on the phase of respiration Q. If a person with sinus arrhythmia inspires, what happens to their t heart rate? A. The heart rate speeds up. This is because on inspiration there is a decrease in intrathoracic pressure, this leads to an increased venous return to the right atrium. Increased stretching of the right atrium sets off a brainstem reflex (Bainbridge s s reflex) that leads to sympathetic activation of the heart, hence it speeds up) This physiological phenomenon is more apparent in children and young adults
36 Rhythm Sinus bradycardia Rhythm originates in the sinus node Rate of less than 60 beats per minute Sinus tachycardia Rhythm originates in the sinus node Rate of greater than 100 beats per minute
37 Axis The axis can be though of as the overall direction of the cardiac impulse or wave of depolarisation of the heart An abnormal axis (axis deviation) can give a clue to possible pathology
38 or extreme axis deviation Axis An axis falling outside the normal range can be left axis deviation right axis deviation A normal axis can lie anywhere between -30 and +90 degrees or +120 degrees according to some
39 Axis deviation - Causes Wolff-Parkinson Parkinson-White syndrome can cause both Left and Right axis deviation A useful mnemonic: RAD RALPH the LAD from VILLA Right Axis Deviation Right ventricular hypertrophy Anterolateral MI Left Posterior Hemiblock Left Axis Deviation Ventricular tachycardia Inferior MI Left ventricular hypertrophy Left Anterior hemiblock
40 The P wave The P wave represents atrial depolarisation It can be thought of as being made up of two separate waves due to right atrial depolarisation and left atrial depolarisation. Which occurs first? Right atrial depolarisation right atrial depolarisation Sum of right and left waves left atrial depolarisation
41 The P wave Dimensions No hard and fast rules Height a P wave over 2.5mm should arouse suspicion Length a P wave longer than 0.08s (2 small squares) should arouse suspicion
42 The P wave Height A tall P wave (over 2.5mm) can be called P pulmonale Occurs due to R atrial hypertrophy Causes include: pulmonary hypertension, pulmonary stenosis tricuspid stenosis normal P pulmonale >2.5mm
43 The P wave Length A P wave with a length >0.08 seconds (2 small squares) and a bifid shape is called P mitrale It is caused by left atrial hypertrophy and delayed left atrial depolarisation Causes include: Mitral valve disease LVH normal P mitrale
44 The PR interval The PR interval is measured between the start of the P wave to the start of the QRS complex (therefore if there is a Q wave before the R wave the PR interval is measured from the start of the P wave to the start of the Q wave, not the start of the R wave)
45 The PR interval The PR interval corresponds to the time period between depolarisation of the atria and ventricular depolarisation. A normal PR interval is between 0.12 and 0.2 seconds ( small squares)
46 The PR interval If the PR interval is short (less than 3 small squares) it may signify that there is an accessory electrical pathway between the atria and the ventricles, hence the ventricles depolarise early giving a short PR interval. One example of this is Wolff-Parkinson Parkinson-White syndrome where the accessory pathway is called the bundle of Kent. See next slide for an animation to explain this
47 Depolarisation begins at the SA node The wave of depolarisation spreads across the atria It reaches the AV node and the accessory bundle Conduction is delayed as usual by the in-built delay in the AV node However, the accessory bundle has no such delay and depolarisation begins early in the part of the ventricle served by the bundle As the depolarisation in this part of the ventricle does not travel in the high speed conduction pathway, the spread of depolarisation across the ventricle is slow, causing a slow rising delta wave Until rapid depolarisation resumes via the normal pathway and a more normal complex follows
48 The PR interval If the PR interval is long (>5 small squares or 0.2s): If there is a constant long PR interval 1 st degree heart block is present First degree heart block is a longer than normal delay in conduction at the AV node
49 The PR interval If the PR interval looks as though it is widening every beat and then a QRS complex is missing, there is 2 nd degree heart block, Mobitz type I. I The lengthening of the PR interval in subsequent beats is known as the Wenckebach phenomenon (remember (w)one,( Wenckebach, widens) If the PR interval is constant but then there is a missed QRS complex then there is 2 nd degree heart block, Mobitz type II
50 The PR interval If there is no discernable relationship between the P waves and the QRS complexes, then 3 rd degree heart block is present
51 Heart block (AV node block) Summary 1 st degree constant PR, >0.2 seconds 2 nd degree type 1 (Wenckebach( Wenckebach) PR widens over subsequent beats then a QRS is dropped 2 nd degree type 2 PR is constant then a QRS is dropped 3 rd degree No discernable relationship between p waves and QRS complexes
52 The Q wave Are there any pathological Q waves? A Q wave can be pathological if it is: Deeper than 2 small squares (0.2mV) and/or Wider than 1 small square (0.04s) and/or In a lead other than III or one of the leads that look at the heart from the left (I, II, avl, V5 and V6) where small Qs (i.e. not meeting the criteria above) can be normal Normal if in I,II,III,aVL,V5-6 Pathological anywhere
53
54 The QRS height If the complexes in the chest leads look very tall, consider left ventricular hypertrophy (LVH) If the depth of the S wave in V 1 added to the height of the R wave in V 6 comes to more than 35mm, LVH is present
55 QRS width The width of the QRS complex should be less than 0.12 seconds (3 small squares) Some texts say less than 0.10 seconds (2.5 small squares) If the QRS is wider than this, it suggests a ventricular conduction problem usually right or left bundle branch block (RBBB or LBBB)
56 LBBB If left bundle branch block is present, the QRS complex may look like a W in V 1 and/or an M shape in V 6. New onset LBBB with chest pain consider Myocardial infarction Not possible to interpret the ST segment.
57 RBBB It is also called RSR pattern If right bundle branch block is present, there may be an M in V1 and/or a W in V6. Can occur in healthy people with normal QRS width partial RBBB
58 QRS width It is useful to look at leads V 1 and V 6 LBBB and RBBB can be remembered by the mnemonic: WiLLiaM MaRRoW Bundle branch block is caused either by infarction or fibrosis (related to the ageing process)
59 The ST segment The ST segment should sit on the isoelectric line It is abnormal if there is planar (i.e. flat) elevation or depression of the ST segment Planar ST elevation can represent an MI or Prinzmetal s (vasospastic)) angina Planar ST depression can represent ischaemia
60 Myocardial infarction Within hours: T wave may become peaked ST segment may begin to rise Within 24 hours: T wave inverts (may or may not persist) ST elevation begins to resolve If a left ventricular aneurysm forms, ST elevation may persist Within a few days: pathological Q waves can form and usually persist
61 Myocardial infarction The leads affected determine the site of the infarct Inferior II, III, avf Anteroseptal V1-V4 V4 Anterolateral V4-V6, V6, I, avl Posterior Tall wide R and ST in V1 and V2
62 Acute Anterior MI ST elevation
63 Inferior MI ST elevation
64 The ST segment If the ST segment is elevated but slanted, it may not be significant If there are raised ST segments in most of the leads, it may indicate pericarditis especially if the ST segments are saddle shaped. There can also be PR segment depression
65 Pericarditis
66 The T wave Are the T waves too tall? No definite rule for height T wave generally shouldn t be taller than half the size of the preceding QRS Causes: Hyperkalaemia Acute myocardial infarction
67 The T wave If the T wave is flat, it may indicate hypokalaemia If the T wave is inverted it may indicate ischaemia
68 The QT interval The QT interval is measured from the start of the QRS complex to the end of the T wave. The QT interval varies with heart rate As the heart rate gets faster, the QT interval gets shorter It is possible to correct the QT interval with respect to rate by using the following formula: QTc = QT/ RR (QTc( = corrected QT)
69 The QT interval The normal range for QTc is A short QTc may indicate hypercalcaemia A long QTc has many causes Long QTc increases the risk of developing an arrhythmia
70 The U wave U waves occur after the T wave and are often difficult to see They are thought to be due to repolarisation of the atrial septum Prominent U waves can be a sign of hypokalaemia,, hyperthyroidism
71 Supraventricular tachycardias These are tachycardias where the impulse is initiated in the atria (sinoatrial( node, atrial wall or atrioventricular node) If there is a normal conduction pathway when the impulse reaches the ventricles, a narrow QRS complex is formed, hence they are narrow complex tachycardias However if there is a conduction problem in the ventricles such as LBBB, then a broad QRS complex is formed. This would result in a form of broad complex tachycardia
72
73 Atrial Fibrillation Features: There maybe tachycardia The rhythm is usually irregularly irregular No P waves are discernible instead there is a shaky baseline This is because there is no order to atrial depolarisation, different areas of atrium depolarise at will
74 Atrial Fibrillation
75
76 Atrial flutter There is a saw-tooth baseline which rises above and dips below the isoelectric line. Atrial rate 250/min This is created by circular circuits of depolarisation set up in the atria
77 Ventricular Tachycardia
78 Ventricular Tachycardia QRS complexes are wide and irregular in shape Usually secondary to infarction Circuits of depolarisation are set up in damaged myocardium This leads to recurrent early repolarisation of the ventricle leading to tachycardia As the rhythm originates in the ventricles, there is a broad QRS complex Hence it is one of the causes of a broad complex tachycardia Need to differentiate with supraventricular tachycardia with aberrant conduction
79 Ventricular Fibrillation
80 Ventricular fibrillation Completely disordered ventricular depolarisation Not compatible with a cardiac output Results in a completely irregular trace consisting of broad QRS complexes of varying widths, heights and rates
81 P wave Elements of the tracing Magnitude and shape, e.g. P pulmonale,, P mitrale PR interval (start of P to start of QRS) Normal small squares, s 0.2s Pathological Q waves? QRS complex Magnitude, duration and shape 3 small squares or 0.12s duration ST segment Should be isoelectric T wave Magnitude and direction QT interval (Start QRS to end of T) Normally < 2 big squares or 0.4s at 60bpm Corrected to 60bpm (QTc)) = QT/ RR RRinterval
82 Further work Check out the various quizzes / games available on the Imperial Intranet Get doctors on the wards to run through a patient s s ECG with you
the basics Perfect Heart Institue, Piyavate Hospital
 ECG INTERPRETATION: the basics Damrong Sukitpunyaroj MD Damrong Sukitpunyaroj, MD Perfect Heart Institue, Piyavate Hospital Overview Conduction Pathways Systematic Interpretation Common abnormalities in
Understanding the Electrocardiogram. David C. Kasarda M.D. FAAEM St. Luke s Hospital, Bethlehem
 Understanding the Electrocardiogram David C. Kasarda M.D. FAAEM St. Luke s Hospital, Bethlehem Overview 1. History 2. Review of the conduction system 3. EKG: Electrodes and Leads 4. EKG: Waves and Intervals
12-Lead EKG Interpretation. Judith M. Haluka BS, RCIS, EMT-P
 12-Lead EKG Interpretation Judith M. Haluka BS, RCIS, EMT-P ECG Grid Left to Right = Time/duration Vertical measure of voltage (amplitude) Expressed in mm P-Wave Depolarization of atrial muscle Low voltage
BIPOLAR LIMB LEADS UNIPOLAR LIMB LEADS PRECORDIAL (UNIPOLAR) LEADS VIEW OF EACH LEAD INDICATIVE ECG CHANGES
 LEADS VIEW OF EACH LEAD INDICATIVE ECG CHANGES") BIPOLAR LIMB LEADS Have both a distinctive positive and negative pole. Lead I LA (positive) RA (negative) Lead II LL (positive) RA (negative) Lead III LL (positive) LA (negative) UNIPOLAR LIMB LEADS Have
BIPOLAR LIMB LEADS Have both a distinctive positive and negative pole. Lead I LA (positive) RA (negative) Lead II LL (positive) RA (negative) Lead III LL (positive) LA (negative) UNIPOLAR LIMB LEADS Have
Systematic Approach to 12 Lead EKG Interpretation
 Systematic Approach to 12 Lead EKG Interpretation Maureen Knechtel MPAS, PA-C Wellmont CVA Heart Institute Disclosure Statement of Financial Interest I, Maureen Knechtel, do not have a financial interest/arrangement
Evaluation copy. Analyzing the Heart with EKG. Computer
 Analyzing the Heart with EKG Computer An electrocardiogram (ECG or EKG) is a graphical recording of the electrical events occurring within the heart. In a healthy heart there is a natural pacemaker in
Introduction to Electrocardiography. The Genesis and Conduction of Cardiac Rhythm
 Introduction to Electrocardiography Munther K. Homoud, M.D. Tufts-New England Medical Center Spring 2008 The Genesis and Conduction of Cardiac Rhythm Automaticity is the cardiac cell s ability to spontaneously
QRS Complexes. Fast & Easy ECGs A Self-Paced Learning Program
 6 QRS Complexes Fast & Easy ECGs A Self-Paced Learning Program Q I A ECG Waveforms Normally the heart beats in a regular, rhythmic fashion producing a P wave, QRS complex and T wave I Step 4 of ECG Analysis
NEONATAL & PEDIATRIC ECG BASICS RHYTHM INTERPRETATION
 NEONATAL & PEDIATRIC ECG BASICS & RHYTHM INTERPRETATION VIKAS KOHLI MD FAAP FACC SENIOR CONSULATANT PEDIATRIC CARDIOLOGY APOLLO HOSPITAL MOB: 9891362233 ECG FAX LINE: 011-26941746 THE BASICS: GRAPH PAPER
Electrophysiology Introduction, Basics. The Myocardial Cell. Chapter 1- Thaler
 Electrophysiology Introduction, Basics Chapter 1- Thaler The Myocardial Cell Syncytium Resting state Polarized negative Membrane pump Depolarization fundamental electrical event of the heart Repolarization
Activity 4.2.3: EKG. Introduction. Equipment. Procedure
 Activity 4.2.3: EKG The following is used with permission of Vernier Software and Technology. This activity is based on the experiment Analyzing the Heart with EKG from the book Human Physiology with Vernier,
MULTIPLE CHOICE. Choose the one alternative that best completes the statement or answers the question.
 Exam Name MULTIPLE CHOICE. Choose the one alternative that best completes the statement or answers the question. 1) What term is used to refer to the process of electrical discharge and the flow of electrical
RAPID INTERPRETATION OF. EKG s
 Personal Quick Reference Sheets 333 (pages 333 to 346) There is no need to remove these reference pages from your book. To download and print them in full color, go to: www.themdsite.com Reference Sheets
ACLS Chapter 3 Rhythm Review Instructor Lesson Plan to Accompany ACLS Study Guide 3e
 ACLS Chapter 3 Rhythm Review Lesson Plan Required reading before this lesson: ACLS Study Guide 3e Textbook Chapter 3 Materials needed: Multimedia projector, computer, ACLS Chapter 3 Recommended minimum
INTRODUCTORY GUIDE TO IDENTIFYING ECG IRREGULARITIES
 INTRODUCTORY GUIDE TO IDENTIFYING ECG IRREGULARITIES NOTICE: This is an introductory guide for a user to understand basic ECG tracings and parameters. The guide will allow user to identify some of the
By the end of this continuing education module the clinician will be able to:
 EKG Interpretation WWW.RN.ORG Reviewed March, 2015, Expires April, 2017 Provider Information and Specifics available on our Website Unauthorized Distribution Prohibited 2015 RN.ORG, S.A., RN.ORG, LLC Developed
Biology 347 General Physiology Lab Advanced Cardiac Functions ECG Leads and Einthoven s Triangle
 Biology 347 General Physiology Lab Advanced Cardiac Functions ECG Leads and Einthoven s Triangle Objectives Students will record a six-lead ECG from a resting subject and determine the QRS axis of the
Tachyarrhythmias (fast heart rhythms)
") Patient information factsheet Tachyarrhythmias (fast heart rhythms) The normal electrical system of the heart The heart has its own electrical conduction system. The conduction system sends signals throughout
Patient information factsheet Tachyarrhythmias (fast heart rhythms) The normal electrical system of the heart The heart has its own electrical conduction system. The conduction system sends signals throughout
Electrocardiography I Laboratory
 Introduction The body relies on the heart to circulate blood throughout the body. The heart is responsible for pumping oxygenated blood from the lungs out to the body through the arteries and also circulating
BASIC CARDIAC ARRHYTHMIAS Revised 10/2001
 BASIC CARDIAC ARRHYTHMIAS Revised 10/2001 A Basic Arrhythmia course is a recommended prerequisite for ACLS. A test will be given that will require you to recognize cardiac arrest rhythms and the most common
Electrocardiography Review and the Normal EKG Response to Exercise
 Electrocardiography Review and the Normal EKG Response to Exercise Cardiac Anatomy Electrical Pathways in the Heart Which valves are the a-v valves? Closure of the a-v valves is associated with which heart
The abbreviation EKG, for electrocardiogram,
 CLIN PEDIATR OnlineFirst, published on January 28, 2010 as doi:10.1177/0009922809336206 Simplified Pediatric Electrocardiogram Interpretation Clinical Pediatrics Volume XX Number X Month XXXX xx-xx 2009
Electrodes placed on the body s surface can detect electrical activity, APPLIED ANATOMY AND PHYSIOLOGY. Circulatory system
 4 READING AND INTERPRETING THE ELECTROCARDIOGRAM Electrodes placed on the body s surface can detect electrical activity, which occurs in the heart. The recording of these electrical events comprises an
ECG Measurments and Interpretation Programs
 ECG Measurments and Interpretation Programs Physician s Guide Distributed by Welch Allyn 4341 State Street Road, PO Box 220 Skaneateles Falls, NY 13153-0220 www.welchallyn.com Sales and Service information:
An ECG Primer. Quick Look. I saw it, but I did not realize it. Elizabeth Peabody
 4 An ECG Primer Quick Look Cardiac Monitoring System - p. 64 ECG Paper - p. 73 Lead Polarity and Vectors - p. 77 Basic ECG Components - p. 79 Heart Rate and Pulse Rate - p. 91 Summary - p. 94 Chapter Quiz
ECG INTERPRETATION MANUAL
 Lancashire & South Cumbria Cardiac Network ECG INTERPRETATION MANUAL THE ABNORMAL ECG Lancashire And South Cumbria Cardiac Physiologist Training Manual AV NODAL BLOCKS (HEART BLOCKS) Disturbances of intra
The Electrocardiogram (ECG)
") The Electrocardiogram (ECG) Preparation for RWM Lab Experiment The first ECG was measured by Augustus Désiré Waller in 1887 using Lippmann's capillary electrometer. Recorded ECG: http://www.youtube.com/watch_popup?v=q0jmfivadue&vq=large
The Electrocardiogram (ECG) Preparation for RWM Lab Experiment The first ECG was measured by Augustus Désiré Waller in 1887 using Lippmann's capillary electrometer. Recorded ECG: http://www.youtube.com/watch_popup?v=q0jmfivadue&vq=large
Interpreting a rhythm strip
 3 Interpreting a rhythm strip Just the facts In this chapter, you ll learn: the components of an ECG complex and their significance and variations techniques for calculating the rate and rhythm of an ECG
ST Segment Elevation Nothing is ever as hard (or easy) as it looks
 as it looks") ST Segment Elevation Nothing is ever as hard (or easy) as it looks Cameron Guild, MD Division of Cardiology University of Mississippi Medical Center February 17, 2012 Objectives 1. Describe the electrical
ST Segment Elevation Nothing is ever as hard (or easy) as it looks Cameron Guild, MD Division of Cardiology University of Mississippi Medical Center February 17, 2012 Objectives 1. Describe the electrical
The Basics of 12 Lead EKG s
 EMS Solutions Presents The Basics of 12 Lead EKG s NOTICE: You DO NOT Have the Right to Reprint or Resell this Publication. However, you MAY give this report away, provided you do not change or alter the
Diagnosis Code Crosswalk : ICD-9-CM to ICD-10-CM Cardiac Rhythm and Heart Failure Diagnoses
 Diagnosis Code Crosswalk : to 402.01 Hypertensive heart disease, malignant, with heart failure 402.11 Hypertensive heart disease, benign, with heart failure 402.91 Hypertensive heart disease, unspecified,
HTEC 91. Topic for Today: Atrial Rhythms. NSR with PAC. Nonconducted PAC. Nonconducted PAC. Premature Atrial Contractions (PACs)
") HTEC 91 Medical Office Diagnostic Tests Week 4 Topic for Today: Atrial Rhythms PACs: Premature Atrial Contractions PAT: Paroxysmal Atrial Tachycardia AF: Atrial Fibrillation Atrial Flutter Premature Atrial
HTEC 91 Medical Office Diagnostic Tests Week 4 Topic for Today: Atrial Rhythms PACs: Premature Atrial Contractions PAT: Paroxysmal Atrial Tachycardia AF: Atrial Fibrillation Atrial Flutter Premature Atrial
The P Wave: Indicator of Atrial Enlargement
 Marquette University e-publications@marquette Physician Assistant Studies Faculty Research and Publications Health Sciences, College of 8-12-2010 The P Wave: Indicator of Atrial Enlargement Patrick Loftis
EKG Abnormalities. I. Early repolarization abnormality:
 I. Early repolarization abnormality: EKG Abnormalities A. A normal variant. Early repolarization is most often seen in healthy young adults. Look for ST elevation, tall QRS voltage, "fishhook" deformity
Scott Hubbell, MHSc, RRT-NPS, C-NPT, CCT Clinical Education Coordinator/Flight RRT EagleMed
 Scott Hubbell, MHSc, RRT-NPS, C-NPT, CCT Clinical Education Coordinator/Flight RRT EagleMed Identify the 12-Lead Views Explain the vessels of occlusion Describe the three I s Basic Interpretation of 12-Lead
HEART HEALTH WEEK 3 SUPPLEMENT. A Beginner s Guide to Cardiovascular Disease HEART FAILURE. Relatively mild, symptoms with intense exercise
 WEEK 3 SUPPLEMENT HEART HEALTH A Beginner s Guide to Cardiovascular Disease HEART FAILURE Heart failure can be defined as the failing (insufficiency) of the heart as a mechanical pump due to either acute
Copyright 2006 Blaufuss Multimedia. All rights reserved. Page 1
 Copyright 2006 Blaufuss Multimedia. All rights reserved. Page 1 002 Sinus Rhythm, atrial rate 90 Mobitz II AVB, Ventricular rate 50 Left Atrial Enlargement Left Ventricular Hypertrophy RBBB a) Long R-R
How to read the ECG in athletes: distinguishing normal form abnormal
 How to read the ECG in athletes: distinguishing normal form abnormal Antonio Pelliccia, MD Institute of Sport Medicine and Science www.antoniopelliccia.it Cardiac adaptations to Rowing Vagotonia Sinus
The heart then repolarises (or refills) in time for the next stimulus and contraction.
 in time for the next stimulus and contraction.") Atrial Fibrillation BRIEFLY, HOW DOES THE HEART PUMP? The heart has four chambers. The upper chambers are called atria. One chamber is called an atrium, and the lower chambers are called ventricles. In
Atrial Fibrillation BRIEFLY, HOW DOES THE HEART PUMP? The heart has four chambers. The upper chambers are called atria. One chamber is called an atrium, and the lower chambers are called ventricles. In
2 ECG basics. Leads and planes. Leads. Planes. from different perspectives, which are called leads and planes.
 558302.qxp 3/14/12 10:47 PM Page 12 2 ECG basics One of the most valuable diagnostic tools available, an electrocardiogram (ECG) records the heart s electrical activity as waveforms. By interpreting these
Objectives. The ECG in Pulmonary and Congenital Heart Disease. Lead II P-Wave Amplitude during COPD Exacerbation and after Treatment (50 pts.
 The ECG in Pulmonary and Congenital Heart Disease Gabriel Gregoratos, MD Objectives Review the pathophysiology and ECG signs of pulmonary dysfunction Review the ECG findings in patients with: COPD (chronic
Heart and Vascular System Practice Questions
 Heart and Vascular System Practice Questions Student: 1. The pulmonary veins are unusual as veins because they are transporting. A. oxygenated blood B. de-oxygenated blood C. high fat blood D. nutrient-rich
Normal Sinus Rhythm. Sinus Bradycardia. Sinus Tachycardia. Rhythm ECG Characteristics Example (NSR) & consistent. & consistent.
 & consistent. & consistent.") Normal Sinus Rhythm (NSR) Rate: 60-100 per minute Rhythm: R- R = P waves: Upright, similar P-R: 0.12-0.20 second & consistent P:qRs: 1P:1qRs Sinus Tachycardia Exercise Hypovolemia Medications Fever Hypoxia
Normal Sinus Rhythm (NSR) Rate: 60-100 per minute Rhythm: R- R = P waves: Upright, similar P-R: 0.12-0.20 second & consistent P:qRs: 1P:1qRs Sinus Tachycardia Exercise Hypovolemia Medications Fever Hypoxia
HOW TO READ AN ECG. Rate = 300 / big squares 1 line = 300 2 line = 150 3 line = 75 4 line = 60 5 line = 50 6 line = 42 7 line = 38
 HOW TO READ AN ECG Pathophysiology Pacemaker Rates: SAN 60-100 AVN 40-60 Ventricle 20-40 Areas of ECG Horizontal scale: 1mm = 0.04s 5mm = 0.2s Calculating Rate Rate = 300 / big squares 1 line = 300 2 line
Tips and Tricks to Demystify 12 Lead ECG Interpretation
 Tips and Tricks to Demystify 12 Lead ECG Interpretation Mission: Lifeline North Dakota Regional EMS and Hospital Conference Samantha Kapphahn, DO Essentia Health- Interventional Cardiology June 5th, 2014
School of Health Sciences
 School of Health Sciences Cardiology Teaching Package A Beginners Guide to Normal Heart Function, Sinus Rhythm & Common Cardiac Arrhythmias Welcome This document extends subjects covered in the Cardiology
Exchange solutes and water with cells of the body
 Chapter 8 Heart and Blood Vessels Three Types of Blood Vessels Transport Blood Arteries Carry blood away from the heart Transport blood under high pressure Capillaries Exchange solutes and water with cells
ACLS RHYTHM TEST. 2. A 74-year-old woman with chest pain. Blood pressure 192/90 and rates her pain 9/10.
 ACLS RHYTHM TEST Name Date Choose the best answer for each of the following questions. Each of the following strips is 6 seconds in length. 1. Identify the following rhythm a. Sinus bradycardia with 2
ELECTROCARDIOGRAPHY (I) THE GENESIS OF THE ELECTROCARDIOGRAM
 THE GENESIS OF THE ELECTROCARDIOGRAM") ELECTROCARDIOGRAPHY (I) THE GENESIS OF THE ELECTROCARDIOGRAM Scridon Alina, Șerban Răzvan Constantin 1. Definition The electrocardiogram (abbreviated ECG or EKG) represents the graphic recording of electrical
ELECTROCARDIOGRAPHY (I) THE GENESIS OF THE ELECTROCARDIOGRAM Scridon Alina, Șerban Răzvan Constantin 1. Definition The electrocardiogram (abbreviated ECG or EKG) represents the graphic recording of electrical
Signal-averaged electrocardiography late potentials
 SIGNAL AVERAGED ECG INTRODUCTION Signal-averaged electrocardiography (SAECG) is a special electrocardiographic technique, in which multiple electric signals from the heart are averaged to remove interference
Interpreting AV (Heart) Blocks: Breaking Down the Mystery
 Blocks: Breaking Down the Mystery") Interpreting AV (Heart) Blocks: Breaking Down the Mystery 2 Contact Hours Copyright 2012 by RN.com. All Rights Reserved. Reproduction and distribution of these materials is prohibited without the express
Interpreting AV (Heart) Blocks: Breaking Down the Mystery 2 Contact Hours Copyright 2012 by RN.com. All Rights Reserved. Reproduction and distribution of these materials is prohibited without the express
Atrioventricular (AV) node ablation
 node ablation") Patient information factsheet Atrioventricular (AV) node ablation The normal electrical system of the heart The heart has its own electrical conduction system. The conduction system sends signals throughout
Patient information factsheet Atrioventricular (AV) node ablation The normal electrical system of the heart The heart has its own electrical conduction system. The conduction system sends signals throughout
Basics of EKG Interpretation: A Programmed Study - Barbara Ritter Ed.D, FNP
 Basics of EKG Interpretation: A Programmed Study - Barbara Ritter Ed.D, FNP Acknowledgement is given to Leslie K. Muma, MS, RN, NP for assistance in preparation of this learning module. Description The
Lead avr: The Neglected Lead
 Chapter 22 Lead avr: The Neglected Lead M Chenniappan INTRODUCTION Lead avr, one of the 12 electrocardiographic leads, is frequently ignored in clinical medicine. In fact, many clinicians refer to the
Atrial & Junctional Dysrhythmias
 Atrial & Junctional Dysrhythmias Atrial & Junctional Dysrhythmias Atrial Premature Atrial Complex Wandering Atrial Pacemaker Atrial Tachycardia (ectopic) Multifocal Atrial Tachycardia Atrial Flutter Atrial
Introduction to Electrophysiology. Wm. W. Barrington, MD, FACC University of Pittsburgh Medical Center
 Introduction to Electrophysiology Wm. W. Barrington, MD, FACC University of Pittsburgh Medical Center Objectives Indications for EP Study How do we do the study Normal recordings Abnormal Recordings Limitations
Practical class 3 THE HEART
 Practical class 3 THE HEART OBJECTIVES By the time you have completed this assignment and any necessary further reading or study you should be able to:- 1. Describe the fibrous pericardium and serous pericardium,
ECG Measurement and Interpretation
 ECG Measurement and Interpretation Statement of accuracy for analysing ECG units *2.530036* Physicians Guide Sales and Service Information The SCHILLER sales and service centre network is world-wide. For
Distance Learning Program Anatomy of the Human Heart/Pig Heart Dissection Middle School/ High School
 Distance Learning Program Anatomy of the Human Heart/Pig Heart Dissection Middle School/ High School This guide is for middle and high school students participating in AIMS Anatomy of the Human Heart and
Electrophysiology study (EPS)
") Patient information factsheet Electrophysiology study (EPS) The normal electrical system of the heart The heart has its own electrical conduction system. The conduction system sends signals throughout
Patient information factsheet Electrophysiology study (EPS) The normal electrical system of the heart The heart has its own electrical conduction system. The conduction system sends signals throughout
Electrocardiogram and Heart Sounds
 Electrocardiogram and Heart Sounds An introduction to the recording and analysis of electrocardiograms, and the sounds of the heart. Written by Staff of ADInstruments Introduction The beating of the heart
Feature Vector Selection for Automatic Classification of ECG Arrhythmias
 Feature Vector Selection for Automatic Classification of ECG Arrhythmias Ch.Venkanna 1, B. Raja Ganapathi 2 Assistant Professor, Dept. of ECE, G.V.P. College of Engineering (A), Madhurawada, A.P., India
Adult Cardiac Surgery ICD9 to ICD10 Crosswalks
 164.1 Malignant neoplasm of heart C38.0 Malignant neoplasm of heart 164.1 Malignant neoplasm of heart C45.2 Mesothelioma of pericardium 198.89 Secondary malignant neoplasm of other specified sites C79.89
Section Four: Pulmonary Artery Waveform Interpretation
 Section Four: Pulmonary Artery Waveform Interpretation All hemodynamic pressures and waveforms are generated by pressure changes in the heart caused by myocardial contraction (systole) and relaxation/filling
VCA Veterinary Specialty Center of Seattle
 An electrocardiogram (ECG) is a graph of the heart`s electrical current, which allows evaluation of heart rate, rhythm and conduction. Identification of conduction problems within the heart begins with
Equine Cardiovascular Disease
 Equine Cardiovascular Disease 3 rd most common cause of poor performance in athletic horses (after musculoskeletal and respiratory) Cardiac abnormalities are rare Clinical Signs: Poor performance/exercise
Sleep Heart Health Study (SHHS) ECG Protocol
 ECG Protocol") Sleep Heart Health Study (SHHS) ECG Protocol SHHS 1 Electrocardiography (ECG) Baseline ECG is performed in all parent study clinic visits preceding the PSG. All sites perform a standard resting 12-lead
Sleep Heart Health Study (SHHS) ECG Protocol SHHS 1 Electrocardiography (ECG) Baseline ECG is performed in all parent study clinic visits preceding the PSG. All sites perform a standard resting 12-lead
How To Understand What You Know
 Heart Disorders Glossary ABG (Arterial Blood Gas) Test: A test that measures how much oxygen and carbon dioxide are in the blood. Anemia: A condition in which there are low levels of red blood cells in
Catheter Ablation. A Guided Approach for Treating Atrial Arrhythmias
 Catheter Ablation A Guided Approach for Treating Atrial Arrhythmias A P A T I E N T H A N D B O O K This brochure will provide an overview of atrial arrhythmias (heart rhythm problems affecting the upper
Electrophysiology Heart Study - EPS -
 Electrophysiology Heart Study - EPS - What is an EPS? EPS is short for ElectroPhysiology heart Study. This procedure looks at the electrical system of your heart. An EPS will show if you have a heart rhythm
The new generation in ECG interpretation
 The new generation in ECG interpretation Philips DXL ECG Algorithm, Release PH100B The Philips DXL ECG Algorithm, developed by the Advanced Algorithm Research Center, uses sophisticated analytical methods
DEPARTMENT OF HEALTH AND HUMAN SERVICES Centers for Medicare & Medicaid Services
 DEPARTMENT OF HEALTH AND HUMAN SERVICES Centers for Medicare & Medicaid Services NEW product from the Medicare Learning Network (MLN) Provider Compliance Tips for Computed Tomography (CT) Scans Podcast,
Table of Contents Error! Bookmark not defined.
 Table of Contents EKG TRACING...1 Figure 1 - EKG Tracing... Error! Bookmark not defined. STEP 1...1 Rate... 1 Figure 2 - Determining the Rate... 1 Step 2...2 Rhythm... 2 Figure 3 - Determining the Rhythm
ECG Signal Analysis Using Wavelet Transforms
 Bulg. J. Phys. 35 (2008) 68 77 ECG Signal Analysis Using Wavelet Transforms C. Saritha, V. Sukanya, Y. Narasimha Murthy Department of Physics and Electronics, S.S.B.N. COLLEGE (Autonomous) Anantapur 515
The Patient s Guide to the Electrophysiologic Study (EPS) and Catheter Ablation
 and Catheter Ablation") The Patient s Guide to the Electrophysiologic Study (EPS) and Catheter Ablation 2 P a g e Table of Contents Introduction How the Heart Works 3 How the Heart s Electrical System Works 3 Commonly Used Heart
The Patient s Guide to the Electrophysiologic Study (EPS) and Catheter Ablation 2 P a g e Table of Contents Introduction How the Heart Works 3 How the Heart s Electrical System Works 3 Commonly Used Heart
Review of Important ECG Findings in Patients with Syncope Joseph Toscano, MD
 92 Review of Important ECG Findings in Patients with Syncope Joseph Toscano, MD Abstract Guidelines recommend 12-lead ECG as an important test to perform in patients with syncope. Though the incidence
Palpitations & AF. Richard Grocott Mason Consultant Cardiologist THH NHS Foundation Trust & Royal Brompton & Harefield NHS Foundation Trust
 Palpitations & AF Richard Grocott Mason Consultant Cardiologist THH NHS Foundation Trust & Royal Brompton & Harefield NHS Foundation Trust Palpitations Frequent symptom Less than 50% associated with arrhythmia
Patient Information Sheet Electrophysiological study
 Patient Information Sheet Electrophysiological study Your doctor has recommended performing an electrophysiological study (also called EPS). EPS is a diagnostic procedure designed to test and evaluate
Morphology of the Electrocardiogram
 TETC01 12/2/05 18:09 Page 1 1 The Morphology of the Electrocardiogram ntoni ayés de Luna, Velislav N. atchvarov and Marek Malik Summary The 12-lead electrocardiogram (ECG) is the single most commonly performed
Monitoring EKG. Evaluation copy
 Monitoring EKG Computer 28 An electrocardiogram, or EKG, is a graphical recording of the electrical events occurring within the heart. A typical EKG tracing consists of five identifiable deflections. Each
RACE I Rapid Assessment by Cardiac Echo. Intensive Care Training Program Radboud University Medical Centre NIjmegen
 RACE I Rapid Assessment by Cardiac Echo Intensive Care Training Program Radboud University Medical Centre NIjmegen RACE Goal-directed study with specific questions Excludes Doppler ultrasound Perform 50
Current Management of Atrial Fibrillation DISCLOSURES. Heart Beat Anatomy. I have no financial conflicts to disclose
 Current Management of Atrial Fibrillation Mary Macklin, MSN, APRN Concord Hospital Cardiac Associates DISCLOSURES I have no financial conflicts to disclose Book Women: Fit at Fifty. A Guide to Living Long.
Chapter 20: The Cardiovascular System: The Heart
 Chapter 20: The Cardiovascular System: The Heart Chapter Objectives ANATOMY OF THE HEART 1. Describe the location and orientation of the heart within the thorax and mediastinal cavity. 2. Describe the
Electrocardiogram analyser with a mobile phone
 Electrocardiogram analyser with a mobile phone André Baptista 1 and João Sanches 2 1 Instituto Superior Técnico, Lisbon, Portugal [email protected] 2 Systems and Robotics Institute, Instituto
Cardiovascular Physiology
 Cardiovascular Physiology Heart Physiology for the heart to work properly contraction and relaxation of chambers must be coordinated cardiac muscle tissue differs from smooth and skeletal muscle tissues
PRO-CPR. 2015 Guidelines: PALS Algorithm Overview. (Non-AHA supplementary precourse material)
") PRO-CPR 2015 Guidelines: PALS Algorithm Overview (Non-AHA supplementary precourse material) Please reference Circulation (from our website), the ECC Handbook, or the 2015 ACLS Course Manual for correct
PRO-CPR 2015 Guidelines: PALS Algorithm Overview (Non-AHA supplementary precourse material) Please reference Circulation (from our website), the ECC Handbook, or the 2015 ACLS Course Manual for correct
Efficient Heart Rate Monitoring
 Efficient Heart Rate Monitoring By Sanjeev Kumar, Applications Engineer, Cypress Semiconductor Corp. Heart rate is one of the most frequently measured parameters of the human body and plays an important
Cardioversion for. Atrial Fibrillation. Your Heart s Electrical System Cardioversion Living with Atrial Fibrillation
 Cardioversion for Atrial Fibrillation Your Heart s Electrical System Cardioversion Living with Atrial Fibrillation When You Have Atrial Fibrillation You ve been told you have a heart condition called atrial
Biopac Student Lab Lesson 6 ELECTROCARDIOGRAPHY (ECG) II Introduction. Rev. 06132012
 II Introduction. Rev. 06132012") 42 Aero Camino, Goleta, CA 93117 www.biopac.com Biopac Student Lab Lesson 6 ELECTROCARDIOGRAPHY (ECG) II Introduction Rev. 06132012 Richard Pflanzer, Ph.D. Associate Professor Emeritus Indiana University
42 Aero Camino, Goleta, CA 93117 www.biopac.com Biopac Student Lab Lesson 6 ELECTROCARDIOGRAPHY (ECG) II Introduction Rev. 06132012 Richard Pflanzer, Ph.D. Associate Professor Emeritus Indiana University
Heart Murmurs. Outline. Basic Pathophysiology
 Heart Murmurs David Leder Outline I. Basic Pathophysiology II. Describing murmurs III. Systolic murmurs IV. Diastolic murmurs V. Continuous murmurs VI. Summary Basic Pathophysiology Murmurs = Math Q =
Atrial Fibrillation (AF) Explained
 Explained") James Paget University Hospitals NHS Foundation Trust Atrial Fibrillation (AF) Explained Patient Information Contents What are the symptoms of atrial fibrillation (AF)? 3 Normal heartbeat 4 How common
James Paget University Hospitals NHS Foundation Trust Atrial Fibrillation (AF) Explained Patient Information Contents What are the symptoms of atrial fibrillation (AF)? 3 Normal heartbeat 4 How common
THE HEART Dr. Ali Ebneshahidi
 THE HEART Dr. Ali Ebneshahidi Functions is of the heart & blood vessels 1. The heart is an essential pumping organ in the cardiovascular system where the right heart pumps deoxygenated blood (returned
Anatomi & Fysiologi 060301. The cardiovascular system (chapter 20) The circulation system transports; What the heart can do;
 The circulation system transports; What the heart can do;") The cardiovascular system consists of; The cardiovascular system (chapter 20) Principles of Anatomy & Physiology 2009 Blood 2 separate pumps (heart) Many blood vessels with varying diameter and elasticity
The cardiovascular system consists of; The cardiovascular system (chapter 20) Principles of Anatomy & Physiology 2009 Blood 2 separate pumps (heart) Many blood vessels with varying diameter and elasticity
The Heart Rhythm Charity
 The Heart Rhythm Charity Promoting better understanding, diagnosis, treatment and quality of life for individuals with cardiac arrhythmias Registered Charity No. 1107496 2006 Bradycardia (Slow Heart Rhythm)
MEANS ECG Physicians Manual for Welch Allyn CP Series Electrocardiographs
 MEANS ECG Physicians Manual f Welch Allyn CP Series Electrocardiographs Welch Allyn 4341 State Street Road PO Box 220 Skaneateles Falls, NY 13153-0220 USA 2013, DIR: 80011564, Ver: E www.welchallyn.com
COVERAGE GUIDANCE: ABLATION FOR ATRIAL FIBRILLATION
 COVERAGE GUIDANCE: ABLATION FOR ATRIAL FIBRILLATION Question: How should the EGBS Coverage Guidance regarding ablation for atrial fibrillation be applied to the Prioritized List? Question source: Evidence