Upper Gangetic Plain 128
|
|
|
- Maud Perry
- 9 years ago
- Views:
Transcription
1 Chapter 5: Upper Gangetic Plain 128

2 Chapter 5: The present chapter discusses the fluvio-geomorphological changes, the erosion and the aggradation of land, the evolutionary pattern and the oscillation zone formulation of the Ganga river within the selected reach in the upper Gangetic plain. 5.1: Introduction: In an attempt to understand the fluvio-geomorphological changes of the Ganga River along its course from Haridwar to Varanasi in Uttar Pradesh, with in the two selected reaches from the upper Gangetic plain to the lower Gangetic plain, multi-date satellite data acquired and available for the period of last few decades was analyzed and the observations and computed results from the present studies are discussed in detail in present as well as the subsequent chapter. Fluvio-geomorphological features of the Ganga river was delineated using the Survey of India (SOI) topographical map surveyed in and the satellite images of year 1972, 1990, 2000, 2004 and These Thematic maps and respective satellite images are present in Figures 5.2 to : Fluvio-Geomorphology: The river after passing through the foot hills of Himalayas debouches in to the plains from Haridwar. The gradient here abruptly changes and owing to it the river current and 129

3 along with that the carrying capacity of the river decreases abruptly. Hence the river deposits a large quantity of sediment load carried by the flow here forming the alluvial fan. The Sediments deposited here are sorted along the river course from coarser to finer moving from apex in north towards downstream in south. In the northern part of the selected reach the boulders, pebbles and gravels are found embedded in the fine matrix of sand and silt. As the river flows downstream it deposits sand and silt along its course downstream of Haridwar. Most of the part of this selected reach comes with in the area of the alluvial fan developed by the Ganga river. Hence the formations are uncompacted and easily tend to erode by the high current of the river here. This enables the river to erode its banks most frequently and shift laterally forming a wide flood plain. The river exhibits typically braiding near Haridwar and downstream, forming multi-stranded channel separated by channel bars and islands stabilized at places because of the vegetation growth. Further downstream from Haridwar and upstream of the Bijnor Barrage, river shows anastomosing pattern and forms large island between two channels where individual channels show meanders : Tectonic setting: River flows in SW direction near Haridwar and changes its direction from SW to SSE to SW with sharp bends, between Haridwar to Bijnor. This sharp bends in the course of the river indicates the structural control over the river in this region. The evolution of the Himalayas from deep Tethys to mountain ranges has undergone a number of facelifts since the Quaternary age. The Indus-Tsangpo suture zone and then the successively southward high tectonic zones, i.e. the Main central Thrust, Main Boundary thrust and Main Frontal Thrust, have been identified as tectonically active and earthquake prone areas (Sahoo et al, 2000). The drainage pattern between the Lesser Himalaya and Siwalik ranges includes two major river systems in this region, the Ganga and the Yamuna river. The tributaries of both these rivers are oriented in a parallel or near-parallel fashion, giving a typical parallel drainage pattern (Sahoo et al, 2000). Parallel patterns are usually found where there are pronounced slopes or structural controls, which lead to 130

4 regular spacing of parallel or near-parallel streams (Thronbury, 1989). Morphotectonic analysis reveals that the fan morphologies and aggradation processes in the piedmont area are mainly controlled by the ongoing tectonic activities (Goswami et al., 2009). Near Haridwar the Ganga river emerge from the Himalayas along a major fault known as the Ganga Tear Fault. This fault is the strike-slip fault, transverse to the Siwalik range and can be clearly seen in the satellite image. The Ganga faults is set of faults which starts form the Shiwalik foothills, west of Haridwar and controls the course of the Ganga river further downstream (Parkash et al, 2000). River channels in this selected area shows three definite trends, viz, the NE-SW trend parallel to the Ganga Tear Fault, the NW-SE trend, parallel to the Ganga Fault and the N-S trend which seems to be controlled by the lineament as well. More over the Dhaulakhand fault acts as a drainage divide between the Ganga and the Yamuna drainage system. Small rivers like those in the Doon valley between the Ganga and the Yamuna rivers, are highly entranched in nature. These are indicatives of the upliftment of the Doon valley in the recent past (Sahoo et al, 2000). Thus Ganga river exhibits a definite control of the Lineaments over the river course and the shifting of the river in this region : Evolutionary Pattern: Channel avulsion and resultant shifting of the Ganga river course are caused by number of natural and anthropogenic factors. The Ganga river has undergone river metamorphosis from meandering to braided stream during late Pleistocene-Holocene (Singh and Ghosh, 1994; Singh, 1992). The braiding or the channel multiplicity has also increased indicating a decrease of the channel slope (Sinha et al., 2002). The reconstruction of the erosional discharge from the Indus river over the past 30 million years using seismic reflection data obtained from drill core samples from the Arabian sea and neodymium isotopes data suggest that the change in the erosional pattern is caused by the rerouting of the major rivers of the Punjab in to the Indus, which flowed east in to 131

5 the Ganga river before just five million year (Clift and Blusztajn, 2005). Support to this comes form the palaeo-current measurements of Burbank, 1992, who showed eastward flow in the foreland basin of northeast Pakistan. Figures 5.1: Topographic maps showing post and pre-capture Indus drainage (Source: Clift and Blusztajn, 2005) This can even assist in explaining the question of the course of the lost river Saraswati, which is assumed to be meeting the Ganga in past (Clift and Blusztajn, 2005; Bakliwal and Grover, 1988). Yamuna was part of Saraswati drainage system, but by times1500 BP Saraswati was lost and upwraping ot Aravalli region due to neotectonics resulted in capture of Yamuna from Saraswati to Gange drainage system around 1500 BC (Saif ud din and Iqballuddin, 1999). Major rivers in the Gangetic plain, flowing west of the Ganga became nonexistent at present owing to the Aravalli drainage divide and discharge capture by the rivers of the Indus system (Figure 5.1). But the evidence of their existent is present in form of palaeo channels in the alluvial Gangetic plain. It can be seen from figure 5.1 that at present the three major river are active in the upper 132
.")
6 Gangetic plain, viz, the Yamuna towards west, the Ganga in the middle and the RamGanga, towards east of Ganga river, forming the interfluves of Yamuna-Ganga and Ganga-RamGanga. Using the soil-geomorphic approach recently, distribution and degree of development of surficial soils have been used to identify four tectonic blocks in the region between the Yamuna and RamGanga rivers in the Upper/western Gangetic plains, luminescence dating of the soils from different blocks has been used to constrain timing of block movements and it was found that the Upper Ganga-Yamuna block got uplifted at about 2500 years BP and consequently the shifting of the Ganga river from west towards east, i.e. from the Upper Ganga-Yamuna block to the Ganga-RamGanga block took place (Parkash et al, 2000, Valdiya, 2010). The Yamuna river has also progressively (from 1500 BC to present) migrated from west to east during the Quaternary period an migration is due to slope mutation of Aravalli block from west to east due to plate accretion in the Indian Ocean and Arabian sea after collision tectonics of the Himalayas in recent time (Saif ud din and Iqballuddin, 1999). Ganga RamGanga block was tilted westward at about 1000 Years BP causing a shift of the Ganga River in westward direction and additionally, a number of smaller movements are inferred during the last 500 years or so (Parkash et al, 2000). Similarly from the studies of the palaeo channels and river terraces it was found that the migratory trend of the Yamuna river towards the west is substantiated by the abandoned channels (Sahoo et al, 2000). The Ganga river once again migrated towards east recently as observed in present study as well as cited by many other workers in past (Das Gupta, 1975; Philip, 1996). 5.2: Fluvio-Geomorphological changes: In the present study area, the fluvial geomophological changes between 1966 and 2006 viz., the bankline changes, the main river channel migration, Changes in the morphology and the surface area of the sandbars, channel bars, sandbars/channel bars with vegetation, Islands, abandoned channels, flood plain, changes in the surface area of the active river 133
.")
7 bed and the erosion and aggradation, are studied. Along with this the palaeo features were mapped from the satellite data and from understanding these palaeo features the oscillation zone have been delineated. In 1966 river is single stranded and shows more or less the meandering pattern throughout the selected window in the upper Gangetic plain. But in 2006 the braiding pattern formed by the river channels is distinct south of Haridwar. While a little upstream and near Bijnor river develop anastomosing pattern by bifurcating in to multi channel course, where individual streams even exhibits the meandering as well as braiding pattern. These development of the new channels occurred through revival of the palaeo channels towards present in the flood plain towards east, leaving the older streams abandoned. In 1966 the river shows the meandering pattern and high amount of sediment brought with river flow to the plain area silted up the river bed forming large number of the sandbars (figure 5.2). With the development of the braided channels, the channel bar increased as seen in the data of 1972, 1990, 2000, 2004 and 2006 (figure 5.3 to 5.8). Area of the sandbars and the channel bars, without and with the vegetation growth as seen in has shown varying proportion through the time owing to the erosion and aggradation of land, carried out by the river water throughout the selected stretch in the upper Gangetic plain. From 1966 to 2006 the cumulative surface area of sand deposition has decreased remarkably from 145 sq km to 96.3 sq km. Near Haridwar the morphology of the sandbars and channel bars have not changed much, but further downstream, the area of both the sandbars and the channels bars have decreased. Because of the development of the vegetation on the sandbars and channel bars along the river course near Haridwar the sandbars and the channel bars are stabilized as compared to the area downstream. Since the vegetation growth on the loose sediment of the river bed binds the material together making those areas more resistant to the river erosion and hence the stable area on sandbars and channel bars are developed. These portions of the sandbars and the channel bars are less prone to be washed out by the flow current and carried downstream along with the river water. 134

8 When river forms braided or anastomosing pattern, river course give rise to multiple, interlacing channels, bifurcate in two or more channels, at places enclose a large island completely surrounded by the river channels. In 1966, as shown in figure 5.2, the river shows single stranded meandering course where no island are formed but in Nov, 1972 (figure 5.3) river has split up it to two channels, as a result of development of new channel almost 3.5 to 4 km east from the position of the river course in 1966 and this gave rise an island. From the satellite data of Dec, 2000 (figure 5.5) it was apparent that the area of the island has increased and this is because of the formation of third channel further 4 km towards east by the bifurcation of the mail channel in to three channels some km upstream of Bijnor barrage. From 2000 to 2004 (figure 5.6) there was a noticeable and abrupt decrease in the area of island and still continued to decrease till 2006 (figure 5.8). The area of island decreased because the two channels towards west, out of the three bifurcated branches got cut off from the main channel and the area once occupied by the islands is now the part of flood plain. Flood plain is very distinct in the post-monsoon image especially in the near infrared band as it is inundated during the monsoon floods. The uncompact sediments retained moisture through the post-monsoon season and the damp and water logged areas with the fluvial features like the traces of the palaeo channels, meander scars, oxbow lakes and water bodies were easily discerned on the post-monsoon season satellite images. All these features including the palaeo channels, meander scars, oxbow lakes and water bodies in the flood plain indicate the old remnants of the river Ganga flow. The width of the flood plain is 3-4 km near Haridwar but downstream of Haridwar it increases gradually to about km near Bijnor. There is not much variation in the area of the flood plains from 1966 to But It can be seen that the area of flood plains are inversely related to the area of islands, as the river bifurcate to occupy the palaeo channel present in the flood plain, forming island in 2000 the part of flood plain falls between the multi channel course of river forming islands. And when in 2004 and 2006 the channels get cut off from the main channel the island area is once again included in the flood plains. 135

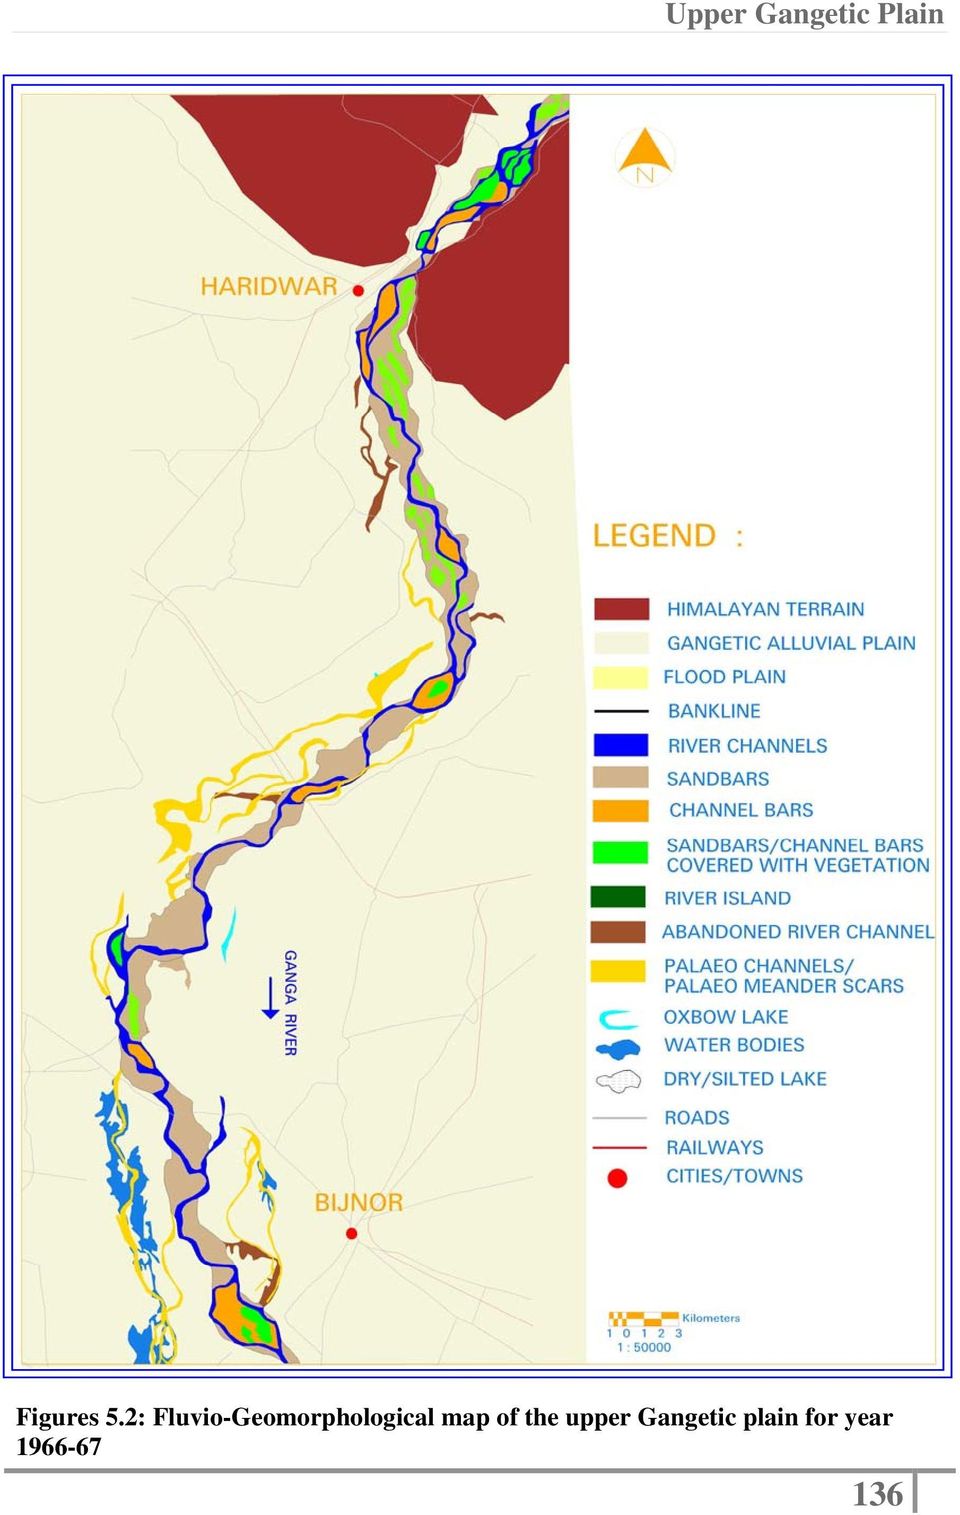
9 Figures 5.2: Fluvio-Geomorphological map of the upper Gangetic plain for year
10 Figures 5.3: Fluvio-Geomorphological map of the upper Gangetic plain and the corresponding LANDSAT MSS image of 14 Nov,

11 Figures 5.4: Fluvio-Geomorphological map of the upper Gangetic plain and the corresponding LANDSAT TM image of 21 Oct,

12 Figures 5.5: Fluvio-Geomorphological map of the upper Gangetic plain and the corresponding IRS LISS III image of 17 Dec,

13 Figures 5.6: Fluvio-Geomorphological map of the upper Gangetic plain and the corresponding IRS LISS III image of 13 Nov,

14 Figures 5.7: Fluvio-Geomorphological map of the upper Gangetic plain and the corresponding IRS LISS III image of 12 Feb,

15 Figures 5.8: Fluvio-Geomorphological map of the upper Gangetic plain and the corresponding IRS LISS III image of 03 Nov,

16 Discharge is high during the monsoon season and river water almost immerse river bed completely and at times even have breached the banks to encroach the flood plain area, forming new channels, which eventually dried off after the monsoon water receded to form abandoned channels. The main and/or secondary channels got parched throughout the year to form abandoned channels, except in monsoon season when they were revived with the fresh discharge routing through them. In general and increasing trend is found in the area of abandoned channels from 2000 to February, The bank line changes, the main river channel migration, change in the surface area of the active river bed, the erosion and aggradation and along with this the palaeo features and the oscillation zone are discussed in detail as below : Change in the bank line from 1966 to 2006: Changes in the bank line indicate the changes in the width and/or the shifting of the riverbed. Many drastic as well as minor changes in the configuration of the bank line are found through the selected reach in the upper Gangetic plain between 1966 and 2006, as seen in figure 5.9. Through out the selected reach in the upper Gangetic plain the bank line shows maximum shift of approximately 4-5 km towards east through out the stretch of km upstream of the Bijnor barrage. All through out the course in the area selected for present study the changes in the bank line shows that the width of the river bed has decreased from 1972 to 2006 (Figure 5. 9). Decadal changes: From 1966 to Nov, 1972 there are minor shift of almost 1 km in the bank line at location A and F and the river bed width has decreased. Major shift of approximately 4-5 km 143

17 A B C D E F Figures 5.9: Shifting in the bank line in the upper Gangetic plain between 1966 and 03 Nov,

18 all along the stretch of almost km at location E just upstream of Bijnor barrage, west of Bijnor city can be seen between 1966 and Nov, 1972 and this was a long term, permanent change (Figure 5. 9). Between Nov, 1972 and Oct, 1990 the western bank has shifted towards east for almost 2 km at location C, the eastern bank has shifted towards west for almost 2 km at location D and it can be seen that the river bed have reduce in width at both the locations and did not regain its width till 2006 thus it was a long term change (Figure 5. 9). From Oct, 1990 to Dec, 2000 the river bed shows no major change except for the stretch at location E, where the eastern bank has shifted towards east varying from 2-4 km throughout the stretch because of the development of a new channel towards east in 2000 (Figure 5. 9). In Nov, 2004 as compared to Dec, 2000, a prominent change is found along the stretch at location E, where the western bank have changed it location and migrated towards east for approximately 3.5 to 5 km as one of the channels towards west dried and got detached from the main river channel (Figure 5. 9). This new channel towards east gained significance in 2006 thus this change is long term. Seasonal changes: In February, 2006 the river bed is found shrunk at two locations, as the eastern bank line have shifted towards west for about 2.5 km at location B and western bank line have shifted towards east varying from 1-3 km all along the stretch at location E, when compared to the bank line configuration in Nov, 2004 due to the drying up of the river channels (Figure 5. 9). But this seems to be a short term change, because at both this locations the bank line gains its original positions in November, No major change is found in the positions of the bank line in Nov, 2006 in comparison to Feb, 2006 except the two locations. At location B the eastern bank has shifted back 145

19 towards east for almost 2.5 km and at location E, western bank has shifted towards west varying from 1-3 km through out the marked stretch (Figure 5. 9) : Main river channel migration from 1966 to 2006: The Ganga plain consists of a large number of river systems, which are in different stages of evolution. The active perennial rivers are incised within the alluvium and show avulsion on a scale of years; some channels, part of the ancient anastomosing network, act as flood channels and show avulsion on a scale of years (Singh, 2004). Within the river bed, the main and the secondary channels shift courses frequently, but not necessarily the entire river bed changes course. Main river channels migration indicates the changes in the thalweg, along which the maximum discharge routes. The shifting of the river Ganga varies from westward to eastward at different places near Haridwar. An evident change in the river channel morphology is found upstream of the Bijnor barrage, where the miximum shift in the main river channel can be seen up to 6-7 km approximately towards eastern direction in the course of the Ganga river through out the stretch of km, upstream of Bijnor barrage (Figure 5.10). Decadal changes: Main river channels in 1966 bifurcated km upstream of Bijnor barrage (location D, figure 5.10), in two branches and the eastern branch was developed by the revival of the palaeo channels present 3 to 3.5 km east of the main river course in 1966 which eventually became the main river course of the Ganga river in In 1990 the major part of the discharge routes southwards through the newly developed channel in 1972 and hence the thalweg shift of 4 km towards east was noticed in Hence in 1990 two parallel flowing channels were formed which eventually meet at the barrage, where the eastern branch is the main river channel and the western branch does not get enough discharge to aggrade up the riverbed with the debris carried by the flow of the river water and thus is not very wide and seems to be losing its significance with reduction of 146

20 A B C D DIRECTION OF SHIFT E Figures 5.10: Shifting in the main river channel of the upper Gangetic plain between 1966 and 03 Nov,

21 discharge through time. Most of the flow from the western branch is captured by the newly developed eastern branch and the river bed is getting very heavy discharge aggrading the valley and river further bifurcates to accommodate the flow in More striking feature is the development of a third branch (location D, figure 5.10), which separates out of the main river channel and flow further 3.5 km approximately, towards east of main river channel in year This newly developed channel is also formed due to the revival of previously existing stream, which was just a palaeo channel abandoned in past and most of the flow is diverted to it and run off to get its way through towards south and erodes new areas southwards along the valley. In 2000 the middle branch is the main river channel and the other two branches towards west and east are now very wide. But in 2004 then eastern most branch becomes the main channel and most of the discharge flows through it, hence there is once again a thalweg shift 3.4 to 4 km towards east and both the other streams towards west get cut off from the main river channel and get desiccated. This development of two new channels and the main river channel shift towards east, at location D is a long term change in the river. Seasonal changes: Further the decrease in the discharge is observer in 2006 and both the western branches are converted into abandoned channels. But in Nov, 2006 the discharge has increased and the middle branch is revived by the monsoon water. Thus the drying up of the western branches can be considered as the short term or the seasonal change, where the features may or may not get back to its original form. Even in Nov, 2006, along small stretch the main channel has shifted towards east (location D, figure 5.10). The main river channel almost flows along a straight course continuously for a stretch of almost km upstream of Bijnor barrage (Figure 5.10, 5.11). Amount of shift at the marked locations marked in figure 5.11 is approximately 2.5 km (location A), 2 km (location B), 2.5 km (location C), 2.9, 6.6, 3, 2.2 km (location D) and 4.3 km (location E) starting from north respectively. River channel in this part has shown 148
22 tendency of shifting courses towards eastern direction in past few decades and the development of new streams has occurred, as seen in the images of 1972 and This avulsion got triggered because of the monsoon flooding, which gave rise to the bifurcation of main river channels and subsequently thalweg shift towards east occurs. When a river becomes unstable in its existing course, instead of initiating a new channel at a lower level in the flood plain, by the diversion of flow from the channel during an avulsion, a river generally prefers occupation of a pre- existing channel/minor tributary, because a previously existing channel course can better adjust to a sudden influx of water and sediments load provided by the sudden avulsion (Mitra et al., 2005). Thus in this case the eastern direction is at the lower level in the flood plain, as the general slop of the Gangetic plain is towards east and that is the reason the discharge is getting diverted towards eastern direction reviving the palaeo channels present towards east of the older channel. The course of the Ganga river delineated covers very small area near the eastern margin of the topographical maps number 53G. It flows in the south direction. This course was surveyed in As the Ganga river course in these area has shifted towards eastern direction in 2000 and not covering the adjoining topographic map (53 G) the old topographic map surveyed in the requires updating : Changes in the riverbed from 1966 to 2006: Total surface area of the river bed, which includes the surface area of main and secondary river channels, the surface area of sandbars and channel bars, with and with out vegetation cover, with in the selected reach of the upper Gangetic plain in Uttar Pradesh state, has decreased from 1966 to Nov, 2006 (Figure 5.11, Graph 5.1). The decrease in the surface area of river bed indicates the drying of the river bed. This can be because of the decrease in the discharge in the river in this area. It can also be inferred from the reduction in the sand deposition along the river bed, that with the decrease in the 149
23 discharge the denudation decreased along with the reduction of the carrying capacity and the extent of sand deposition. The surface area of the river bed is as high as in 1966 and 183 sq km, as inferred from the image of In 1990 it has decreased up to 141 sq km. Present study shows an abrupt decrease in the area of river bed, which includes the surface area of river channels and sand deposition in the active river bed after In Dec, 2000 the total surface area of the river bed is approximately 168 sq km but it came down to 139 sq km in Nov, In Feb, 2006 images it can be seen that the surface area of the river bed has further decrease and came down to 128 sq km. The post monsoon data of year 2006 shows increase in the surface area of the river bed, which came up to 144 sq km in Nov, Graph 5.1: Total surface area of river bed form 1966 to 2006 The decrease in the total surface area of the river bed of the Ganga river in the present selected reach of the upper Gangetic plain in Uttar Pradesh is sq km 150
24 between 1966 and Nov,2006, thus the average annual rate of decrease in the total surface area of the river bed is approximately 1.07 sq km per year, during the 40 years time span. Thus the river bed in this selected reach has dried up to great extent near Haridwar and further downstream near Bijnor (Figure 5.11). A little downstream of Haridwar (location A, figure 5.11) many of the braided channels are abandoned in year 2006 and only one main river channel is found active. West of Bijnor (location B, figure 5.11) out of the three bifurcated streams, most of the discharge flows through the main river channel towards east and the other tow streams towards west are found dried and detached form the main river channel as found in pre-monsoon image of year The annual average between the period, of which the satellite data was available, were computed, and compared with the yearly average of the total duration of studies i.e. the 40 year (1966 to 2006). Table 5.1: Change in the surface area of riverbed Period Duration Initial surface Final surface area Difference in Annual average (Years) area of riverbed of riverbed the surface between the given (sq km) (sq km) area of the duration riverbed (sq km) between the given duration (sq km) nov (6 years) (18 Years) 2.67 (10 Years) (6 Years) (40 years) Negative sign indicates the decrease in the surface area of the riverbed 151
25 Decadal changes: : Changes in the riverbed between 1966 and 1972: Comparison shows that the annual average between 6 years, i.e to 1972 is only 0.56 sq km per year of decrease in the surface area of the river channel, which is half the yearly average of the total duration of the studies. It can be inferred that there is not much change in terms of the surface area of the river between this period through out the study area. The exception is the stretch upstream of Bijnor (location B, figure 5.11), where the river shows a major change in the morphology, as it splits into two narrow channels from a wide single stream. Thus a gradual decrease in the width of the river channel has occurred and relatively the area of exposed river bed sand has increased during this period. The avulsion and bifurcation of the river channel can be mainly because of the high discharge during the monsoon flooding in years 1967, 1971 and 1972 (Parua, Website browsed on 20/10/2010). The levees were breached by the flood water and discharge routed through the pre-existing palaeo channels. Except the stretch upstream of the Bijnor city the river channel does not show major change in the morphology through out the study area. Whatever changes which have occur in the river bed have been a long term and permanent change and not just the seasonal change because almost the similar morphology is found in the image of year 1990 as well : Changes in the riverbed between 1972 and 1990: The annual average decrease in the surface area of the river bed between the years 1972 and 1990 is found to be 2.33 sq km per year. This value is double the amount of the average yearly decrease in surface are of the river bed through out the span of the study. Thus the rate of decreased in the surface extent of the river bed found during this period exceed the over all rate of decrease found during the study span. This occurred because of the decrease in the extent of the sand deposition in this area. If the discharge decreases the carrying capacity of the river goes down and thus the surface extent of the river bed also decreases eventually. River channel shows the development of braiding near 152
26 A A A A A A A B B B B B B B Figures 5.11: Fluvio-Geomorphological changes in the upper Gangetic plain between 1966 and 03 Nov,
27 Haridwar and downstream (location A, figure 5.11), where the river channel bifurcates in to a network of small intervening streamlets. On the contrary near Bijnor (location B, figure 5.11) the newly developed channel towards east of the older channel as found in 1972 gains significance, as most of the drainage routs through it leaving the older channel ephemeral, thus surface extent of the abandoned channels is also found increased and the river bed area decreased. No significant change occurred during this period of 18 years, i.e. between 1972 and 1990, in the morphology of the river throughout the study area. The reduction in the area of the river bed has been a long term change but the exceeding decrease is not a permanent change, as the monsoon flooding changes the scenario as seen in the satellite data of year : Changes in the riverbed between 1990 and 2000: This 10 years span i.e. between 1990 and 2000, shows a very abrupt and significant change in the river channel, in terms of morphology and in terms of the surface extent as well. During the total span of study the surface area has decreased but during this period of 10 years i.e. between 1990 and 2000, the surface area of the river has increased and the annual average when computed, was found to be as high as 2.67 sq km per year. Its comparison with the yearly average of the decrease in the surface area between the 40 years of study shows that the change during this period is not long term and permanent, but as found in 2004 the surface area of the river bed decreases again thus the changes during this decade can be considered as the short term change. Year 1998 was a major monsoon flooding period and during this period because of the heavy water discharge the river has developed a new channel further towards east of the active channels in 1990, along the stretch upstream of the Bijnor barrage (location B, figure 5.11). During flooding, as a result of the increase in the discharge and carrying capacity of the river, the river bed gets silted up heavily and thus the surface extent of the sand deposition is found high. Abandoned channels have decreased significantly as new streams have revived the ephemeral abandoned channels. Due to the development of new river channel as a result of the avulsion and anabranching, large Islands are developed 154
28 encircled by the anastomosing streams. Now three branches are formed upstream of the Bijnor barrage (location B, figure 5.11) among which the middle branch receive more runoff, which was found developed in 1972 and became main channel in 1990, in comparison to the other two branches. On the contrary near Haridwar (location A, figure 5.11) the number of streamlets have decreased and overall patter of the river is not found changed. Because of the flooding and the short term changes which took place in the morphology of the river, the surface extent of the river bed has increased drastically but the trend does not last long : Changes in the riverbed between 2000 and 2006: This duration of six, between 2000 and 2006, is the period of most marked difference in the morphology as well as the surface area of the river. Surface area of the river bed decreases conspicuously between this duration and the annual average decrease in the study area was found 4.04 sq km per year between this span. This is almost four times higher from the yearly average decrease in the surface area of the river bed between the 40 years span of the study, which is only 1.07 sq km per year. Thus it can be inferred that the change during this period is also abrupt and temporary. Between 2000 and 2004, there is an evident decrease in the area of river bed, which can be because of the decrease in the discharge of the river and many other natural and anthropogenic factors. Pertaining to the low carrying capacity of the river the sand deposition has also decreased significantly. Near Haridwar (location A, figure 5.11) there is no major change in the channel geometry but upstream of Bijnor (location B, figure 5.11) the two older channels towards west got detached form the main river channel and eventually became ephemeral abandoned channels. Thus the area of abandoned channels increased during this period and the area of island decreased because the two channels towards west, out of the three bifurcated branches got cut off from the main channel and the area once occupied by the islands is now the part of flood plain. Thus the most recent river channels, which was found developed in satellite data of year 2000, becomes the main channel because of the thalweg shift as seen found in the data of year
29 Fluvio-geomorphological changes between this period of one and a half year i.e. between the November, 2004 (post-monsoon) and February, 2006 (pre-monsoon) are very striking. Changes between this duration were found similar and at place much more conspicuous when compared to the changes which occurred between 2000 and The surface area of the river bed decreased by sq km between the duration of 1.5 years. The annual average decrease was found to be 7.44 sq km per year, which is once again almost six time more than the yearly average calculated for the total span studies which is 1.07 sq km per year. This indicates that these changes are abrupt and short term changes and this trend does not continue in future as seen in the post monsoon data of year There is marked decrease in the surface area of river channels and sand deposition has decreased evidently. Near Haridwar (location A, figure 5.11) many braided channels are abandoned and only one channel is active in February, Area of islands decreased because the two older channels were left abandoned and ephemeral, upstream of the Bijnor barrage (location B, figure 5.11). Newly developed channel shows almost a straight course for a long stretch upstream of the Bijnor barrage. Seasonal changes: During this period the changes in the river channels is also very conspicuous because there is a large increase in the surface area of the river bed which is as high as sq km, between the duration of just 9 months, i.e. between February, 2006 and November, Near Haridwar and downstream (location A, figure 5.11) the river shows braiding pattern and the channels which were found abandoned in pre-monsoon data of 2006 are activated after the monsoon. Upstream of Bijnor barrage (location B, figure 5.11) the dried and abandoned middle channel is also found active in the post-monsoon data of year 2006, thus islands is formed between two channels and the increase in the area of islands and considerable decrease in the surface area of the abandoned channel is found. As the discharge might have increased, during the monsoon, as compared to the premonsoon data, the siltation along the river channel has also increased and the surface area of the sand deposition has increased. These changes are seasonal changes and the river 156
30 channel may or may not get back to its original form. Between the pre-monsoon season, i.e. in February, 2006 and post-monsoon season, i.e. November, 2006, there has to be some increase in the surface area of the active river bed, because of the monsoon. But the increase is very significant, thus it can be said that effect of other natural and anthropogenic factors might also have played role in bringing change in the river morphology during this time span. One of the reason in the decrease of the surface area of the river bed from December 2000 to February, 2006 can be the decrease in the discharge of the Bhagirathi river, which is considered to be the main branch of the Ganga river, because of the cut off of the water supply for filling up the reservoir of the Tehri dam, which is under construction during this period. Thus the changes between year 2000 and 2006 is a short term changes : Erosion and Aggradation from 1966 to 2006: The aggradational/degradational behavior of the river systems strongly influences the fluvial processes such as channel dynamics and flooding (Sinha, 2005), and the reverse is also true. Erosion along the banks of the river can occur through two different fluvial processes, viz. the entrenchment and the silting up to the new area beyond the banks, which generally happen during monsoon flooding when river breaches its banks to encroach the flood plain area. Some times after the flood recedes, developments of new streams are observed adding up the new areas with in the river bed. On the contrary when the river abandons it bed temporarily or permanently, it aggrades up that area of river bed and eventually that area get a soil and vegetation cover and gets included in the fertile flood plain. This usually happens when the river channels shifts its course leaving the earlier river bed, or in case of the meandering channels large meanders 157
31 A A B B B B B B EROSION AGGRADATION Figures 5.12: Extent of erosion and aggradation in the upper Gangetic plain between 1966 and 03 Nov,
32 Graph 5.2: Surface area of erosion and aggradation Table 5.2: Surface area of Erosion and Aggradation Period Duration Erosion Annual average Aggradation Annual average (Years) (sq km) erosion (sq km) aggradation between the given between the given duration duration (sq km) (sq km) (6 years) (6 years) (18 Years) (18 Years) (10 Years) (10 Years) (6 Years) (6 Years) nov (40 years) (40 years) 159
33 gets cut off from the main stream and even in circumstances when the discharge depletes and the streams does not remain perennial. Between 1966 and Nov, 1972 river eroded almost 70 sq km of area along both the banks, and only 35 sq km area was aggraded, thus river bed seems to have expanded its width all along the course in this selected reach. In Oct, 1990, when compared to Nov, 1972, the river has entrenched just 29 sq km of area while it has alluviated 68 sq km of area along the banks. From Oct, 1990 to Dec, 2000, erosion was higher, about 83 sq km as compared to the gain of order of 19 sq km of land, which is abandoned by the river. This high erosion is due to the development of anastomosing pattern and newly developed channels enclose part of flood plain forming island, hence the area between the banks increased. Between Dec, 2000 and Nov, 2004 there was a hugh increase, upto 89 sq km, in the land which was alluviated and added in to the flood plain and erosion was just 8 sq km. Similarly from Nov, 2004 to Feb, 2006, 37 sq km of land is gained and only 16 sq km of area is eroded along the banks. But from Feb, 2004 to Nov, 2006 river has eroded 40 sq km area and just 3 sq km of land is added in the flood plain, which explains the fact the from February to November river bed has increased width. Total surface area eroded between 1966 and 2006 is sq km, thus annual average is 6.21 sq km per year. Total surface area of aggradation between 1966 and 2006 is sq km, thus the annual average between this span is 6.37 sq km per year. Rate of erosion and aggradation between 1966 and 2006 is almost the same and thus the overall area of the river bed is not much changed between the 40 years time span of study. But when the annual average of the total surface area of erosion and the aggradation between the period, of which the satellite data was available, were computed, it was found that none of them matches the yearly average rate of the total surface area of erosion and the aggradation between the total duration of studies i.e. the 40 year (1966 to 2006) (Graph 5.2, Table 5.2). But between duration and , the yearly average rate of the total surface area of erosion is dominant, especially along the eastern bank, upstream of Bijnor barrage (location B, figure 5.12). Between and the yearly average rate of the total surface area of aggradation is found dominant. 160
34 5.2.5: Palaeo Features and Oscillation Zone: Thus Ganga river shifted from west to east at 2500 years BP, again shifted from east towards west at 1000 Years BP and again shifted from west towards east more recently and from present studies it was found that the river has shifted for 6-7 km towards east between 1966 and In the Yamuna-Ganga interfluvial plain the evidences of the shifting of the Ganga river course, towards east are also available in form of abandoned meandering channels, detached from the main course, palaeo channels, palaeo meander scars, oxbow lakes, and water logging in the low lying, wide flood plains, preserving all the palaeo features furnishing proof of fluvial activity in past. Mostly the palaeo channels are very wide ( m) suggesting their formation by large rivers. Also some of these palaeo channels when extended northwards meet the point where the Yamuna and Ganga rivers debouch from the Siwalik Hills into the plains, indicating that these rivers were active on this unit in the past, which is upland in nature presently (Parkash et al, 2000). From the data of 1970 s decade it was evident that the river in this region in past was flowing west from the present location. Most of the palaeo channels are present in the flood plain towards west of the present river course. River shifted towards east through time and attained present configuration. Even since 1966 up to 2006 the similar trend of the migration is quite perceptible from the present study. The BanGanga was also one of the old courses of the Ganga in the past (before 1910). These old channel courses in the northern portion indicate the lateral eastward shifting of the Ganga. Hence river in this region show the evidences of its eastward lateral shifting, by occupying already available palaeo channels, during last century and the similar trend is also found from the present study between last 40 years. The Upper Ganga plain is product of severe erosion caused by oscillating character of the Ganga, where the river might have had many cycles of such oscillation throughout the 161
35 Figures 5.13: Oscillation zone of the upper Gangetic plain 162
36 development of the present flood plain and the present day landforms of the flood plain are the product of the last cycle of lateral shift from west to east (Das Gupta, 1975). Thus there is a probability for the river course to again shift towards west if triggered by any natural or anthropogenic disturbance causing avulsion of the river course. Hence by integrating the entire available database the oscillation zone formulation has been carried out and it was found that the oscillation zone in this region is wide as compared to the lower Gangetic plain owing to the oscillatory character of the river in the selected area of upper Gangetic plain. As seen in figure 5.13 the river in this reach is prone to oscillate to and fro. If human encroachment occurs in the flood plain area which is now abandoned by the river and if in case the river course once again switches the direction of shifting it can cause loss of life and property. Hence this database prepared should be considered for further development and urban planning. 5.3: Discussion: Observation: In the present selected window of the Upper Gangetic plain, fluvio-geomorphological changes, which took place in last four decades have been studied. Evolutionary pattern of the Ganga river in this region, as discussed in formerly, indicates that the Ganga river in this part has shown tendency of shifting courses towards eastern direction in past few decades and the development of new streams has occurred, as seen in both 1972 and in 2000 satellite images. In present study it was found that, for a stretch of almost km upstream along the river course from the barrage situated west of Bijnor city, the river bed shows a conspicuous shift varying from 5-7 km throughout the stretch. Complete river bed is shifted towards east varying from 5-7 km throughout this stretch. 163
37 Probable causes: Number of natural and anthropogenic factors triggers the shifting of the river channel in this area. One of the causes for shifting of the river in this area is geological and physiographical condition in this region. The Ganga river in the present selected reach in the upper Gangetic plain of Uttar Pradesh debouches in to the plains near Haridwar, after passing through the foot hills of Himalayas. The gradient of the river abruptly changes and thus the river current and the stream strength of the river decrease abruptly. Hence the river deposits a large quantity of sediment load carried by the flow here forming the alluvial fan. The sediments deposited here are coarser in the northern part of the selected reach the boulders, pebbles and gravels are found embedded in the fine matrix of sand and silt. As the river flows downstream it deposits sand and silt along its course downstream of Haridwar and silt up the river bed as well. The formations here are uncompacted and easily tend to erode by the high current of the river here thus river erodes the banks and laterally shifts course forming a wide flood plain. Moreover between Haridwar and Bijnor the river forms braiding pattern because of the high slope conditions as compared to the lower Gangetic plains were the river shows typical meandering owing to the low slope conditions of the terrain. River not only owing to the high slope conditions, develops braiding in this region, the formations formed by the river here are uncompact and coarse. In addition because of the construction of the Bijnor barrage, flow of the river upstream of the barrage is decreased by the barrage and the sediments carried by the river get deposited to further silt up the river valley. This further aggravates the fluvial processes and this in turn can trigger avulsion and anabranching in the river bed. Many workers have stated that the shifting in this region has occurred in response to the tilting of the tectonic blocks, as discussed formerly in the present chapter. In present study a conspicuous shift of almost 5-7 km is found in 40 years, thus this probably can be a direct effect of movements of these tectonic blocks. Thus the minor variation in the slope of the terrain in this area, in response to tectonic activity, can disturb the fragile state of equilibrium and enables the river to breach its banks frequently, erode flood plain and shift laterally. 164
38 But one of the most important factors causing the river shifting in this region is the monsoon flooding, which triggered the avulsion and anabranching in the river course, as seen in the images of 1972 and Abrupt climate change and extreme events pose more of a global change hazard then do the mean climate phenomena predicted by global climate models (Baker, 2004). Upstream of the Bijnor barrage, entire meandering river bed has metamorphosed to braided pattern and the river bed shifted towards east, by development of a new channel, as seen in image of The avulsion and bifurcation of the river channel can be mainly because of the high discharge during the monsoon flooding in years 1967, 1971 and Similarly in 2000 data also development of new channels further towards east is found to have occurred. Year 1998 was a major monsoon flooding period and during this period because of the heavy water discharge the river has developed a new channel further towards east of the active channels in 1990, along the stretch upstream of the Bijnor barrage. The levees were breached by the flood water and discharge routed through the pre-existing palaeo channels. More over when a river becomes unstable in its existing course, instead of initiating a new channel at a lower level in the flood plain, by the diversion of flow from the channel during an avulsion, a river generally prefers occupation of a pre- existing channel/minor tributary, because a previously existing channel course can better adjust to a sudden influx of water and sediments load provided by the sudden avulsion (Mitra et al., 2005). Thus in this case the eastern direction is at the lower level in the flood plain, as the general slope of the Gangetic plain is towards east and that is the reason the discharge is getting diverted towards eastern direction. The river in this region show the evidences of eastward lateral shifting, by occupying already available palaeo channels formed during last century. Observation: Another most striking phenomenon observed from this study is the reduction in the width and the surface area of the river between 2000 and 2006, which is because of the drying of the river. The decrease in the total surface area of the river bed of the Ganga 165
39 river in the present selected reach of the upper Gangetic plain in Uttar Pradesh is sq km between 1966 and Nov,2006, thus the average annual rate of decrease in the total surface area of the river bed is approximately 1.07 sq km per year, during the 40 years time span. Surface area of the river bed decreases conspicuously between 2000 and 2006 and the annual average decrease in the study area was found 4.04 sq km per year between this span. This is almost four times higher from the yearly average decrease in the surface area of the river bed between the 40 years span of the study, which is only 1.07 sq km per year. Probable causes: The construction of the Tehri dam, located near Tehri village in the state of Uttarakhand in India, has also affected the river (figure 5.14). The main dam of the project is built near the old Tehri town that lies at the confluence of the rivers Bhagirathi, (one of the major tributary of the river Ganga) and Bhilangana. The dam project was approved in 1972 and construction was started in Two of the lower tunnels, T3 and T4, were closed way back in Dec, The tunnel T2 of Tehri dam has been finally closed on 29th Oct, 2005 and thereby started the process of filling the massive reservoir (figure 5.15). But closing of tunnel T2 has resulted in reduced supply of Bhagirathi water to a mere 2 ft³/s from the normal 1000 ft³/s. According to Hindu mythology, river Bhagirathi is the actual Ganga, though the name of Ganga is assumed only after the river Bhagirathi meets river Alaknanda at Devprayag. Cutting off the water supply of Bhagirathi to such low quantity means that after travelling more than 80 km from this point, water of Bhagirathi will be hardly reaching Ganga. The filling of the dam continued and the project generated its first unit of electricity in June, Width of the river bed decreased significantly along with the decrease in the discharge of the Ganga river. Thus one of the reasons for reduction in the surface area of the river bed is the cutoff of the supply of the Bhagirathi river water after the commencement of the construction of Tehri dam in 1978 and especially after 2001 when the filling of the reservoir started, up to Premonsoon season of 2006 as the reservoir 166
40 Figure 5.14: Location of the Tehri dam on the IRS image of
41 Figure 5.15: Reservoir filling during the construction of Tehri dam from 1972 to
42 of the Tehri dam was being filled. The cutoff of the water supply of the Bhagirathi river during the construction of the Tehri dam, especially after 2001 has affected the Ganga river downstream also. The extent of river bed is 2006 is low as compared to its extent in Moreover, At Haridwar, the barrage diverts much of the discharge into the Upper Ganges Canal, built in 1854 to irrigate the surrounding land. This caused decrease in the discharge of the Ganga. Most of the discharge has decreased and in turn the width and the river bed area have reduced remarkably. Observation: Total surface area eroded between 1966 and 2006 is sq km, thus annual average is 6.21 sq km per year. Total surface area of aggradation between 1966 and 2006 is sq km, thus the annual average between this span is 6.37 sq km per year. Rate of erosion and aggradation between 1966 and 2006 is almost the same and thus the overall area of the river bed is not much changed between the 40 years time span of study. But when the rate of total surface area of erosion and aggradation for different decades were studied, it was found that the river in this region shows the cyclic behavior (Graph 5.2, Table 5.2). Probable causes: The Ganga river in the present selected reach in the upper Gangetic plain of Uttar Pradesh debouches in to the plains near Haridwar, after passing through the foot hills of Himalayas. The gradient of the river abruptly changes and thus the river current and the stream strength of the river decrease abruptly. Thus the aggradation is dominant in this region, as the river enters the alluvial plain of the Uttar Pradesh. During the first decade which was studied, i.e , the erosion is dominant, especially towards eastern bank. This is because of the development of the new stream as seen in the satellite data of 1972, towards the east of the older channel, upstream of the Bijnor barrage. The development of new channels occurred by reviving the palaeo channels present in the flood plain towards east, caused erosion of new land by these river channel in this area. 169
43 Between 1972 and 1990, the aggradation is dominant, which seems to be the normal trend, because the river in this region tends to aggrade up the land forming the alluvial fan. Once from , erosion was found dominant because of the development of the second channel, in turn eroding new areas, towards further east as seen in image of Between 2000 and 2006 the aggradation is more along the western bank of the river upstream of Bijnor barrage and also downstream of Haridwar. This change is also short term because the overall rate of erosion and aggradation is almost the same during 40 years of study span, which suggest that there is negligible change in the surface area of the river bed. But the drastic and short term changes in the rate of erosion and aggradation during different decades is because of the shifting of the main river channel and development of new channels. 170
Earth Science. River Systems and Landforms GEOGRAPHY 1710. The Hydrologic Cycle. Introduction. Running Water. Chapter 14.
 Earth Science GEOGRAPHY 1710 River Systems and Landforms DAVID R. SALLEE Robert W. Christopherson Charlie Thomsen Chapter 14 Introduction Rivers and streams are dynamic systems that continually adjust
Floodplain Connectivity in Restoration Design
 Floodplain Connectivity in Restoration Design 2015 Symposium on Restoration in a Contaminated Environment: Lessons Learned and Challenges in Moving Forward Part II April 2015 Karin Boyd Applied Geomorphology,
Neversink River East Branch
 Neversink River East Branch Management Unit 10 Summary of Post-Flood Recommendations Intervention Level Full restoration of the stream reach including the eroding bank site between Station 38380 and Station
CHAPTER - VI FLOOD DAMAGES
 CHAPTER - VI FLOOD DAMAGES 6.1 General Generally flood is defined as an unusually high stage in a river normally the level at which the river overflows its banks and inundates the adjoining area. In other
Course Plan Day 1: Introduction and Overview Hydrology & Fluvial Geomorphology Day 2: Fieldwork on the Braid Burn Alan Jones
 Course Plan Day 1: Introduction and Overview Hydrology & Fluvial Geomorphology Alan Jones E:mail: [email protected] Water cycle Globally & Locally River shapes and forms River behaviour Closer look at
GLOSSARY OF TERMS CHAPTER 11 WORD DEFINITION SOURCE. Leopold
 CHAPTER 11 GLOSSARY OF TERMS Active Channel The channel that contains the discharge Leopold where channel maintenance is most effective, sediment are actively transported and deposited, and that are capable
Stream Rehabilitation Concepts, Guidelines and Examples. Objectives. Pierre Y. Julien. Three Laws of Stream Restoration
 Stream Rehabilitation Concepts, Guidelines and Examples Pierre Y. Julien Wuhan 2005 Objectives Part I - Stream restoration and rehabilitation: 1. Present and discuss important concepts, laws, criteria
WEATHERING, EROSION, AND DEPOSITION PRACTICE TEST. Which graph best shows the relative stream velocities across the stream from A to B?
 NAME DATE WEATHERING, EROSION, AND DEPOSITION PRACTICE TEST 1. The diagram below shows a meandering stream. Measurements of stream velocity were taken along straight line AB. Which graph best shows the
How Did These Ocean Features and Continental Margins Form?
 298 10.14 INVESTIGATION How Did These Ocean Features and Continental Margins Form? The terrain below contains various features on the seafloor, as well as parts of three continents. Some general observations
Basic Principles of Channel Design
 United States Department of Agriculture Natural Resources Conservation Service Stream Restoration Design Chapter 7 Basic Principles of Channel Design Issued August 2007 Cover photo: Where modification
Deliverable 2.1: Multi-scale framework and indicators of hydromorphological processes and forms
 4 DELINEATION OF SPATIAL UNITS. 4.1 Regional Context: At this scale, no delineation is strictly necessary, since most catchments will fall within a single biogeographic region (various regionalisations
A disaster occurs at the point of contact between social activities and a natural phenomenon of unusual scale.
 Hazard Mapping and Vulnerability Assessment Mr. Toshiaki Udono Senior Project Manager, Kansai Division, PASCO Corporation, Japan Mr. Awadh Kishor Sah Project Manager, Project Implementation Department,
Deserts, Wind Erosion and Deposition
 Deserts, Wind Erosion and Deposition By definition, a desert has less than 10 in (25 cm) of precipitation per year. Deserts occur at 30 o and 60 o in regions of descending air. Deserts can be hot or cold.
Prattsville Berm Removal Project. 1.0 Project Location
 Prattsville Berm Removal Project 1.0 Project Location The project site is located between the New York State Route 23 Bridge over the Schoharie Creek and the Schoharie Reservoir. The restoration plan encompassed
Flash Flood Science. Chapter 2. What Is in This Chapter? Flash Flood Processes
 Chapter 2 Flash Flood Science A flash flood is generally defined as a rapid onset flood of short duration with a relatively high peak discharge (World Meteorological Organization). The American Meteorological
Remote Sensing and GIS Application In Change Detection Study In Urban Zone Using Multi Temporal Satellite
 Remote Sensing and GIS Application In Change Detection Study In Urban Zone Using Multi Temporal Satellite R.Manonmani, G.Mary Divya Suganya Institute of Remote Sensing, Anna University, Chennai 600 025
WILLOCHRA BASIN GROUNDWATER STATUS REPORT 2009-10
 WILLOCHRA BASIN GROUNDWATER STATUS REPORT 2009-10 SUMMARY 2009-10 The Willochra Basin is situated in the southern Flinders Ranges in the Mid-North of South Australia, approximately 50 km east of Port Augusta
Watershed Works Manual
 National Rural Employment Guarantee Act Watershed Works Manual DRAINAGE LINE TREATMENT: GABION STRUCTURE Baba Amte Centre for People s Empowerment Samaj Pragati Sahayog September 2006 Drainage Line Treatment:
General Permit for Activities Promoting Waterway - Floodplain Connectivity [working title]
![General Permit for Activities Promoting Waterway - Floodplain Connectivity [working title]](/thumbs/39/18645965.jpg "General Permit for Activities Promoting Waterway - Floodplain Connectivity [working title]") General Permit for Activities Promoting Waterway - Floodplain Connectivity [working title] Purpose These rules set forth the conditions under which a person may, without an individual removal-fill permit
General Permit for Activities Promoting Waterway - Floodplain Connectivity [working title] Purpose These rules set forth the conditions under which a person may, without an individual removal-fill permit
Impact of water harvesting dam on the Wadi s morphology using digital elevation model Study case: Wadi Al-kanger, Sudan
 Impact of water harvesting dam on the Wadi s morphology using digital elevation model Study case: Wadi Al-kanger, Sudan H. S. M. Hilmi 1, M.Y. Mohamed 2, E. S. Ganawa 3 1 Faculty of agriculture, Alzaiem
CHAPTER 3A Environmental Guidelines for STREAM CROSSING BY ALL-TERRAIN VEHICLES
 GOVERNMENT OF NEWFOUNDLAND AND LABRADOR DEPARTMENT OF ENVIRONMENT AND LABOUR CHAPTER 3A Environmental Guidelines for STREAM CROSSING BY ALL-TERRAIN VEHICLES WATER RESOURCES MANAGEMENT DIVISION Water Investigations
How To Check For Scour At A Bridge
 Case Studies Bridge Scour Inspection and Repair Edward P. Foltyn, P.E. Senior Hydraulic Engineer ODOT Bridge Unit 2013 PNW Bridge Inspectors Conference April 2013 REFERENCES Stream Stability at Highway
GY301 Geomorphology Fluvial Erosion Landforms
 Introduction Running water is by far the most important erosional agent on Earth. Even in arid climates, it is the primary agent of erosion. This is evident from the abundance of stream beds found throughout
The correct answers are given below. Some talking points have been added for the teachers use.
 Natural Resources Canada 2011: Lesson Plan Grades 11 and 12 Landslide activity 5b: Landslides in Canada quiz Description: This is an independent study activity for grades 11 and 12. Students will read
Module 3. Irrigation Engineering Principles. Version 2 CE IIT, Kharagpur
 Module 3 Irrigation Engineering Principles Lesson 9 Regulating Structures for Canal Flows Instructional objectives On completion of this lesson, the student shall be able to learn: 1. The necessity of
FLOOD PLAIN DESIGNATION AND PROTECTION
 CITY OF RICHMOND FLOOD PLAIN DESIGNATION AND PROTECTION BYLAW NO. 8204 EFFECTIVE DATE - SEPTEMBER 8, 2008 CONSOLIDATED FOR CONVENIENCE ONLY This is a consolidation of the bylaws listed below. The amendment
Basic Soil Erosion and Types
 Basic Soil Erosion and Types 2015 Wisconsin Lakes Convention Stacy Dehne DATCP Engineer Types of Soil Erosion Rain drop or splash erosion: Erosion preceded by the destruction of the crumb structure due
Land Disturbance, Erosion Control and Stormwater Management Checklist. Walworth County Land Conservation Department
 Land Disturbance, Erosion Control and Stormwater Management Checklist Walworth County Land Conservation Department The following checklist is designed to assist the applicant in complying with the Walworth
Flood Hazard Area Technical Manual Section 8 Bank Stabilization and Stream Restoration
 Flood Hazard Area Technical Manual Section 8 Bank Stabilization and Stream Restoration Prepared by: New Jersey Section American Water Resources Association Stream Restoration Committee FHA Subcommittee
Catchment Scale Processes and River Restoration. Dr Jenny Mant [email protected]. The River Restoration Centre therrc.co.uk
 Catchment Scale Processes and River Restoration Dr Jenny Mant [email protected] The River Restoration Centre therrc.co.uk 3 Main Catchment Elements Hydrology Energy associated with the flow of water affects
FLOOD PROTECTION BENEFITS
 IV. (340 points) Flood Protection Benefits A. Existing and potential urban development in the floodplain (50) 1. Describe the existing and potential urban development at the site and the nature of the
Using Remotely Sensed Data From ASTER to Look Impact of Recent Earth Quakes in Gujarat, India.
 Using Remotely Sensed Data From ASTER to Look Impact of Recent Earth Quakes in Gujarat, India. A major earth quake occurred in Gujarat, India on January 26,2000. (Origin time 03:16 GMT, Location 23.399N
Using LIDAR to monitor beach changes: Goochs Beach, Kennebunk, Maine
 Geologic Site of the Month February, 2010 Using LIDAR to monitor beach changes: Goochs Beach, Kennebunk, Maine 43 o 20 51.31 N, 70 o 28 54.18 W Text by Peter Slovinsky, Department of Agriculture, Conservation
A CASE-STUDY OF CUA_DAT CFRD IN VIETNAM
 A CASE-STUDY OF CUA_DAT CFRD IN VIETNAM Giang Pham Hong, Michel Hotakhanh, Nga Pham Hong, Hoai Nam Nguyen, Abstract:Dams have been taken an important role in time and surface redistribution of water for
Simulating Sedimentation Model in Balarood Dam Reservoir Using CCHE2D Software
 Bulletin of Environment, Pharmacology and Life Sciences Bull. Env. Pharmacol. Life Sci., Vol 4 [1] December 2014: 67-72 2014 Academy for Environment and Life Sciences, India Online ISSN 2277-1808 Journal
Chapter 7 Earthquake Hazards Practice Exam and Study Guide
 Chapter 7 Earthquake Hazards Practice Exam and Study Guide 1. Select from the following list, all of the factors that affect the intensity of ground shaking. a. The magnitude of the earthquake b. Rather
All sediments have a source or provenance, a place or number of places of origin where they were produced.
 Sedimentary Rocks, Processes, and Environments Sediments are loose grains and chemical residues of earth materials, which include things such as rock fragments, mineral grains, part of plants or animals,
Definition of Tower from the Bradley County Zoning Resolution
 Definition of Tower from the Bradley County Zoning Resolution 43. TOWER. Any outdoor structure designed and constructed to support one (1) or more transmitting or receiving devices for telephone, radio
WATER RESOURCES ENGINEERING DESIGN LANDSCAPE ECOLOGY AND RIVER RESTORATION. www.sindlar.eu
 Geomorphological processes of watercourse development, system of typology and application of the results in practice Part 01 Analysis of geomorphological processes in watercourses Part 02 Applications
BRIDGES ARE relatively expensive but often are
 Chapter 10 Bridges Chapter 10 Bridges Bridg Bridges -- usually the best, but most expensive drainage crossing structure. Protect bridges against scour. BRIDGES ARE relatively expensive but often are the
Description of Simandou Archaeological Potential Model. 13A.1 Overview
 13A Description of Simandou Archaeological Potential Model 13A.1 Overview The most accurate and reliable way of establishing archaeological baseline conditions in an area is by conventional methods of
Appendix C. Project Opportunities. Middle Twisp River (RM 7.8 18.12)
") Appendix C Project Opportunities Middle Twisp River (RM 7.8 18.12) This table describes project opportunities by project area. Locator maps of the project opportunities are included below the table. Reach
Appendix C Project Opportunities Middle Twisp River (RM 7.8 18.12) This table describes project opportunities by project area. Locator maps of the project opportunities are included below the table. Reach
Preliminary damage survey report on 2015 Nepal Gorkha Earthquake
 Tokyo, 13 May 2015 Preliminary damage survey report on 2015 Nepal Gorkha Earthquake Pokhrel R.M., Chiaro G., Kiyota T., Katagiri T. Institute of Industrial Science, University of Tokyo, Japan Goda K. Bristol
Chapter 3 CULVERTS. Description. Importance to Maintenance & Water Quality. Culvert Profile
 Chapter 3 CULVERTS Description A culvert is a closed conduit used to convey water from one area to another, usually from one side of a road to the other side. Importance to Maintenance & Water Quality
PRSENTATION ON DRAINAGE SYSTEM DELHI 25.07.2014 EAST DELHI MUNICIPAL CORPORATION
 PRSENTATION ON DRAINAGE SYSTEM OF DELHI EAST DELHI MUNICIPAL CORPORATION 25.07.2014 MAP OF DELHI SHOWING MCD s, NDMC & DCB ABOUT DELHI DELHI MANIFESTS UNCONTROLLED URBANISATION POPULATION INDUSTRIALISATION
Plate Tectonics. Introduction. Boundaries between crustal plates
 Plate Tectonics KEY WORDS: continental drift, seafloor spreading, plate tectonics, mid ocean ridge (MOR) system, spreading center, rise, divergent plate boundary, subduction zone, convergent plate boundary,
Plate Tectonics. Hi, I am Zed and I am going to take you on a trip learning about Plate Tectonics. And I am Buddy Zed s mascot
 Plate Tectonics Hi, I am Zed and I am going to take you on a trip learning about Plate Tectonics And I am Buddy Zed s mascot Continental Drift Alfred Wegener proposed that continents were not always where
Sand and Silt Removal from Salmonid Streams
 Sand and Silt Removal from Salmonid Streams Stream bank erosion Poor land use practices Sources of Sand and Silt Impacts of Sand and Silt Interstitial spaces infilled Little or no flow through the streambed
Chapter Overview. Bathymetry. Measuring Bathymetry. Echo Sounding Record. Measuring Bathymetry. CHAPTER 3 Marine Provinces
 Chapter Overview CHAPTER 3 Marine Provinces The study of bathymetry charts ocean depths and ocean floor topography. Echo sounding and satellites are efficient bathymetric tools. Most ocean floor features
A. Flood Management in Nevada
 Nevada Division of Water Planning A. Flood Management in Nevada Introduction Flooding has been a concern for Nevada communities since the first settlers moved to the territory in the mid-1800 s. Fourteen
BLACK/HARMONY/FAREWELL CREEK WATERSHED EXISTING CONDITIONS REPORT CHAPTER 12 - STORMWATER MANAGEMENT
 Harmony Creek subwatershed Harmony Creek subwatershed BLACK/HARMONY/FAREWELL CREEK WATERSHED EXISTING CONDITIONS REPORT CHAPTER 12 - STORMWATER MANAGEMENT April 2011 TABLE OF CONTENTS 1.0 INTRODUCTION...
5.14 Floodplains and Drainage/Hydrology
 I-70 East Final EIS 5.14 Floodplains and Drainage/Hydrology 5.14 Floodplains and Drainage/Hydrology This section discusses floodplain and drainage/hydrology resources and explains why they are important
Outlet stabilization structure
 Overview of Sedimentation and Erosion Control Practices Practice no. 6.41 Outlet stabilization structure Erosion at the outlet of channels, culverts, and other structures is common, and can cause structural
Environmental Case Study Decatur, Georgia, DeKalb County A Suburban Creek Resists Channelization
 Introduction A visual examination of Doolittle Creek in a highly developed suburban county in Georgia yielded telltale signs of a creek whose original streambed had been altered. Examination of official
UNDER DRAINAGE AND FILTER DESIGN
 UNDER DRAINAGE AND FILTER DESIGN Tailings and HLP Workshop 28 April to 1 May 2010 INTRODUCTION The internal drainage is of crucial importance to the reliability and safety of a tailings dam throughout
The Alternatives of Flood Mitigation in The Downstream Area of Mun River Basin
 The Alternatives of Flood Mitigation in The Downstream Area of Mun River Basin Dr.Phattaporn Mekpruksawong 1, Thana Suwattana 2 and Narong Meepayoong 3 1 Senior Civil Engineer, Office of Project Management,
Addendum D. Nomination of Moody Wash ACEC
 Addendum D Nomination of Moody Wash ACEC Moody Wash ACEC is hereby nominated by Citizens for Dixie s Future to: BLM St. George Field Office 345 East Riverside Drive St. George, UT 84790 Moody Wash is a
Geol 101: Physical Geology PAST EXAM QUESTIONS LECTURE 4: PLATE TECTONICS II
 Geol 101: Physical Geology PAST EXAM QUESTIONS LECTURE 4: PLATE TECTONICS II 4. Which of the following statements about paleomagnetism at spreading ridges is FALSE? A. there is a clear pattern of paleomagnetic
WEATHERING, EROSION, and DEPOSITION REVIEW
 WEATHERING, EROSION, and DEPOSITION REVIEW Weathering: The breaking up of rock from large particles to smaller particles. a) This Increases surface area of the rock which speeds the rate of chemical weathering.
Climate Change Impacts in the Asia/Pacific Region
 Climate Change Impacts in the Asia/Pacific Region Global CC threat CC in the A/P region The Stern Review and IPCC 4 th Assessment Report both state that climate change will have adverse impact on people
EFFECTS OF ARUNDO DONAX ON RIVER HYDRAULICS, SEDIMENT TRANSPORT, AND GEOMORPHOLOGY, SANTA MARGARITA RIVER, CALIFORNIA
 EFFECTS OF ARUNDO DONAX ON RIVER HYDRAULICS, SEDIMENT TRANSPORT, AND GEOMORPHOLOGY, SANTA MARGARITA RIVER, CALIFORNIA René Leclerc Geomorphologist Robert C. MacArthur, Ph.D., P.E. Principal Headwaters
1.7.0 Floodplain Modification Criteria
 1.7.0 Floodplain Modification Criteria 1.7.1 Introduction These guidelines set out standards for evaluating and processing proposed modifications of the 100- year floodplain with the following objectives:
The Basics of Chapter 105 Waterways and Wetlands Permitting in PA
 The Basics of Chapter 105 Waterways and Wetlands Permitting in PA April 17, 2013 Goal To develop a basic understanding of PA Department of Environmental Protection (DEP) and US Army Corps of Engineers
not to be republished NCERT MAJOR LANDFORMS OF THE EARTH
 6 You must have seen some of the landform features as shown in the Figure 6.1 below. You will notice that the surface of the earth is not the same everywhere. The earth has an infinite variety of landforms.
Flood Zone Investigation by using Satellite and Aerial Imagery
 Flood Zone Investigation by using Satellite and Aerial Imagery Younes Daneshbod Islamic Azad University-Arsanjan branch Daneshgah Boulevard, Islamid Azad University, Arsnjan, Iran Email: [email protected]
Types of flood risk. What is flash flooding? 3/16/2010. GG22A: GEOSPHERE & HYDROSPHERE Hydrology. Main types of climatically influenced flooding:
 GG22A: GEOSPHERE & HYDROSPHERE Hydrology Types of flood risk Main types of climatically influenced flooding: 1. Flash (rapid-onset) 2. Lowland (slow-rise) 3. Coastal (not covered here) But! Causal factors
LEARNING THE LANDFORMS Grade Level: Third Presented by: Elizabeth Turcott, Endeavor Charter Academy, Springfield, Michigan Length of Unit: 14 lessons
 LEARNING THE LANDFORMS Grade Level: Third Presented by: Elizabeth Turcott, Endeavor Charter Academy, Springfield, Michigan Length of Unit: 14 lessons I. ABSTRACT This unit develops an understanding of
1. Incredible India. Shade the map on the next page, to show India s relief. The correct shading is shown on the final page! Incredible India India
 1. Incredible India Shade the map on the next page, to show India s relief. The correct shading is shown on the final page! Incredible India India The DCSF supported Action plan for Geography is delivered
1 Introduction. 1.1 Key objective. 1.2 Why the South Esk
 1 Introduction 1.1 Key objective The aim of this study is to identify and assess possible options for improving the quality of the river channel and habitats in the River South Esk catchment whilst helping
Evaluation of Open Channel Flow Equations. Introduction :
 Evaluation of Open Channel Flow Equations Introduction : Most common hydraulic equations for open channels relate the section averaged mean velocity (V) to hydraulic radius (R) and hydraulic gradient (S).
Various options are discussed below.these low cost, low impact interventions can also be applied as general erosion control methods.
 Week 10 River Hydraulics Rehabilitating Urban Waterways (From http://hubpages.com/hub/river-bank-erosion-control-methods) See also the resources placed on Moodle. Water channels should be viewed as a resource
Plate Tectonics: Ridges, Transform Faults and Subduction Zones
 Plate Tectonics: Ridges, Transform Faults and Subduction Zones Goals of this exercise: 1. review the major physiographic features of the ocean basins 2. investigate the creation of oceanic crust at mid-ocean
Groundwater Flooding: a UK Perspective
 Groundwater Flooding: a UK Perspective David Macdonald British Geological Survey Maclean Building Crowmarsh Gifford Wallingford OX10 8BB Tel 01491 838800 NERC All rights reserved Talk outline Definition
Igneous rocks formed when hot molten material (magma) cools and hardens (crystallizes).
 cools and hardens (crystallizes).") Objectives You will learn about how the land of North Dakota was formed. Introduction North Dakota is a wonderful place to live. Have you ever though about how it was formed? To answer that question, you
Objectives You will learn about how the land of North Dakota was formed. Introduction North Dakota is a wonderful place to live. Have you ever though about how it was formed? To answer that question, you
Ride the Rock Cycle. Suggested Goals: Students will gain an understanding of how a rock can move through the different stages of the rock cycle.
 Illinois State Museum Geology Online http://geologyonline.museum.state.il.us Ride the Rock Cycle Grade Level: 5 6 Purpose: To teach students that the rock cycle, like the water cycle, has various stages
London Borough of Waltham Forest LOCAL FLOOD RISK MANAGEMENT STRATEGY. Summary Document
 LOCAL FLOOD RISK MANAGEMENT STRATEGY Summary Document October 2013 Local Flood Risk Management Strategy Summary 1 Introduction 2 Partner responsibilities 3 What do we know about flooding in the borough?
Lower Raritan Watershed Management Area Stormwater & Flooding Subcommittee Strategy Worksheet LRSW-S3C1
 Strategy Name: Reduce Existing Potential for Flood Damages LRSW-S3C1. Develop and implement a program to: Minimize flood damages through the use of structural measures. Minimize flood damages through the
Ground Water in the Piedmont and Blue Ridge Provinces of North Carolina
 Ground Water in the Piedmont and Blue Ridge Provinces of North Carolina Prepared by: R.L. Huffman Extension Agricultural Engineering Specialist Published by: North Carolina Cooperative Extension Service
Advice For the multiple-choice questions, completely fill in the circle alongside the appropriate answer(s).
.") SPECIMEN ASSESSMENT MATERIAL GCSE GEOGRAPHY Paper 1 Living with the physical environment Specimen Materials For this paper you must have: a pencil a ruler. Time allowed: 1 hour 30 minutes Instructions
SPECIMEN ASSESSMENT MATERIAL GCSE GEOGRAPHY Paper 1 Living with the physical environment Specimen Materials For this paper you must have: a pencil a ruler. Time allowed: 1 hour 30 minutes Instructions
Geography. Geography B. Curriculum Planner GCSE 2012. Version 1 October 2012
 Geography GCSE 2012 Geography B Curriculum Planner Version 1 October 2012 www.ocr.org.uk/gcse2012 INTRODUCTION This plan is not deemed to be prescriptive, it is one suggested route through the specification.
SUSTAINABLE URBAN DRAINAGE SYSTEMS
 overflow can lead into a permeable conveyance system to increase further the benefit and reduce the need for pipe systems. Pollutant removal rates have been shown to be high, with some pollutants being
Chapter 18 Introduction to. A f r i c a
 Chapter 18 Introduction to A f r i c a Ch. 18:1 Landforms & Resources 1. Africa s shape & landforms are the result of its location in the southern part of the ancient supercontinent of. Pangaea Over thousands
CHAPTER 2 HYDRAULICS OF SEWERS
 CHAPTER 2 HYDRAULICS OF SEWERS SANITARY SEWERS The hydraulic design procedure for sewers requires: 1. Determination of Sewer System Type 2. Determination of Design Flow 3. Selection of Pipe Size 4. Determination
Sedimentary Rocks Practice Questions and Answers Revised September 2007
 Sedimentary Rocks Practice Questions and Answers Revised September 2007 1. Clastic sedimentary rocks are composed of and derived from pre-existing material. 2. What is physical weathering? 3. What is chemical
Gold Ray Dam Interagency Technical Team Meeting
 Gold Ray Dam Interagency Technical Team Meeting Agenda Public Outreach, Funding, Monitoring EA/BA/Permit Updates Deconstruction Plans Fish Passage & Salvage Plan Hydraulic Modeling Next Steps Public Outreach,
STORMWATER MANAGEMENT CHECKLIST
 STORMWATER MANAGEMENT CHECKLIST *This checklist must be completed and part of the Land Disturbing Permit submittal for review if the acreage disturbed is one (1) acre or more: I. SUPPORTING DATA Narrative
CHAPTER 9 CONCLUSIONS AND RECOMMENDED MITIGATION
 CHAPTER 9 CONCLUSIONS AND RECOMMENDED MITIGATION 9.1 Conclusions Based on the stability cross-sections down the SE flank of Snodgrass Mountain, most landslides on low- to moderate-gradient slopes have
Climate change impacts on city of Gdansk and its vicinity (Vistula Delta, Poland)
") Final International ASTRA Conference Espoo, 10-11 December, 2007 Climate change impacts on city of Gdansk and its vicinity (Vistula Delta, Poland) Dorota Kaulbarsz, Zbigniew Kordalski, Wojciech Jeglinski
Final International ASTRA Conference Espoo, 10-11 December, 2007 Climate change impacts on city of Gdansk and its vicinity (Vistula Delta, Poland) Dorota Kaulbarsz, Zbigniew Kordalski, Wojciech Jeglinski
Module 1. Principles of Water Resources Engineering. Version 2 CE IIT, Kharagpur
 Module 1 Principles of Water Resources Engineering Lesson 2 Concepts for Planning Water Resources Development Instructional Objectives On completion of this lesson, the student shall be able to know: 1.
DOÑA ANA COUNTY DESIGN STORM CRITERIA GUIDELINES FOR COMMERCIAL AND RESIDENTIAL SITES. Run-off Analysis Methods
 DOÑA ANA COUNTY DESIGN STORM CRITERIA GUIDELINES FOR COMMERCIAL AND RESIDENTIAL SITES Run-off Analysis Methods This document sets forth the minimum design, technical criteria and specifications for the
Addendum. Use Attainability Analysis for Site Specific Selenium Criteria: Alkali Creek. February 23, 2009
 Addendum Use Attainability Analysis for Site Specific Selenium Criteria: Alkali Creek February 23, 2009 Prepared by MWH Americas, Inc. Prepared for EnCana Oil and Gas (USA) Inc. Page 2 Responses to Comments
THE AINSA BASIN: - A FIELD TRIP
 : - A FIELD TRIP Tom Erik Maast and Lars-Christian Røsberg Universitetet i Oslo, Institutt for geofag. Desember 2006 ABSTRACT The Ainsa Basin is a piggy-back basin part of the south Pyrenean Gavarine thrust
Risk Analysis, GIS and Arc Schematics: California Delta Levees
 Page 1 of 7 Author: David T. Hansen Risk Analysis, GIS and Arc Schematics: California Delta Levees Presented by David T. Hansen at the ESRI User Conference, 2008, San Diego California, August 6, 2008 Abstract
Tailings Management at Porgera
 Tailings Management at Porgera The Porgera mine operates under a comprehensive permit issued by the Government of Papua New Guinea (PNG). Under this permit, the Porgera Joint Venture (PJV) is required