Principal Component Analysis
|
|
|
- Tyrone Potter
- 7 years ago
- Views:
Transcription
1 Principal Component Analysis

2 Principle Component Analysis: A statistical technique used to examine the interrelations among a set of variables in order to identify the underlying structure of those variables. Also called factor analysis. It is a non-parametric analysis and the answer is unique and independent of any hypothesis about data distribution. These two properties can be regarded as weaknesses as well as strengths. Since the technique is non-parametric, no prior knowledge can be incorporated. PCA data reduction often incurs a loss of information.

3 The assumptions of PCA: 1. Linearity Assumes the data set to be linear combinations of the variables. 2. The importance of mean and covariance There is no guarantee that the directions of maximum variance will contain good features for discrimination. 3. That large variances have important dynamics Assumes that components with larger variance correspond to interesting dynamics and lower ones correspond to noise.

4 Where regression determines a line of best fit to a data set, factor analysis determines several orthogonal lines of best fit to the data set. Orthogonal: meaning at right angles. Actually the lines are perpendicular to each other in n-dimensional space.

5 n-dimensional Space: the variable sample space. There are as many dimensions as there are variables, so in a data set with 4 variables the sample space is 4-dimensional.

6

7

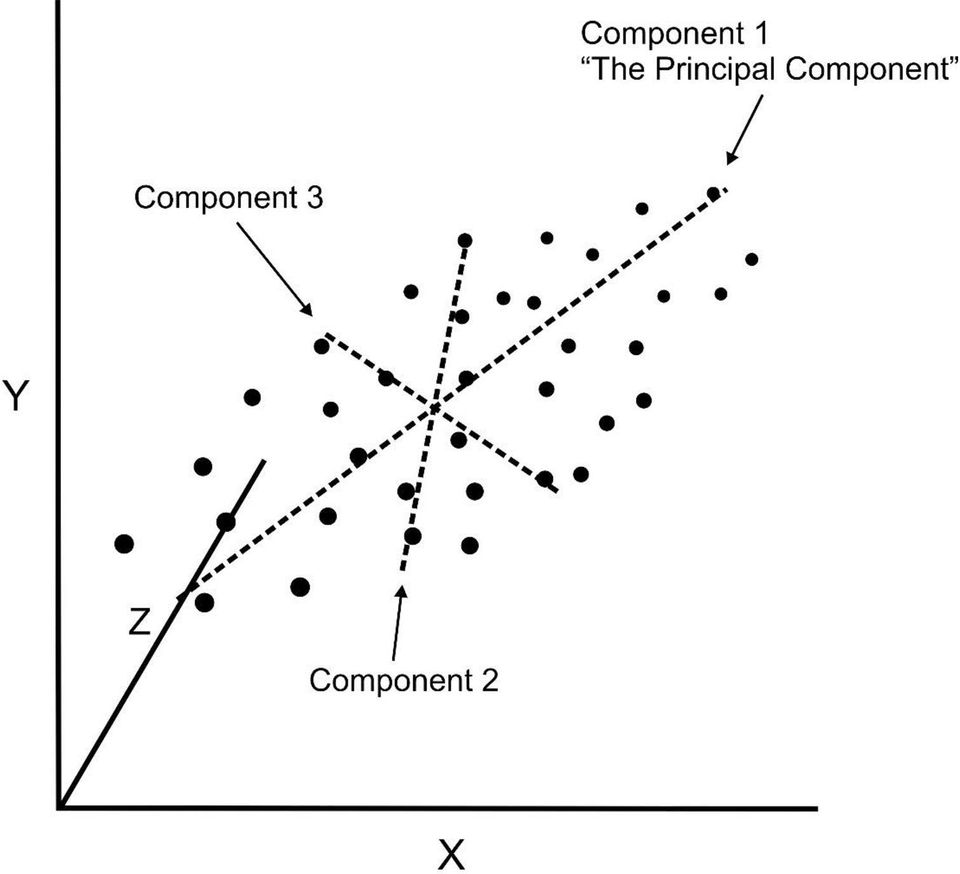
8 Components: a linear transformation that chooses a variable system for the data set such that the greatest variance of the data set comes to lie on the first axis (then called the principal component), the second greatest variance on the second axis, and so on... Note that components are uncorrelated, since in the sample space they are orthogonal to each other. Orthogonal Non-orthogonal

9

10 Locations along each component (or eigenvector) are then associated with values across all variables. This association between the components and the original variables is called the component s eigenvalue. In multivariate (multiple variable) space, the correlation between the component and the original variables is called the component loadings. Component loadings: analogous to correlation coefficients, squaring them give the amount of explained variation. Therefore the component loadings tell us how much of the variation in a variable is explained by the component.

11
12 If we use this technique on a data set with a large number of variables, we can compress the amount of explained variation to just a few components. What follows is an example of Principal Component Analysis using canal town commodity production figures (percentage of total production) for 1845.

13

14 Towns Columbia Middletown Harrisburg Newport Lewistown Hollidaysburg Johnstown Blairsville Pittsburgh Dunnsburg Williamsport Northumberland Berwick Easton New Hope Bristol Philadelphia Paoli Parkesburg Lancaster Variables Corn Wheat Flour Whiskey Groceries Dry Goods

15 Component Total Variance Explained Initial Eigenv alues Extraction Sums of Squared Loadings Rotation Sums of Squared Loadings Total % of Variance Cumulativ e % Total % of Variance Cumulativ e % Total % of Variance Cumulativ e % Extraction Method: Principal Component Analy sis. In this case, 3 components contain % of the variation of the 6 original variables. Note that there are as many components as original input variables. Component 1 explains % of the variation, component 2 explains %, and component 3 explains %. The remaining 3 components explain only 6.632%.

16 A scree plot graphs the amount of variation explained by each component. Cut-off point

17 Corn Wheat Groceries Dry Goods Flour Whiskey Rotated Component Matrix a (a) Component Extraction Method: Principal Component Analy sis. Rotation Met hod: Varimax wit h Kaiser Normalization. a. Rotation conv erged in 4 iterations. Highest Component Loading Component 1: Groceries and dry goods. Component 2: Corn and wheat. Component 3: Flour and whiskey.

18 Note how the variables that make up each component fall close to each other in the 3-dimensional sample space.

19 What do these components mean (how do we interpret them)? Component 1 (groceries and dry goods) these two items are highly processed and value added. Component 2 (corn and wheat) these two items are not processed (raw) and have no value added. Component 3 (flour and whiskey) these two items are moderately processed and value added. It appears that the components are indicators of either the amount of processing or value adding (or both).
 these two items are moderately processed and value added.")
20 The most challenging part of PCA is interpreting the components. 1. The higher the component loadings, the more important that variable is to the component. 2. Combinations of positive and negative loadings are interpreted as mixed. 3. The specific sign of the is not important. 4. ALWAYS use the ROTATED component matrix!!

21 Component score: the new variable value based on the observation s component loading and the standardized value of the original variable, summed over all variables. Score ik D ij L jk where D ij is the standardized value for observation i on variable j and L jk is the loading of variable j on component k. Examining the component scores for each town may give some clues as to the interpretation of the components.
22 Component Score Box Plot
23 Easton, Philadelphia, and Northumberland are the only towns that load highly on a single component.
24 Scoring highly on a single component simply means that the original variable values for these locations are overwhelmingly explained by a single component. In this case, it means that the variation among ALL of the variables for Philadelphia (for example) is more completely explained by a single component composed of groceries and dry goods. Corn Wheat Groceries Dry Goods Flour Whiskey Rotated Component Matrix a Component Extraction Method: Principal Component Analy sis. Rotation Met hod: Varimax wit h Kaiser Normalization. a. Rotation conv erged in 4 iterations.
25 Town Component Scores Town Component 1 Component 2 Component 3 Columbia Middletown Harrisburg Newport Lewistown Hollidaysburg Johnstown Blairsville Pittsburgh Dunnsburg Williamsport Northumberland Berwick Easton New Hope Bristol Philadelphia Paoli Parkesburg Lancaster Middletown is a mixed town because it loads on all components equally. Philly is a processed goods town.
26 Component 1: Processed Goods The green town were producers of processed goods, while the red towns were consumers of those goods.
27 Component 2: Non-Processed Goods The green town were producers of non-processed goods, while the red towns were consumers of those goods.
28 Component 3: Partially Processed Goods The green town were producers of partially processed goods, while the red towns were consumers of those goods.
29 What information did PCA provide concerning the goods exported by the canal towns? The goods fell into recognizable categories (highly processed, moderately processed, not processed). A small number of towns were responsible for exporting most of these goods. The location of these towns relative to the goods they produced make sense. Industrial towns on the Columbia railroad exported finished goods. Small farming towns on the canal exported produce. Midsize towns exported moderately processed goods.
30 Without the use of Principal Component Analyses these associations would be difficult to determine. Principal Component Analyses is also used to remove correlation among independent variables that are to be used in multivariate regression analysis. Correlation Matrix Corn Wheat Groceries DryGoods Flour Whiskey Corn Wheat Correlation Groceries DryGoods Flour Whiskey Correlation Dry Goods Groceries PCA 2 PCA 3 PCA Note that PCA1 is highly correlated to dry goods and groceries, but uncorrelated to PCA2 and PCA3.
Factor Analysis. Chapter 420. Introduction
 Chapter 420 Introduction (FA) is an exploratory technique applied to a set of observed variables that seeks to find underlying factors (subsets of variables) from which the observed variables were generated.
Dimensionality Reduction: Principal Components Analysis
 Dimensionality Reduction: Principal Components Analysis In data mining one often encounters situations where there are a large number of variables in the database. In such situations it is very likely
Introduction to Principal Components and FactorAnalysis
 Introduction to Principal Components and FactorAnalysis Multivariate Analysis often starts out with data involving a substantial number of correlated variables. Principal Component Analysis (PCA) is a
T-test & factor analysis
 Parametric tests T-test & factor analysis Better than non parametric tests Stringent assumptions More strings attached Assumes population distribution of sample is normal Major problem Alternatives Continue
Review Jeopardy. Blue vs. Orange. Review Jeopardy
 Review Jeopardy Blue vs. Orange Review Jeopardy Jeopardy Round Lectures 0-3 Jeopardy Round $200 How could I measure how far apart (i.e. how different) two observations, y 1 and y 2, are from each other?
Overview of Factor Analysis
 Overview of Factor Analysis Jamie DeCoster Department of Psychology University of Alabama 348 Gordon Palmer Hall Box 870348 Tuscaloosa, AL 35487-0348 Phone: (205) 348-4431 Fax: (205) 348-8648 August 1,
Factor Analysis. Advanced Financial Accounting II Åbo Akademi School of Business
 Factor Analysis Advanced Financial Accounting II Åbo Akademi School of Business Factor analysis A statistical method used to describe variability among observed variables in terms of fewer unobserved variables
Rachel J. Goldberg, Guideline Research/Atlanta, Inc., Duluth, GA
 PROC FACTOR: How to Interpret the Output of a Real-World Example Rachel J. Goldberg, Guideline Research/Atlanta, Inc., Duluth, GA ABSTRACT THE METHOD This paper summarizes a real-world example of a factor
Chapter 7 Factor Analysis SPSS
 Chapter 7 Factor Analysis SPSS Factor analysis attempts to identify underlying variables, or factors, that explain the pattern of correlations within a set of observed variables. Factor analysis is often
FACTOR ANALYSIS. Factor Analysis is similar to PCA in that it is a technique for studying the interrelationships among variables.
 FACTOR ANALYSIS Introduction Factor Analysis is similar to PCA in that it is a technique for studying the interrelationships among variables Both methods differ from regression in that they don t have
Principal Component Analysis
 Principal Component Analysis ERS70D George Fernandez INTRODUCTION Analysis of multivariate data plays a key role in data analysis. Multivariate data consists of many different attributes or variables recorded
Common factor analysis
 Common factor analysis This is what people generally mean when they say "factor analysis" This family of techniques uses an estimate of common variance among the original variables to generate the factor
FACTOR ANALYSIS NASC
 FACTOR ANALYSIS NASC Factor Analysis A data reduction technique designed to represent a wide range of attributes on a smaller number of dimensions. Aim is to identify groups of variables which are relatively
Introduction to Principal Component Analysis: Stock Market Values
 Chapter 10 Introduction to Principal Component Analysis: Stock Market Values The combination of some data and an aching desire for an answer does not ensure that a reasonable answer can be extracted from
Steven M. Ho!and. Department of Geology, University of Georgia, Athens, GA 30602-2501
 PRINCIPAL COMPONENTS ANALYSIS (PCA) Steven M. Ho!and Department of Geology, University of Georgia, Athens, GA 30602-2501 May 2008 Introduction Suppose we had measured two variables, length and width, and
4. There are no dependent variables specified... Instead, the model is: VAR 1. Or, in terms of basic measurement theory, we could model it as:
 1 Neuendorf Factor Analysis Assumptions: 1. Metric (interval/ratio) data 2. Linearity (in the relationships among the variables--factors are linear constructions of the set of variables; the critical source
SPSS ADVANCED ANALYSIS WENDIANN SETHI SPRING 2011
 SPSS ADVANCED ANALYSIS WENDIANN SETHI SPRING 2011 Statistical techniques to be covered Explore relationships among variables Correlation Regression/Multiple regression Logistic regression Factor analysis
Regression III: Advanced Methods
 Lecture 16: Generalized Additive Models Regression III: Advanced Methods Bill Jacoby Michigan State University http://polisci.msu.edu/jacoby/icpsr/regress3 Goals of the Lecture Introduce Additive Models
How to report the percentage of explained common variance in exploratory factor analysis
 UNIVERSITAT ROVIRA I VIRGILI How to report the percentage of explained common variance in exploratory factor analysis Tarragona 2013 Please reference this document as: Lorenzo-Seva, U. (2013). How to report
Factor Analysis. Principal components factor analysis. Use of extracted factors in multivariate dependency models
 Factor Analysis Principal components factor analysis Use of extracted factors in multivariate dependency models 2 KEY CONCEPTS ***** Factor Analysis Interdependency technique Assumptions of factor analysis
Exploratory Factor Analysis
 Introduction Principal components: explain many variables using few new variables. Not many assumptions attached. Exploratory Factor Analysis Exploratory factor analysis: similar idea, but based on model.
Factor Analysis Example: SAS program (in blue) and output (in black) interleaved with comments (in red)
 and output (in black) interleaved with comments (in red)") Factor Analysis Example: SAS program (in blue) and output (in black) interleaved with comments (in red) The following DATA procedure is to read input data. This will create a SAS dataset named CORRMATR
Factor Analysis Example: SAS program (in blue) and output (in black) interleaved with comments (in red) The following DATA procedure is to read input data. This will create a SAS dataset named CORRMATR
To do a factor analysis, we need to select an extraction method and a rotation method. Hit the Extraction button to specify your extraction method.
 Factor Analysis in SPSS To conduct a Factor Analysis, start from the Analyze menu. This procedure is intended to reduce the complexity in a set of data, so we choose Data Reduction from the menu. And the
An introduction to. Principal Component Analysis & Factor Analysis. Using SPSS 19 and R (psych package) Robin Beaumont robin@organplayers.co.
 Robin Beaumont robin@organplayers.co.") An introduction to Principal Component Analysis & Factor Analysis Using SPSS 19 and R (psych package) Robin Beaumont robin@organplayers.co.uk Monday, 23 April 2012 Acknowledgment: The original version
An introduction to Principal Component Analysis & Factor Analysis Using SPSS 19 and R (psych package) Robin Beaumont robin@organplayers.co.uk Monday, 23 April 2012 Acknowledgment: The original version
Multivariate Statistical Inference and Applications
 Multivariate Statistical Inference and Applications ALVIN C. RENCHER Department of Statistics Brigham Young University A Wiley-Interscience Publication JOHN WILEY & SONS, INC. New York Chichester Weinheim
Multivariate Analysis (Slides 13)
") Multivariate Analysis (Slides 13) The final topic we consider is Factor Analysis. A Factor Analysis is a mathematical approach for attempting to explain the correlation between a large set of variables
Multivariate Analysis (Slides 13) The final topic we consider is Factor Analysis. A Factor Analysis is a mathematical approach for attempting to explain the correlation between a large set of variables
Factor Analysis. Sample StatFolio: factor analysis.sgp
 STATGRAPHICS Rev. 1/10/005 Factor Analysis Summary The Factor Analysis procedure is designed to extract m common factors from a set of p quantitative variables X. In many situations, a small number of
A Brief Introduction to Factor Analysis
 1. Introduction A Brief Introduction to Factor Analysis Factor analysis attempts to represent a set of observed variables X 1, X 2. X n in terms of a number of 'common' factors plus a factor which is unique
Introduction to Matrix Algebra
 Psychology 7291: Multivariate Statistics (Carey) 8/27/98 Matrix Algebra - 1 Introduction to Matrix Algebra Definitions: A matrix is a collection of numbers ordered by rows and columns. It is customary
2. Linearity (in relationships among the variables--factors are linear constructions of the set of variables) F 2 X 4 U 4
 F 2 X 4 U 4") 1 Neuendorf Factor Analysis Assumptions: 1. Metric (interval/ratio) data. Linearity (in relationships among the variables--factors are linear constructions of the set of variables) 3. Univariate and multivariate
1 Neuendorf Factor Analysis Assumptions: 1. Metric (interval/ratio) data. Linearity (in relationships among the variables--factors are linear constructions of the set of variables) 3. Univariate and multivariate
Topic 10: Factor Analysis
 Topic 10: Factor Analysis Introduction Factor analysis is a statistical method used to describe variability among observed variables in terms of a potentially lower number of unobserved variables called
Factor Analysis. Factor Analysis
 Factor Analysis Principal Components Analysis, e.g. of stock price movements, sometimes suggests that several variables may be responding to a small number of underlying forces. In the factor model, we
Exploratory Factor Analysis of Demographic Characteristics of Antenatal Clinic Attendees and their Association with HIV Risk
 Doi:10.5901/mjss.2014.v5n20p303 Abstract Exploratory Factor Analysis of Demographic Characteristics of Antenatal Clinic Attendees and their Association with HIV Risk Wilbert Sibanda Philip D. Pretorius
Multivariate Analysis
 Table Of Contents Multivariate Analysis... 1 Overview... 1 Principal Components... 2 Factor Analysis... 5 Cluster Observations... 12 Cluster Variables... 17 Cluster K-Means... 20 Discriminant Analysis...
Least-Squares Intersection of Lines
 Least-Squares Intersection of Lines Johannes Traa - UIUC 2013 This write-up derives the least-squares solution for the intersection of lines. In the general case, a set of lines will not intersect at a
Statistics in Psychosocial Research Lecture 8 Factor Analysis I. Lecturer: Elizabeth Garrett-Mayer
 This work is licensed under a Creative Commons Attribution-NonCommercial-ShareAlike License. Your use of this material constitutes acceptance of that license and the conditions of use of materials on this
Exploratory Factor Analysis: rotation. Psychology 588: Covariance structure and factor models
 Exploratory Factor Analysis: rotation Psychology 588: Covariance structure and factor models Rotational indeterminacy Given an initial (orthogonal) solution (i.e., Φ = I), there exist infinite pairs of
BEHAVIOR BASED CREDIT CARD FRAUD DETECTION USING SUPPORT VECTOR MACHINES
 BEHAVIOR BASED CREDIT CARD FRAUD DETECTION USING SUPPORT VECTOR MACHINES 123 CHAPTER 7 BEHAVIOR BASED CREDIT CARD FRAUD DETECTION USING SUPPORT VECTOR MACHINES 7.1 Introduction Even though using SVM presents
How To Understand Multivariate Models
 Neil H. Timm Applied Multivariate Analysis With 42 Figures Springer Contents Preface Acknowledgments List of Tables List of Figures vii ix xix xxiii 1 Introduction 1 1.1 Overview 1 1.2 Multivariate Models
How To Run Factor Analysis
 Getting Started in Factor Analysis (using Stata 10) (ver. 1.5) Oscar Torres-Reyna Data Consultant otorres@princeton.edu http://dss.princeton.edu/training/ Factor analysis is used mostly for data reduction
Factor analysis. Angela Montanari
 Factor analysis Angela Montanari 1 Introduction Factor analysis is a statistical model that allows to explain the correlations between a large number of observed correlated variables through a small number
Exploratory Factor Analysis and Principal Components. Pekka Malo & Anton Frantsev 30E00500 Quantitative Empirical Research Spring 2016
 and Principal Components Pekka Malo & Anton Frantsev 30E00500 Quantitative Empirical Research Spring 2016 Agenda Brief History and Introductory Example Factor Model Factor Equation Estimation of Loadings
5.2 Customers Types for Grocery Shopping Scenario
 ------------------------------------------------------------------------------------------------------- CHAPTER 5: RESULTS AND ANALYSIS -------------------------------------------------------------------------------------------------------
Exploratory Factor Analysis Brian Habing - University of South Carolina - October 15, 2003
 Exploratory Factor Analysis Brian Habing - University of South Carolina - October 15, 2003 FA is not worth the time necessary to understand it and carry it out. -Hills, 1977 Factor analysis should not
Mehtap Ergüven Abstract of Ph.D. Dissertation for the degree of PhD of Engineering in Informatics
 INTERNATIONAL BLACK SEA UNIVERSITY COMPUTER TECHNOLOGIES AND ENGINEERING FACULTY ELABORATION OF AN ALGORITHM OF DETECTING TESTS DIMENSIONALITY Mehtap Ergüven Abstract of Ph.D. Dissertation for the degree
Homework 11. Part 1. Name: Score: / null
 Name: Score: / Homework 11 Part 1 null 1 For which of the following correlations would the data points be clustered most closely around a straight line? A. r = 0.50 B. r = -0.80 C. r = 0.10 D. There is
Manifold Learning Examples PCA, LLE and ISOMAP
 Manifold Learning Examples PCA, LLE and ISOMAP Dan Ventura October 14, 28 Abstract We try to give a helpful concrete example that demonstrates how to use PCA, LLE and Isomap, attempts to provide some intuition
PRINCIPAL COMPONENT ANALYSIS
 1 Chapter 1 PRINCIPAL COMPONENT ANALYSIS Introduction: The Basics of Principal Component Analysis........................... 2 A Variable Reduction Procedure.......................................... 2
STA 4107/5107. Chapter 3
 STA 4107/5107 Chapter 3 Factor Analysis 1 Key Terms Please review and learn these terms. 2 What is Factor Analysis? Factor analysis is an interdependence technique (see chapter 1) that primarily uses metric
Object Recognition and Template Matching
 Object Recognition and Template Matching Template Matching A template is a small image (sub-image) The goal is to find occurrences of this template in a larger image That is, you want to find matches of
This chapter will demonstrate how to perform multiple linear regression with IBM SPSS
 CHAPTER 7B Multiple Regression: Statistical Methods Using IBM SPSS This chapter will demonstrate how to perform multiple linear regression with IBM SPSS first using the standard method and then using the
Data analysis process
 Data analysis process Data collection and preparation Collect data Prepare codebook Set up structure of data Enter data Screen data for errors Exploration of data Descriptive Statistics Graphs Analysis
Module 3: Correlation and Covariance
 Using Statistical Data to Make Decisions Module 3: Correlation and Covariance Tom Ilvento Dr. Mugdim Pašiƒ University of Delaware Sarajevo Graduate School of Business O ften our interest in data analysis
Factor Analysis and Structural equation modelling
 Factor Analysis and Structural equation modelling Herman Adèr Previously: Department Clinical Epidemiology and Biostatistics, VU University medical center, Amsterdam Stavanger July 4 13, 2006 Herman Adèr
Factor Analysis - SPSS
 Factor Analysis - SPSS First Read Principal Components Analysis. The methods we have employed so far attempt to repackage all of the variance in the p variables into principal components. We may wish to
Least Squares Estimation
 Least Squares Estimation SARA A VAN DE GEER Volume 2, pp 1041 1045 in Encyclopedia of Statistics in Behavioral Science ISBN-13: 978-0-470-86080-9 ISBN-10: 0-470-86080-4 Editors Brian S Everitt & David
Research Methodology: Tools
 MSc Business Administration Research Methodology: Tools Applied Data Analysis (with SPSS) Lecture 02: Item Analysis / Scale Analysis / Factor Analysis February 2014 Prof. Dr. Jürg Schwarz Lic. phil. Heidi
Component Ordering in Independent Component Analysis Based on Data Power
 Component Ordering in Independent Component Analysis Based on Data Power Anne Hendrikse Raymond Veldhuis University of Twente University of Twente Fac. EEMCS, Signals and Systems Group Fac. EEMCS, Signals
THE USING FACTOR ANALYSIS METHOD IN PREDICTION OF BUSINESS FAILURE
 THE USING FACTOR ANALYSIS METHOD IN PREDICTION OF BUSINESS FAILURE Mary Violeta Petrescu Ph. D University of Craiova Faculty of Economics and Business Administration Craiova, Romania Abstract: : After
Principle Component Analysis and Partial Least Squares: Two Dimension Reduction Techniques for Regression
 Principle Component Analysis and Partial Least Squares: Two Dimension Reduction Techniques for Regression Saikat Maitra and Jun Yan Abstract: Dimension reduction is one of the major tasks for multivariate
1) Write the following as an algebraic expression using x as the variable: Triple a number subtracted from the number
 Write the following as an algebraic expression using x as the variable: Triple a number subtracted from the number") 1) Write the following as an algebraic expression using x as the variable: Triple a number subtracted from the number A. 3(x - x) B. x 3 x C. 3x - x D. x - 3x 2) Write the following as an algebraic expression
1) Write the following as an algebraic expression using x as the variable: Triple a number subtracted from the number A. 3(x - x) B. x 3 x C. 3x - x D. x - 3x 2) Write the following as an algebraic expression
NCSS Statistical Software Principal Components Regression. In ordinary least squares, the regression coefficients are estimated using the formula ( )
") Chapter 340 Principal Components Regression Introduction is a technique for analyzing multiple regression data that suffer from multicollinearity. When multicollinearity occurs, least squares estimates
Chapter 340 Principal Components Regression Introduction is a technique for analyzing multiple regression data that suffer from multicollinearity. When multicollinearity occurs, least squares estimates
A Brief Introduction to SPSS Factor Analysis
 A Brief Introduction to SPSS Factor Analysis SPSS has a procedure that conducts exploratory factor analysis. Before launching into a step by step example of how to use this procedure, it is recommended
Nonlinear Iterative Partial Least Squares Method
 Numerical Methods for Determining Principal Component Analysis Abstract Factors Béchu, S., Richard-Plouet, M., Fernandez, V., Walton, J., and Fairley, N. (2016) Developments in numerical treatments for
Factor Analysis: Statnotes, from North Carolina State University, Public Administration Program. Factor Analysis
 Factor Analysis Overview Factor analysis is used to uncover the latent structure (dimensions) of a set of variables. It reduces attribute space from a larger number of variables to a smaller number of
1 2 3 1 1 2 x = + x 2 + x 4 1 0 1
 (d) If the vector b is the sum of the four columns of A, write down the complete solution to Ax = b. 1 2 3 1 1 2 x = + x 2 + x 4 1 0 0 1 0 1 2. (11 points) This problem finds the curve y = C + D 2 t which
COMPARISONS OF CUSTOMER LOYALTY: PUBLIC & PRIVATE INSURANCE COMPANIES.
 277 CHAPTER VI COMPARISONS OF CUSTOMER LOYALTY: PUBLIC & PRIVATE INSURANCE COMPANIES. This chapter contains a full discussion of customer loyalty comparisons between private and public insurance companies
Subspace Analysis and Optimization for AAM Based Face Alignment
 Subspace Analysis and Optimization for AAM Based Face Alignment Ming Zhao Chun Chen College of Computer Science Zhejiang University Hangzhou, 310027, P.R.China zhaoming1999@zju.edu.cn Stan Z. Li Microsoft
CHAPTER 8 FACTOR EXTRACTION BY MATRIX FACTORING TECHNIQUES. From Exploratory Factor Analysis Ledyard R Tucker and Robert C.
 CHAPTER 8 FACTOR EXTRACTION BY MATRIX FACTORING TECHNIQUES From Exploratory Factor Analysis Ledyard R Tucker and Robert C MacCallum 1997 180 CHAPTER 8 FACTOR EXTRACTION BY MATRIX FACTORING TECHNIQUES In
[1] Diagonal factorization
![[1] Diagonal factorization](/thumbs/40/21671034.jpg "[1] Diagonal factorization") 8.03 LA.6: Diagonalization and Orthogonal Matrices [ Diagonal factorization [2 Solving systems of first order differential equations [3 Symmetric and Orthonormal Matrices [ Diagonal factorization Recall:
8.03 LA.6: Diagonalization and Orthogonal Matrices [ Diagonal factorization [2 Solving systems of first order differential equations [3 Symmetric and Orthonormal Matrices [ Diagonal factorization Recall:
The ith principal component (PC) is the line that follows the eigenvector associated with the ith largest eigenvalue.
 is the line that follows the eigenvector associated with the ith largest eigenvalue.") More Principal Components Summary Principal Components (PCs) are associated with the eigenvectors of either the covariance or correlation matrix of the data. The ith principal component (PC) is the line
More Principal Components Summary Principal Components (PCs) are associated with the eigenvectors of either the covariance or correlation matrix of the data. The ith principal component (PC) is the line
Psychology 7291, Multivariate Analysis, Spring 2003. SAS PROC FACTOR: Suggestions on Use
 : Suggestions on Use Background: Factor analysis requires several arbitrary decisions. The choices you make are the options that you must insert in the following SAS statements: PROC FACTOR METHOD=????
How to Get More Value from Your Survey Data
 Technical report How to Get More Value from Your Survey Data Discover four advanced analysis techniques that make survey research more effective Table of contents Introduction..............................................................2
Multivariate Analysis of Ecological Data
 Multivariate Analysis of Ecological Data MICHAEL GREENACRE Professor of Statistics at the Pompeu Fabra University in Barcelona, Spain RAUL PRIMICERIO Associate Professor of Ecology, Evolutionary Biology
Partial Least Squares (PLS) Regression.
 Regression.") Partial Least Squares (PLS) Regression. Hervé Abdi 1 The University of Texas at Dallas Introduction Pls regression is a recent technique that generalizes and combines features from principal component
Partial Least Squares (PLS) Regression. Hervé Abdi 1 The University of Texas at Dallas Introduction Pls regression is a recent technique that generalizes and combines features from principal component
Facebook Friend Suggestion Eytan Daniyalzade and Tim Lipus
 Facebook Friend Suggestion Eytan Daniyalzade and Tim Lipus 1. Introduction Facebook is a social networking website with an open platform that enables developers to extract and utilize user information
What is Rotating in Exploratory Factor Analysis?
 A peer-reviewed electronic journal. Copyright is retained by the first or sole author, who grants right of first publication to the Practical Assessment, Research & Evaluation. Permission is granted to
Canonical Correlation Analysis
 Canonical Correlation Analysis LEARNING OBJECTIVES Upon completing this chapter, you should be able to do the following: State the similarities and differences between multiple regression, factor analysis,
Introduction: Overview of Kernel Methods
 Introduction: Overview of Kernel Methods Statistical Data Analysis with Positive Definite Kernels Kenji Fukumizu Institute of Statistical Mathematics, ROIS Department of Statistical Science, Graduate University
Multiple Regression: What Is It?
 Multiple Regression Multiple Regression: What Is It? Multiple regression is a collection of techniques in which there are multiple predictors of varying kinds and a single outcome We are interested in
Exploratory Factor Analysis
 Exploratory Factor Analysis Definition Exploratory factor analysis (EFA) is a procedure for learning the extent to which k observed variables might measure m abstract variables, wherein m is less than
Does organizational culture cheer organizational profitability? A case study on a Bangalore based Software Company
 Does organizational culture cheer organizational profitability? A case study on a Bangalore based Software Company S Deepalakshmi Assistant Professor Department of Commerce School of Business, Alliance
PATTERNS OF ENVIRONMENTAL MANAGEMENT IN THE CHILEAN MANUFACTURING INDUSTRY: AN EMPIRICAL APPROACH
 PATTERS OF EVIROMETAL MAAGEMET I THE CHILEA MAUFACTURIG IDUSTRY: A EMPIRICAL APPROACH Dr. Maria Teresa Ruiz-Tagle Research Associate, University of Cambridge, UK Research Associate, Universidad de Chile,
Exploratory Factor Analysis
 Exploratory Factor Analysis ( 探 索 的 因 子 分 析 ) Yasuyo Sawaki Waseda University JLTA2011 Workshop Momoyama Gakuin University October 28, 2011 1 Today s schedule Part 1: EFA basics Introduction to factor
Tutorial on Exploratory Data Analysis
 Tutorial on Exploratory Data Analysis Julie Josse, François Husson, Sébastien Lê julie.josse at agrocampus-ouest.fr francois.husson at agrocampus-ouest.fr Applied Mathematics Department, Agrocampus Ouest
Principal components analysis
 CS229 Lecture notes Andrew Ng Part XI Principal components analysis In our discussion of factor analysis, we gave a way to model data x R n as approximately lying in some k-dimension subspace, where k
Module 5: Multiple Regression Analysis
 Using Statistical Data Using to Make Statistical Decisions: Data Multiple to Make Regression Decisions Analysis Page 1 Module 5: Multiple Regression Analysis Tom Ilvento, University of Delaware, College
Practical Considerations for Using Exploratory Factor Analysis in Educational Research
 A peer-reviewed electronic journal. Copyright is retained by the first or sole author, who grants right of first publication to the Practical Assessment, Research & Evaluation. Permission is granted to
Lecture 11: Chapter 5, Section 3 Relationships between Two Quantitative Variables; Correlation
 Lecture 11: Chapter 5, Section 3 Relationships between Two Quantitative Variables; Correlation Display and Summarize Correlation for Direction and Strength Properties of Correlation Regression Line Cengage
How To Cluster
 Data Clustering Dec 2nd, 2013 Kyrylo Bessonov Talk outline Introduction to clustering Types of clustering Supervised Unsupervised Similarity measures Main clustering algorithms k-means Hierarchical Main
Factor Analysis Using SPSS
 Psychology 305 p. 1 Factor Analysis Using SPSS Overview For this computer assignment, you will conduct a series of principal factor analyses to examine the factor structure of a new instrument developed
Using Principal Components Analysis in Program Evaluation: Some Practical Considerations
 http://evaluation.wmich.edu/jmde/ Articles Using Principal Components Analysis in Program Evaluation: Some Practical Considerations J. Thomas Kellow Assistant Professor of Research and Statistics Mercer
DISCRIMINANT FUNCTION ANALYSIS (DA)
") DISCRIMINANT FUNCTION ANALYSIS (DA) John Poulsen and Aaron French Key words: assumptions, further reading, computations, standardized coefficents, structure matrix, tests of signficance Introduction Discriminant
DISCRIMINANT FUNCTION ANALYSIS (DA) John Poulsen and Aaron French Key words: assumptions, further reading, computations, standardized coefficents, structure matrix, tests of signficance Introduction Discriminant
MULTIVARIATE DATA ANALYSIS WITH PCA, CA AND MS TORSTEN MADSEN 2007
 MULTIVARIATE DATA ANALYSIS WITH PCA, CA AND MS TORSTEN MADSEN 2007 Archaeological material that we wish to analyse through formalised methods has to be described prior to analysis in a standardised, formalised
Part 2: Analysis of Relationship Between Two Variables
 Part 2: Analysis of Relationship Between Two Variables Linear Regression Linear correlation Significance Tests Multiple regression Linear Regression Y = a X + b Dependent Variable Independent Variable
EM Clustering Approach for Multi-Dimensional Analysis of Big Data Set
 EM Clustering Approach for Multi-Dimensional Analysis of Big Data Set Amhmed A. Bhih School of Electrical and Electronic Engineering Princy Johnson School of Electrical and Electronic Engineering Martin
MULTIPLE REGRESSION AND ISSUES IN REGRESSION ANALYSIS
 MULTIPLE REGRESSION AND ISSUES IN REGRESSION ANALYSIS MSR = Mean Regression Sum of Squares MSE = Mean Squared Error RSS = Regression Sum of Squares SSE = Sum of Squared Errors/Residuals α = Level of Significance
Introduction to Multivariate Analysis
 Introduction to Multivariate Analysis Lecture 1 August 24, 2005 Multivariate Analysis Lecture #1-8/24/2005 Slide 1 of 30 Today s Lecture Today s Lecture Syllabus and course overview Chapter 1 (a brief
Data Mining for Model Creation. Presentation by Paul Below, EDS 2500 NE Plunkett Lane Poulsbo, WA USA 98370 paul.below@eds.
 Sept 03-23-05 22 2005 Data Mining for Model Creation Presentation by Paul Below, EDS 2500 NE Plunkett Lane Poulsbo, WA USA 98370 paul.below@eds.com page 1 Agenda Data Mining and Estimating Model Creation
Additional sources Compilation of sources: http://lrs.ed.uiuc.edu/tseportal/datacollectionmethodologies/jin-tselink/tselink.htm
 Mgt 540 Research Methods Data Analysis 1 Additional sources Compilation of sources: http://lrs.ed.uiuc.edu/tseportal/datacollectionmethodologies/jin-tselink/tselink.htm http://web.utk.edu/~dap/random/order/start.htm