Reinforced concrete moment-resisting frames are structural systems that work to
|
|
|
- Jordan Wilcox
- 9 years ago
- Views:
Transcription
1
2 i Abstract Reinforced concrete moment-resisting frames are structural systems that work to resist earthquake ground motions through ductile behavior. Their performance is essential to prevent building collapse and loss of life during a seismic event. Seismic building code provisions outline requirements for three categories of reinforced concrete momentresisting frames: ordinary moment frames, intermediate moment frames, and special moment frames. Extensive research has been conducted on the performance of special moment-resisting frames for areas of high seismic activity such as California. More research is needed on the performance of intermediate moment frames for areas of moderate seismicity because the current code provisions are based on past observation and experience. Adapting dynamic analysis software and applications developed by the Pacific Earthquake Engineering Research (PEER) Group, a representative concrete intermediate moment frame was designed per code provisions and analyzed for specified ground motions in order to calculate the probability of collapse. A parametric study is used to explore the impact of changes in design characteristics and building code requirements on the seismic response and probability of collapse, namely the effect of additional height and the addition of a strong column-weak beam ratio requirement. The results show that the IMF seismic design provisions in ACI provide acceptable seismic performance based on current assessment methodology as gravity design appeared to govern the system. Additional height did not negatively impact seismic performance, while the addition of a strong-column weak-beam ratio did not significantly improve results It is the goal of this project to add insight into the design provisions for intermediate moment frames and to contribute to the technical base for future criteria.

3 ii Acknowledgements Throughout this year-long project, I have been fortunate to have a group of experienced researchers and engineers as my project advisors. Their experience and guidance has offered me a wealth of knowledge from which to learn from and grow as an engineer. I offer them my thanks and appreciation. Dr. Leonard D. Albano, PE is an Associate Professor at WPI and has served as my major advisor on this project. With an open door policy extended to all his students, Prof. Albano has been a mentor whose patient guidance and direction were instrumental in developing this study. Thank you Professor for making me a better student. Dr. Abbie B. Liel is an Assistant Professor at the University of Colorado at Boulder and has served as an outside advisor for the study. Without her willingness to help me with learning the modeling and analysis applications, this project would still be ongoing. Thank you Dr. Liel for your enthusiasm and guidance. Mr. Dominic Kelly, PE, SE is an associate principal with the firm of Simpson Gumpertz & Heger. It was through his work with ACI that the initial need for this study was developed and I was able to gain from his practical design experience when developing the IMF designs. Thank you Mr. Kelly for the opportunity to work on this study and for sharing your expertise. I would like to thank Dr. Robert Fitzgerald of WPI for his insight and experience as a member of my thesis committee and Mr. Thomas Schaeffer, PE of the Structural Design Group for his recommendations in developing the IMF design for the study. Finally, to all the family and friends who have offered their support (and patience) throughout the year, I thank you.

4 iii Table of Contents Abstract... i Acknowledgements... ii Table of Contents... iii Table of Figures... v Table of Tables... vii 1.0 Introduction Seismic Engineering: Philosophy and Design History of Earthquake Engineering Design Philosophy Seismology and Seismic Factors Earthquake Design Factors Earthquake Loading (The Dynamic Response of Structures) Dynamic Response of Structures Equivalent Lateral Force Method Dynamic Modal Analysis Dynamic Inelastic Time-History Analysis Performance-Based Earthquake Engineering Lateral Load Resisting System Design of Reinforced Concrete Moment Frames Categories of Reinforced Concrete Moment Frames Intermediate Moment Frames Flexural Design of Members Flexural Design of Beam-Columns Member Design for Shear Joint Design Computer-Based Modeling and Analysis Experimental Building Frame Code Based Design Manual Calculations IMF Microsoft Excel Design Spreadsheet Nonlinear Modeling of Seismic Performance Four-Story IMF Results Parametric Study Effect of Height (Six-Story Frame) Strong-Column Weak-Beam Ratio Four-Story IMF Six-Story IMF Conclusions References... 1 Appendices Appendix 1: Thesis Web Diagram Appendix 2: Outline of IMF Microsoft Excel Design Spreadsheets and Adaptations 131 Appendix 3: Overview of OpenSees Modeling Applications and Folders Appendix 4: Instructions for Conducting Nonlinear Pushover Analysis

5 Appendix 5: Instructions for Conducting Nonlinear Dynamic Analysis Appendix 6: Documentation of Design and Modeling Output for IMF Models Appendix 6.1: Four-Story IMF Appendix 6.2: Six-Story IMF Appendix 6.3: Four-Story IMF SCWB Appendix 6.4: Six-Story IMF SCWB iv

6 v Table of Figures Figure 1: Types of Faults (Marshak 2007, 208) Figure 2: Types of Seismic Waves (Marshak 2007, 227) Figure 3: Effective Peak Acceleration and Peak Velocity (ATC , 314) Figure 4: 1978 ATC 3-06 Contour Map (ATC , 316) Figure 5: ASCE 7-05 Contour Map (ASCE7-05) Figure 6: Rock and Lake Bed Ground Accelerations (Paulay and Priestley 1992, 56) Figure 7: Coefficients for Approximate Fundamental Period (ASCE7-05) Figure 8: Relationship between R Factor and Ductility (Paulay and Priestley 1992, 77) 23 Figure 9: MDOF System for a Multi-Story Building (Rao 2004, 31) Figure 10: Hysteresis Plot Illustrating Cyclic Loading (Rao 2004, 37) Figure 11: Typical Hysteresis Plots for RC-Elements (Paulay and Priestley 1992, 75) Figure 12: Lateral Forces at Each Story Using ELFM Figure 13: Story Drift Determination (ASCE7-05) Figure 14: Schematic Flowchart of Draft ATC-63 Methodology (SEAOC 2007) Figure 15: Reinforced Concrete Design Frame Scheme Figure 16: Inelastic Hinges within model beam-column element (SEAOC 2007) Figure 17: Hysteresis Plot including Deterioration for RC-Column (Ibarra et al. 2005). 42 Figure 18: Backbone Curve (Ibarra et al., 2005) Figure 19: Hysteresis Response and Backbone Curve for 2006 and 2007 PEER Studies 43 Figure 20: Possible Collapse Scenarios for RC-Frame (Liel et al, 2006) Figure 21: Illustration of inter-story drift and determination of a soft-story mechanism. 46 Figure 22: Modes of Failure for SMF Study Figure 23: Illustrative Incremental Dynamic Analysis Results Figure : Adjusted Collapse Margin Ratio Figure 25: Typical Horizontal Diaphragms and Shear Walls (MacGregor 2005, 959) Figure 26: Steel Braced Frame Figure 27: Unbraced Moment-Resisting Frame Figure 28: Soft-Story Mechanism (MacGregor et al 2005, 998) Figure 29: Confinement Failure of Column (Paulay and Priestley 1992, 5) Figure 30: Confinement Failure of a Column (Paulay and Priestley 1992, 4) Figure 31: Joint Failure (Paulay and Priestley 1992, 8) Figure 32: Beam Cross Section with Strains and Forces (Wang et al 2007, 50) Figure 33: Moment Distribution within a Continuous Beam Figure 34: Moment Capacity Diagram and Bar Cutoffs (Wang et al 2007, 227) Figure 35: Standard Hooks (Wang et al 2007, 1) Figure 36: Column Cross Section with Strain and Forces (Wang et al 2007, 447) Figure 37: Interaction Diagram for Concrete Columns (Wang et al 2007, 437) Figure 38: Typical Shear Stirrup Arrangement (Wang et al. 2007, 131) Figure 39: Determination of Shear Value Limit for Beam (ACI ) Figure 40: Confinement of Beam Column Joint (Wang et al 2007, 389) Figure 41: Shear Development within Beam-Column Joints (Wang et al, 2007, 387) Figure 42: Four-Story Design Building Elevation Figure 43: Design Building Plan View Figure 44: IMF Flexural Reinforcement... 85
 23 Figure 9: MDOF System for a Multi-Story Building (Rao 2004, 31).")
7 Figure 45: Flexural Reinforcement for A Typical Bay Figure 46: Beam Cross Sections Figure 47: Column Cross Sections Figure 48: Shear Reinforcement for IMF Figure 49: Shear Reinforcement of a Typical Bay Figure 50: Interior Joint Detail for Four-Story IMF Figure 51: Exterior Joint Detail for Four-Story IMF Figure 52: Design Documentation for Four-Story IMF Figure 53: Design Documentation for Four-Story IMF Figure 54: Modeling Documentation for OpenSees Modeling Figure 55: Base Shear vs. Roof Displacement Plot from Pushover Analysis Figure 56: Sample Incremental Dynamic Analysis (IDA) plot Figure 57: Sample Cumulative Distribution Function (CDF) for Collapse Probability. 100 Figure 58: Influence of SSF on CMR (Deierlein et al 2007, 7) Figure 59: Four-Story IMF Results for Pushover Analysis Figure 60: IDA Plot for Four-Story IMF Figure 61: CDF Plot for Four-Story IMF Results Figure 62: Sample Modes of Failure for Four-Story IMF Figure 63: Design Documentation for Six-Story Frame Figure 64: Pushover Analysis Results for Six-Story Frame Figure 65: IDA Plot for Six-Story IMF Results Figure 66: CDF Plot for the Six-Story Results Figure 67: Sample Modes of Failure for Six-Story Frame Figure 68: CDF (top) and IDA (bottom) Plots for Four-Story SCWB Results Figure 69: CDF Plot for Six-Story SCWB Results Figure 70: Local C:\ Drive Figure 71: OpenSees Runfolder Figure 72: Model Folder Figure 73: Output Folder Figure 74: OpenSees Processing Files Figure 75: Collection of Earthquake Data Figure 76: Earthquake Spectra Matlab Files Figure 77: Model Input File for Excel Input Figure 78: OpenSees Window and Run Mean Analysis Command Figure 79: Pushover Analysis Input Figure 80: Pushover Analysis Results Figure 81: Location of Matlab Data File Figure 82: Model Input File for Excel Input Figure 83: Set Analysis Options File Figure 84: Define Info for Building Input File Heading Figure 85: Define Info for Building File Figure 86: OpenSees Window and Run Mean Analysis Command Figure 87: Matlab File for Dynamic Analysis Figure 88: IDA Plot Figure 89: CDF Plot Figure 90: Sample Modes of Failure vi
 plot.")
8 vii Table of Tables Table 1: Comparison of Concrete Moment Frame Parameters Table 2: Design of Flexural Reinforcement Table 3: Specifications for Beam Shear Design Table 4: Specifications for Column Shear Design Table 5: ACI Seismic Provisions for Shear Design in IMF Components Table 6: Specifications for Joint Shear Design Table 7: Table of Values for Modification Factor C0 (FEMA , 3-22) Table 8: Table of Spectral Shape Factor Values (Draft ATC , 7-5) Table 9: Total System Collapse Uncertainty (Draft ATC , 7-13) Table 10: ACMR Values for Performance Assessment (Draft ATC , 7-14) Table 11: Comparison of Maximum Base Shear and Design Base Shear
... 104 Table 10: ACMR Values for Performance Assessment (Draft ATC-63 2009, 7-14).")
9 1 1.0 Introduction On a daily basis, most people take for granted the ground beneath their feet. Solid ground is a concept that many of us consider as a 100 percent guarantee. We drive our cars, commute to work, play outside, and relax in our homes with the comfort that the ground provides a solid foundation to our everyday life. However, the ground can move and at times move violently. Earthquakes or ground vibration can arise from both natural and man-made sources. The most common natural source of an earthquake is movement along a fault in the earth s crust. Other natural potential causes include volcanic eruptions or large landslides, which can also be outcome of earthquakes. Meanwhile, man-made earthquakes are caused by such things as underground explosions or mining activities. On average, more than one million earthquakes are felt and recorded across the globe in a given year (Marshak 2007, 207).While most of these occurrences are small and nonthreatening, there are occasional larger earthquakes that can cause significant damage and loss of life. In the United States, thirty-nine out of fifty are susceptible to moderate or severe earthquakes (ATC , 1). It is the task of the structural engineer to design buildings to survive the ground motion caused by earthquakes. Building codes and design specifications published by organizations such as the International Building Code Council and the American Concrete Institute (ACI) have evolved throughout the past century to help minimize loss of life caused by a structural collapse during an earthquake. Through the use of research and past observations, there are documents that outline the various types of structural

10 2 systems capable of resisting seismic forces and the design requirements needed for those systems to best survive seismic events. Reinforced concrete moment frames are one type of structural system that is widely used to resist seismic forces. The design requirements for these frames have been divided into three categories based on the seismic activity of a building s location: special moment frames, intermediate moment frames, and ordinary moment frames. Chapter 21 of the ACI publication Building Code Requirements for Structural Concrete (ACI 318, 2008) outlines the various additional detailing requirements for these frames. Ordinary moment frames are located in areas of low seismic activity and follow the standard design practices for flexural members, columns, and members in compression and bending. Meanwhile, special moment frames are used in areas of high seismic activity such as California. These frames have been the focus of much research into the design and detailing of concrete members with respect to increasing a building s survivability during an earthquake. Intermediate moment-resisting frames are used in areas of moderate seismic activity such as in the Southeastern United States. This type of frame design was added to code specifications after the introduction of special and ordinary moment frames in order to provide guidelines for structures that do not require the ductility of those used in California. The effectiveness of intermediate moment frames is still being investigated and updated in building code provisions. The purpose of this research is to add to the knowledge base on intermediate moment-resisting frame performance through the design and modeling of a typical frame based on current ACI 318 code provisions.
 outlines the various additional detailing requirements for these frames.")
11 3 Ultimately, the thesis investigated the seismic performance of a reinforced concrete intermediate moment-resisting frame, and the study was focused on four major areas. First, background research was conducted on earthquake engineering within the United States and the underlying phenomena involved with seismic design. This discussion also included background on the development of seismic provisions, typical design procedures used by practicing engineers, and current research being conducted on performance analysis using earthquake simulation. Next, a typical intermediate moment frame was design based on current code provisions and input from the engineering industry. The seismic performance of this frame was then analyzed and assessed using the current assessment methodology being developed by engineering researchers. Finally, a parametric study was conducted to investigate how the frame s performance was affected by an increase in building height and the addition of a strong-column weak-beam ratio.

12 4 2.0 Seismic Engineering: Philosophy and Design The effects of earthquakes in the United States have been recorded for as long as there have been European settlers on the continent and perhaps for even longer by Native Americans. However, the science of understanding seismic events and specifically how engineers can design for seismic forces did not develop until the late nineteenth and early twentieth century. The major advancement in seismic design provisions for buildings did not appear until the 1978 publication of tentative standard by the Applied Technology Council. This chapter investigates some of the history of seismic provisions in the United States, some of the underlying phenomena that these provisions try to encompass, and the current state of these provisions used for the design of structures. 2.1 History of Earthquake Engineering The first recorded earthquake in the continental United States occurred on June 11, 1638 in the St. Lawrence River Valley (US Department of Commerce 1982, 5). The first major recorded earthquake was recorded 25 years later on February 5, The 1663 quake reportedly caused extensive rockslides and landslides along the St. Lawrence River with eyewitnesses observing that the water remained muddy for a month (US Department of Commerce 1982, 9). The vibration was felt over an estimated area of 750,000 square miles and houses in Massachusetts Bay were shaken with chimneys collapsing and items falling off shelves. Major earthquakes such as the 1811 New Madrid, IL earthquake or the 1906 San Francisco earthquake would continue in frequency throughout the nineteenth and early twentieth century. The invention of the seismograph in 1889 by a German physicist

13 5 (Marshak 2007, 212) and the general awareness of the damage caused by violent ground shaking marked steps by the scientific community towards better understanding seismic phenomena. However, the effects of seismic events on building design and construction were not deeply considered until the twentieth century with preliminary seismic provisions for building codes developing in the 1920s and 1930s. In these preliminary applications, seismic forces were approximated as equal to ten percent of the building weight and were done so without any reliability (Paulay and Priestley 1992, 1). Yet, with values of earthquake ground accelerations becoming more readily available in the 1960s and with a better understanding of the dynamic response of buildings, seismologists and engineers teamed together to develop a more detailed set of provisions for earthquake design. Therefore in 1974, the Applied Technology Council (ATC) began work on code provisions for seismic design with funding from the National Science Foundation (NSF) and the National Bureau of Standards (NBS) (ATC , 2). The ATC report ATC 3-06: Tentative Provisions for the Development of Seismic Regulations for Buildings was published in June of 1978 with the hope of presenting in one comprehensive document, the state-of-knowledge in the fields of engineering seismology and engineering practice as it pertains to seismic design and construction of buildings (ATC , 1). The provisions outlined the overall design philosophy for a building s earthquake performance. It included methods to determine seismic design parameters such as ground acceleration, procedures to calculate seismic forces, and performance requirements for various types and occupancies of building structures. By compiling most of the research findings for seismic design, ATC 3-06, which was updated and reprinted
.")
14 6 in the 1980s, has served as the recognized benchmark of seismic requirements in the United States. In the same year as the publication of the ATC 3-06 report, two entities were established to continually test, review, and update the tentative seismic requirements of the ATC The Building Seismic Safety Council (BSSC) was established in order to serve as a national forum for discussing improvements to ATC seismic requirements (Holmes 2000, 102). The National Earthquake Hazards Reduction Program (NEHRP) was then created in 1978 under the authority of the BSSC, along with the aid of the Federal Emergency Management Agency (FEMA), in order to test and improve the provisions of ATC Under this program, the BSSC has published the NEHRP Provisions every 3 years since 1985 with updates on potential seismic requirements based on current research. Current building codes and specifications such as the ASCE7-05: Minimum Design Loads for Buildings and Other Structures published by the American Society of Civil Engineering (ASCE) and International Building Code (IBC) published by the International Building Code Council have incorporated the seismic provisions outlined by the ATC s report and the NEHRP recommendations. In addition to seismic provisions from the IBC and ASCE, the America Concrete Institute (ACI) has also developed design specifications for concrete. Specifically, the ACI-318 Committee s publication Building Code Requirements for Structural Concrete and Commentary provides minimum requirements for design and construction of structural concrete elements (ACI , 9) including seismic provisions for the strength and detailing requirements of reinforced concrete structures.
 was then created in 1978 under the authority of the BSSC, along with the aid of the Federal Emergency Management Agency (FEMA), in order to")
15 7 2.2 Design Philosophy The ultimate objective in earthquake design and engineering is to protect human life: Life safety in the event of a severe earthquake is the paramount consideration in the design of buildings (ATC , 2). A building collapse not only endangers lives within the structure but also individuals on the ground and in neighboring buildings. Therefore, seismic provisions must first and foremost strive to prevent the complete collapse of a building and, in turn, loss of human life. Additionally, code requirements and seismic philosophy must also consider the economic and functionality aspects of a building s performance during an earthquake. Frequent minor earthquakes for example should not cause damage to a structure for frequent repairs would lead to significant costs. Frequent smaller earthquakes should also not interfere with major building functions and operations as this could lead to delays in production and ultimately extra costs. Therefore, the philosophy of seismic provisions identifies three major limit states for the design of new buildings: serviceability limit state, damage control limit state, and the survivability limit state. First, the serviceability limit state demands that earthquakes should not cause damage that disrupts the functionality of the structure: This means that no damage needing repair should occur to the structure or to nonstructural components (Paulay and Priestley 1992, 9). For a reinforced concrete structure, design for this limit state would require that no major yielding of steel reinforcement or crushing of concrete would occur during a seismic event. Serviceability requirements vary for different structures. Hospitals, energy facilities, fire departments, and law enforcement buildings, which all need to remain functional during even a major seismic event, would have more

16 8 stringent serviceability limits than commercial or residential buildings, which are not critical to emergency response and the welfare of the public. The damage control limit state specifies that, while moderate earthquakes will cause damage to a structure, the structure can be restored to its previous full service state with repair: Ground shaking of intensity likely to induce response corresponding to the damage control limit state should have a low probability of occurrence during the expected life of the building (Paulay and Priestley 1992, 9). Finally, for large and severe earthquakes, a building must be able to prevent the loss of human life by avoiding collapse. This survivability limit state acknowledges that there will be irreparable damage to a structure but inelastic strength will prevent total collapse. Ultimately, each limit state from serviceability to survivability involves stricter requirements for design. The governing limit state depends on the earthquake level and frequency along with the function of the building being designed. For a major earthquake, essential facilities would be designed to be fully functional during an event while for other buildings serviceability would only govern for small seismic events. In most seismic designs, survivability is the governing case, as engineers want to prevent any loss of life. However, while the survival state is the most important, all three must be considered when designing a structure and all are affected by the predicted ground motions in a region and economic concerns of the client, which includes the general public. As mentioned above, a building can sustain irreparable damage yet still avoid full collapse. This is accomplished through the consideration of ductility and inelastic
. Finally, for large and severe earthquakes, a building must be able to prevent the loss of human life by avoiding collapse.")
17 9 behavior of construction materials. Ductility is a material s ability to experience large deformations or strains before failing under a load. The ductility of a material at any moment in time is quantified as the ratio between the displacement at any instant, Δ, and the displacement at yield, y (Paulay and Priestley 1992, 9). μ = y > 1 Equation 1 In many cases, engineers are interested in the ultimate ductility of a material or the ratio of the displacement at ultimate strength/failure, u, to the displacement at yield. For example, a steel bar in tension will deform significantly before it snaps. The opposite of this is brittle failure, such as when a concrete cylinder under load crushes without warning. The first advantage of a ductile material is that ductile failure gives significant warning of an impeding collapse while a brittle failure offers no warning. Ductility can also be described with respect to inelastic behavior. Inelastic behavior involves a ductile material being stressed passed its yield strength, as shown in the previous equations, which produces inelastic deformation, which permanently changes the shape of the material. While permanent deformation damage does occur, the material demonstrates additional load capacity by not failing immediately. In some cases of cyclic loading, the material can even gain load capacity through strain hardening. A simple example of this behavior would involve pulling on the handle of a plastic shopping bag. If little is placed in the bag, the handle can support the load elastically with the handle retaining its original shape after unloading. However, if a large purchase is placed in the bag, the handle begins to stretch. In most cases, the stretched handle can support the additional load, but when the load is removed, noticeable deformation of the handle is observed by the shopper. This would characterize inelastic behavior. If further

18 10 load was then placed on the handle, as in a shopper trying to carry too many goods in one bag, the material would experience very large deformation and seem to flow under the added load, and the handle would rupture. This is referred to as plastic behavior. A ductile structure is able to sustain large deformations caused by seismic loading and also absorb the energy from seismic vibration through the inelastic behavior of its components. Ductile components within a structure are designed to form plastic hinges or locations experiencing plastification of the cross section. Ultimately, it is at these hinges that the seismic energy causing lateral movement is dissipated as energy is absorbed through inelastic deformations. Although these deformations cause damage to structural and non-structural elements, the ductile behavior prevents a building from experiencing full collapse. Therefore, ductility is the single most important property sought by the designer of buildings located in regions of significant seismicity (Paulay and Priestley 1992, 12). Capacity design of structures seeks to use the advantages of ductile behavior in order for buildings to resist seismic loading. Certain structural elements are designed as ductile in order to exhibit inelastic behavior and prevent collapse under extreme loading. Additionally, these ductile elements are designed and detailed to fail prior to other brittle components of the structure. For a reinforced concrete member in flexure, this translates to tensile failure of the ductile steel reinforcement before the concrete, which is brittle, fails in compression. For the seismic design of larger structures, an engineer determines the plastic failure mechanism of a structure and carefully assigns which components will remain elastic and which ductile components will serve to dissipate energy through inelastic behavior with the formation of plastic hinges. In the text Seismic Design for

19 11 Reinforced Concrete and Masonry Structures the authors Paulay and Priestly describe that capacity design enables the designer to tell the structure what to do and to desensitize it to the characteristics of the earthquake (Paulay and Priestley 1992, 40). Ultimately, a ductile structure enables a building to survive a seismic event with some damage rather than spending higher design and construction costs to ensure the entire structure performs elastically. 2.3 Seismology and Seismic Factors Before an engineer is able to design structures for seismic resistance, he or she must first understand the seismic phenomenon being accounted for in the given design. As mentioned previously, earthquakes can be caused by a range of natural and man-made causes. The most common source of earthquakes involves the movement of tectonic plates composing the Earth s crust. At their boundaries, these plates collide, separate, and slide past each other which cause faulting or cracking in the earth s surface. The most common types of faults are normal faults, reverse faults, thrust faults, and strike-slip faults which are shown in Figure 1. Southern California is well known in the United States for the San Andreas Fault which is formed by the Pacific Plate and the North American Plate sliding past each other (Marshak 2007, 54), and therefore the frequency of earthquakes in this region is higher.

20 12 Figure 1: Types of Faults (Marshak 2007, 208) Displacement along faults is not continuous or smooth like one would see while stretching a piece of rubber or steel. Rather, the friction between fault surfaces resists movement and causes the build up of energy. When frictional forces can no longer resist movement, the fault surfaces slip, causing energy to be released is the form of an earthquake. A fault does not only have to occur at plate boundaries but can also cause earthquakes in the interior of a plate. For example, the largest recorded earthquake in the continental US did not occur along California s more famous San Andreas Fault but within the North American Plate at New Madrid, Illinois in 1811 (Paulay and Priestley 1992, 50). The amount of slip at a fault can vary from roughly 4 inches to 33 feet (Paulay

21 13 and Priestley 1992, 49). This magnitude of dislocation and the length of slip occurring along a fault ultimately determine the magnitude of an earthquake: A magnitude 5+ earthquake may result from fault movement over a length of a few kilometers, while a magnitude 8 event will have fault movement over a length as much as 400km (250 miles) (Pauley 1992, 53). The displacement caused at fault lines is not the primary concern of structural design: Of much greater significance is the inertial response of structures to the ground accelerations resulting from the energy released during fault slip, and it is this aspect that is of primary interest to the structural engineer (Paulay and Priestley 1992, 48). When an earthquake occurs, seismic waves are caused by the release of energy at the hypocenter, or the source of the earthquake below the earth s surface. These waves then propagate from the hypocenter and the epicenter, which is the projection of the hypocenter onto the ground surface. Shown in Figure 2, the four main types of seismic waves all cause different ground motion. Primary (P) waves are compression waves that radiate vertically from the hypocenter to the ground surface. Secondary (S) waves are vertical shear waves that cause lateral movement at the surface. Love (L) waves and Rayleigh (R) waves travel along the earth s surface with L waves causing lateral vibration and R waves causing motion similar to an ocean wave. It is the promulgation of these four waves that causes the most damage from earthquakes through ground accelerations.
22 14 Figure 2: Types of Seismic Waves (Marshak 2007, 227) One of the major factors that led to the development of extensive code provisions for seismic design was the ability of researchers to better study and classify earthquake ground motions. Early methods of classification focused mainly on the subjective
23 15 intensity levels of an earthquake and the extent of damage. The Modified Mercalli Intensity Scale, developed in 1902, is still used as a measure of earthquake intensity and consists of twelve levels of increasing intensity. A level two event is described as felt by persons at rest, on upper floors, and favorably placed while a level twelve event is described as having damage nearly total. Large rock masses displaced. Lines of sight and level distorted. Objects thrown in the air (Paulay and Priestley 1992, 707). The advantage of the Mercalli Scale is that, while subjective, seismic events can still be classified in areas that do not possess modern seismic technology. Today most earthquakes are classified with respect to their magnitude and ground acceleration. The Richter scale, developed in 1935 (Marshak 2007, 219) is the conventional measure of earthquake magnitude. The magnitude is determined with respect to the maximum amplitude of ground motion calculated during an event with a seismograph: For a calculation of magnitude, a seismologist accommodates for the distance between the epicenter and the seismograph, so magnitude does not depend on this distance, and a calculation based on data from any seismograph anywhere in the world will yield the same results (Marshak 2007, 219). The Richter scale is a logarithmic scale that relates the amount of energy released from an event, E, in ergs to its corresponding Richter magnitude, M, as shown in the equation below (Paulay and Priestley 1992, 52): log 10 E = M Equation 2 An earthquake magnitude on the Richter scale can range from less than five where little earthquake damage is sustained, to eight or greater which are classified as great earthquakes (Paulay and Priestley 1992, 53). The logarithmic scale also shows that for
24 16 an increase of 2 on the Richter scale, the energy of the earthquake has increased 1000 times. Yet, while the Mercalli and Richter scales provide earthquake intensity and magnitude, one of the most useful pieces of seismic data that can be collected for seismic design is the peak ground acceleration because it can be used to calculate the dynamic response of a building during a seismic event. Therefore, it is one of the major seismic factors used in design. 2.4 Earthquake Design Factors The most important advancement in seismic design was the ability of scientists and engineers to record the ground motion acceleration through the use of accelerographs: When mounted in upper floors of buildings, they record the structural response to the earthquake and provide means for assessing the accuracy of analytical models in predicting seismic response (Paulay and Priestley 1992, 54). The peak ground accelerations obtained can then be used to determine velocities, displacements, and induced seismic forces within a building structure. For most cases, engineers are concerned with the lateral ground acceleration as this parameter is likely to cause the most significant damage. The 1978 ATC report outlined that the effective peak acceleration (A a ) and the effective peak velocity related acceleration (A v ) would be used for the determination of seismic forces. Equations have been developed that can estimate the peak ground acceleration based on earthquake magnitude or seismic intensity using the Richter and Mercalli scales respectively. However, the most convenient method of determining peak ground acceleration is through using seismic charts or maps. Figure 3 details how these values are determined from response spectra, with the accelerations determined as the
25 17 trend slopes from the spectral velocity vs. period plot. Figure 4 depicts the seismic map developed by the United States Geological Survey for the 1978 ATC Report. Figure 3: Effective Peak Acceleration and Peak Velocity (ATC , 314) Figure 4: 1978 ATC 3-06 Contour Map (ATC , 316) Current design standards, such as the ASCE 7-05: Minimum Design Loads for Buildings and Other Structures published by the American Society of Civil Engineers (ASCE), use updated seismic maps in similar format to the original ATC report, a sample of which is shown in Figure 5. These maps show contours for the mapped maximum

26 18 considered earthquake (MCE), spectral response acceleration at short periods (S s ), and the mapped MCE spectral response acceleration at 1 second (S 1 ) (ASCE 7, 2005). Both charts also are standardized to consider accelerations for 5% critical damping and site class category B. The (MCE) accelerations are then used by the engineer to calculate the design ground motion acceleration for a particular project. The mapped ground motion acceleration is adjusted to establish the design ground motion acceleration in order to account for the influence of the building period and the influence of the soil and site conditions. The building period influences the lateral sway of the building during a seismic event as building with a higher period will experience a larger amount of lateral sway. Meanwhile, the site conditions of the soil will influence the response of the ground (and therefore the building) during the seismic event. Both of these parameters are discussed in further detail below. Figure 5: ASCE 7-05 Contour Map (ASCE7-05)

27 19 The condition of a building s site and soil is significant in earthquake design as solid rock will behave differently than clay or sand during a seismic event. This difference is illustrated in Figure 6 which compares the seismic acceleration response over time for rock and a lake bed during a 1965 earthquake in Mexico City. The top three acceleration time histories illustrate the high ground accelerations experienced by the lake bed while the bottom three histories for the rock display much lower accelerations. Figure 6: Rock and Lake Bed Ground Accelerations (Paulay and Priestley 1992, 56) Buildings on ridges can also experience greater ground acceleration as compared to buildings in valleys as the ridge or cliff can intensify the inertial response. Furthermore, direction of fault fracture toward a given site can also increase acceleration. Since fracture propagates from an initial point, a location downstream of the rupture propagation is likely to experience enhanced peak accelerations due to reinforcement interaction between the traveling shock waves and new waves released downstream as the fault propagates (Paulay and Priestley 1992, 57). The ATC initially outlined 3 soil profiles in its 1978 report along with a site coefficient for each class to be used to define seismic forces. ASCE7-05 now identifies
28 20 six site classes (A through F) and assigns site coefficients F a and F v based on site class and the value of S s. The site coefficient is then used to calculate the final ground motion acceleration for design. The MCE spectral response accelerations for short periods (S MS ) and at one second (S M1 ) are calculated as: S MS = S S F a Equation 3 S M1 = S 1 F v Equation 4 The design earthquake spectral response acceleration for short periods (S DS ) and at one second (S D1 ) are then determined as two thirds of S MS and S M1 respectively. S DS = 2 3 S MS Equation 5 S D1 = 2 3 S M1 Equation 6 ATC 3-06 also outlined a series of seismic performance categories and seismic hazard exposure groups. Seismic hazard exposure groups ranged from a level III for essential facilities which are necessary for post-earthquake recovery, level II for buildings with a large number of occupants or buildings in which the occupants movements are restricted, to a level I which accounted for all other buildings (ATC , 29-30). Based on this group assignment and a seismicity index determined from ground accelerations, a seismic performance category would be assigned with each category having a set of loading requirements (ATC , 29-30). Today, ASCE 7-05 replaces the seismic hazard groups with occupancy categories with essential facilities assigned the highest value of IV. Importance factors are then assigned to each category.
29 21 Seismic design categories are determined from tables that relate occupancy category, S DS, and S D1 (ASCE 7, 2005). In addition to the site and soil conditions, another characteristic of the building structure used in seismic design is its fundamental period of vibration (T). The fundamental period is the time it takes for a structure to sway laterally one full cycle and can be compared to the time it takes an inverted pendulum to return to its starting point after one cycle. The period depends on both the shape and stiffness of the structure. Imagining the building as an inverted cantilever beam, vibration would cause the cantilever to sway back at forth at some period based on the height and stiffness of the cantilever. Tall narrow buildings will have a longer period and experience larger sway than shorter, stockier buildings. The period therefore is important in characterizing the damped harmonic response of the structure, which also affects the calculation of inertial seismic forces. In design, the building period can either be calculated directly for a specific structure using a modal analysis or approximated using empirical equations from the building code provisions. ASCE 7-05 instructs that the fundamental period can be approximated as: T a = C t h x Equation 7 The h factor corresponds to the total height of the building, while the C t and x values depend on the type of structural system being used to resist lateral loads. These values can be determined from Table of ASCE 7-05 shown below in Figure 7 (ASCE 2005, 129). For buildings under 12 stories, ASCE 7-05 also allows for the period to be estimated as 0.1N, with N equal to the number of stories.
30 22 Figure 7: Coefficients for Approximate Fundamental Period (ASCE7-05) One final seismic factor focuses not on the seismic ground acceleration, site conditions, or the building period but rather on the ductility of the designed structure. It is advantageous to have a ductile structure in order for inelastic behavior to occur through deformation and to absorb inertial energy caused by seismic motion. This dissipation of energy aids in dampening the lateral response of the building and ultimately prevents collapse. Ductility also allows for seismic design forces to be reduced since a structure is not required to respond to ground motion with complete elastic behavior. The strength or response modification factor R captures the predicted ductility of a structure and incorporates it in the determination of seismic forces. Values for R were outlined for various types of lateral load resisting structural systems in the ATC report and were based on observation of past seismic performance: In selection of the R values for the various systems, consideration was given to the general observed performance of each of the system types during past earthquakes, the general toughness (ability to absorb energy without serious degradation) of the system, and the general amount of damping present in the system when undergoing inelastic response (ATC , 336). ASCE 7-05
31 23 continues the use of the response modification factor by outlining R values for structural systems in Table The determination of the R factor has been based partly on past seismic performance of structural systems and partly on analytical study. Paulay and Priestly illustrate in their book Seismic Design of Reinforced Concrete and Masonry Buildings that the strength modification factor can be related to the ductility and natural period of a structure. Alternatively, the R factor can be roughly approximated as a function of the ductility μ as shown on the plot between the seismic force and the displacement in Figure 8 (Paulay and Priestley 1992, 77). Figure 8: Relationship between R Factor and Ductility (Paulay and Priestley 1992, 77) m corresponds to the maximum displacement achieved before failure while y is the displacement at yielding. Figure 8a is characteristic of long-period structures and considers equal displacement between an elastic and ductile response. Therefore, the response factor R is directly related to the ductility ratio, μ. Meanwhile, the plot in Figure 8b is characteristic of short period structures and considers an equal amount of energy
32 between the elastic and ductile response. Figure 8b shows the ultimate force for the ductile structure as much lower than that for the elastic response yet the ultimate displacement is higher. The R factor is therefore not directly equal to the ductility ratio but instead related through the following equation: R = 2μ 1 Equation 8 Ultimately, once seismic factors are defined for both the design earthquake and the structure, a designer is able to calculate the seismic forces needed for designing and detailing a specified structural system to survive earthquake ground motion. 2.5 Earthquake Loading (The Dynamic Response of Structures) The response of a building during an earthquake can be classified as a very dynamic event. Ground accelerations at the base of the structure cause the building to sway back and forth like an inverted pendulum. The movement of the ground and the inertia of the structure cause shear forces to develop at the structure s base. The shear forces and displacements caused by this inertial movement in turn cause axial and rotational forces to develop within the structural elements of the building. If a structure is designed to be ductile, some energy caused by seismic action will be absorbed by inelastic behavior in structural components. In order to design structures to perform in this manner during a seismic event, engineers must be able to predict the seismic forces associated with a building s dynamic response for preliminary design Dynamic Response of Structures Theoretically, a building s seismic response can be modeled using principles from structural dynamics and mechanical vibrations. First the building can be modeled as a
33 25 multiple degree of freedom system as shown in Figure 9 with each story approximated as an equivalent mass and columns between stories acting as equivalent springs (Rao 2004, 31). This creates a spring-mass system that can be solved using the Newton-D Alembert principle. Figure 9: MDOF System for a Multi-Story Building (Rao 2004, 31) The Newton-D Alembert principle uses the equations of motion to define the state of equilibrium between the applied forces and inertia forces at any instance in time (Rao 2004, 111). Newton s Second Law can be applied in the form: F = mx Equation 9 F = mx + cx + kx Equation 10 For a multiple degree of freedom system, this equation would be written using vectors and matrices:
34 26 F = m x + c x + k x Equation 11 The variables x, x, & x, correspond to the lateral acceleration, lateral velocity, and lateral displacement respectively. The factor m refers to the mass of the building stories while the value of k corresponds to the lateral stiffness of the building s cantilever model. The factor c corresponds to damping effects found within the structure. Damping can be defined as the mechanism by which vibration energy is gradually converted into heat or sound (Rao 2004, 36). Friction is a common form of damping, either between two vibrating parts (Coulomb or Dry Friction Damping) or between an element and a surrounding fluid (Viscous Damping). However, the form of damping that is most significant in building structures is material hysteretic damping. Hysteretic Damping occurs when materials deform or experience inelastic behavior. This deformation absorbs vibration energy and therefore resists the lateral movement of the structure. If a stress-strain diagram was plotted for a material with hysteretic damping and subjected to cyclical loading, a hysteresis plot like that shown in Figure 10 would be developed: The area of this loop denotes the energy lost per unit volume of the body per cycle due to damping (Rao 2004, 37).
35 27 Figure 10: Hysteresis Plot Illustrating Cyclic Loading (Rao 2004, 37) Therefore, the ductility of the structure discussed before plays a significant role in the damping of the building during a seismic event. Referring back to the equation for the multiple degree of freedom system, the ductility of the structure would be factored into the value for the damping coefficient, c, which would reduce the force contribution from the inertial and spring forces into F. The more ductility present will create a larger damping force to resist inertial loading. Figure 11 illustrates hysteresis loops for various concrete and masonry elements. Figure 11a represents ideal ductile behavior while figures 11b through 11e display more realistic results (Paulay and Priestley 1992, 75). The hysteresis loop shown in figure 11f corresponds to an inelastic shear failure within a structural element and highlights a major concern for seismic design of reinforced concrete components. In many cases, a reinforced concrete member can fail prematurely in shear before the flexural reinforcement develops the plastic hinges required for significant levels of hysteretic damping. Therefore, transverse reinforcement of structural elements must be properly detailed to resist shears during lateral loading, especially at plastic hinge locations near member ends, in order for inelastic behavior to occur and avoid premature failure.
36 28 Figure 11: Typical Hysteresis Plots for RC-Elements (Paulay and Priestley 1992, 75) At the time of the 1978 ATC report on tentative seismic design provisions, two methods were principally available for developing the seismic response of a structure and calculating the seismic inertial forces on a building: the equivalent lateral force method and modal analysis. Modal analysis consists of approximating the building as a multidegree of freedom system and using structural dynamic theory to determine response. This method can be time consuming for larger buildings. The equivalent lateral force method traditionally found in building codes (ATC 1984, 375), idealizes forces acting on a structure at each story level using proportions of the base foundation shear. This allows for the use of a static force analysis approach and can therefore be more easily applied by engineers in the design process.
37 Equivalent Lateral Force Method The equivalent lateral force method (ELFM) centers around the calculation of the base shear force caused by the building s inertial response to seismic action at the foundation level. As the ground moves in one direction, the inertia of the building s floors resists the motion, which in turn, causes lateral displacements at each story level and a horizontal reaction or shear force at the base supports of the structure. As the floor level displaces, the connecting columns and ultimately the supports below the story try to overcome the floor s inertial resistance to the ground motion, which causes internal member forces. The ELFM idealizes this inertial resistance at each story level by applying an equivalent lateral seismic force as shown in Figure 12 to move each floor laterally from the top down, rather than moving the ground laterally from the bottom. The ELFM ultimately captures the first modal shape of the building without having to conduct a modal analysis and allows a static analysis approach to be used for the determination of internal forces, shears, moments, and displacements for design. Figure 12: Lateral Forces at Each Story Using ELFM
38 30 The provisions of ASCE7-05 calculate the base shear force as the multiplication of the building weight with a seismic coefficient as shown: V = C s W Equation 12 The building weight W meanwhile is used to accounts for the inertia of the building. It refers to the weight of the structure that would be anticipated during a seismic event. This would include the dead weight of the structure, the weight of all floor partitions, and the weight of all tanks and permanent equipment in the building (MacGregor et al 2005, 1000). Additionally, a minimum of 25 percent of the building s live load must also be applied to account for possible occupants at the time of the event. Furthermore, in applicable areas of the country, 20 percent of the design snow load must be included in the weight. The seismic coefficient, Cs, accounts for the soil and site conditions, the design ground acceleration, and the fundamental period and ductility of the building. It seeks to characterize how the weight of the building will respond to a seismic event. The ASCE 7-05 specification describes the factor as follows: C s = S DS R I Equation 13 The formula shows that the seismic factor is a function of the design seismic spectral response acceleration (S DS ) for short periods which takes into account the site conditions; the response modification factor which involves the building s ductility; and the importance factor. It can be noted that as the structure becomes more ductile (with a higher R value), Cs decreases and the required design forces are less. Meanwhile, as a
39 31 structure is deemed more important (with a higher I value), Cs increases and the required design forces are larger. ASCE 7-05 also specifies maximum and minimum values for the seismic coefficient which include the contribution of the fundamental period in the seismic response: C s = S D1 T( R I ) for T T L Equation 14 C s = S D1T L T 2 ( R I ) for T > T L Equation 15 This equation makes use of the design earthquake spectral response acceleration for 1 second (S D1) instead of (S DS ). Furthermore, in addition to the fundamental period of the structure T, the long period transition period (T L) is also used. This value is determined using the seismic figures of Chapter 22 in ASCE Ultimately, a higher period value will decrease the value of the seismic coefficient as a higher period implies greater flexibility in the structure (ATC , 363). Furthermore, ASCE 7-05 requires that the seismic coefficient should not be less than 0.01 (ASCE7 2005, 129). Once the base shear has been calculated for the entire building, the effect of this shear must be distributed among the various stories of the building in the form of lateral story forces. The lateral seismic force at each story is calculated as a proportion of the base shear with respect to the weight and height of the floor as defined in the following equation (ASCE7 2005, 130): F x = C vx V Equation 16 with C vx = w k xh x i w i hk 0 i Equation 17
40 32 The term C vx is used to determine the proportion of the current story weight (w i ) and height (h i ) to the sum of story weights and heights. The exponent k is determined with respect to the structure s period (ASCE7 2005, 130). Based on this equation and the fact that the ELFM is capturing the first modal response of the structure, the top story of the building will most likely have the largest seismic loading because this story will experience the most lateral movement during an event. As a check, the lateral story forces should sum to the value of the base shear, V. These story forces can now be used to calculate forces and deflections within the lateral load resisting system. In addition to the lateral forces acting on a structure, the deflection and stability of the structure must also be calculated for a seismic event. Specifically, ASCE 7-05 outlines permissible values for the design story drift and the stability factor. The design story drift ( ) is determined as the difference in lateral deflection (δx) between the top and bottom of a specific story as shown in Figure 13. Figure 13: Story Drift Determination (ASCE7-05)
41 33 The allowable deflection is determined as: δ x = C dδ xe I Equation 18 The factor (C d ) is an amplification factor based on the flexibility and ductility of the structure; it is determined along with the modification factor R from Table in ASCE A more ductile structure will therefore be allowed a larger design deflection. The deflection (δ xe ) corresponds to the lateral deflection calculated by an elastic analysis, while the factor (I) refers to the importance factor of the building. A more important structure will therefore have a lower allowable deflection. The stability of the structure is represented by a stability factor θ, which considers possible P- effects on the shears and moments in the structure. P- effects occur from the horizontal displacement of vertical loads in the structure. This eccentricity must be accounted for in the shears and moments of the structure and therefore requires a secondorder analysis. However, these effects can be ignored if the stability factor outlined in ASCE 7-05 is less than 0.10 (ASCE7 2005, 132). The factor θ for a given level x is defined by the following formula: θ = P x V x h xx C d Equation 19 The factor (P x ) corresponds to the vertical loading above the specified level x while ( ) is the story drift at the level. (V x ) is the shear value acting between the story and the story below it, while (h xx ) is the story height in inches. The factor of θ must also not be greater than: θ max = 0.5 βc d 2. 5 Equation 20
42 34 If the value of θ is greater than 0.10 but less than θ max, displacement and forces within the structure are to be multiplied by a factor of θ (ASCE7 2005, 132). However, if θ is greater than the maximum, the structure is potentially unstable and must be redesigned (ASCE7 2005, 132) Dynamic Modal Analysis While the Equivalent Lateral Force Method is the method most often used in the seismic design process due to its easy application, the provisions of ASCE 7-05 also allow for the use of a dynamic modal analysis to determine seismic forces. Modeling a structure as a multiple degree of freedom system, the natural modes of vibration can be determined and then superimposed to predict the dynamic response: Its advantage lies in the fact that generally only a few of the lowest modes of vibration have significance when calculating moments, shears and deflections at different levels of the building (Paulay and Priestley 1992, 80). The modes of vibration can be used to determine modal displacements and forces, which combine to describe the structural response of the building. ASCE 7-05 goes further to specify that sufficient modes must be considered in order for 90 percent of the structure s modal mass to be accounted for in the dynamic response (ASCE7 2005, 132). Modal displacements determined from the analysis are then used to calculate the base shear value and the lateral design forces for each mode of vibration. The modal displacement at a building floor ( in ) and the weight of a building floor (W i ) are used to calculate the effective weight of the building for each mode of vibration: W n = W i 2 in W i 2 Equation 21 in
43 35 The base shear value for a particular mode is determined using the effective weight and a modal acceleration coefficient C E (Paulay and Priestley 1992, 81): V = C E W n Equation 22 Much in the same way that it is used in the ELFM, the base shear is then used to determine the lateral force at each story of the structure for each mode of vibration. The lateral forces are calculated as a proportion of the base shear. The proportion is determined by the effective weight and modal displacement Δ mn at each story. This is illustrated with the expression (Paulay and Priestley 1992, 81): F mn = V W m mn W i in Equation 23 Since this lateral force only refers to one specific mode of vibration, it must be combined with the forces from other modes in order to characterize a full dynamic response of the structure. ASCE 7-05 specifies two acceptable procedures for superimposing forces from multiple modes of vibration: the square-root-sum-of-squares (SRSS) method and the complete quadratic combination (CQC) method. The SRSS method simply involves calculating the resultant forces at each story as a sum of the squared forces from each mode of vibration: F m = i 2 0 F mi Equation Alternatively, the complete quadratic combination includes the use of a cross-modal coefficient (ρ ij ), rather than simply squaring the lateral force for each mode: F m = i j 0 0 F mi ρ ij F mj Equation 25
44 36 The cross-modal coefficient ρ ij is a function of the duration and frequency of the earthquake content, modal frequency of the building, and damping within the structure (Paulay and Priestley 1992, 82). Before the wide spread use of computers and finite element software, the modal analysis procedure would have required much more calculation on the part of the engineer than the ELFM. Therefore, the latter approach became the predominant technique for calculating seismic forces. Even today with the availability of finite element software, a modal analysis is still time consuming since an engineer must develop an accurate finite element model in order to simply calculate the modal shapes. However, modal analysis does allow the engineer a second method for calculating forces if a comparison with the results from the ELFM is needed Dynamic Inelastic Time-History Analysis The dynamic response of a structure can also be determined through the use of a dynamic, inelastic, time-history analysis. This is a sophisticated approach for determining forces and displacements which involves solving a multiple degree of freedom system at various time increments over a specific time history (Paulay and Priestley 1992, 80). ASCE 7-05 does not specifically outline this procedure for design since it is sophisticated and can be rather time consuming for engineers working on preliminary designs. However, dynamic analysis can alternatively be used as a research tool due to its considerable value in verifying the anticipated response of important structures after detailed forces and displacements are defined by less precise analytical methods (Paulay and Priestley 1992, 80). Therefore, dynamic analysis can be a powerful tool for not only
45 37 validating the performance of a specific finalized building design but also for researching the overall effectiveness and performance of current building code provisions. Of the many techniques available for determining the seismic response of the building, the Equivalent Lateral Force Method has proven to be the best procedure for practicing engineers to use for preliminary design. However, with the aid of advanced computer capabilities and new software programs, dynamic analysis is now being used to obtain a validation of designs developed using the ELFM and also to assess the code provisions being used for design. Overall, performance-based engineering practices and assessments are being researched for seismic design in order for code provisions to better account for dynamic structural responses of buildings. 2.6 Performance-Based Earthquake Engineering The goal of performance-based design involves designing structures and components in order to meet a specified level of performance rather than designing in order to fulfill a prescriptive list of specifications. While most practicing engineers still look to typical code provisions during design, performance-based methods such as dynamic analysis can be used as a supplement to preliminary design. With an increase in the availability and use of computer simulation and analysis software, dynamic analysis is also seeing greater use as a research tool, especially with respect to seismic design and performance. Computer software allows for the nonlinear dynamic response of a specific structure to be modeled and analyzed rather than deal with more strenuous manual calculations and iterations. With respect to seismic design, the use of computer aided analysis is advantageous because earthquakes and building structural response can now be simulated with no threat to human life based on recorded ground motion histories.
46 38 Previously, structural response could only be observed during actual seismic events: Advancements of the past two decades in earthquake risk assessment and performancebased engineering are making it possible to rigorously evaluate the collapse safety of buildings under earthquake ground motions (SEAOC, 2007). Such advancements include a probabilistic framework to relate seismic performance to ground shaking intensity, a probabilistic approach to assess building collapse using nonlinear timehistory analysis, and analysis models and criteria to simulate building performance from the onset of damage up to collapse (SEAOC, 2007). The Applied Technology Council (ATC) along with the Pacific Engineering Earthquake Research (PEER) Center at the University of California Berkeley is currently working on developing a methodology to assess current building code provisions through the use of performance-based seismic analysis. The ATC-63 project entitled Recommended Methodology for Quantification of Building System Performance and Response Parameters sets out to accomplish four major functions: The ATC-63 project provides a systematic method to assess collapse safety for the purpose of assessing the adequacy of structural design standards and building codes (ATC ) Among the distinguishing aspects of the ATC-63 approach are (a) the introduction of building archetypes to assess the collapse safety of general classes of building seismic systems, (b) integration of nonlinear analysis and reliability concepts to quantify appropriate capacity margins, measured relative to the maximum considered earthquake intensity, (c) quantifying uncertainty parameters in building code provisions for seismic resisting systems, and (d) specification of a set of ground motions and scaling procedures to represent extreme (rare) ground motions (SEAOC 2007). The major steps involved in applying the draft ATC-63 methodology are outlined in the flowchart of Figure 14. First, a determination is made on the structural system and the structural component behavior, such as ductile reinforced concrete moment-resisting frames or steel section braced frames. This is followed by the establishment of design

47 39 provisions and code requirements that will be used in the model design. Design provisions include typical specifications found in ASCE7-05, and IBC 2006, as well as ACI 318 for concrete, or the AISC Specification for steel sections. Typical building frames or archetype models are then developed for study based on common engineering practice and established design provisions. Next, nonlinear analysis is used to model the collapse performance of the models during simulated seismic events. Finally, performance results are then assessed against acceptable benchmarks for a model and insight is gained into the overall performance of current design provisions. Figure 14: Schematic Flowchart of Draft ATC-63 Methodology (SEAOC 2007) Applying the draft ATC-63 methodology and the performance-based earthquake engineering methods developed by PEER, a 2006 study presented at the 4 th International Conference on Earthquake Engineering (ICEE) entitled The Effectiveness of Seismic Building Code Provisions On Reducing The Collapse Risk of Reinforced Concrete Moment Frame Buildings by Dr. Abbie B. Liel, Dr. Curt B. Haselton, and Dr. Gregory G. Deierlein along with a 2007 paper presented at the Structural Engineers Association of
48 40 California (SEAOC) convention entitled Assessing Building System Collapse Performance and Associated Requirements for Seismic Design by Deierlein, Liel, Haselton, and Kircher have focused on the seismic performance of reinforced concrete moment-resisting frames. The ultimate intent of the research is to determine the adequacy of the code requirements for reinforced concrete provisions. The 2006 ICEE study involved the design and modeling of four reinforced concrete moment-resisting frames: a reinforced concrete frame based on 1967 design provisions, a special moment frame, an intermediate moment frame, and an ordinary moment frame. The latter three frames were all designed based on 2003 code provisions. The dimensions and design scheme for all four of the frames are shown in Figure 15. The three bay frame was judged to be the minimum number of bays necessary to capture effects such as overturning forces in columns and a mix of interior and exterior columns and joints (SEAOC, 2007). Figure 15: Reinforced Concrete Design Frame Scheme Each frame design was modeled in order for its performance to be analyzed using nonlinear dynamic analysis. The models were created and analyzed using the software Open System for Earthquake Engineering Simulation or OpenSees, which was developed at the University of California. OpenSees is described as a software framework for
49 41 simulating the seismic response of structural and geotechnical systems (OpenSees, 2009) and allows researchers to build onto the software in order for it to be adapted to their current studies. For modeling purposes related to structural frames, OpenSees provides beam-column elements and continuum elements to be used in analysis of a structure along with joint elements composed of five inelastic springs. The software offers nonlinear static and dynamic methods, equations solvers, and constraint methods for use during a nonlinear analysis. Additionally, the models also includes finite size beam-column joints that employ five concentrated inelastic springs to model joint panel distortion and bond slip at each face of the joint; and elastic semi-rigid foundation springs (Liel et al, 2006). The beam-column elements used in the OpenSees model for the frame study are shown in Figure 16. The elements include lump plasticity parameters where the plastic hinges and ductile behavior are envisioned to be at each end of the member. Figure 16: Inelastic Hinges within model beam-column element (SEAOC 2007) Additionally, the beam-columns in the model take into account the deterioration of strength and stiffness over time. This is accomplished using hysteretic models developed by Ibarra, Medina, and Krawinkler. In the 2005 study entitled Hysteretic Models that incorporate strength and stiffness deterioration, Ibarra, Medina, and Krawinkler studied bilinear, peak-oriented, and pinching models for structural elements and modified these models to include deterioration effects (Ibarra et al, 2005). The models developed for the
50 42 study used load and deformation data for steel, plywood, and reinforced concrete specimens and graphed the hysteresis plots for each type of component. Figure 17 illustrates the hysteresis plot for a reinforced concrete column specimen from the Ibarra study. The Ibarra study then used the results of the cyclic behavior to identify the governing parameters for strength and stiffness deterioration. The study isolated the nonlinear, monotonic backbone curve in order to define the increasing deformation response (Ibarra et al. 2005). Shown in Figure 18, the curve is defined by five main parameters: the yield and ultimate strength, the initial stiffness Ke, the strain hardening stiffness Ks, the capping deformation δc. Figure 17: Hysteresis Plot including Deterioration for RC-Column (Ibarra et al. 2005)
51 43 Figure 18: Backbone Curve (Ibarra et al., 2005). Figure 19: Hysteresis Response and Backbone Curve for 2006 and 2007 PEER Studies
52 44 For the 2006 and 2007 PEER studies, the OpenSees model used seven parameters for the nonlinear model: the moment capacity at yield My, the rotational capacity at yield θy, the pre-capping slope Ks which equals Mc/Myθ, the plastic rotational capacity θcap, the ultimate rotational capacity θult, and the post-capping slope Kc (Liel et al, 2006). This is shown in Figures 18 and 19. These parameters were used to define the beam-column elements within the OpenSees model in order for the model to capture the progressive deterioration of ductile structural components, in this case reinforced concrete components, over time and ultimately to determine when collapse occurs in the system. This mode of thought can also be applied to the inelastic springs in the joint elements which are capturing the stiffness and strength deterioration of the component over time. With the use of these elements, the model can more accurately capture the building s collapse response during the earthquake simulation. OpenSees simulates the seismic performance of a specific building frame by using current records of earthquake ground motions and incremental dynamic analysis. First, the software uses ground motion acceleration spectra collected from 44 major western earthquakes in order to simulate a seismic event. Next, ten plausible collapse mechanism scenarios (five vertical and five lateral) are identified for the reinforced concrete moment frame such as the formation of a soft-story mechanism and recognized by OpenSees during the collapse analysis. These ten scenarios of potential failure are outlined in Figure 20.

53 45 Figure 20: Possible Collapse Scenarios for RC-Frame (Liel et al, 2006) OpenSees, with the aid of MATLAB for computation and post-processing, uses the collapse scenarios and earthquake ground motion records to conduct an incremental dynamic analysis. An incremental dynamic analysis involves determining the dynamic response of a model at stages during the simulation. For the seismic simulation, it is a technique to systematically process the effects of increasing earthquake ground motion intensity on structural response up to the point of collapse (SEAOC, 2007). Physically, OpenSees simulates the building s response to each of the 44 earthquakes in the OpenSees record, namely the response to the ground motion spectra or time history. For each earthquake signature, the software begins by applying a small magnitude of the ground acceleration signature to the frame and the dynamic response is determined; specifically the maximum lateral deflection difference between any two stories or interstory drift is calculated. If any one of the ten collapse mechanisms is observed, the building is said to have collapsed. If no collapse mechanism is observed, the software
54 46 then scales the earthquake signature and applies a higher increment of ground acceleration to recalculate the inter-story drift and investigate collapse. This iterative process, illustrated in Figure 21 by inter-story drift, continues for each set of earthquake data until a collapse mechanism is detected in the structure (i.e. significant inter-story drift between iterations for lateral collapse). It is at this point that the simulation considers the building to have collapsed and moves onto the next earthquake spectra record. Figure 21: Illustration of inter-story drift and determination of a soft-story mechanism After the completion of the nonlinear dynamic analysis and earthquake simulation for a frame, the governing structural modes of failure can be illustrated schematically through the use of MATLAB. For the 2006 ICEE SMF study (Liel et al, 2006), 40% of the collapses were shown to be caused by the formation of a soft-story mechanism at the third story as illustrated in Figure 22 below. Overall, 69% of the failure modes were softstory mechanisms.

55 47 Figure 22: Modes of Failure for SMF Study However, in addition to the governing failure mode of the structure, the major data output for the earthquake simulation and dynamic analysis is the ground acceleration at which collapse occurs and how it compares with the acceleration values used in the structural design. Figure 23 shows a plot of the ground acceleration and the corresponding inter-story drift ratio (Drift of Upper Story/Drift of Lower Story). The parameter of interest is the median collapse level acceleration S CT or the ground acceleration at which 50% of the model iterations of the frame collapsed. The collapse acceleration S CT is compared with the maximum considered earthquake (MCE) spectral ground acceleration S MT used in the design process based on code provisions. This is accomplished through the collapse margin ratio (CMR) which is given by S CT / S MT. The ratio in Figure 23 illustrates that the building frame will collapse at a much higher level of ground acceleration than the value used in design.
 If plotted as a time-history, each of the ground motion acceleration records used in the study has a different spectral shape.")
56 48 Figure 23: Illustrative Incremental Dynamic Analysis Results (Peak Ground Acceleration vs. Inter-story Drift) If plotted as a time-history, each of the ground motion acceleration records used in the study has a different spectral shape. For certain rare ground motions, the time history is characterized by a very high peak acceleration occurring in the initial seconds and then quickly dropping in intensity. In contrast more frequently occurring time histories have lower peak accelerations which decrease more gradually over time. The quick drop in rare ground motion intensity can ultimately aid in a building s structural response. Since the median collapse level acceleration may correspond to a rare ground intensity value during an earthquake, the variability of ground motion intensity or ε must be accounted for in the modeling: When scaling ground motions to represent extreme (rare) shaking intensities for a certain period range (typically near the fundamental vibration mode), it is important to consider this so called ε-effect or spectral shape effect. In nonlinear IDA simulations, this effect can be included by either (a) choosing ground motions that have positive ε values at the predominate period that defines
57 49 the ground motion hazard, or (b) adjusting the collapse fragility to account for the spectral shape effect (Deierlein et al, 2007). Therefore, the CMR value must be adjusted in order to account for variability in the spectral shape of the ground motion accelerations. As shown in Figure, the CMR is multiplied by a spectral shape factor (SSF) that strives to account for the drop off in intensity for rare ground motions. This calculation determines the adjusted collapse margin ratio (ACMR). It can also be noted in Figure that the CMR and ACMR correspond to a collapse probability of fifty percent, or the ground acceleration value at which half of the frame model iterations demonstrated collapse. Figure : Adjusted Collapse Margin Ratio Once the ACMR is determined for a given design, the collapse results for the reinforced concrete moment frames could then be compared to acceptable benchmarks developed for the draft ATC-63 methodology. Specifically, acceptable minimum values of ACMR are determined for each type of frame based on modeling uncertainty and collapse uncertainty. The study by the PEER researchers found that the 2003 code conforming moment frame had twice the collapse capacity of the 1967 moment-resisting
58 50 frame (Liel et al, 2006). Meanwhile, the SMF, IMF and OMF had collapse probabilities at the MCE spectral acceleration of 17%, 20% and 12% respectively. The SMF was later redesigned using 2005 ACI provisions and matched against acceptable ACMR benchmarks. This study found that all but two of the SMF design sets passed with an experimental ACMR greater than the minimum allowable ACMR, which based on this analysis means that the criteria for SMFs may be deficient. Furthermore, the draft ATC- 63 methodology was used to illustrate the importance of the static overstrength factor and the minimum base shear requirement in design. The researchers found that there was a large difference in collapse performance between frames designed for the ASCE 2002 minimum base shear and the lower ASCE 2005 minimum based shear and based on this ATC 63 project finding, the ASCE 7 committee has recently issued an addendum to reinstitute the minimum base shear requirement of the previous 2002 edition (SEAOC, 2007). Overall, the study being conducted by PEER researchers as part of the draft ATC- 63 methodology has illustrated the use of nonlinear analysis and earthquake simulation for evaluating current seismic design provisions for structures, specifically for reinforced concrete moment-resisting frames. While still dependent on practical engineering judgment to determine the effect of uncertainties within the model, the methodology and procedures aid in promoting consistency in comparing the relative safety between alternative systems and the effectiveness of various design provisions (SEAOC, 2007). It is the hope of the researchers that the results of this study can be used further in developing safer and more effective seismic building codes.
59 Lateral Load Resisting System The selection of the lateral load resisting system (LLRS) for a building structure is a key decision in seismic design. Not every structural component in a building is designed to resist seismic loads. Rather, some building elements are designed only for gravity or vertical loads. The LLRS includes the components selected by the designer to resist the lateral forces acting on the building. The selection of this system depends on many factors: the preference of the designer, design specifications, the construction materials, costs, and the height of the structure. ASCE7-05 outlines the selection of available lateral load resisting systems based on the overall height limitations for each type of system along with the applicable seismic design category in Table The most common forms of LLRS are structural shear walls, structural diaphragms, and frame systems. Structural shear walls and diaphragms are often used in masonry, concrete, and wood construction. Horizontal floor diaphragms as shown in Figure 25 below transmit lateral loads to the structural shear walls. Composed either of a concrete floor slab along with steel joists; or a wood floor supported by wood joists; the diaphragm acts as a wide, flat beam in the plane of the floor or roof systems (MacGregor et al 2005, 959). One concern in design is that holes in the form of stairwells, vertical chases for utilities, and elevator shafts, must not reduce the area and, in turn, the loading capacity of the diaphragm significantly. The structural shear wall, as shown in Figure 25 below, collects lateral forces acting in the direction of its length in order to brace the rest of the building.
60 52 Figure 25: Typical Horizontal Diaphragms and Shear Walls (MacGregor 2005, 959) The wall will resist not only lateral translation in its plane but also resist overturning moment about its strong axis. Often located on the exterior of the building, its ability to resist lateral loads comes from the shear resistance within its element (i.e. masonry, brick, or wood). Again, one concern in design is the amount of holes placed within a shear wall in the form of openings for windows and doors because these ultimately reduce the amount of area in which the required shear resistance can develop. A series of transverse shear walls within a building along with horizontal diaphragms at each floor is classified as a bearing wall system. This form of LLRS is often seen in apartment buildings and hotels since solid shear walls can serve to divide apartments or suite of rooms (MacGregor 2005, 952). The other common type of LLRS is a frame system composed of either a braced or moment-resisting frame. Framing systems are composed of horizontal girder elements, vertical columns and joint connections that can transmit lateral loads in addition to gravity loads. These systems are often constructed using structural steel or concrete
61 53 members. Braced frames make use of diagonal braces as shown in Figure 26 and truss action to transmit lateral loads to the ground through axial forces in its members. This configuration is advantageous for steel construction as only pinned connections are required, which reduces welding and connection costs. The braces also perform well in preventing significant sway. Figure 26: Steel Braced Frame Finally, a moment-resisting or unbraced frame shown in Figure 27 is used most often in buildings between 8 to 10 stories (MacGregor 2005, 951). Lateral loads are transmitted through axial force, shears, and bending moments within its girders, columns, and joints. The frame can be placed either on the perimeter of a structural system
62 54 (perimeter frame) or throughout the system (space frame) since no braces, which limit open floor space, are used. Figure 27: Unbraced Moment-Resisting Frame Lateral deflection or sway is much greater in a moment-resisting frame due to its lack of braces, yet the flexural action that produces this deflection can allow for ductility in seismic design. This system is often seen in reinforced concrete construction as the connections between reinforced concrete girders and columns are cast-in place as monolithic joints with sufficient reinforcing steel to resist moment. Steel moment frames require special rigid connections to be designed at joint locations, which could increase fabrication and erection costs.
63 Design of Reinforced Concrete Moment Frames The focus of this study is on the design and performance of reinforced concrete moment-resisting frames during a seismic event. As stated previously, reinforced concrete frames resist lateral loads through axial forces, shears, and moments in their girders, columns and rigid joints. Its strength and ductility arise from the combination of concrete and reinforcing steel that resist compressive and tensile forces respectively. Ductility is concentrated in areas of inelastic behavior within the frame, often taking the form of plastic hinges in girders or beams. These hinges absorb seismic energy and provide damping in the dynamic response of the building. One of the key factors in the design of these frames is the ability of a component to develop inelastic behavior without causing collapse, usually in the form of panel shear failures. Paulay and Priestly discuss in the text Seismic Design of Reinforced Concrete and Masonry Structures that failure can occur in two major forms: a soft-story mechanism and confinement failure (Paulay and Priestley 1992, 3-8). A soft-story mechanism is formed when a building translates with respect to the one story only as shown in Figure 28. If the large shear and moments cannot be resisted at this level, the building can potentially collapse about the story: this often results (at the first story) from a functional desire to open the lowest level to the maximum extent possible for retail shopping or parking arrangements (Paulay and Priestley 1992, 3).
64 56 Figure 28: Soft-Story Mechanism (MacGregor et al 2005, 998) Alternatively, confinement failure involves structural components either under confined or over confined. First, Figure 29 illustrates a reinforced concrete column that was abutted on either side by a partial masonry wall. During a seismic event, the column was intended to contribute to the inelastic behavior of the LLRS by deforming with the rest of the frame. However, the strength of the masonry wall unintentionally braced the column from moving: The column (was) stiffened in comparison with other columns at the same level, which may not have adjacent infill attracting high shears to the shorter column (Paulay and Priestley 1992, 4). This caused a shear failure in the column.

65 57 Figure 29: Confinement Failure of Column (Paulay and Priestley 1992, 5) Situations of under confinement can occur when components of the structural frame have insufficient reinforcement to prevent shear or buckling failure. Figure 30 illustrates a column that has buckled under seismic compressive loads due to insufficient transverse reinforcement. Figure 31 displays a reinforced concrete joint that has failed due to a lack of confining shear reinforcement. Figure 30: Confinement Failure of a Column (Paulay and Priestley 1992, 4)

66 58 Figure 31: Joint Failure (Paulay and Priestley 1992, 8). Overall, a reinforced concrete frame must be properly confined so that inelastic behavior and ductility can be achieved during a seismic event. In an effort achieve this level of confinement, the American Concrete Institute Committee 318 (ACI-318) has developed seismic provisions for the design and detailing of reinforcement concrete frames. 3.1 Categories of Reinforced Concrete Moment Frames The original 1978 ATC 3-06 report identified two forms of reinforced concrete moment frames: an ordinary moment frame and a special moment frame. Today, in addition to these original two categories, requirements have also been defined for a third intermediate moment frame (IMF) category. Use of a specific concrete frame is dependent on the seismic design category of the building and the building height. Meanwhile, selection of the concrete frame affects building design parameters ranging from design forces to detailing requirements. Table of ASCE7-05 outlines which seismic design categories and building height allow the use of specific buildings frames. For example, and intermediate moment frame has no limitation on height for design
67 59 categories B and C, but is not permitted to be used for categories D, E, and F. Meanwhile, the publication by ACI Committee 318 entitled Building Requirements for Structural Concrete and Commentary 2005 outlines the detailing requirements for concrete joints and members. Historically, these design requirements have been based on past observation and experience, yet with the aid of computer software and dynamic analysis techniques, research is being conducted to better understand and define the response of IMF structures. Currently, much of this research has been on buildings in high seismic areas, yet, the goal of this project is to investigate requirements for areas of moderate seismic activity. 3.2 Intermediate Moment Frames As mentioned above, selection of the concrete moment frame category is based on the building s seismic design category, total height, and the judgment of the designing engineer. Each category has varying levels of detailing requirements and different parameter values used in the determination of design forces and displacements. In order to better understand intermediate moment frames, the other two categories of moment frames must also be defined. First, ordinary moment frames (OMF) are designated for areas with historically low seismic ground acceleration. The lower ground acceleration then reduces the lateral seismic loading on the structure. The ductility of the structure is also affected with a relatively low value of the response modification factor R equal to 3, which corresponds to a limited amount of ductility in the structure. Since less seismic energy is absorbed through inelastic behavior, the OMF must resist higher seismic forces elastically. Therefore, the lower R factor is ultimately used to increase seismic design forces. Since
68 60 additional ductility is not required in the OMF, ACI-318 does not identify special seismic requirements for its design and detailing. Meanwhile, the special moment frame (SMF) is designed as the opposite to the OMF with large ductility for areas of high seismicity. In terms of lateral design forces, the design ground motion Sa is much higher for a special moment frame. However, the structure is designed for ductile behavior to dampen the response of the structure, which means that the magnitude of the design lateral force can be reduced. This reduction is accomplished through the designation of a higher R value of 8. In order for substantial ductile behavior, ACI-318 outlines seismic detailing requirements for beams, columns, and joints in the SMF. Finally, intermediate moment frames (IMFs) were added to seismic provisions in order to account for areas of moderate seismic activity. Since some of the seismic energy is absorbed through inelastic behavior, the value of the R factor is determined to be five, which is between the OMF and SMF. This allows for some reduction in the magnitude of the design seismic forces in comparison to those for an OMF. As a result, ACI-318 outlines detailing specifications for beams and columns in the frame in order to produce the appropriate ductile behavior. Table 1 compares the various design parameters and requirements for each of the concrete moment frames.
69 61 Strength Modification Factor R ASCE7-05 Table 1: Comparison of Concrete Moment Frame Parameters Comparison of Frame Requirements for Seismic Design System Deflection ACI ACI Overstrength Amplificatio Seismic Seismic Factor, Ω o n Factor, C d Req. Req. ASCE7-05 ASCE7-05 for Beams For ACI Seismic Req. for Joints ACI Ref. Columns SMF Yes Yes Yes Chapters 1-18&22 Sections IMF Yes Yes No Chapters 1-18&22 Section 21.3 OMF Yes No No Chapters 1-18, 21.2, & 22 The table illustrates how the specifications for the IMF have been developed, through observation and past experience to fall within the SMF and OMF values. Again, it is the hope of this project to study the performance of these parameters in order for resulting data to contribute to future updates in the criteria. However, before the IMF parameters can be studied, a description must be given on the design of IMF components. 3.3 Flexural Design of Members Reinforced concrete can be considered as one of the earliest composite materials. It achieves its effectiveness by harnessing the strength of both concrete and steel. Concrete works well in compression and is economical to produce, while steel works well in tension. The design of a flexural member, such as the one shown in Figure 32 is therefore based on the internal moment couple between these two materials. The loading on the beam causes positive bending where tensile stress is developed on the bottom of the beam and compressive stress is developed within the top of the beam. Ultimately, the tensile stresses cause the concrete to crack as shown and hence the steel reinforcement is required to carry the tensile force.
70 62 Figure 32: Beam Cross Section with Strains and Forces (Wang et al 2007, 50) The cross section of the beam is shown in Figure 32a along with the strain and stress diagrams (Figures 32b and 32c). The figures illustrate that a concrete compression zone with a concrete compressive strength of f c develops in the top portion of the beam to carry the compressive stresses, while the area of steel reinforcement (As) with a yielding strength of fy is assumed to carry the entire tension force. Realistically, the compressive stress distribution in the top zone is nonlinear from the top of the beam to the neutral axis. However, C. S. Whitney developed an approximate compressive stress block in the 1930s that could be used to represent the actual nonlinear stress distribution in the concrete (Wang et al 2007, 47). This is shown in Figure 32c. The flexural capacity is then determined by considering C=T and calculating the moment about the top of the member: C = 0. 85f c ba Equation 26 T = A s f y Equation 27 a = A s f y /0. 85f c b Equation 28 M n = A s f y (d a/2) Equation 29
71 63 Flexural members support load through the use of these internal moments and shears, which will be discussed later. Therefore, the design of a flexural member is first centered on the stipulation that the moment capacity of the member must be greater than the factored moment caused by loading or: øm n M u Equation 30 If axial load is present in the member, as in the case of beams within a lateral force resisting frame, the member can still be designed as a flexural member if: Pu < A g f c /10 Equation 31 (ACI ) Otherwise, the members must be designed as beam-columns which will be discussed in the next section. While the example given corresponds to a simple beam design, the design of beams within reinforced concrete moment-resisting frames usually involves the consideration of a continuous beam as shown in Figure 33. This continuous beam is considered one monolithic element due to the rigid joints at column and beam intersections. The formation of these rigid joints is facilitated by the continuous placement of concrete during construction (Wang et al 2007, 287). Therefore, the member must not only be designed for positive moment within the spans but also negative moment at joint connections as shown in Figure 33. Figure 33: Moment Distribution within a Continuous Beam The design steps for determining the required flexural reinforcement are outlined in Table 2. The design process begins by identifying the required positive and negative
72 64 moment capacities at each support and at midspan through determination of the member loads. The required steel area is then determined using the static approach previously described and appropriate reinforcing bars are selected to meet demand. Finally, the reinforcement arrangement is then checked to ensure that the requirements for minimum rebar area and spacing are also met. Table 2: Design of Flexural Reinforcement Flexural Reinforcement in Beams Step Description Equation 1 Determine the Required Positive and Negative Flexural Capacity at the supports and at midspan. Frame Analysis or ACI Moment Coefficients (ACI ) 2 Compute the Area of Steel Required, As req d A s = M u øf y jd 3 Compute the depth of the compression block a = Asfy 0.85f c b 4 Recalculate As req d A s = M u øf y d a 2 5 Calculate As minimum 3bd f c 200bd f y f y 6 Select appropriate number and size of reinforcing bars Table Wang et al Check spacing of reinforcing bars and minimum required beam width Table Wang et al The design of flexural members also includes the determination of cutoff lengths for longitudinal reinforcement based on the development lengths of the reinforcing bars. Development length involves providing the steel reinforcing bars with enough embedment within the concrete at cutoffs in order for the bar to develop its tensile yield stress. If not enough embedment is provided, the bond between a bar and the reinforced concrete could fail and cause the bar to slip. Therefore, bar cutoffs are designed first to ensure that significant moment capacity is available at a section and second to ensure that rebar has sufficient length to develop properly. A sample moment capacity diagram is shown in Figure 34.
73 65 Figure 34: Moment Capacity Diagram and Bar Cutoffs (Wang et al 2007, 227) At the beam ends, sufficient development length is provided by creating standard hooks of sufficient length as shown in Figure 35. Figure 35: Standard Hooks (Wang et al 2007, 1)
74 66 The ACI introduces two categories and simplified expressions for development length in section for bar cut-offs and section 12.5 for standard hooks in tension. While ACI-318 specifies the provisions described above for basic design, Chapter 21 of the document outlines additional requirements for the seismic design of beam reinforcement. The major requirement for longitudinal requirement is found is section and reads as follows: The positive moment strength at the face of the joint shall be not less than onethird the negative moment strength provided at that face of the joint. Neither the negative nor the positive strength at any section along the length of the member shall be less than one-fifth the maximum moment strength provided at the face of either joint (ACI , 329). Ultimately, this means that there must be sufficient longitudinal reinforcement throughout the entire length of the beam with the capacity to resist one fifth of the maximum moment loading. Additionally, enough moment capacity must be provided to ensure that the positive moment strength is always one third of the negative moment strength. 3.4 Flexural Design of Beam-Columns When designing for gravity loading, a vertical column is typically used to transfer axial load to the foundations. However, with the addition of lateral sway caused by wind and seismic forces, columns not only experience axial force, but are also subject to bending effects. Beam-columns are members found within a frame that experience both bending and axial load. This means that it must be designed for bending moments, shear forces, and axial forces. For this study, it is assumed that the column is bending about one
75 67 major axis as shown in Figure 36. However, in actual design, many beam-columns must be designed for bending about both axes or biaxial bending. Figure 36: Column Cross Section with Strain and Forces (Wang et al 2007, 447) The capacity of a beam-column is represented by an axial force P n and a bending moment M n. These parameters are determined through forces developed within the cross section. Figure 36 illustrates how a tensile force is created within the steel rebar on one end while a compression force is developed in the other end of the column. Meanwhile, a compression block and resultant compressive force is created within the concrete. The equations for these values are: T = A s f s Equation 32
76 68 Cs = A s (f y 0. 85f c ) Equation 33 C c = 0. 85f c β x b; Equation 34 were x is te distance from te compression edge to te neutral axis. Values for moment capacity, M n and load capacity, P n can then be calculated through statics and are related to each other through an eccentricity e where: P n = C s + C c T Equation 35 M n = T(d ) + C c (d (a/2) d ) + C s (d d d ) Equation 36 e = M n /P n Equation 37 For any specific cross section, there are an infinite number of strength combinations at which P n and M n act together (Wang et al 2007, 437). The relationship between these values can be plotted to develop the cross section strength interaction diagram. Figure 37 below illustrates a sample plot and the three main categories of data found on the diagram. Figure 37: Interaction Diagram for Concrete Columns (Wang et al 2007, 437).
77 69 First, when the strain in the tension steel is equal to its yield stress and the concrete strain is equal to 0.003, the column is said to be in the balanced condition and is designated on the diagram by the balance load P b, the balanced moment M b, and the balanced eccentricity e b. This refers to the scenario when the concrete is crushing at the same time the steel is yielding. The next condition involves the eccentricity being less than e b and the axial load is greater than P b. In this scenario, the eccentricity is low and therefore the section acts more like an axial loaded column. For this compression-controlled section, the concrete has an ultimate compression strain less than or equal to which is the limit for a concrete crushing failure. Meanwhile, the steel reinforcement is designed with a tensile strain less than its yield strain and its capacity is therefore the governing parameter in the beam-column. Since the eccentricity is lower than e b, the tensile force in the tension steel will be low and may even be a compressive force. Therefore, the column is compression controlled because the compressive strength of the concrete is controlling the design. If the column was to fail, the steel would yield plastically in a ductile failure prior to the concrete failing in compression. This ductile failure is advantageous because it gives enough warning to allow a potential evacuation to occur. Therefore, designers strive to design beam-columns with compression-controlled cross sections. The third condition for design of beam-columns involves the section acting more like a beam in bending than a column. For this scenario, the eccentricity is greater than e b and therefore the tensile force in the steel reinforcement is large. The steel reinforcement is assumed to have yielded with a strain greater than due to this beam action and its capacity is controlling the design. Since the steel reinforcement has been designed for a
78 70 larger tensile strain, the parameter that is governing failure is the crushing capacity of concrete. The concrete on the compression side of the cross section will ultimately fail prior to the tensile steel reinforcement. Concrete is a brittle material that fails suddenly if loaded over the maximum stress and strain capacities. This failure does not given any warning before collapse, and, for this reason, engineers strive to avoid the use of a tension controlled section in design. Analysis and design of compression controlled and tension controlled sections is an iterative process where the capacity of chosen cross sections and steel reinforcement must be checked and revised in order to achieve an adequate design. However, approximate equations have been developed in order to aid in the design process. First, for compression controlled sections, Whitney developed the following equation for load capacity (Wang et al 2007, 455): P n = A g f c 3 e ξ 2 h ρgfy 2 e γ h +1 Equation 38 where, ξ = d h and γ = d d h For tension-controlled sections, the follow approximate equation can be used for design and analysis (Wang et al 2007, 459): Pn = 0. 85f c ρ + 1 e d + 1 e d 2 + 2ρ m 1 1 d d + e d Equation 39 were, m = f y 0.85f c ; ( e d ) = d 2 + e d
79 71 Finally, in terms of seismic design provision for the longitudinal reinforcement, Section 21.3 of ACI-318 does not specify any additional provisions for the flexural design of beam-columns. 3.5 Member Design for Shear While the longitudinal steel reinforcement seeks to provide sufficient moment capacity in a beam or beam-column member, the designer must also be concerned with providing enough shear resistance within a member. A concrete beam alone can only supply a certain amount of shear resistance before shear cracks are produced. Therefore, shear reinforcement, typically in the form of No. 3 or No. 4 steel stirrups as shown in Figure 38 are used to provide added shear strength and also confine the core of the section to aid in maintaining strength and capacity. Figure 38: Typical Shear Stirrup Arrangement (Wang et al. 2007, 131) Table 3 outlines the basic steps in designing the shear reinforcement for beams. The basic process involves determining the required shear demand based on the loading of the beam. Next, the required shear capacity of the shear stirrups Vs is determined at the critical section. Finally, required stirrup shear capacity is used to determine the proper stirrup spacing along the beam.
80 72 Table 3: Specifications for Beam Shear Design Design of Beam Shear Reinforcement Step Description Equation 1 Calculate the shear value at the critical section, V u A distance d from the support face (Interpolate between value at support and value at midspan) 2 Calculate the shear capacity of the concrete, V c V c = 2 f c bd 3 Determine if steel stirrups are required V u V c /2 4 Calculate Shear Demand V n V n = V u /ø 5 Calculate the required shear demand in the steel, V s V s = V n V c 6 Assume a stirrup bar diameter and calculate the required stirrup spacing s = A vf y V s 7 Determine the maximum allowable spacing A v f y s = A vf y 0.75 f c b w 50b The design process for column shear is similar to the steps taken to design for beam shear. First, the shear load is obtained from the frame analysis and used to calculate the required shear capacity. The capacity of the concrete is once again calculated, but as shown in step 2 of Table 4, the capacity now takes into account the axial compression Nu acting on the column, which enhances the concrete shear capacity. Next, the required shear capacity of the steel is used along with the rebar cross sectional area to calculate the needed stirrup spacing. However, for beam and column design, the results of these basic design procedures must be tailored in order meet additional seismic requirements. Table 4: Specifications for Column Shear Design Design of Column Shear Reinforcement Step Description Equation 1 Calculate the shear value at the critical section, V u From Frame Analysis 2 Calculate the shear capacity of the concrete, V c N u V c = 2(1 + ( )) (f 2000A c )b w d g 3 Determine if steel stirrups are required 4 Calculate Shear Demand V n V u V c 2 V n = V u ø 5 Calculate the required shear demand in the steel, V s V s = V n V c 6 Assume a stirrup bar diameter and calculate the required stirrup spacing s = A vf y V s 7 Determine the maximum allowable spacing A v f y s = A vf y 0.75 f c b w 50b
81 73 In seismic design and performance, the ability of a reinforced concrete building frame to prevent collapse is dependent on its ability to absorb seismic energy through inelastic behavior at plastic hinges. However, beams and columns have the potential to experience shear failure at plastic hinges before inelastic behavior is achieved. Therefore, adequate shear capacity is a major concern for design. The ACI code outlines provisions to increase shear reinforcement near member supports in order to enable the formation of plastic hinges. These provisions deal mostly with the required shear capacity øv n and the spacing of shear stirrups and are outlined in Table 5. The intent of the general provision in ACI Section is to specify the required shear capacity needed for design of the frame member. The design shear obtained from a frame analysis of the structure must not be less than the smaller of the two identified limits. The first limit, illustrated in Figure 39 for beams and columns is calculated as the sum of the nominal moment capacity at each end of the member divided by the clear span. For beam members, this value also includes the addition of shear caused by the gravity loads. The second limit uses the shear value obtained from doubling the earthquake load for load combinations that include a seismic induced shear.
82 74 Table 5: ACI Seismic Provisions for Shear Design in IMF Components Seismic Shear Provisions for Beams and Columns ACI Section Specification General øv n of beams, columns, and two-way slabs resisting earthquake effect, E, shall not be less than the smaller of (a) and (b): (a) The sum of the shear associated with development of nominal moment strengths of the member at each restrained end of the clear span and the shear calculated for factored gravity loads; (b) The maximum shear obtained from design load combinations that include E, with E assumed to be twice that prescribed by the governing code for earthquake-resistant design. Beams At both ends of the (beam) member, hoops shall be provided over lengths equal 2h measured from the face of the supporting member toward midspan. The first hoop shall be located at not more than 2 in. from the face of the supporting member. Spacing of hoops shall not exceed the smallest of (a), (b), (c), and (d); (a) d/4 (b) Eight times the diameter of the smallest longitudinal bar enclosed (c) times the diameter of the hoop bar (d) 12 in Stirrups shall be placed at not more than d/2 throughout the length of the member. Columns At both ends of the member, hoops shall be provided at spacing s o over a length l o measured from the joint face. Spacing s o shall not exceed the smallest of (a), (b), (c), and (d); (a) Eight times the diameter of the smallest longitudinal bar enclosed; (b) times the diameter of the hoop bar; (c) One-half of the smallest cross-sectional dimension of the frame member; (d) 12 in. Length l o shall not be less than the largest of (e), (f), and (g): (e) One-sixth of the clear span of the member; (f) Maximum cross-sectional dimension of the member (g) 18 in The first hoop shall be located at not more than s o /2 from the joint face Outside of the length l o, spacing of transverse reinforcement shall conform to 7.10 and
83 Figure 39: Determination of Shear Value Limit for Beam (ACI ) 75
84 Joint Design The final design component for a reinforced concrete moment frame is the beam to column joints located within the frame. Joints are classified into 2 categories: Type 1 joints which are designed simply to meet ACI code requirements for strength and Type 2 joints which are designed for earthquake and blast provisions (Wang et al 2007, 385). Section of ACI-318 gives no specific seismic design provisions for joints in an IMF and therefore a designer can assume Type 1 joints. Apart from axial loads, joints transmit load primarily through shear forces: Such elements are usually subjected to very high shear forces during seismic activity, and if inadequately reinforced, result in excessive loss in strength and stiffness of the frame, and even collapse (Paulay and Priestley 1992, 7). Therefore, the major concerns for beamcolumn joint design are the joint confinement and the amount of transverse reinforcement found within the joint. Joint confinement is based on the number and size of the members ending in the joint connection. Shown in Figure 40, the shaded area defines the core of the joint and corresponds to the width of the column and the depth of the shallowest member: The core is considered completely confined when beams frame in from all four sides and each beam has a width b at least three-fourths the column width and no more than 4 in. of column width is exposed on each side of the beam (Wang et al 2007, 389). If full confinement is not provided, then transverse reinforcement is required in order to confine the joint core.
85 77 Figure 40: Confinement of Beam Column Joint (Wang et al 2007, 389) The steps for calculating the shear capacity of the joint and the required shear reinforcement are outlined in Table 6. First, the column shear being transferred through the joint is based on the nominal moment capacity that can be transferred to the joint by the beam reinforcement. The moment capacity is calculated as the force within the rebar steel as shown in Figure 41 and multiplied by the distance between the reinforcement. The moment load is defined as 90% of the moment capacity. The column shear is then determined by dividing this moment load by the tributary height for each side of the column.
86 78 Table 6: Specifications for Joint Shear Design Design of Type 1 Joint Transverse Reinforcement Description Equations Design for the column shear being transmitted through the joint V u = M n l n Calculate the joint, V u V uj = αa st f y V u Calculate the Joint Width, b j Smallest of: Nominal Shear Strength, V n Check for adequacy Design for column tie spacing b i = b b + b c 2 m b j = b b + 2 b j = b col V n = γ f c b j V n > V u Smallest of: s = 16d b s = 48d sb s = b col s = 12 (6 for LLRS) Figure 41: Shear Development within Beam-Column Joints (Wang et al, 2007, 387) The joint shear is then calculated based on recommendations from ACI Committee 352 as the value of the tensile force acting in the beam s top reinforcement αa st (fy) where alpha is a multiplier based on the type of joint connection minus the value of the shear acting in the column (Wang et al 2007, 386). Next, the effective joint width b j is determined as the smallest value obtained from the three equations listed in Table 6.
87 79 This effective beam width is used to calculate the joint shear capacity which is then compared against the shear load. Finally, if a column is not completely confined, such as in the case of an external end joint, horizontal column ties must be added with the minimum spacing defined from the equations in Table 6.
88 Computer-Based Modeling and Analysis The intent of the computer-based modeling and analysis is to simulate the seismic performance of an intermediate moment frame. The work of PEER researchers Liel, Haselton and Deierlein along with the methodology from the ATC-63 project was used and adapted for the IMF modeling. Five main tasks were conducted for the study. First, typical design IMF dimensions and cross sections were developed to match real world designs based on the recommendations of practicing engineers. Second, the reinforcement detailing was designed for the frame based on current ACI code provisions. The design Excel spreadsheet used in the Liel, Haselton and Deierlein study for an SMF frame was adapted to reflect IMF design provisions. The model s response was then analyzed for simulated seismic events with nonlinear analysis and the collapse performance data was collected. The frame was re-designed to consider two changes in the IMF design parameters: building height and the addition of a strong-column weak beam ratio. The seismic response of the IMF was re-analyzed and the collapse results compared with the initial findings. 4.1 Experimental Building Frame The first step in the IMF study was to develop an experimental building frame that would be used for design and modeling. In order for the analysis results to be representative of actual design practice, the IMF dimensions and cross sections were based on typical design practice used currently in moderate seismic zones. This was accomplished through conversations with practicing engineers. Thomas C. Schaeffer, a structural engineer with Structural Design Group based in Nashville, Tennessee and also a member of the ACI-318 committee, provided the
89 81 dimensions for a 4-story reinforced concrete frame used in the design of a typical hospital patient wing. Shown in Figures 42 and 43, the building has a total height of 48 feet and covers an area 150 feet by 56 feet. Five bays of 30 feet run in the longitudinal direction, and 2 bays of 32 feet and feet extend in the transverse direction. The story height is a constant 12 feet at each story. Figure 42: Four-Story Design Building Elevation Figure 43 also indicates the typical cross section dimensions of the building frame s structural elements. First, a five-inch slab is assumed. Concrete compression strength f c equals 5 ksi and the unit weight is assumed as 150 pcf. The infill floor beams are designated as 12 to 16 in. wide by 20 to 22 in. deep. Frame beams running along the column lined in the transverse direction are 20 in. by 22in. The girders running in the longitudinal direction are in. by 26 in. rectangular sections. Finally, all the columns in the frame are designated as in. by in. square columns.
90 82 Figure 43: Design Building Plan View It was determined that the central longitudinal frame (circled in Figure 43) would be used for the design study. Other design parameters were chosen based on conversations with engineer Dominic Kelly, PE, SE from the firm of Simpson Gumpertz & Heger. First, although the building was based on a typical hospital-wing scheme, the building was designed for an importance factor of 1 (non-essential structures) rather than an importance factor of 1.5 (essential facilities). Hospitals are considered essential facilities as they are required to remain operational even during catastrophic events. Therefore, they must be designed for higher seismic forces. An importance factor of 1 was chosen because most typical building structures fall into the non-essential category, and this assumption allows the collapse results to be applicable to a larger building set. Maximum and minimum steel reinforcement ratios were assumed to be 2.5% and 1% respectively. A 40 psf live load and an 80 psf live load were used for patient rooms and corridors, respectively, as specified in the 2006 IBC (IBC 2006). The frame was considered to act only along its longitudinal direction and, therefore columns were designed for uniaxial bending only. In an actual structure, the columns would be designed
91 83 for biaxial bending. Last, a basement was assumed to be included in design, and therefore the support conditions of the frame were assumed to be fixed with restraints in translation and rotation. Designed as two-dimensional, the IMF frame was analyzed using the analysis software RISA-2D Educational to determine the internal forces, shears, and moments for the four-story frame. For the six-story frame used to explore the effect of story height, the software MASTAN2 was used because of its ability to analyze frames with a larger number of members and joints than the RISA-2D Educational software. 4.2 Code Based Design In order for the Microsoft Excel SMF design spreadsheet to be adapted for IMF design provisions, the design and detailing of the four-story frame was first completed manually using a combination of hand calculations and Microsoft Excel for repetitive calculations. The design involved four main areas: checking the adequacy of the five-inch concrete floor slab, designing the flexural reinforcement for the beams and columns, designing the shear reinforcement for beams and columns, and checking the adequacy of the monolithic beam-column joints. Once a baseline design was developed using the manual calculations, the SMF design spreadsheet was then adapted in order to match the provisions of the IMF design Manual Calculations First, the slab design was initially assumed to be five-inches deep based on typical design practice. This preliminary value could be based on both past experience with slab strength and required fire resistance ratings specified in building codes. However, the strength and detailing of this slab must be verified with the respective dead and live
92 84 loading. Designed as a continuous slab segment with a tributary width of 1 foot, the slab thickness proved to be adequate in terms of both shear and moment. Flexural reinforcement in the form of No. 3 rebar was spaced every 12 inches along with shrinkage and temperature reinforcement used to reduce cracking in the form of No. 3 rebar in the transverse direction spaced at 18 inches. Next, the flexural reinforcement in the girders and columns was determined for the IMF frame using the procedures described in Section 3.3 and 3.4 of this report. Additionally, standards from the OpenSees modeling were applied in design in order for the manual design to match with the design of the OpenSees model. Figure 44 illustrates the flexural reinforcement for the entire frame, while Figure 45 illustrates a single bay. Flexural reinforcement within the girders was standardized for each story level. The top reinforcement was standardized to either 7 No. 9 steel bars on the roof and 6 No. 9 bars on the lower floors. This provides a top steel area of six to seven square inches and a reinforcement ratio of roughly The bottom steel was also standardized to either 3 or 4 No. 9 bars with a reinforcement ratio of roughly to The standard cross sections for the beams are shown in Figure 46. Flexural reinforcement within the columns was ensured to be symmetric for both individual columns and the entire frame. Most of the column flexural reinforcement was governed by a compression controlled section and the minimum reinforcement ratio of All but two of the columns were designed with 6 No. 9 bars as shown in Figure 44. The two end columns on the roof of the building behaved more like members in bending and therefore were designed as tension controlled sections. Flexural reinforcement in these columns was doubled to 12 No. 9 bars as shown in Figure 44 below.
93 Figure 44: IMF Flexural Reinforcement 85
94 86 Figure 45: Flexural Reinforcement for A Typical Bay Figures 46 and 47 illustrate the beam and column cross sections within the fourstory frame.
95 87 Figure 46: Beam Cross Sections Figure 47: Column Cross Sections
96 88 The shear reinforcement for the IMF members was then determined using the procedure outlined in Section 3.5 of this report, and the results for the entire frame and a typical bay are shown in Figures 48 and 49 below. No. 3 steel stirrups were used throughout the frame. For each beam and column, the shear stirrup spacing was made constant throughout the member based on the minimum spacing required at the ends of the structural element. This assumption was made because the modeling process is only concerned with the shear capacity at the locations where plastic hinges form, which typically are at the ends of the member. In actual practice, the stirrup spacing would be increased near the center of the member as the required shear capacity decreased. The shear stirrup spacing was also standardized for beams and columns at each floor level. A stirrup spacing of 6.5 inches was used for beam members. Columns at the third story had a stirrup spacing of 6 inches, while all other columns had a spacing of 9 inches, which is the maximum spacing allowed for the IMF design and calculated as times the diameter of the stirrup bars.
97 Figure 48: Shear Reinforcement for IMF 89
98 90 Figure 49: Shear Reinforcement of a Typical Bay The final step in the manual design of the four-story IMF was to check the adequacy of the monolithic beam-column joints based on the procedures described in Section 3.6. The interior joints were assumed to be completely confined as members are connected into the joint on all sides and the distance between the column edge and the beam edge is less than four inches on each side of the beam. Figure 50 displays the detailing of an interior joint.
99 91 Figure 50: Interior Joint Detail for Four-Story IMF Meanwhile, the exterior joint is confined on three sides and therefore requires confining reinforcement. Therefore, shear reinforcement is continued through all the joints with stirrups spaced at four inches as shown in Figure 51 below.
100 92 Figure 51: Exterior Joint Detail for Four-Story IMF IMF Microsoft Excel Design Spreadsheet The IMF design completed through the use of manual calculations provided a base to adapt the Microsoft Excel Design Sheet used in the SMF study conducted by PEER researchers. The purpose of the Microsoft Excel Design Sheet is to develop the frame input file for the OpenSees modeling. One of the major changes to the design sheet involved the adjustment of shear reinforcement design requirements from SMF specifications to the less stringent provisions required for the IMF. This included such parameters as shear loading, inclusion of concrete shear capacity, and the minimum stirrup spacing requirements. Additionally, the Visual Basic script used to design for the strong column-weak beam provision was left in the framework of the design sheet, yet was not used for the initial IMF design.
101 93 Figures 52 and 53 illustrate the final design of the IMF using the Microsoft Excel Design Sheet, and the design results compare well with the manual calculations. From Figure 52, one sees that the column reinforcement ratios are roughly 0.01 except for the two end columns of the roof which each have a reinforcement ratio of Meanwhile, beam reinforcement ratios have been standardized at each floor level with values of for top reinforcement and for bottom reinforcement. Reinforcement ratios for columns and beams are slightly higher than the manual designs for some members due to the use of moment capacities calculated with equations introduced by Panagiotakos and Fardis in their 2001 ACI Structural Journal article. Panagiotakos and Fardis (2001) conducted over 1000 tests with reinforced concrete beam, column, and wall specimens in order to predict the deformation and expected flexural strengths of RC members at yielding and failure. The study looked at both monotonic and cyclic loading. Empirical expressions were developed for the expected moment capacity at yield and failure along with the ultimate drift or chord rotation. Since the expressions consider the deterioration and the deformation of the structural components, the actual moment capacity achievable by the components may be higher than the nominal values used during design. Therefore, the Excel Design Sheet uses the Fardis equation to account for the expected moment capacity and some of the members are designed for a slightly higher moment.
102 Story 1 Story 2 Story 3 Story 4 (φm n/mu)neg = (φm n /M u ) pos = M n,pos /M n,neg = φv n/vmpr = (φm n/mu)neg = (φm n/mu)pos = φv n /V mpr = M n,pos/mn,neg = (φm n/mu)neg = (φm n /M u ) pos = M n,pos/mn,neg = φv n/vmpr = (φm n/mu)neg = (φm n/mu)pos = M n,pos /M n,neg = φv n /V mpr = (φm n/mu)neg = (φm n/mu)pos = M n,pos/mn,neg = φv n/vmpr = Story 1 Story 2 h (in) = b (in) = ρ = ρ' = ρ sh = s (in) = h (in) = b (in) = ρ = ρ' = ρ sh = s (in) = h (in) = b (in) = ρ = ρ' = ρ sh = s (in) = h (in) = b (in) = ρ = ρ' = ρ sh = s (in) = h (in) = b (in) = ρ = ρ' = ρ sh = s (in) = Story Story Design Documentation (1 of 2) Floor 5 h (in) = b (in) = ρ tot = ρ sh = s (in) = 9.0 Floor h (in) = b (in) = ρ tot = ρ sh = s (in) = Floor h (in) = b (in) = ρ tot = ρ sh = s (in) = Floor feet h (in) = b (in) = ρ tot = ρ sh = s (in) = feet Grade beam column height (in) = 36 Basement column height (in) = 0 30 feet Design base shear = g, 126 k f' c beams = 5.0 ksi f' c,cols,upper = 5.0 ksi f y,rebar,nom. = 60 ksi f' c,cols,lower = 5.0 ksi Figure 52: Design Documentation for Four-Story IMF Design Documentation (2 of 2) SCWB = 0.59 Joint ΦV n/v u = Design Drifts: φm n/m u = 1.15 φv n /V mpr = 0.98 P/A gf' c = % Floor φm n/m u = φv n/v mpr = P/A gf' c = % Floor φm n/m u = 1.16 φv n/v mpr = 1.46 P/A gf' c = % Floor φm n/m u = 1.15 φv n /V mpr = 1.63 P/A gf' c = % Figure 53: Design Documentation for Four-Story IMF
103 Story 1 M y,pos,exp (k-in) = M y,n,slab,exp (k-in) = (Θ cap,pl)pos (rad) = EI stf, w/ Slab (k-in 2 /rad) = (Θ cap,pl)neg (rad) = Θ pc (rad) = λ = M y,pos,exp (k-in) = M y,n,slab,exp (k-in) = EI stf, w/ Slab (k-in 2 /rad) = (Θ cap,pl)pos (rad) = (Θ cap,pl)neg (rad) = Θ pc (rad) = λ = M y,pos,exp (k-in) = M y,n,slab,exp (k-in) = EI stf, w/ Slab (k-in 2 /rad) = (Θ cap,pl)pos (rad) = (Θ cap,pl)neg (rad) = Θ pc (rad) = λ = M y,pos,exp (k-in) = M y,n,slab,exp (k-in) = EI stf, w/ Slab (k-in 2 /rad) = (Θ cap,pl)pos (rad) = (Θ cap,pl)neg (rad) = Θ pc (rad) = λ = M y,pos,exp (k-in) = M y,n,slab,exp (k-in) = EI stf, w/ Slab (k-in 2 /rad) = (Θ cap,pl)pos (rad) = (Θ cap,pl)neg (rad) = Θ pc (rad) = λ = E E E E E Story E E E E E Story E E E E E Story E E E E E Nonlinear Modeling of Seismic Performance With the IMF model designed using the adapted Excel design sheet, the seismic performance of the IMF was studied using the OpenSees software and the draft ATC-63 Methodology. The Methodology identifies four major steps in the determination of a frame s seismic performance: conducting a static pushover analysis of the frame, conducting a nonlinear dynamic analysis of the frame, determining the experimental seismic performance, and comparing that with an acceptable benchmark value. The input file for the analysis was created with Visual Basic scripts in the adapted Microsoft Excel Spreadsheet. As mentioned previously, the OpenSees model of the IMF frame considers parameters that will capture the deterioration of the structural components over time such as the rotational capacity of beam-column elements. A summary of these model parameters is given in Figure 54 below. Modeling Documentation (1 of 1) Floor 5 Floor 4 Floor 3 Floor 2 M y,exp (k-in) = 8417 EI stf/ei g = 0.35 M c/m y = 1.21 Θ cap,pl (rad) = Θ pc (rad) = λ = 63 (P/A gf' c) exp = 0.02 M y,exp (k-in) = 5618 EI stf/ei g = 0.35 M c/m y = 1.20 Θ cap,pl (rad) = Θ pc (rad) = λ = 61 (P/A gf' c) exp = 0.05 M y,exp (k-in) = 6764 EI stf/ei g = 0.35 M c/m y = 1.20 Θ cap,pl (rad) = Θ pc (rad) = λ = 60 (P/A gf' c) exp = 0.07 M y,exp (k-in) = 7015 EI stf/ei g = 0.35 M c/m y = 1.20 Θ cap,pl (rad) = Θ pc (rad) = λ = 58 (P/A gf' c) exp = 0.09 EI stf/eig = EI stf/eig = EI stf/eig = EI stf/eig = EI stf/eig = Mass tributary to one frame for lateral load (each floor) (k-s-s/in): Model periods (sec): T 1 = 1.16 T 2= 0.35 T 3 = 0.18 f y,rebar,expected= 67 ksi 1.67 Figure 54: Modeling Documentation for OpenSees Modeling
104 96 The static nonlinear pushover analysis is used to determine the amount of overstrength in the frame and the amount of ductility found within the frame model (Draft ATC , 6-2). The process involves subjecting the model to a lateral static pushover force at each story in addition to gravity dead loads and a quarter of the gravity live loads. Lateral forces are determined based on the proportion of total building mass at each story. In this way, the procedure is similar to the Equivalent Lateral Force Method used in calculating the lateral seismic forces for the initial frame analysis. However, the pushover analysis continues to increase the lateral forces until the frame is literally pushed over by the static force due to lateral sway and overturning. For each of the iterations, the lateral forces are used to calculate the value of base shear V and the story drift δ. These values are plotted as shown in Figure 55, and it is illustrated that as the sway increases, the amount of shear strength begins to decrease below some maximum value V max. Figure 55: Base Shear vs. Roof Displacement Plot from Pushover Analysis
105 97 The maximum shear V max, along with the design base shear strength calculated from ASCE7-05 (V=C s W) can be used to determine the frame s overstrength. Ω = V max /V Equation 40 Meanwhile, the period-based ductility of the frame, which will be used to define parameters for processing the results of the dynamic analysis, is calculated as the ratio between the ultimate roof drift, δ u, and the effective yield roof drift, δ y eff (Draft ATC , 6-9). The ultimate roof drift is determined as the drift value at which the base shear capacity is 80% of the maximum value as shown in Figure 55. The effective yield roof drift shown in Figure 55 can be calculated using the following equation: δ y,eff = C 0 V max W g 2π 2 max(t, T 1) 2 Equation 41 where W is the weight of the building, g is the acceleration due to gravity, T is the design period, and T1 is the fundamental period from an eigen value analysis of the frame. The coefficient C 0 is intended to relate the proportion of mass at each story level to the modal shape of the structure and has been tabulated in Chapter 3 of FEMA 356 is reproduced below in Figure 56 below.
106 98 Table 7: Table of Values for Modification Factor C0 (FEMA , 3-22) The nonlinear dynamic analysis is then conducted using OpenSees in order to determine the median collapse level acceleration of the building. As mentioned previously, the OpenSees model considers elements such as elastic joint models, nonlinear beam-column elements developed by Ibarra et al (2005), and numerical algorithms solving equations involved with dynamic analysis (Draft ATC , 9-13). The simulation program accounts for the flexural capacity of the column and beam members and the potential of these elements to develop ductile behavior in the form of plastic hinges. These plastic hinges usually form at the ends of the member and therefore the model focuses on the structural performance in these areas. The OpenSees simulation determines collapse in the building through the use of incremental dynamic analysis. Using a database of ground acceleration signatures from 44 western earthquakes, the simulator applies cyclic loading to the frame with reference to increasing values of ground acceleration. For each increment of acceleration, the maximum inter-story drift is determined. As the acceleration increases for a given earthquake signature, the story drift becomes larger and larger. These values of story drift are plotted in terms of ground acceleration and earthquake signature as shown in Figure 56, with each point corresponding to the results of an inelastic dynamic analysis of one
 plot When the difference in story drift between iterations becomes significantly large as shown in Figure 56, the model is considered to have")
107 99 index archetype model subjected to one ground motion record that is scaled to one intensity level (Draft ATC , 6-11). Figure 56: Sample Incremental Dynamic Analysis (IDA) plot When the difference in story drift between iterations becomes significantly large as shown in Figure 56, the model is considered to have collapsed and OpenSees restarts the analysis with a new earthquake record. The median collapse level acceleration S CT is defined as the ground acceleration at which 50% of the model iterations collapsed. Stated differently, it is the acceleration at which, for any seismic event, the specific building frame has a 50% chance of survival. Figure 57 shows the cumulative distribution function for collapse probability. The probability is plotted against the ground acceleration magnitude, with the median level collapse corresponding to a collapse probability of 0.5. Although not shown in Figure 57, the MCE spectral acceleration S MT determined from ASCE7-05 and based on the fundamental period of the building can also be plotted on the CDF plot to compare its collapse probability with that of S CT.
108 100 Figure 57: Sample Cumulative Distribution Function (CDF) for Collapse Probability The collapse level acceleration must now be adapted to a form that can relate the modeling collapse results to not only the design requirements but also to an acceptable benchmark of seismic performance. Therefore, S CT is used to determine the collapse margin ratio (CMR) which is the primary parameter used to characterize the collapse safety of the structure (Draft ATC , 6-13). The CMR is determined as the ratio of the collapse level acceleration and the MCE spectral acceleration used in design: CMR = S CT S MT Equation 42 Since code provisions are conservative when designing for specific design accelerations, the actual collapse level acceleration will be greater than the spectral acceleration. The CMR will therefore be a value greater than one. However, it is the magnitude of the difference between the two accelerations that will determine if the building provides adequate seismic performance.
109 101 Once the CMR is calculated from the collapse level acceleration and the spectral acceleration, it cannot be directly compared with an acceptable benchmark. Instead it must be modified to obtain the adjusted collapse margin ratio (ACMR). The draft ATC- 63 report specifies that the spectral shape of western earthquake acceleration records used to study the collapse performance can actually be less damaging to certain types of lateral force resisting systems: In essence, the shape of the spectrum of rare ground motions is peaked at the period of interest, and drops off more rapidly (and has less energy) at periods that are longer or shorter than the period of interest. Where ground motion intensities are defined based on the spectral acceleration at the first-mode period of a structure, and where structures have sufficient ductility to inelastically soften into longer periods of vibration, this peaked spectral shape, and more rapid drop at other periods, causes these rare records to be less damaging than would be expected on the shape of the standard design spectrum (Draft ATC , 7-5). This potential effect of spectral shape is accounted for by multiplying the CMR by a spectral shape factor (SSF) to obtain the adjusted collapse margin ratio: ACMR = SSF X CMR Equation 43 The SSF is determined from Table 7-1a of the draft ATC-63 Methodology using the model period T and the period-based ductility value μ T calculated from the pushover analysis. Table 7-1a is reproduced in Table 8, and Figure 58 illustrates the effect of SSF on the CMR.

110 102 Table 8: Table of Spectral Shape Factor Values (Draft ATC , 7-5) Figure 58: Influence of SSF on CMR (Deierlein et al 2007, 7) Now, the ACMR can be compared with an acceptable benchmark value of ACMR from the draft ATC-63 report. This acceptable value of ACMR is determined in part by a consideration of the uncertainty inherent in the analysis. Uncertainty derived from four principle sources by the draft ATC-63 Methodology: design requirement uncertainty, β DR ; test data uncertainty, β TD ; model uncertainty, β MDL ; and record-to-record uncertainty,
111 103 β RTR. Uncertainty is ultimately a subjective and qualitative parameter, yet the draft ATC- 63 methodology attempts to quantify this parameter with a standardized qualitative scale: Quality ratings for design requirements, test data, and nonlinear modeling are translated into quantitative values of uncertainty based on the following scale: (A) Superior, β=0.10; (B) Good, β=0.20; (C) Fair, β=0.35; and (D) Poor, β=0.50 (Draft ATC , 7-11). These ratings are based on the robustness and completeness of the parameter being considered. For example, the test data uncertainty would be based on the extent to which the material s performance characteristics have been established by past research, while the model uncertainty would be determined with reference to the confidence level that the model accurately simulates the collapse characteristics. The exception is the record-to-record uncertainty, which is determined from the period based ductility: β RTR = µT 0. 4 Equation 44 (ATC-63 Eqn. 7-2) All of these uncertainty values are then used to determine the total collapse uncertainty β TOT : β TOT = β RTR + β TD + β MDL + β DR Equation 45 (ATC-63 Eqn. 7-5) Table 7-2a of the draft ATC-63 Methodology (reproduced in Table 9) tabulates potential values of the total collapse uncertainty based on the model quality, test data quality, and the quality of design requirements (Draft ATC , 7-13).

112 Table 9: Total System Collapse Uncertainty (Draft ATC , 7-13) 104
113 105 The total collapse uncertainty can now be used to develop the acceptable benchmark for the AMCR value. The draft ATC-63 Methodology specifies that the average collapse probability should be less than 20% for any class of specific building structures, in this case a 4-story IMF (Draft ATC , 7-15). Therefore, the acceptable ACMR benchmark ACMR20% or the adjusted collapse margin ratio at which the building has a 20% collapse probability, can be determined from tabulated values based on the total system uncertainty from Table 7-3 in the draft ATC-63 report. This table is reproduced in Table## below. Ultimately, a building structure is determined to be adequate when the experimental ACMR obtained from analysis is greater than the acceptable value of ACMR20%. In other words, the higher the ACMR value, the larger the collapse level acceleration is compared to the MCE spectral acceleration, which in turn reduces the probability of collapse at the MCE spectral acceleration. The lower the ACMR value, the closer the collapse level acceleration is to the MCE spectral acceleration; therefore increasing the collapse probability. Using this draft ATC-63 Methodology, the performance of the four-story IMF could now be analyzed to determine the experimental ACMR and then compare this value to an acceptable value for ACMR20%. While the ACMR20% is applicable to the collapse performance of a specific frame, the draft ATC-63 Methodology specifies that the average value of collapse probability for a range of building performance groups (i.e. short period or long period buildings) should not be less than 10%. Therefore, if one was studying a broader category of structures, such as an entire suite of IMF configurations, the average value of the

114 106 experimental ACMRs should not be below ACMR10%. This would indicate that the overall category has a collapse probability less than 10%. Table 10: ACMR Values for Performance Assessment (Draft ATC , 7-14)
115 Four-Story IMF Results The four-story IMF analysis not only served to give initial insight into the adequacy of the ACI code provisions for intermediate moment frames but also served as the baseline from which to conduct a parametric study. Ultimately, the frame proved to have acceptable seismic performance based on the draft ATC-63 Methodology. First, the pushover analysis, which is plotted in Figure 59, was conducted to determine the maximum base shear and the period-based ductility ratio. The maximum base shear experienced by the frame was determined to be k which is significantly highly than the design base shear of 126k. Meanwhile, the ultimate roof drift ratio of the frame, δ u was calculated as or the point at which the base shear is equal to 0.8V max. The effective yield drift ratio, δ y eff was determined from FEMA 356 as Therefore, the period based ductility, μ was equal to Figure 59: Four-Story IMF Results for Pushover Analysis
116 108 Next, the nonlinear dynamic analysis was used to determine the adjusted collapse margin ratio. Figure 60 illustrates the results of the incremental dynamic analysis where collapse level acceleration is plotted against the maximum interstory drift ratio for all iterations of the simulation. It can be noted that no inter-story drift ratios exceed Figure 60: IDA Plot for Four-Story IMF Figure 61 is the plot of collapse probability versus the collapse level acceleration. A median collapse level acceleration S CT of 1.135g was determined from the analysis. Figure 61: CDF Plot for Four-Story IMF Results
117 109 Meanwhile, the MCE spectral design acceleration for the building period T of 0.79sec was calculated at 0.365g from the ASCE7-05 provisions. Therefore, the collapse margin ratio CMR was determined as Using the period and period-based ductility, a spectral shape factor SSF equal to was determined from Table #. The adjusted collapse margin ratio ACMR was then calculated as This experimental ACMR was then compared with an ACMR20% value determined from Tables in the draft ATC-63 Methodology to assess if the IMF model had an overall collapse probability of 20%. The total system uncertainty was determined as 0.5 using Equation 45 of Section 4.3. For the IMF model, the quality of the design requirements (βdr) was assumed to be superior, the model quality (βmdl) was assumed to be good, and the test data quality (βtd) was assumed to be good. From table 10 of Section 4.3, the total system uncertainty was then used to select an ACMR20% value equal to The experimental ACMR and the ACMR20% were then compared to assess the performance of the four-story IMF. The ACMR of 3.73 was greater then the ACMR20% value of This illustrates the IMF frame has a high enough capacity for withstanding ground motion accelerations between the collapse level acceleration and the design acceleration and its probability of collapse at the design level is less than 20%. Therefore, the four-story IMF frame based on the current ACI code provisions provides acceptable seismic performance as defined by the draft ATC-63 Methodology. These results can now serve as a baseline for the parametric study. The nonlinear dynamic analysis also produced plots of the failure modes for each of the 44 earthquake simulations conducted for the four-story IMF. Figure 62 shows a
118 110 sample of the failure modes. Overall, 32.5% of the iterations failed by a soft-story mechanism in the first story (bottom right), 27.5% failed with a soft-story on the second floor, and 15% of the frames failed with a soft story on the third floor (Upper right and bottom left). 15% of the frames experienced a vertical collapse scenario (Upper left picture), 7.5% of frame showed a combination of lateral and vertical failure, while 2.5% (one-frame) experienced no collapse. Ultimately, these results showed that the lateral collapse scenarios governed the modes of failure (75%) for the four-story IMF. Figure 62: Sample Modes of Failure for Four-Story IMF
119 Parametric Study With the performance of the four-story IMF serving as a baseline, the parametric study sought to investigate the impact of changes to 2 design parameters: building height and the addition of a strong column week beam ratio (SCWB). Therefore, a six-story IMF frame was designed and analyzed based on the current ACI code provisions. Next, both the four-story and the six-story frames were redesigned in order to include a SCWB ratio of Effect of Height (Six-Story Frame) In order to study the impact that additional height has on the seismic performance of the building, two additional stories were added to the four-story frame, and the Microsoft Excel design sheet was used to define the reinforcement detailing. Based on recommendations from practicing engineer Dominic Kelly of SGH, a maximum reinforcement ratio limit of 2.5% was used in the design of the six-story frame. This limitation caused the column width of the IMF frame to be increased from in to 28in. A sample of the design output for the six-story frame is shown in Figure 63.
120 h (in) = b (in) = ρ = ρ' = ρ sh = s (in) = h (in) = b (in) = ρ = ρ' = ρ sh = s (in) = h (in) = b (in) = ρ = ρ' = ρ sh = s (in) = h (in) = b (in) = ρ = ρ' = ρ sh = s (in) = h (in) = b (in) = ρ = ρ' = ρ sh = s (in) = Story 1 ρ = b (in) = h (in) = 26 ρ sh = ρ' = s (in) = ρ' = ρ = b (in) = h (in) = ρ sh = s (in) = b (in) = h (in) = ρ sh = ρ' = ρ = s (in) = ρ = b (in) = h (in) = ρ sh = ρ' = s (in) = ρ sh = ρ' = ρ = b (in) = h (in) = s (in) = Story 1 Story 2 h (in) = b (in) = ρ = ρ' = ρ sh = s (in) = h (in) = b (in) = ρ = ρ' = ρ sh = s (in) = h (in) = b (in) = ρ = ρ' = ρ sh = s (in) = h (in) = b (in) = ρ = ρ' = ρ sh = s (in) = h (in) = b (in) = ρ = ρ' = ρ sh = s (in) = Story Story Design Documentation (1 of 2) Floor 5 h (in) = 28 b (in) = 28 ρ tot = ρ sh = s (in) = 9.0 Floor h (in) = b (in) = ρ tot = ρ sh = s (in) = Floor h (in) = b (in) = ρ tot = ρ sh = s (in) = Floor feet h (in) = b (in) = ρ tot = ρ sh = s (in) = feet h (in) = b (in) = ρ tot = feet ρ sh = s (in) = h (in) = b (in) = ρ tot = feet ρ sh = s (in) = Grade beam column height (in) = 36 Basement column height (in) = feet Design base shear = g, 132 k f' c beams = 5.0 ksi f' c,cols,upper = 5.0 ksi f y,rebar,nom. = 60 ksi f' c,cols,lower = 5.0 ksi Figure 63: Design Documentation for Six-Story Frame The results of the pushover analysis are plotted in Figure 64 with a maximum base shear value of k experienced by the building. This base shear is much higher than the design base shear value of kips. Meanwhile, the period-based ductility value was determined as

121 113 Figure 64: Pushover Analysis Results for Six-Story Frame The incremental dynamic analysis plot shown in Figure 65 illustrates that the inter-story drift ratios for the six-story building with maximum values between 0.05 and 0.1. When compared with Figure 60, the drift ratios of Figure 65 are much higher that for the four-story building. The median collapse level acceleration S CT was calculated as 1.435g, while the spectral design acceleration S MT was calculated as 0.25g. Illustrated in Figure 66, this produces a CMR value of 5.74 which is higher than the CMR obtained for the 4-story structure. Figure 65: IDA Plot for Six-Story IMF Results
122 114 Figure 66: CDF Plot for the Six-Story Results The total system uncertainty and the ACMR20% remain the same from four-story IMF model: 0.5 and 1.52 respectively. Therefore, the six-story IMF performs better than the four-story model with a higher value of ACMR. However, this improvement is due in part to the fact that concrete column sizes were increased in order to maintain reinforcement ratios comparable with design practices used by engineers. Additionally, the columns of the six-story frame were required to carry the gravity load of two additional stories which increased the reinforcement. With a larger volume of steel and concrete within the vicinity of each joint, this reinforcement also increased the amount of hysteretic damping available in the frame. Lastly, the dynamic analysis results for modes of failure showed that the lateral collapse scenarios still governed the failure of the six-story IMF. However, only 55.8% of the frame iterations failed laterally which is lower than the 75% observed from the study

123 115 of the four-story frame. However, the six-story frame saw higher levels of multistory failure as shown in Figure 67. Figure 67: Sample Modes of Failure for Six-Story Frame Ultimately, the results of the six-story model illustrate that additional building height does not adversely affect the seismic performance of the IMF. However, additional models of taller buildings would also need to be analyzed in order for this initial result to be confirmed or to explore the limitations. 6.2 Strong-Column Weak-Beam Ratio The results of the four-story and six-story building based on the current code provisions both proved to be acceptable in terms of the ACMR value. This finding would argue that no additional strength requirements are needed for the IMF provisions. However, the four-story and six-story results did show that the governing failure mode was a lateral collapse, mostly in the form of a soft-story mechanism. Therefore, a SCWB ratio of 1.2 was added to the design requirements for each of the two frames. The SCWB ratio specifies that the sum of the column moment capacities at a specific story must be at least 20% greater than the sum of the beam moment capacities. The intent of the provision is to strengthen the columns sufficiently to ensure a failure in the beams to
124 116 govern over a failure in the columns, most specifically in the form of a soft-story mechanism Four-Story IMF The four-story frame design, with the inclusion of the SCWB ratio, saw an increase in the column dimensions. The -in square columns were required to be increased to 28-in columns in order to maintain reinforcement ratios to below the maximum limit of 2.5%. However, the beam dimensions remained the same, and there was little change to the beam reinforcement ratio. The results of the analysis showed an increase in the median collapse level acceleration from a value of 1.135g to g which is an increase of 70.5%. This is shown in the top plot of Figure 68. The maximum inter-story drift ratio also increased from under 0.05 to over 0.1 for some cases as shown in the bottom plot of Figure 68. Therefore, the addition of the SCWB ratio did create a sizable increase in the seismic performance. The CMR increased to 5.30 and the ACMR was calculated to be 6.35, which is greater than the previous ACMR20% value of 1.52.

125 117 Figure 68: CDF (top) and IDA (bottom) Plots for Four-Story SCWB Results Meanwhile, the modes of failure were studied to see if the SCWB ratio produced any change in the percentage of soft-story mechanisms. Ultimately, the number of lateral sway failures including failures that were a combination of lateral and vertical failure was increased from 75% to 86%. If only soft-story mechanisms and multi-story mechanisms are included, the percentage drops to 61%. Last, if only single soft-story mechanisms are
126 118 considered, the percentage drops to 36%. Therefore, the addition of the SCWB does provide an improvement to the performance of the IMF frame Six-Story IMF Redesigning the six-story IMF to include a 1.2 SCWB ratio also saw an increase in the size of the structural members within the frame. The width of the square columns was increased to 34 inches in order for the column reinforcement ratio to be under 2.5%. This larger increase in the column size created the need to also increase the size of the floor girders from a in X 26in to a 26in X 28in. This was done in order to ensure the beam-column joints still contained a confined core. Section of the ACI318-8 Code states that if a joint of the LLRS is confined on all four sides, the joint only needs to have the minimum transverse reinforcement necessary to transmitted shears to the column. Therefore, in and effort to reduce the amount of reinforcement at the joint for constructability, the interior joints were kept completely confined. The results for the redesigned six-story frame show that the median collapse level acceleration increased from 1.435g to a value of 1.715g shown in Figure 69, which is an increase of 20%. This increase is much lower than the 70% increase seen with the fourstory IMF.
127 119 Figure 69: CDF Plot for Six-Story SCWB Results The collapse margin ratio however was calculated as 7.03 which is the highest value obtained from the four models analyzed. The ACMR has a value of 8.74 which is well above the ACMR20% value of Looking at the failure modes for the redesigned six-story IMF, the expected result is that the number of lateral sway failures would be reduced by the addition of the 1.2SCWB ratio. If single soft-story mechanisms are considered alone, the percentage of failures drops to 0% for none of the frames failed with a soft story forming at one floor. However, if multi-story lateral failures are included in this total, then the percentage increases from 55.8% for the original six-story design to 73%. Therefore, the addition of a SCWB ratio does provide some benefit to the seismic performance of the six-story IMF but the benefit is sizably lower than the benefit provided in the four-story frame. Overall, the addition of the strong-column weak-beam ratio is not required to ensure that the performance of the IMF designs meet the assessment requirements of the
128 120 draft ATC-63 Methodology. While creating a large 70% increase in collapse level acceleration for the four-story frame, only a 20% increase is seen in the collapse level acceleration for the six-story frame. It is hypothesized that this can be explained by the fact that the six-story columns had more reinforcement to account for gravity loads in the original design while the four-story had less loading due to its smaller size. In terms of failure modes, the SCWB ratio does decrease the amount of single soft-story mechanisms, but does not significantly decrease the amount of lateral failure occurring in the building. Furthermore, while the SCWB ratio does offer some benefits to the performance, it negatively impacts the design by increasing the size the columns within the frames. This adds concerns with respect to constructability, construction costs, and the economic impact of less usable floor area. Ultimately, the addition of the strongcolumn weak-beam ratio appears unnecessary for the IMF provisions.
129 Conclusions Overall, the study results showed that the seismic performance of intermediate moment frames designed using current ACI provisions is adequate when assessed using the draft ATC-63 Methodology for the quantification of seismic building code parameters. The four-story and six-story frames both performed well during the earthquake simulations with collapse probabilities well below 20% for their designs. Therefore, the effect of additional height is initially found to not have a negative impact on the performance results. The additional height may even improve the response of the structure to a degree as the six-story frame exhibited a larger ACMR than the four-story frame. The intent of the strong-column weak-beam ratio requirement is to try and reduce the formation of soft-story mechanisms within the frame by making the column flexural capacity at a story level greater than the beam flexural capacity at that story. However, the introduction of a 1.2 SCWB ratio to both frames did not provide any significant improvements to the collapse performance; it did require the columns and even beam sizes to be increased in the two IMFs. Therefore, it is concluded that the addition of a SCWB ratio the IMF provisions is not necessary or beneficial to the design of intermediate moment frames. One potential concern that was discovered during the dynamic analysis of the four models was the amount of base shear being subjected to the frame during the seismic simulation and more specifically the nonlinear pushover analysis. Table 11 below compares the maximum base shear determined from the pushover analysis and the design
130 122 shear value used in the design process. The shear overstrength factor Ω is then calculated as the ratio of V max /V. Table 11: Comparison of Maximum Base Shear and Design Base Shear Model Stories SCWB Ratio V max V Ω 1 4 N Y N Y Looking at the tabulated results for Ω, all four frames were found to have significant overstrength, ranging from roughly 6 times to 11 times the design shear value. This difference illustrates two conclusions that can be drawn about the design and performance of the frame. First, the large amount of overstrength signifies that the gravity design requirements along with minimum design values are governing the IMF design for the four-story and six-story frame and are therefore aiding the seismic performance of the frame. The second conclusion that can be drawn is that the modeled frames could be failing in shear prior to the collapse mechanisms identified by the OpenSees analyses. This concern arises from the fact that the OpenSees model focuses its attention on the ends of the members. The model is designed using beam-column elements that take into account the formation and deterioration of plastic hinges during cyclic behavior. These plastic hinges are envisioned to occur at the ends of beam-column elements. Adequate shear reinforcement must be provided at these joint locations in order for plastic hinges to form prior to shear failure. This is accomplished through ACI detailing provisions, and the OpenSees model also looks for adequate shear capacity in these areas.
131 123 However, OpenSees does not consider the shear capacity outside of the plastic hinge regions such as at the midspan of the member. The ACI code allows for the spacing of shear reinforcement to increase at midspan due to a decrease in shear loads. The significant base shear values produced in the pushover analysis may ultimately produce a beam or column failure prior to plastic hinge formation and pushover. It is hoped that the results of this study will lead to further study into the shear capacity along the framing members to check for premature collapse. The results of this study on IMF performance illustrate the inherent overstrength found in the IMF design provisions for flexural capacity and detailing along with shear reinforcement detailing at plastic hinge locations. They also highlight the need for additional study of the shear capacity at the center of framing members and the development of models to investigate the seismic shear performance near member midspans. It is the hope that this report contributes to the knowledge on IMF seismic performance and aids in working towards the future area of studies mentioned.
132 1 References ACI Committee 318, Building Code Requirements for Structural Concrete and Commentary. Farmington Hills, MI: American Concrete Institute, ASCE7-05: Minimum Design Loads for Buildings and Other Structures ed. Reston, VA: American Society of Civil Engineers, Deierlein, Gregory G., Abbie B. Liel, Curt B. Haselton, and Charles A. Kircher. "Assessing Building System Collapse Performance and Associated Requirements for Seismic Design." SEAOC 2007 Convention Proceedings (2007): Earthquake History of the United States. Jerry L Coffman et al. Boulder, CO: United States Department of Commerce, FEMA 356: Prestandard and Commentary for the Seismic Rehabilitation of Buildings. Washington, D.C: Federal Emergency Management Agency, Holmes, William T. "The 1997 NEHRP Recommended Provisions for Seismic Regulations for New Buildings and Other Structures." Earthquake Spectra 16, no. 1 (2000): Ibarra, Luis F., Ricardo A. Medina, and Helmut Krawinkler. "Hysteric Models that Incorporate Strength and Stiffness Deterioration." Earthquake Engineering and Structural Dynamics 34 (2005): International Building Code ed. Country Club Hills, IL: International Code Council, Inc., Liel, Abbie B., Curt B. Haselton, and Gregory G. Deierlein. "The Effectiveness of Seismic Building Code Provisions on Reducing The Collapse Risk of Reinforced Concrete Moment Frame Buildings." 4th International Conference on Earthquake Engineering (2006): Paper No MacGregor, James G., and James K. Wight. Reinforced Concrete: Mechanics and Design. 4th ed. Upper Saddle River, NJ: Pearson Education, Inc., Marshak, Stephen. Essentials of Geology. 2nd ed. New York: W. W. Norton & Company, Inc., Panagiotakos, Telemachos B. and Michael N. Fardis, "Deformations of Reinforced Concrete Members at Yielding and Ultimate." ACI Structural Journal April-2001 (2001): Paulay, T., and M.J.N. Priestley. Seismic Design of Reinforced Concrete and Masonry Buildings. New York: John Wiley & Sons, Inc., 1992.
133 125 Quantification of Building Seismic Performance Factors: ATC-63 Project Report - 100% Draft. FEMA P695. Redwood City, CA: Applied Technology Council, Rao, Singiresu S. Mechanical Vibrations. 4th ed. Upper Saddle River, NJ: Pearson Education, Inc., Tentative Provisions For the Development of Seismic Regulations For Buildings. 2nd ed. Palo Alto, CA: Applied Technology Council, The Regents of the University of California, "Open System for Earthquake Engineering Simulation." (accessed 2/18/2009). Wang, Chu-Kia, Charles G. Salmon, and Jose A. Pincheira. Reinforced Concrete Design. 7th ed. New York: John Wiley & Sons, Inc., 2007.
134 Appendices 126

135 Appendix 1: Thesis Web Diagram 127

136 128

137 129

138 130
139 131 Appendix 2: Outline of IMF Microsoft Excel Design Spreadsheets and Adaptations A. Overview of Microsoft Design Excel Spreadsheet: a. The intent of the Microsoft Design Excel Spreadsheet is to two-fold. First, the spreadsheet uses Visual Basic script in order to design the steel reinforcement for the reinforced concrete moment frame. Second, the design sheet utilizes the design parameters taken from current codes and standards in order to develop the modeling parameters used by OpenSees when the frame is analyzed. B. Input Information: a. The first worksheet summarizes the input information needed throughout the design workbook. Values pertaining to both the code-based design such as tributary widths and loading; and the OpenSees modeling such as the building ID are entered onto this page. b. There were no major changes seen on this sheet except for the use of IMF design input for the frames. C. Lateral Loading: a. This page calculates the lateral seismic forces as each story using the Equivalent Lateral Force Method as specified in ASCE7-05. The calculated forces are then used by frame analysis software to determine the internal forces, shears, and moments. b. There were no major changes in this sheet of the workbook yet values were changed in order to be applicable to an IMF. D. Determination of Internal Forces and Application of Load Combinations (Separate Sheet): a. A separate Microsoft Excel Sheet was used to study the compile unfactored dead, live, and earthquake loading. Pattern loading was investigated for the live load. b. The un-factor loads were then used to calculate the internal forces for the various load combinations specified by the IBC 2006 and ASCE7-05. c. The final list of forces for all load combinations was then pasted into the column and beam force pages. E. Sorting of Column Forces: a. The column forces, shears, and moments determined from the frame analysis are pasted into this page. Visual Basic script is then used to process and sort the maximum and minimum forces into respective tables. These sorted values will then be used in the design process. b. The major change in this sheet was to adapt the Visual Basic coding to account for the IMF frame dimension. Additionally, coding was added to sort the shear forces caused by IMF design provisions (ACI
140 ). These forces were sorted into new tables and used in the shear design for the columns. c. Any frame analysis software can be used for this stage of design such as RISA-2D, MASTAN2, or Etabs. F. Sorting of Beam Forces: a. The column forces, shears, and moments determined from the frame analysis are pasted into this page. Visual Basic script is then used to process and sort the maximum and minimum forces into respective tables. These sorted values will then be used in the design process. b. The major change in this sheet was to adapt the Visual Basic coding to account for the IMF frame dimension. Additionally, coding was added to sort the shear forces caused by IMF design provisions (ACI ). These forces were sorted into new tables and used in the shear design for the columns. c. Any frame analysis software can be used for this stage of design such as RISA-2D, MASTAN2, or Etabs G. Design Spreadsheet: a. The Design Spreadsheet includes Visual Basic commands for the design and detailing of the various frame components. The sheet designs the steel reinforcement in the beams and columns first for strength and then imposes minimum and maximum values for the design. b. The sheet also calculates the beam and column strengths based on the equations of Panagiotakos and Fardis (2001) which also account for material deterioration during cyclic loading. c. While the sheet does have design commands for Joints and the inclusive of a SCWB ratio, these commands should not be used for normal IMF design. d. Adaptations to the Visual Basic coding were done while adapting the design sheet to the IMF design. H. Column Information 1 & 2: a. The column pages outline the design and modeling parameters determined from both the input pages and the Visual Basic design scripts. b. The sheet calculates such parameters as the flexural capacity, steel shear capacity, and stirrup spacing. c. In terms of modeling parameters, the sheets determines such values as the element stiffness, the rotational capacity based on the models developed by Ibarra et al (2005), and the expected moment based on the equations of Panagiotakos and Fardis (2001). d. Major changes to the columns sheets for the IMF design include: i. Adjusting spreadsheet values and formulas for the larger IMF dimensions ii. Changing the shear spacing requirements from SMF provisions to IMF provisions based on ACI
141 133 iii. Adapting the calculation of the governing shear demand to include the values determined based on ACI iv. Adapting the calculation of the total shear capacity required of the steel by including the shear capacity contribution provided by the concrete. Inclusion of concrete shear capacity is allowed for IMF design but not allowed for SMF design. I. Beam Information 1&2: a. The beam pages are similar to the column pages in the sense that they outline the design and modeling parameters determined from both the input pages and the Visual Basic design scripts. b. The sheet determines the flexural capacity, steel shear capacity, and stirrup spacing in the beam member. c. In terms of modeling parameters, the sheets determines such values as the element stiffness, the rotational capacity based on the models developed by Ibarra et al (2005), and the expected moment based on the equations of Panagiotakos and Fardis (2001). d. Major changes to the columns sheets for the IMF design include: i. Adjusting spreadsheet values and formulas for the larger IMF dimensions ii. Updated the minimum reinforcement ratio for the beams. iii. Changing the shear spacing requirements from SMF provisions to IMF provisions based on ACI iv. Adapting the calculation of the governing shear demand to include the values determined based on ACI v. Adapting the calculation of the total shear capacity required of the steel by including the shear capacity contribution provided by the concrete. Inclusion of concrete shear capacity is allowed for IMF design but not allowed for SMF design. J. Joint Information: a. The joint information sheet outlines parameters specific to the joint strength and stiffness. No major changes were done to this page other than not using the joint visual basic command in the design sheet. K. Drift Check: a. The Drift Check Sheet is used to make sure the inter-story drift ratios are below allowable limits. The lateral deflections at each story are pasted from the frame analysis and checked based on the ASCE7-05 allowable limits. The inter-story drift ratios at each story are then check to ensure that they are below 2%. L. Visual Basic Data: a. The Visual Basic Data Sheet is a bookkeeping page that collects design data from various sheets that will then be used by the Visual Basic Design Scripts in the design of detailing for the frame.
142 134 M. Output Documentation of Frames: a. This sheet is used to illustrate the design and modeling parameters for the IMF frame. The design and modeling data is presented on representative frames for presentation purposes. These presentation frames needed to be adapted and all references needed to be updated so that frame would illustrate the IMF frames studied. N. Output to Models: a. The purpose of the Output to Models Sheet to compile model parameters that will be used in the OpenSees Input File. O. DESIGN STEPS: a. Fill in Input Information b. Determine Lateral Forces c. Conduct Frame Analysis with Applicable Software (RISA-2D, MASTAN2, ETABS). d. Paste Design Forces Into Column and Beam Forces Pages e. Process and Sort Column and Beam Forces f. Set reinforcement ratios to minimum values in the Column Info and Beam Info Pages g. Use the Design Sheet to design the reinforcement for strength, spacing, and minimum requirements i. NOTE: Do not Use SCWB design script and Joint Design Script for IMF unless testing for the inclusion of a SCWB ratio or testing the inclusion of joint requirements respectively. ii. Check Design Values in the Column Info and Beam Info Pages iii. Check the frame inter-story drift ratios to ensure that they meet design limits. iv. Use the Visual Basic Scripts to create the OpenSees Input Files v. Copy and Paste Input Files into necessary files for Performance Analysis
143 135 Appendix 3: Overview of OpenSees Modeling Applications and Folders 1. Applications 1.1. OpenSees: The Open System for Earthquake Engineering Simulation OpenSees has been developed by researchers at the University of California, Berkeley as an academic software framework to be used for studying the performance of structures during earthquake simulation The framework can be adapted to specific studies by researchers and offers nonlinear static and dynamic methods, equation solvers, and constraint methods for performance analyses OpenSees can be downloaded from the OpenSees Website administered by the Regents of the University of California: < Tcl (Tool Command Language) Compiler Tcl is command language that is used by OpenSees to access stored earthquake ground records during the analysis and also to compile results during the analysis Tcl can be downloaded directly from the OpenSees website when you are downloading OpenSees Ensure that you download the version of Tcl that will be recognized by the specific version of OpenSees being used Matlab Matlab is used by OpenSees for computation and processing during the analysis. All of the Analysis Files are written in Matlab coding Any recent version of Matlab (2007, 2008) is acceptable for use. 2. Folders 2.1. Overview: The Matlab files used for the OpenSees modeling and analysis are written to access information and applications from specific folders. Therefore, the title and the arrangement of modeling and application folders are very important for the overall analysis procedure The following folders are associated with the OpenSees Modeling and are initially placed in your local C:\ drive as shown in Figure # (MAKE SURE TITLES ARE EXACT) C:\Opensees_Runfolder C:\OpenSeesProcessingFiles

144 136 Figure 70: Local C:\ Drive OpenSees Runfolder The run folder shown in Figure 2 contains the necessary files and folders in order to conduct the analysis: MasterDriver_ProcessPushoverAnalyses_12P.m MasterDriver_RunAndProcessDynamicAnalyses.m The Matlab Processors contains the necessary Matlab files for plotting and post-processing the results of the analysis The Model Folder contains the model folder for each specific model. This is shown in Figure 3. Note that each model has a specific name and numbering. The model folder also contains a fold entitled Sensitivity Analysis which is used in applying earthquake ground motions and saving collapse results The Output Folder is where the analysis will create folders to store output data and plots after the analysis is completed. Separate folders will be created for the Pushover Analysis and the Nonlinear Dynamic Analysis. This is shown in Figure 4.

145 137 Figure 71: OpenSees Runfolder Figure 72: Model Folder

146 138 Figure 73: Output Folder OpenSees Processing Files The Processing Files Folder, shown in Figure 5, contains the saved Earthquake Spectra for the collection of 44 major earthquake records used in the analysis This folder is used by OpenSees to store the earthquake spectra along with the necessary Matlab files for calling the earthquake data during the simulation and analysis Figures 6 and 7 Show the Subfolders for the earthquake spectra and the Matlab Files.

147 139 Figure 74: OpenSees Processing Files Figure 75: Collection of Earthquake Data

148 Figure 76: Earthquake Spectra Matlab Files 140
149 141 Appendix 4: Instructions for Conducting Nonlinear Pushover Analysis 1. Overview: Nonlinear Pushover Analysis 1.1. Create Model Input File from Microsoft Excel Design Sheet Using the Visual Basic Script within the sheet, create the OpenSees Input File to be used for both analyses Copy and Paste the Dynamic Analysis Portion and Pushover Portion of the Input File into ModelCodePastedFromExcelVBA.tcl found in the specific model folder as Shown in Figure NOTE: THE OPENSEES EXE FILE AND TCL SHOULD BOTH BE IN THE SPECIFIC MODEL FOLDER YOU ARE STUDYING Figure 77: Model Input File for Excel Input Open the OpenSees executable file found in the model folder (Seen below the model input file in Figure 1) Type source RunMeanAnalysis.tcl as shown in Figure This not only is a test to see if OpenSees is working but it also creates the necessary output folders and general data needed for the Pushover Analysis.
150 142 Figure 78: OpenSees Window and Run Mean Analysis Command 1.2. Run the Push Over Analysis Copy and Paste the OpenSees Input File for only the Pushover Analysis (as shown in Figure 3) into the model input file shown in Figure 1 ######################################################################################################################### ########### Start of code pasted from Excel Structural Design Sheet output to DefinePushoverLoading.tcl ################# ########### This code was created using a Visual Basic script in the Structural Design Excel sheet ###################### ########### Created by Curt B. Haselton, Stanford University, June 10, 2006 ############################################# ######################################################################################################################### ######################################################################################################################### ### DEFINE PUSHOVER LOADING pattern Plain 2 Linear { # node FX FY MZ load load load load E } ####################################################################################################################### ########### END of code pasted from Excel Structural Design Sheet output to DefinePushoverLoading.tcl ################# ####################################################################################################################### ####################################################################################################################### ####################################################################################################################### Figure 79: Pushover Analysis Input Open the Matlab File: MasterDriver_ProcessPushoverAnalyses_12P.m Ensure the necessary files are specified in the Matlab file The Pushover analysis needs to call on the Output Folder from the RunMeanAnalysis.tcl step Run the program for the Pushover Analysis Analysis should take roughly 3-5 minutes 1.3. Results The analysis will compile and save result data and plots in the model output folder. The output will be in the form of Matlab data files (DATA_allDataForThisSingleRun.mat) and Matlab figures as shown in Figure 4.

151 The figure of interest is the plot of Maximum Base Shear vs. Roof Drift as shown in Figure 5. Figure 80: Pushover Analysis Results Figure 81: Location of Matlab Data File

152 144 Appendix 5: Instructions for Conducting Nonlinear Dynamic Analysis 1. Overview: Nonlinear Dynamic Analysis 1.1. Create Model Input File from Microsoft Excel Design Sheet Using the Visual Basic Script within the sheet, create the OpenSees Input File to be used for both analyses Copy and Paste the Dynamic Analysis Portion of the Input File into ModelCodePastedFromExcelVBA.tcl found in the specific model folder as Shown in Figure NOTE: THE OPENSEES EXE FILE AND TCL SHOULD BOTH BE IN THE SPECIFIC MODEL FOLDER YOU ARE STUDYING Figure 82: Model Input File for Excel Input Open the file entitled SetAnalysisOptions.tcl within the model folder (Figure 2) and change the model references to your current model.
. 1.")
153 145 Figure 83: Set Analysis Options File Copy and Paste the Design Building Info Portion of the OpenSees Input File into the file DefineInfoForBuildings.m found in the Movie and Visual Processors folder within the Matlab Processors Folder (Shown in Figures 3 and 4) Scroll to the bottom of this file to paste the input but make sure all numbers but check entire document before proceeding This file is used to plot the dynamic analysis results for the specific structure. %######################################################################################################################### %########### Start of code pasted from Excel Structural Design Sheet output to DefineInfoForBuildings.m ################## %########### This code was created using a Visual Basic script in the Structural Design Excel sheet ###################### %########### Created by Curt B. Haselton, Stanford University, June 10, 2006 ############################################# %######################################################################################################################### %######################################################################################################################### %### DEFINE BUILDING INFORMATION FOR VISUAL PROCESSING %%%%%%%%%%%%%%%%%%%%%%%%%%%%%%%%%%%%%%%%%%%%%%%%%%%%%%%%%%%%%%%%%%%%%%%%%%%%%%%%%%%% %%%%%% Design ID Start %%%%%%%%%%%%%%%%%%%%%%%%%%%%%%%%%%%%%%%%%%%%%%%%%%%%%%%%%%%% %%%%%%%%%%%%%%%%%%%%%%%%%%%%%%%%%%%%%%%%%%%%%%%%%%%%%%%%%%%%%%%%%%%%%%%%%%%%%%%%%%%% %%%% This code was pasted from the Excel Structural Design Sheet VB output (Dev. by C. Haselton, ) Figure 84: Define Info for Building Input File Heading

154 146 Figure 85: Define Info for Building File Open the OpenSees executable file found in the model folder (Seen below the model input file in Figure 1) Type source RunMeanAnalysis.tcl as shown Figure This not only is a test to see if OpenSees is working but it also creates the necessary output folders and general data needed for the Dynamic Analysis. (Note: you do not need to repeat this if you already did this step in the pushover analysis). Figure 86: OpenSees Window and Run Mean Analysis Command
155 Run the Dynamic Analysis Open the Matlab File MasterDriver_RunAndProcessDynamicAnalyses.m found in the OpenSees Runfolder Change the Input Data at the top of the file so that it matches your current model. (Shown in Figure 6). Figure 87: Matlab File for Dynamic Analysis Run the program for the Dynamic Analysis Analysis should take roughly 12- hours depending on the size of the frame being study NOTE: The Dynamic Analysis is very CPU and Memory intensive. Therefore, ensure that you have enough memory for the output to be saved in the output folder and that the computer has good CPU for running the analysis Results The analysis will compile and save result data and plots in the model output folder. The output will be in the form of Matlab data files (DATA_collapse_CollapseSaAndStats_GMSetC_SaGeoMean.mat) and Matlab figures.
156 The variable of interest is the median collapse level acceleration and the figures of interest are the IDA plots, CDF plots, and the plots of Failure Modes at Collapse Figure 88: IDA Plot Figure 89: CDF Plot
157 Figure 90: Sample Modes of Failure 149
158 150 Appendix 6: Documentation of Design and Modeling Output for IMF Models The following sections summarize the IMF designs for the four models investigated in this study. For each models, the first two figures correspond to the design parameters based on the code provisions and standards, while the third figure corresponds to the modeling parameters determined for use in the OpenSees analysis.
159 Appendix 6.1: Four-Story IMF 151
160 152
161 153

162 Appendix 6.2: Six-Story IMF 154
163 155
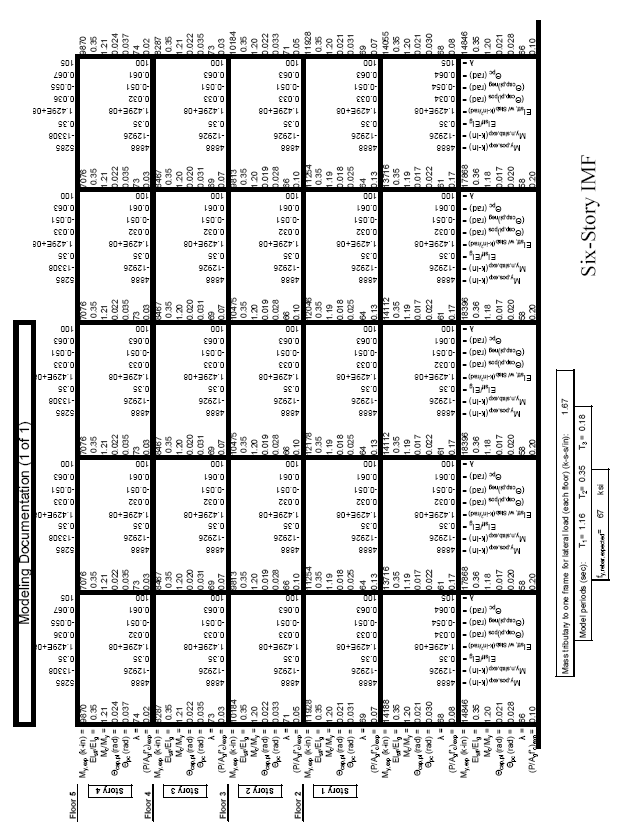
164 156
165 Appendix 6.3: Four-Story IMF SCWB 157
166 158

167 159

168 Appendix 6.4: Six-Story IMF SCWB 160

169 161

170 162
Chapter 3 DESIGN AND CONSTRUCTION FEATURES IMPORTANT TO SEISMIC PERFORMANCE
 Chapter 3 DESIGN AND CONSTRUCTION FEATURES IMPORTANT TO SEISMIC PERFORMANCE To satisfy the performance goals of the NEHRP Recommended Seismic Provisions, a number of characteristics are important to the
SEISMIC DESIGN. Various building codes consider the following categories for the analysis and design for earthquake loading:
 SEISMIC DESIGN Various building codes consider the following categories for the analysis and design for earthquake loading: 1. Seismic Performance Category (SPC), varies from A to E, depending on how the
SEISMIC DESIGN OF MULTI-STORY BUILDINGS WITH METALLIC STRUCTURAL FUSES. R. Vargas 1 and M. Bruneau 2 ABSTRACT
 Proceedings of the 8 th U.S. National Conference on Earthquake Engineering April 18-22, 26, San Francisco, California, USA Paper No. 28 SEISMIC DESIGN OF MULTI-STORY BUILDINGS WITH METALLIC STRUCTURAL
Prepared For San Francisco Community College District 33 Gough Street San Francisco, California 94103. Prepared By
 Project Structural Conditions Survey and Seismic Vulnerability Assessment For SFCC Civic Center Campus 750 Eddy Street San Francisco, California 94109 Prepared For San Francisco Community College District
bi directional loading). Prototype ten story
. Prototype ten story") NEESR SG: Behavior, Analysis and Design of Complex Wall Systems The laboratory testing presented here was conducted as part of a larger effort that employed laboratory testing and numerical simulation
NEESR SG: Behavior, Analysis and Design of Complex Wall Systems The laboratory testing presented here was conducted as part of a larger effort that employed laboratory testing and numerical simulation
SEISMIC RETROFITTING OF STRUCTURES
 SEISMIC RETROFITTING OF STRUCTURES RANJITH DISSANAYAKE DEPT. OF CIVIL ENGINEERING, FACULTY OF ENGINEERING, UNIVERSITY OF PERADENIYA, SRI LANKA ABSTRACT Many existing reinforced concrete structures in present
DISASTER RESISTANCE EARTHQUAKES AND STRUCTURES
 DISASTER RESISTANCE EARTHQUAKES AND STRUCTURES EARTHQUAKES Origin of earthquakes The earth was a single land about two hundred million years ago. This land split progressively over a long period of time
SEISMIC DESIGN PROVISIONS FOR PRECAST CONCRETE STRUCTURES. S.K. Ghosh, Ph. D. President S.K. Ghosh Associates Inc. Northbrook, IL BACKGROUND
 SEISMIC DESIGN PROVISIONS FOR PRECAST CONCRETE STRUCTURES S.K. Ghosh, Ph. D. President S.K. Ghosh Associates Inc. Northbrook, IL BACKGROUND Until recently, precast concrete structures could be built in
Miss S. S. Nibhorkar 1 1 M. E (Structure) Scholar,
 Scholar,") Volume, Special Issue, ICSTSD Behaviour of Steel Bracing as a Global Retrofitting Technique Miss S. S. Nibhorkar M. E (Structure) Scholar, Civil Engineering Department, G. H. Raisoni College of Engineering
Volume, Special Issue, ICSTSD Behaviour of Steel Bracing as a Global Retrofitting Technique Miss S. S. Nibhorkar M. E (Structure) Scholar, Civil Engineering Department, G. H. Raisoni College of Engineering
Rehabilitation of a 1985 Steel Moment- Frame Building
 Rehabilitation of a 1985 Steel Moment- Frame Building Gregg Haskell, a) M.EERI A 1985 steel moment frame is seismically upgraded using passive energy dissipation, without adding stiffness to the system.
G. Michele Calvi IUSS Pavia
 CONVEGNO SISMA ED ELEMENTI NON STRUTTURALI Approcci, Stati Limite e Verifiche Prestazionali Bologna 24 ottobre 2014 PROGETTO DI ELEMENTI NON STRUTTURALI SOGGETTI AD AZIONI SISMICHE G. Michele Calvi IUSS
Name Date Class. By studying the Vocabulary and Notes listed for each section below, you can gain a better understanding of this chapter.
 CHAPTER 7 VOCABULARY & NOTES WORKSHEET Earthquakes By studying the Vocabulary and Notes listed for each section below, you can gain a better understanding of this chapter. SECTION 1 Vocabulary In your
Earthquakes and Data Centers
 7x24 Exchange Fall Symposium September 11, 2013 Hilton Bellevue Andrew W. Taylor, Ph.D., S.E., FACI Earthquake Hazards 2 September 11, 2013 1 Cascadia Earthquake Sources Figure Credit: Craig Weaver, Pacific
EARTHQUAKES. Compressional Tensional Slip-strike
 Earthquakes-page 1 EARTHQUAKES Earthquakes occur along faults, planes of weakness in the crustal rocks. Although earthquakes can occur anywhere, they are most likely along crustal plate boundaries, such
SEISMIC RETROFIT DESIGN CRITERIA
 SEISMIC RETROFIT DESIGN CRITERIA British Columbia Ministry of Transportation June 30, 2005 Prepared by: Recommended by: Approved by: Don Kennedy, P.Eng., Associated Engineering (BC) Sharlie Huffman, P.
Reinforced Concrete Design
 FALL 2013 C C Reinforced Concrete Design CIVL 4135 ii 1 Chapter 1. Introduction 1.1. Reading Assignment Chapter 1 Sections 1.1 through 1.8 of text. 1.2. Introduction In the design and analysis of reinforced
Earthquakes. Earthquakes: Big Ideas. Earthquakes
 Earthquakes Earthquakes: Big Ideas Humans cannot eliminate natural hazards but can engage in activities that reduce their impacts by identifying high-risk locations, improving construction methods, and
CONTRASTING DISPLACEMENT DEMANDS OF DUCTILE STRUCTURES FROM TOHOKU SUBDUCTION TO CRUSTAL EARTHQUAKE RECORDS. Peter Dusicka 1 and Sarah Knoles 2
 CONTRASTING DISPLACEMENT DEMANDS OF DUCTILE STRUCTURES FROM TOHOKU SUBDUCTION TO CRUSTAL EARTHQUAKE RECORDS Abstract Peter Dusicka 1 and Sarah Knoles 2 With the impending Cascadia subduction zone event
SEISMIC UPGRADE OF OAK STREET BRIDGE WITH GFRP
 13 th World Conference on Earthquake Engineering Vancouver, B.C., Canada August 1-6, 2004 Paper No. 3279 SEISMIC UPGRADE OF OAK STREET BRIDGE WITH GFRP Yuming DING 1, Bruce HAMERSLEY 2 SUMMARY Vancouver
Seismic Risk Evaluation of a Building Stock and Retrofit Prioritization
 Seismic Risk Evaluation of a Building Stock and Retrofit Prioritization Seismic risk assessment of large building stocks can be conducted at various s depending on the objectives, size of the building
PERFORMANCE BASED SEISMIC EVALUATION AND RETROFITTING OF UNSYMMETRICAL MEDIUM RISE BUILDINGS- A CASE STUDY
 Paper No. 682 PERFORMANCE BASED SEISMIC EVALUATION AND RETROFITTING OF UNSYMMETRICAL MEDIUM RISE BUILDINGS- A CASE STUDY Jimmy Chandra, Pennung Warnitchai, Deepak Rayamajhi, Naveed Anwar and Shuaib Ahmad
Methods for Seismic Retrofitting of Structures
 Methods for Seismic Retrofitting of Structures Retrofitting of existing structures with insufficient seismic resistance accounts for a major portion of the total cost of hazard mitigation. Thus, it is
Unit 4 Lesson 6 Measuring Earthquake Waves. Copyright Houghton Mifflin Harcourt Publishing Company
 Shake, Rattle, and Roll What happens during an earthquake? As plates of the lithosphere move, the stress on rocks at or near the edges of the plates increases. This stress causes faults to form. A fault
THE RELIABILITY OF CAPACITY-DESIGNED COMPONENTS IN SEISMIC RESISTANT SYSTEMS
 THE RELIABILITY OF CAPACITY-DESIGNED COMPONENTS IN SEISMIC RESISTANT SYSTEMS A DISSERTATION SUBMITTED TO THE DEPARTMENT OF CIVIL AND ENVIRIONMENTAL ENGINEERING AND THE COMMITTEE ON GRADUATE STUDIES OF
CH. 2 LOADS ON BUILDINGS
 CH. 2 LOADS ON BUILDINGS GRAVITY LOADS Dead loads Vertical loads due to weight of building and any permanent equipment Dead loads of structural elements cannot be readily determined b/c weight depends
Glossary. continental crust: the sections of crust, the outermost layer of the earth, that include the continents
 aftershock: an earthquake that follows a larger earthquake or main shock and originates in or near the rupture zone of the larger earthquake. Generally, major earthquakes are followed by a number of aftershocks
EARTHQUAKE MAGNITUDE
 EARTHQUAKE MAGNITUDE Earliest measure of earthquake size Dimensionless number measured various ways, including M L local magnitude m b body wave magnitude M s surface wave magnitude M w moment magnitude
Seismic performance evaluation of an existing school building in Turkey
 CHALLENGE JOURNAL OF STRUCTURAL MECHANICS 1 (4) (2015) 161 167 Seismic performance evaluation of an existing school building in Turkey Hüseyin Bilgin * Department of Civil Engineering, Epoka University,
Nonlinear Structural Analysis For Seismic Design
 NIST GCR 10-917-5 NEHRP Seismic Design Technical Brief No. 4 Nonlinear Structural Analysis For Seismic Design A Guide for Practicing Engineers Gregory G. Deierlein Andrei M. Reinhorn Michael R. Willford
Seismic Risk Prioritization of RC Public Buildings
 Seismic Risk Prioritization of RC Public Buildings In Turkey H. Sucuoğlu & A. Yakut Middle East Technical University, Ankara, Turkey J. Kubin & A. Özmen Prota Inc, Ankara, Turkey SUMMARY Over the past
FOUNDATION DESIGN. Instructional Materials Complementing FEMA 451, Design Examples
 FOUNDATION DESIGN Proportioning elements for: Transfer of seismic forces Strength and stiffness Shallow and deep foundations Elastic and plastic analysis Foundation Design 14-1 Load Path and Transfer to
Performance-based Evaluation of the Seismic Response of Bridges with Foundations Designed to Uplift
 Performance-based Evaluation of the Seismic Response of Bridges with Foundations Designed to Uplift Marios Panagiotou Assistant Professor, University of California, Berkeley Acknowledgments Pacific Earthquake
Long term performance of polymers
 1.0 Introduction Long term performance of polymers Polymer materials exhibit time dependent behavior. The stress and strain induced when a load is applied are a function of time. In the most general form
Cover. When to Specify Intermediate Precast Concrete Shear Walls. 10.10 Rev 4. White Paper WP004
 Cover Introduction In regard to precast concrete systems, the addition of two new categories of Seismic Force Resisting Systems (SFRS) in IBC 2006 has created some confusion about whether to specify intermediate
FOURTH GRADE EARTHQUAKES 1 WEEK LESSON PLANS AND ACTIVITIES
 FOURTH GRADE EARTHQUAKES 1 WEEK LESSON PLANS AND ACTIVITIES PLATE TECTONIC CYCLE OVERVIEW OF FOURTH GRADE VOLCANOES WEEK 1. PRE: Comparing different structures of volcanoes. DURING: Modeling three types
Georgia Performance Standards Framework for Shaky Ground 6 th Grade
 The following instructional plan is part of a GaDOE collection of Unit Frameworks, Performance Tasks, examples of Student Work, and Teacher Commentary. Many more GaDOE approved instructional plans are
6 RETROFITTING POST & PIER HOUSES
 Retrofitting Post & Pier Houses 71 6 RETROFITTING POST & PIER HOUSES by James E. Russell, P.E. 72 Retrofitting Post & Pier Houses Retrofitting Post & Pier Houses 73 RETROFITTING POST AND PIER HOUSES This
AN IMPROVED SEISMIC DESIGN APPROACH FOR TWO-COLUMN REINFORCED CONCRETE BENTS OVER FLEXIBLE FOUNDATIONS WITH PREDEFINED DAMAGE LEVELS
 AN IMPROVED SEISMIC DESIGN APPROACH FOR TWO-COLUMN REINFORCED CONCRETE BENTS OVER FLEXIBLE FOUNDATIONS WITH PREDEFINED DAMAGE LEVELS ABSTRACT: T. Yılmaz 1 ve A. Caner 2 1 Araştırma Görevlisi, İnşaat Müh.
REVISION OF GUIDELINE FOR POST- EARTHQUAKE DAMAGE EVALUATION OF RC BUILDINGS IN JAPAN
 10NCEE Tenth U.S. National Conference on Earthquake Engineering Frontiers of Earthquake Engineering July 21-25, 2014 Anchorage, Alaska REVISION OF GUIDELINE FOR POST- EARTHQUAKE DAMAGE EVALUATION OF RC
CE591 Fall 2013 Lecture 26: Moment Connections
 CE591 Fall 2013 Lecture 26: Moment Connections Explain basic design procedure for moment (FR) connections Explain considerations for connections in momentresisting frames for seismic demands Describe problems
ASSESSMENT AND PROPOSED STRUCTURAL REPAIR STRATEGIES FOR BRIDGE PIERS IN TAIWAN DAMAGED BY THE JI-JI EARTHQUAKE ABSTRACT
 ASSESSMENT AND PROPOSED STRUCTURAL REPAIR STRATEGIES FOR BRIDGE PIERS IN TAIWAN DAMAGED BY THE JI-JI EARTHQUAKE Pei-Chang Huang 1, Graduate Research Assistant / MS Candidate Yao T. Hsu 2, Ph.D., PE, Associate
SEISMIC RETROFITTING STRATEGIES FOR BRIDGES IN MODERATE EARTHQUAKE REGIONS
 SEISMIC RETROFITTING STRATEGIES FOR BRIDGES IN MODERATE EARTHQUAKE REGIONS ABSTRACT Ayaz H. Malik, P.E. Project Engineer New York State Department of Transportation Certain parts of the United States have
EFFECTS ON NUMBER OF CABLES FOR MODAL ANALYSIS OF CABLE-STAYED BRIDGES
 EFFECTS ON NUMBER OF CABLES FOR MODAL ANALYSIS OF CABLE-STAYED BRIDGES Yang-Cheng Wang Associate Professor & Chairman Department of Civil Engineering Chinese Military Academy Feng-Shan 83000,Taiwan Republic
Technical Notes 3B - Brick Masonry Section Properties May 1993
 Technical Notes 3B - Brick Masonry Section Properties May 1993 Abstract: This Technical Notes is a design aid for the Building Code Requirements for Masonry Structures (ACI 530/ASCE 5/TMS 402-92) and Specifications
Presentations. Session 1. Slide 1. Earthquake Risk Reduction. 1- Concepts & Terminology
 Earthquake Risk Reduction Presentations Session 1 Slide 1 Earthquake Risk Reduction 1- Concepts & Terminology Welcome to the World Bank Institute s (WBI) Distance Learning (DL) course on Earthquake Risk
Physics 9e/Cutnell. correlated to the. College Board AP Physics 1 Course Objectives
 Physics 9e/Cutnell correlated to the College Board AP Physics 1 Course Objectives Big Idea 1: Objects and systems have properties such as mass and charge. Systems may have internal structure. Enduring
DESIGN SPECIFICATIONS FOR HIGHWAY BRIDGES PART V SEISMIC DESIGN
 DESIGN SPECIFICATIONS FOR HIGHWAY BRIDGES PART V SEISMIC DESIGN MARCH 2002 CONTENTS Chapter 1 General... 1 1.1 Scope... 1 1.2 Definition of Terms... 1 Chapter 2 Basic Principles for Seismic Design... 4
EVALUATION OF SEISMIC RESPONSE - FACULTY OF LAND RECLAMATION AND ENVIRONMENTAL ENGINEERING -BUCHAREST
 EVALUATION OF SEISMIC RESPONSE - FACULTY OF LAND RECLAMATION AND ENVIRONMENTAL ENGINEERING -BUCHAREST Abstract Camelia SLAVE University of Agronomic Sciences and Veterinary Medicine of Bucharest, 59 Marasti
AP1 Oscillations. 1. Which of the following statements about a spring-block oscillator in simple harmonic motion about its equilibrium point is false?
 1. Which of the following statements about a spring-block oscillator in simple harmonic motion about its equilibrium point is false? (A) The displacement is directly related to the acceleration. (B) The
Untopped Precast Concrete Diaphragms in High-Seismic Applications. Ned M. Cleland, Ph.D., P.E. President Blue Ridge Design, Inc. Winchester, Virginia
 Untopped Precast Concrete Diaphragms in High-Seismic Applications Ned M. Cleland, Ph.D., P.E. President Blue Ridge Design, Inc. Winchester, Virginia S. K. Ghosh, Ph.D. President S. K. Ghosh Associates,
Hybrid simulation evaluation of the suspended zipper braced frame
 Hybrid simulation evaluation of the suspended zipper braced frame Tony Yang Post-doctoral scholar University of California, Berkeley Acknowledgements: Andreas Schellenberg, Bozidar Stojadinovic, Jack Moehle
TECTONICS ASSESSMENT
 Tectonics Assessment / 1 TECTONICS ASSESSMENT 1. Movement along plate boundaries produces A. tides. B. fronts. C. hurricanes. D. earthquakes. 2. Which of the following is TRUE about the movement of continents?
NIST GCR 10-917-9 Applicability of Nonlinear Multiple-Degree-of-Freedom Modeling for Design
 NIST GCR 0-97-9 Applicability of Nonlinear Multiple-Degree-of-Freedom Modeling for Design NEHRP Consultants Joint Venture A Partnership of the Applied Technology Council and the Consortium of Universities
Pore pressure. Ordinary space
 Fault Mechanics Laboratory Pore pressure scale Lowers normal stress, moves stress circle to left Doesn Doesn t change shear Deviatoric stress not affected This example: failure will be by tensile cracks
SMIP05 Seminar Proceedings VISUALIZATION OF NONLINEAR SEISMIC BEHAVIOR OF THE INTERSTATE 5/14 NORTH CONNECTOR BRIDGE. Robert K.
 VISUALIZATION OF NONLINEAR SEISMIC BEHAVIOR OF THE INTERSTATE 5/14 NORTH CONNECTOR BRIDGE Robert K. Dowell Department of Civil and Environmental Engineering San Diego State University Abstract This paper
Critical Facility Round Table
 Critical Facility Round Table October 16, 2003 San Francisco Seismic Risk for Data Centers David Bonneville Senior Principal Degenkolb Engineers San Francisco, California Presentation Outline Seismic Risk
SOUTH AFRICAN NATIONAL INSTITUTE OF ROCK MECHANICS CHAMBER OF MINES OF SOUTH AFRICA CERTIFICATE IN ROCK MECHANICS PART 1 ROCK MECHANICS THEORY
 SOUTH AFRICAN NATIONAL INSTITUTE OF ROCK MECHANICS CHAMBER OF MINES OF SOUTH AFRICA CERTIFICATE IN ROCK MECHANICS PART 1 ROCK MECHANICS THEORY SYLLABUS Copyright 2006 SANIRE CONTENTS PREAMBLE... 3 TOPICS
Current Status of Seismic Retrofitting Technology
 CONTENTS Current Status of Seismic Retrofitting Technology Damages of Past Earthquakes Seismic Diagnosis Method Building Control Section Urban Building Division Bureau of Urban Development, TMG Seismic
Magnitude 7.2 GUERRERO, MEXICO
 A powerful magnitude-7.2 earthquake shook central and southern Mexico on Friday. The earthquake occurred at a depth of 24 km (15 miles). Its epicenter was in the western state of Guerrero, near the seaside
DESIGN DRIFT REQUIREMENTS FOR LONG-PERIOD STRUCTURES
 13 th World Conference on Earthquake Engineering Vancouver, B.C., Canada August 1-6, 2004 Paper No. 3292 DESIGN DRIFT REQUIREMENTS FOR LONG-PERIOD STRUCTURES Gary R. Searer 1 and Sigmund A. Freeman 2 SUMMARY
SEISMIC CAPACITY OF EXISTING RC SCHOOL BUILDINGS IN OTA CITY, TOKYO, JAPAN
 SEISMIC CAPACITY OF EXISTING RC SCHOOL BUILDINGS IN OTA CITY, TOKYO, JAPAN Toshio OHBA, Shigeru TAKADA, Yoshiaki NAKANO, Hideo KIMURA 4, Yoshimasa OWADA 5 And Tsuneo OKADA 6 SUMMARY The 995 Hyogoken-nambu
Tensile Testing Laboratory
 Tensile Testing Laboratory By Stephan Favilla 0723668 ME 354 AC Date of Lab Report Submission: February 11 th 2010 Date of Lab Exercise: January 28 th 2010 1 Executive Summary Tensile tests are fundamental
Control of Seismic Drift Demand for Reinforced Concrete Buildings with Weak First Stories
 Earthquake Yoshimura: Engineering Control and of Engineering Seismic Drift Seismology Demand for Reinforced Concrete Buildings with Weak First Stories 7 Volume 4, Number, September 3, pp. 7 3 Control of
Modeling Mechanical Systems
 chp3 1 Modeling Mechanical Systems Dr. Nhut Ho ME584 chp3 2 Agenda Idealized Modeling Elements Modeling Method and Examples Lagrange s Equation Case study: Feasibility Study of a Mobile Robot Design Matlab
CONTRIBUTION TO THE IAEA SOIL-STRUCTURE INTERACTION KARISMA BENCHMARK
 CONTRIBUTION TO THE IAEA SOIL-STRUCTURE INTERACTION KARISMA BENCHMARK Presented by F. Wang (CEA, France), CLUB CAST3M 2013 28/11/2013 5 DÉCEMBRE 2013 CEA 10 AVRIL 2012 PAGE 1 CONTRIBUTION TO THE IAEA SSI
Five reasons buildings fail in an earthquake and how to avoid them
 Five reasons buildings fail in an earthquake and how to avoid them by Jeff White, AIA Published in Healthcare Design magazine There s a saying among seismologists: Earthquakes don t kill people. Buildings
Design of reinforced concrete columns. Type of columns. Failure of reinforced concrete columns. Short column. Long column
 Design of reinforced concrete columns Type of columns Failure of reinforced concrete columns Short column Column fails in concrete crushed and bursting. Outward pressure break horizontal ties and bend
1.054/1.541 Mechanics and Design of Concrete Structures (3-0-9) Outline 1 Introduction / Design Criteria for Reinforced Concrete Structures
 Outline 1 Introduction / Design Criteria for Reinforced Concrete Structures") Prof. Oral Buyukozturk Massachusetts Institute of Technology Outline 1 1.054/1.541 Mechanics and Design of Concrete Structures (3-0-9) Outline 1 Introduction / Design Criteria for Reinforced Concrete Structures
Prof. Oral Buyukozturk Massachusetts Institute of Technology Outline 1 1.054/1.541 Mechanics and Design of Concrete Structures (3-0-9) Outline 1 Introduction / Design Criteria for Reinforced Concrete Structures
Chapter 5: Earthquakes
 Chapter 5: Earthquakes 1. Experiencing an Earthquake firsthand 2. The Science of Ghost Forests and Megaearthquakes 3. Faults, Earthquakes, and Plate Tectonics 4. Seismic Waves and Earthquake Detection
Earthquake Hazards and Risks
 Page 1 of 7 EENS 3050 Tulane University Natural Disasters Prof. Stephen A. Nelson Earthquake Hazards and Risks This page last updated on 28-Aug-2013 Earthquake Risk Many seismologists have said that "earthquakes
Structural Axial, Shear and Bending Moments
 Structural Axial, Shear and Bending Moments Positive Internal Forces Acting Recall from mechanics of materials that the internal forces P (generic axial), V (shear) and M (moment) represent resultants
RECOMMENDATIONS FOR THE DESIGN AND CONSTRUCTION OF BASE ISOLATED STRUCTURES
 136 RECOMMENDATIONS FOR THE DESIGN AND CONSTRUCTION OF BASE ISOLATED STRUCTURES 1 2 3 4 R.W.G. Blakeiey, A. W. Charleson, H.C. Hitchcock, L. M. Megget, SYNOPSIS M.J.N. Priestley b f R.D. Sharpe 6 R.I.
CEE 227 -- Earthquake Resistant Design. General Information
 University of California at Berkeley Civil and Environmental Engineering Instructor: Stephen A. Mahin Spring Semester 2007 CEE 227 -- Earthquake Resistant Design General Information Course Objectives This
89.325 Geology for Engineers Earthquakes
 89.325 Geology for Engineers Earthquakes Name I. Introduction The crust of the earth behaves in a brittle manner. Stress is the force applied to a brittle substance and strain represents the build-up of
Requirements for the Use of PRESSS Moment-Resisting Frame Systems
 Requirements for the Use of PRESSS Moment-Resisting Frame Systems Neil M. Hawkins, Ph.D. Professor Emeritus Department of Civil Engineering University of Illinois at Urbana-Champaign Urbana, Illinois S.
Chapter. Earthquake Damage: Types, Process, Categories
 3 Chapter Earthquake Damage: Types, Process, Categories Earthquakes leave behind a trail of damage and destruction. People s lives are affected by the loss of loved ones, destruction of property, economic
Expected Performance Rating System
 Expected Performance Rating System In researching seismic rating systems to determine how to best classify the facilities within the Portland Public School system, we searched out what was used by other
Physics 2A, Sec B00: Mechanics -- Winter 2011 Instructor: B. Grinstein Final Exam
 Physics 2A, Sec B00: Mechanics -- Winter 2011 Instructor: B. Grinstein Final Exam INSTRUCTIONS: Use a pencil #2 to fill your scantron. Write your code number and bubble it in under "EXAM NUMBER;" an entry
SECTION 7 Engineered Buildings Field Investigation
 SECTION 7 Engineered Buildings Field Investigation Types of Data to Be Collected and Recorded A field investigator looking at engineered buildings is expected to assess the type of damage to buildings.
Stress Strain Relationships
 Stress Strain Relationships Tensile Testing One basic ingredient in the study of the mechanics of deformable bodies is the resistive properties of materials. These properties relate the stresses to the
SPECIFICATIONS, LOADS, AND METHODS OF DESIGN
 CHAPTER Structural Steel Design LRFD Method Third Edition SPECIFICATIONS, LOADS, AND METHODS OF DESIGN A. J. Clark School of Engineering Department of Civil and Environmental Engineering Part II Structural
Objectives. Experimentally determine the yield strength, tensile strength, and modules of elasticity and ductility of given materials.
 Lab 3 Tension Test Objectives Concepts Background Experimental Procedure Report Requirements Discussion Objectives Experimentally determine the yield strength, tensile strength, and modules of elasticity
The Severity of an Earthquake - ---- U.S. Department of the Interior/Geological Survey
 The Severity of an Earthquake - ---- U.S. Department of the Interior/Geological Survey ----~ Earthquakes can be measured in terms of either the effect of the earthquake (intensity) or of the energy released
Seismic Design of Steel Special Moment Frames:
 NIST GCR 09-917-3 NEHRP Seismic Design Technical Brief No. 2 Seismic Design of Steel Special Moment Frames: A Guide for Practicing Engineers Ronald O. Hamburger Helmut Krawinkler James O. Malley Scott
4B-2. 2. The stiffness of the floor and roof diaphragms. 3. The relative flexural and shear stiffness of the shear walls and of connections.
 Shear Walls Buildings that use shear walls as the lateral force-resisting system can be designed to provide a safe, serviceable, and economical solution for wind and earthquake resistance. Shear walls
Pancake-type collapse energy absorption mechanisms and their influence on the final outcome (complete version)
") Report, Structural Analysis and Steel Structures Institute, Hamburg University of Technology, Hamburg, June, 2013 Pancake-type collapse energy absorption mechanisms and their influence on the final outcome
Report, Structural Analysis and Steel Structures Institute, Hamburg University of Technology, Hamburg, June, 2013 Pancake-type collapse energy absorption mechanisms and their influence on the final outcome
The Dynamic Crust 2) EVIDENCE FOR CRUSTAL MOVEMENT
 EVIDENCE FOR CRUSTAL MOVEMENT") The Dynamic Crust 1) Virtually everything you need to know about the interior of the earth can be found on page 10 of your reference tables. Take the time to become familiar with page 10 and everything
The Dynamic Crust 1) Virtually everything you need to know about the interior of the earth can be found on page 10 of your reference tables. Take the time to become familiar with page 10 and everything
Structural Dynamics of Linear Elastic Single-Degree-of-Freedom (SDOF) Systems
 Systems") Structural Dynamics of Linear Elastic Single-Degree-of-Freedom (SDOF) Systems SDOF Dynamics 3-1 This set of slides covers the fundamental concepts of structural dynamics of linear elastic single-degree-of-freedom
Structural Dynamics of Linear Elastic Single-Degree-of-Freedom (SDOF) Systems SDOF Dynamics 3-1 This set of slides covers the fundamental concepts of structural dynamics of linear elastic single-degree-of-freedom
Modern Codes for Design of Concrete Concrete Structures Presentation Outline
 Modern Codes for Design of Concrete Structures James K. Wight F.E. Richart, Jr. Professor of Civil Eng. University of Michigan Presentation Outline Current Codes Where did they come from? What is their
INTRODUCTION TO BEAMS
 CHAPTER Structural Steel Design LRFD Method INTRODUCTION TO BEAMS Third Edition A. J. Clark School of Engineering Department of Civil and Environmental Engineering Part II Structural Steel Design and Analysis
Dynamic Behaviour of Reinforced Concrete Frames Designed with Direct Displacement-Based Design
 European School for Advanced Studies in Reduction of Seismic Risk Research Report No. ROSE-/ Dynamic Behaviour of Reinforced Concrete Frames ed with Direct Displacement-Based by J. Didier Pettinga Graduate
Seismic Isolated Hospital Design Practice in Turkey: Erzurum Medical Campus
 Seismic Isolated Hospital Design Practice in Turkey: Erzurum Medical Campus J. Kubin, D. Kubin, A. Özmen, O.B. Şadan, E. Eroğlu Prota Engineering Design and Consultancy Services Inc. H. Sucuoğlu, S. Akkar
DESIGN OF BLAST RESISTANT BUILDINGS IN AN LNG PROCESSING PLANT
 DESIGN OF BLAST RESISTANT BUILDINGS IN AN LNG PROCESSING PLANT Troy Oliver 1, Mark Rea 2 ABSTRACT: This paper provides an overview of the work undertaken in the design of multiple buildings for one of
SEISMIC RETROFITTING TECHNIQUE USING CARBON FIBERS FOR REINFORCED CONCRETE BUILDINGS
 Fracture Mechanics of Concrete Structures Proceedings FRAMCOS-3 AEDIFICA TIO Publishers, D-79104 Freiburg, Germany SEISMIC RETROFITTING TECHNIQUE USING CARBON FIBERS FOR REINFORCED CONCRETE BUILDINGS H.
How do scientists measure earthquakes?
 Name: Source: http://www.scholastic.com/browse/article.jsp?id=4892 http://gizmodo.com/5833688/what-do-earthquake-magnitudes-mean http://www.kids-fun-science.com/moment-magnitude-scale.html http://tremor.nmt.edu/faq/how.html
THE EFFECT OF STIRRUPS AND HOOKED STEEL FIBERS INSTEAD ON MOMENT-ROTATION CAPACITY OF BEAM-COLUMN CONNECTIONS
 THE EFFECT OF STIRRUPS AND HOOKED STEEL FIBERS INSTEAD ON MOMENT-ROTATION CAPACITY OF BEAM-COLUMN CONNECTIONS Assist. Prof. Dr. S. KamilAkın 1, Assist. Prof. Dr. Nail Kara 1, 1 Department of Civil Engineering,