Overview and Introduction to Scientific Visualization
|
|
|
- Jeffrey Wade
- 9 years ago
- Views:
Transcription
1 Overview and Introduction to Scientific Visualization Texas Advanced Computing Center The University of Texas at Austin

2 Before We Begin Please: Open a browser Go to // g1yteg6fp878hqm/bz3nxq8km_ Download disk_out_ref.ex2 Download and unzip smallwrf.zip

3 Scientific Visualization The purpose of computing is insight not numbers. -- R. W. Hamming (1961)
")
4 Visualization Process Summary A picture is worth not just 1000 words, but potentially tera- or peta-bytes of data Larger datasets demand not just visualization, but advanced visualization resources and techniques Visualization system technology leverages lots of advancing technologies: GPUs, high-speed networks, web technology. Visualization software takes time to adapt

5 Today Introduction to Visualization Information Visualization Scientific Data Visualization With Paraview Parallel Visualization For Very Large Data

6 Visualization of Large Scale Turbulent Flow Kelly Gaither, Hank Childs, Greg Johnson, Karl Schulz, Cyrus Harrison, Diego Donzis, Texas A&M; P.K. Yeung, Georgia Tech Remote interactive visualization of 17 time-steps (34 TB) of the largest turbulent flow simulation computed to date ( ). First time this had been visualized interactively at this scale. Equal parts data mining and remote interactive visualization goal was to characterize flow behavior over time. Gaither, K., Childs, H., Schulz, K., Harrison, C., Barth, W., Donzis, D., and Yeung, P.K., Using Visualization and Data Analysis to Understand Critical Structures in Massive Time Varying Turbulent Flow Simulations, IEEE Computer Graphics and Applications, 32(4), Jul/Aug 2012.
 of the largest turbulent flow simulation computed to date (4096 3 ).")
7 Stellar Magnetism Greg Foss, TACC; Ben Brown, University of Wisconsin, Madison A Sun-like star undergoes magnetic cyclic reversal shown by field lines. Shifts in positive and negative polarity demonstrate largescale polarity changes in the star. Wreath-like areas in the magnetic field may be the source of Sun spots. Terabytes of data to mine through and visualize.

8 Coronary Artery Nano-particle Drug Delivery Visualization Ben Urick, Jo Wozniak, Karla Vega, TACC; Erik Zumalt, FIC; Shaolie Hossain, Tom Hughes, ICES. A computational tool-set was developed to support the design and analysis of a catheter-based local drug delivery system that uses nanoparticles as drug carriers to treat vulnerable plaques and diffuse atherosclerosis. The tool is now poised to be used in medical device industry to address important design questions such as, "given a particular desired drug-tissue concentration in a specific patient, what would be the optimum location, particle release mechanism, drug release rate, drug properties, and so forth, for maximum efficacy? The goal of this project is to create a visualization that explains the process of simulating local nanoparticulate drug delivery systems. The visualization makes use of 3DS Max, Maya, EnSight and ParaView.

9 Volume Visualization of Tera-Scale Global Seismic Wave Propagation Carsten Burstedde, Omar Ghattas, James Martin, Georg Stadler and Lucas Wilcox, ICES; Greg Abram, TACC Modeling propagation of seismic waves through the earth helps assess seismic hazard at regional scales and aids in interpretation of earth's interior structure at global scales. Discontinuous Galerkin method used to for numerical solution of the seismic wave propagation partial differential equations. Visualization corresponds to a simulation of global wave propagation from a simplified model of the 2011 Tohoku earthquake with a central source frequency of 1/85 Hz, using 93 million unknowns on TACC s Lonestar system.

10 H1N1 Flu Outbreak Simulation: Integrating Science and Art Greg Johnson, Brandt Westing, Karla Vega, Kelly Gaither, TACC; Ned Dimitrov, Lauren Meyers, UT Comp. Bio; Francesca Samsel, Austin, TX. Visualization of a swine flu epidemic spreading throughout North America. Epidemic begins in Mexico City. Visualization classifies individuals into three groups: susceptible (blue), infected (red), and recovered (green). Available antivirals are shown in purple. Cities and transportation links are highlighted in red to indicate large numbers of infected individuals and infectious travelers.

11 Texas Pandemic Flu Toolkit Greg Johnson, Adam Kubach, TACC; Lauren Meyers & group, UT Biology; David Morton & group, UT ORIE.

12 Visualizing Distributed Learning Weijia Xu, Karla Vega, Makoto Sadahiro Researchers are conducting studies to compare the effectiveness of virtual and real manipulatives in the support and success of learning This research explores the use of information and scientific visualization tools for data mining and feature detection

13
14

15 Visualization Allows Us to See the Science Raw Data Visualization Application

16 Getting from Data to Insight Data Source Data Representation Visualization Algorithms Rendering Display Computational Refinement Changing Changing Steering Techniques View And using insight to get more insight

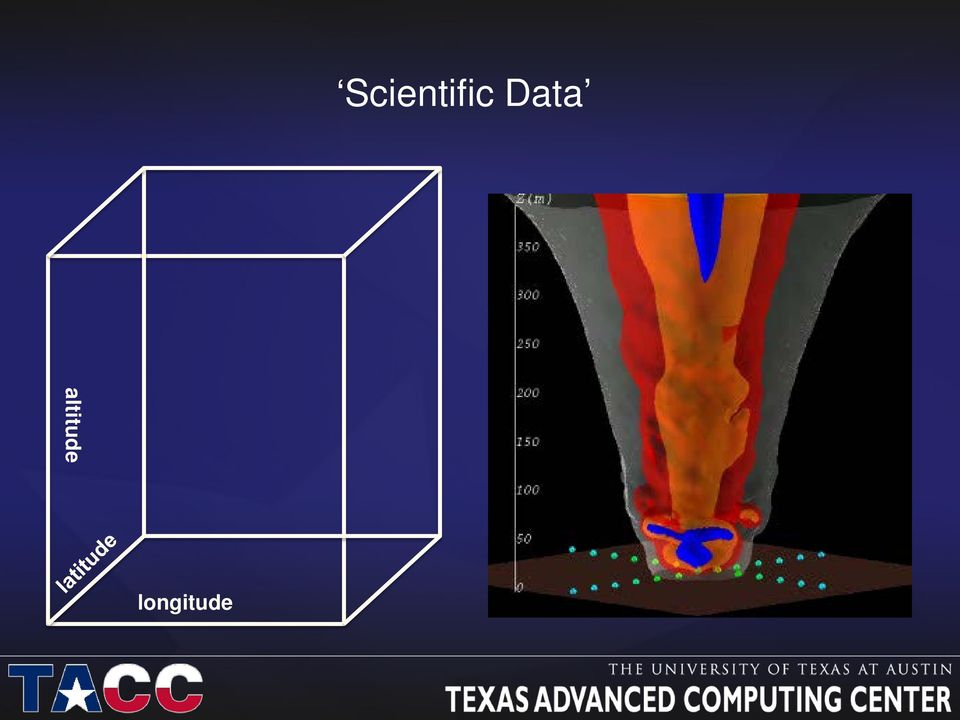
17 I Think Of Two Kinds Of Data For Visualization Data for Scientific Visualization F(spatial dimensions[, time]) -> attributes E.g. Weather data: F(latitude, longitude, altitude) -> temperature, wind velocity, direction humidity Data for Information Visualization List of facts, which have multiple attributes E.g. A list of movies: Title, year, director, length, gate, male/female leads..

18 Scientific Data altitude longitude
19 Info Data Gene Expression Data

20 Any Number of Packages Do Viz R (GenomeGraphs) Python (matplotlib)

21 Probably The Most Common Viz Tool
22 Geosciences
23 SciVis Data Data mapped onto a computational domain Heat distribution in a block of material F(x,y,z) -> temperature for (x,y,z) a point in the block of material Multiple variables (or properties) Weather F(x,y,z) -> pressure, temperature, wind-velocity for (x,y,z) a point in the atmosphere
24 SciVis Data Dimensionality Domain is generally 1, 2, 3 or more dimensions Directly interpreted geometrically (see heat distribution) Indirectly interpreted geometrically F(lat, lon) -> temperature X = (earth radius)*cos(lat)*cos(lon) Y = (earth radius)*cos(lat)*sin(lon) Z = (earth radius)*sin(lat)
25 SciVis Data and Time Time may vary also Heat transfer in a block of material F(x,y,z,t) -> temperature for (x,y,z) a point in the block of material and t a point in time
26 Higher Dimensional SciVis Content(l state(t) = = 00,(l, l 01 l, 1, l 12 l, 2, l 23 l, 3, l 34 l, 4, l 45 l, 5, l 56 l, 6 )) l 6 = ) - A 7D l 0 space + l 1 + lcurve 2 + l 3 + representing l 4 + l 5 + l 6 - the A 7D amount function of representing oil stored at a the given total point amount in time of oil stored at the point (l 0, l 1, l 2, l 3, l 4, l 5, l 6 ) - A contour surface at C represents all the ways C barrels of oil can be contained in 7 tanks An Oil Tank Farm
27 SciVis Data: Discrete vs. Continuous Data Discrete data is known at a finite set of points in the domain F(x,y,z) -> temperature for (x,y,z) from a finite set of points in the domain, unknown otherwise Continuous data is known throughout the domain F(x,y,z) -> temperature for all points (x,y,z) in domain
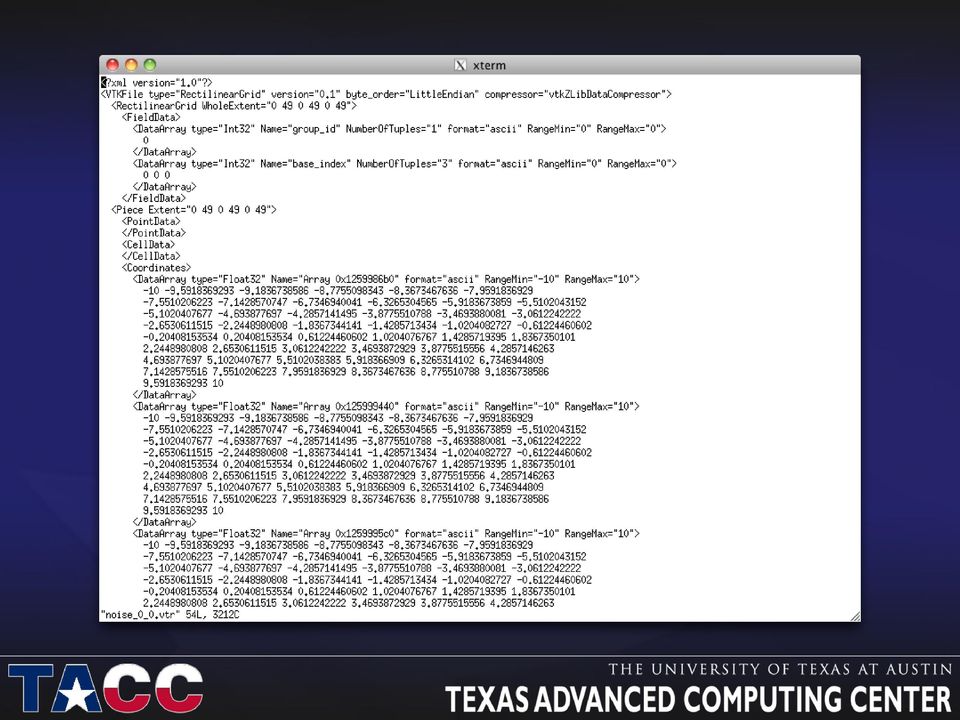
28 The Grid Points in the domain can be regular - specified by origin, delta vectors and counts, or explicitly listed For interpolated grids: Topology: how the points connected (implicit or explicitly listed) Interpolation Model: How data values at an arbitrary point are derived from nearby points
29 Types of data at a point/cell Scalar Vector Tensor/matrix Labels, identifiers Other tuples
30 Example
31 Example Points
32 Example Connectivity
33 Example Data Visualized
34 Example Varying in Time
35 Types of Input Data Point scattered values with no defined structure
36 Types of Input Data Grid regular structure, all voxels (cells) are the same size and shape
37 Types of Input Data Curvilinear regularly grided mesh shaping function applied
38 Types of Input Data Unstructured grid irregular mesh typically composed of tetrahedra, prisms, pyramids, or hexahedra.
39 Types of Input Data Non-mesh connected point data (molecular)
40 Visualization Operations Surface Shading (Pseudocolor) Isosufacing (Contours) Volume Rendering Clipping Planes Streamlines
41 Surface Shading (Pseudocolor) Given a scalar value at a point on the surface and a color map, find the corresponding color (and opacity) and apply it to the surface point. Most common operation, often combined with other ops
42 Isosurfaces (Contours) Surface that represents points of constant value with a volume Plot the surface for a given scalar value. Good for showing known values of interest Good for sampling through a data range
43 Clipping / Slicing Planes Extract a plane from the data to show features Hide part of dataset to expose features
44 Particle Traces (Streamlines) Given a vector field, extract a trace that follows that trajectory defined by the vector. P new = P current + V P t Streamlines trace in space Pathlines trace in time
45 Visualization Techniques Surface Rendering is an indirect geometry based technique Direct Volume Rendering is a technique for the visualization of 3D scalar data sets without a conversion to surface representations
46 Volume Rendering Expresses how light travels through a volume Color and opacity controlled by transfer function Smoother transitions than isosurfaces
47 Example Volume Rendered
48 Visualization Resources Personal machines Most accessible, least powerful Projection systems Seamless image, high purchase and maintenance costs Tiled-LCD displays Lowest per-pixel costs, bezels divide image Remote visualization Access to high-performance system, latency can affect user experience
49 TACC Support for Remote, Interactive Visualization Maverick Longhorn I don t have a picture Wrangler 2014(?) I don t have a picture Maverick 2014 Spur Stampede 2013 Lonestar 2011 Scientific Visualization Visual Analytics
50 XSEDE Visualization Resources Maverick (TACC) - HP core Ivy Bridge nodes 256GB system memory per node Nvidia Tesla K40 GPU FDR InfiniBand interconnect Designed for interactive visualization Stampede (TACC) - DELL core Sandy Bridge nodes 256 GB system memory per node 1TB) FDR Infiniband All with 62-core Xeon Phi 128 with NVIDIA K20 GPUs 205 TB Aggregate Memory
51 XSEDE Visualization Resources Maverick (TACC) - HP core Ivy Bridge nodes 256GB system memory per node Nvidia Tesla K40 GPU FDR InfiniBand interconnect Designed for interactive visualization Stampede (TACC) - DELL core Sandy Bridge nodes 256 GB system memory per node 1TB) FDR Infiniband All with 62-core Xeon Phi 128 with NVIDIA K20 GPUs 205 TB Aggregate Memory
52 Visualization Challenges
53 Visualization Allows Us to See the Science Raw Data Geometric Primitives Pixels Realization as Visual Entities Render
54 But what about large, distributed data? Gather the data? Realization as Visual Entities Render Gather
55 But what about large, distributed data? Gather Render Realization as Visual Entities Gather the geometry?
56 But what about large, distributed data? Depth-composite pixels Realization as Visual Entities Render Render full sized frames in place and depth-composite?
57 Or large, distributed displays?
58 Visualization Scaling Challenges Moving data to the visualization machine Most applications built for shared memory machines, not distributed clusters Image resolution limits in some software cannot capture feature details Displays cannot show entire highresolution images at their native resolution
59 Moving Data How long can you wait? File Size 10 Gbps 54 Mbps 1 GB 1 sec 2.5 min 1 TB ~17 min ~43 hours 1 PB ~12 days ~5 years
60 Old Model (No Remote Capability) HPC System Local Visualization Resource Data Archive Display Pixels Mouse Remote Site Wide-Area Network Local Site
61 New Model Remote Capability HPC System Large-Scale Visualization Resource Pixels Mouse Display Data Archive Remote Site Wide-Area Network Local Site
62 Analyzing Data Visualization programs only beginning to efficiently handle ultrascale data 650 GB dataset -> 3 TB memory footprint Allocate HPC nodes for RAM not cores N-1 idle processors per node! Stability across many distributed nodes Rendering clusters typically number N <= 64 Data must be dividable onto N cores Remember this when resampling!
63 Displaying Data Dell 30 flat-panel LCD 4 Megapixel display 2560 x 1600 resolution
64 Displaying Data Stallion world s 2 nd highest-resolution tiled display 328 Megapixels x 8000 pixel resolution Dell 30 LCD
65 What s the solution?
66 Summary Challenges at every stage of visualization when operating on large data Partial solutions exist, though not integrated Problem sizes continue to grow at every stage Vis software community must keep pace with hardware innovations
Introduction to Scientific Data Visualization
 Introduction to Scientific Data Visualization Greg Abram Texas Advanced Computing Center The University of Texas at Austin Belaboring The Point A picture can represent giga-, tera- and peta- bytes of data
Parallel Large-Scale Visualization
 Parallel Large-Scale Visualization Aaron Birkland Cornell Center for Advanced Computing Data Analysis on Ranger January 2012 Parallel Visualization Why? Performance Processing may be too slow on one CPU
Remote & Collaborative Visualization. Texas Advanced Compu1ng Center
 Remote & Collaborative Visualization Texas Advanced Compu1ng Center So6ware Requirements SSH client VNC client Recommended: TigerVNC http://sourceforge.net/projects/tigervnc/files/ Web browser with Java
Data Mining with Hadoop at TACC
 Data Mining with Hadoop at TACC Weijia Xu Data Mining & Statistics Data Mining & Statistics Group Main activities Research and Development Developing new data mining and analysis solutions for practical
Visualization with ParaView. Greg Johnson
 Visualization with Greg Johnson Before we begin Make sure you have 3.8.0 installed so you can follow along in the lab section http://paraview.org/paraview/resources/software.html http://www.paraview.org/
Large-Data Software Defined Visualization on CPUs
 Large-Data Software Defined Visualization on CPUs Greg P. Johnson, Bruce Cherniak 2015 Rice Oil & Gas HPC Workshop Trend: Increasing Data Size Measuring / modeling increasingly complex phenomena Rendering
Visualisatie BMT. Introduction, visualization, visualization pipeline. Arjan Kok Huub van de Wetering ([email protected])
") Visualisatie BMT Introduction, visualization, visualization pipeline Arjan Kok Huub van de Wetering ([email protected]) 1 Lecture overview Goal Summary Study material What is visualization Examples
Visualisatie BMT Introduction, visualization, visualization pipeline Arjan Kok Huub van de Wetering ([email protected]) 1 Lecture overview Goal Summary Study material What is visualization Examples
Why are we teaching you VisIt?
 VisIt Tutorial Why are we teaching you VisIt? Interactive (GUI) Visualization and Analysis tool Multiplatform, Free and Open Source The interface looks the same whether you run locally or remotely, serial
Visualization with ParaView
 Visualization with ParaView Before we begin Make sure you have ParaView 4.1.0 installed so you can follow along in the lab section http://paraview.org/paraview/resources/software.php Background http://www.paraview.org/
Interactive Data Visualization with Focus on Climate Research
 Interactive Data Visualization with Focus on Climate Research Michael Böttinger German Climate Computing Center (DKRZ) 1 Agenda Visualization in HPC Environments Climate System, Climate Models and Climate
Parallel Analysis and Visualization on Cray Compute Node Linux
 Parallel Analysis and Visualization on Cray Compute Node Linux David Pugmire, Oak Ridge National Laboratory and Hank Childs, Lawrence Livermore National Laboratory and Sean Ahern, Oak Ridge National Laboratory
Visualization of Adaptive Mesh Refinement Data with VisIt
 Visualization of Adaptive Mesh Refinement Data with VisIt Gunther H. Weber Lawrence Berkeley National Laboratory VisIt Richly featured visualization and analysis tool for large data sets Built for five
VisIt Visualization Tool
 The Center for Astrophysical Thermonuclear Flashes VisIt Visualization Tool Randy Hudson [email protected] Argonne National Laboratory Flash Center, University of Chicago An Advanced Simulation and Computing
Interactive simulation of an ash cloud of the volcano Grímsvötn
 Interactive simulation of an ash cloud of the volcano Grímsvötn 1 MATHEMATICAL BACKGROUND Simulating flows in the atmosphere, being part of CFD, is on of the research areas considered in the working group
High Performance Computing in CST STUDIO SUITE
 High Performance Computing in CST STUDIO SUITE Felix Wolfheimer GPU Computing Performance Speedup 18 16 14 12 10 8 6 4 2 0 Promo offer for EUC participants: 25% discount for K40 cards Speedup of Solver
The Visualization Pipeline
 The Visualization Pipeline Conceptual perspective Implementation considerations Algorithms used in the visualization Structure of the visualization applications Contents The focus is on presenting the
Introduction to Visualization with VTK and ParaView
 Introduction to Visualization with VTK and ParaView R. Sungkorn and J. Derksen Department of Chemical and Materials Engineering University of Alberta Canada August 24, 2011 / LBM Workshop 1 Introduction
How is EnSight Uniquely Suited to FLOW-3D Data?
 How is EnSight Uniquely Suited to FLOW-3D Data? July 5, 2011 figure 1. FLOW-3D model of Dam visualized with EnSight If you would like to know how CEI s EnSight offers you more power than other postprocessors
Data Visualization. Principles and Practice. Second Edition. Alexandru Telea
 Data Visualization Principles and Practice Second Edition Alexandru Telea First edition published in 2007 by A K Peters, Ltd. Cover image: The cover shows the combination of scientific visualization and
NVIDIA IndeX. Whitepaper. Document version 1.0 3 June 2013
 NVIDIA IndeX Whitepaper Document version 1.0 3 June 2013 NVIDIA Advanced Rendering Center Fasanenstraße 81 10623 Berlin phone +49.30.315.99.70 fax +49.30.315.99.733 [email protected] Copyright Information
Facts about Visualization Pipelines, applicable to VisIt and ParaView
 Facts about Visualization Pipelines, applicable to VisIt and ParaView March 2013 Jean M. Favre, CSCS Agenda Visualization pipelines Motivation by examples VTK Data Streaming Visualization Pipelines: Introduction
GPU Renderfarm with Integrated Asset Management & Production System (AMPS)
") GPU Renderfarm with Integrated Asset Management & Production System (AMPS) Tackling two main challenges in CG movie production Presenter: Dr. Chen Quan Multi-plAtform Game Innovation Centre (MAGIC), Nanyang
GPU Renderfarm with Integrated Asset Management & Production System (AMPS) Tackling two main challenges in CG movie production Presenter: Dr. Chen Quan Multi-plAtform Game Innovation Centre (MAGIC), Nanyang
Simulation Platform Overview
 Simulation Platform Overview Build, compute, and analyze simulations on demand www.rescale.com CASE STUDIES Companies in the aerospace and automotive industries use Rescale to run faster simulations Aerospace
NVIDIA IndeX Enabling Interactive and Scalable Visualization for Large Data Marc Nienhaus, NVIDIA IndeX Engineering Manager and Chief Architect
 SIGGRAPH 2013 Shaping the Future of Visual Computing NVIDIA IndeX Enabling Interactive and Scalable Visualization for Large Data Marc Nienhaus, NVIDIA IndeX Engineering Manager and Chief Architect NVIDIA
Scientific Visualization with ParaView
 Scientific Visualization with ParaView Geilo Winter School 2016 Andrea Brambilla (GEXCON AS, Bergen) Outline Part 1 (Monday) Fundamentals Data Filtering Part 2 (Tuesday) Time Dependent Data Selection &
VisIt: A Tool for Visualizing and Analyzing Very Large Data. Hank Childs, Lawrence Berkeley National Laboratory December 13, 2010
 VisIt: A Tool for Visualizing and Analyzing Very Large Data Hank Childs, Lawrence Berkeley National Laboratory December 13, 2010 VisIt is an open source, richly featured, turn-key application for large
Big Data and Analytics: Getting Started with ArcGIS. Mike Park Erik Hoel
 Big Data and Analytics: Getting Started with ArcGIS Mike Park Erik Hoel Agenda Overview of big data Distributed computation User experience Data management Big data What is it? Big Data is a loosely defined
Computer Applications in Textile Engineering. Computer Applications in Textile Engineering
 3. Computer Graphics Sungmin Kim http://latam.jnu.ac.kr Computer Graphics Definition Introduction Research field related to the activities that includes graphics as input and output Importance Interactive
CHAPTER FIVE RESULT ANALYSIS
 CHAPTER FIVE RESULT ANALYSIS 5.1 Chapter Introduction 5.2 Discussion of Results 5.3 Performance Comparisons 5.4 Chapter Summary 61 5.1 Chapter Introduction This chapter outlines the results obtained from
Performance Characteristics of Large SMP Machines
 Performance Characteristics of Large SMP Machines Dirk Schmidl, Dieter an Mey, Matthias S. Müller [email protected] Rechen- und Kommunikationszentrum (RZ) Agenda Investigated Hardware Kernel Benchmark
COSC 6344 Visualization
 COSC 64 Visualization University of Houston, Fall 2015 Instructor: Guoning Chen [email protected] Course Information Location: AH 2 Time: 10am~11:am Tu/Th Office Hours: 11:am~12:pm Tu /Th or by appointment
Data Centric Interactive Visualization of Very Large Data
 Data Centric Interactive Visualization of Very Large Data Bruce D Amora, Senior Technical Staff Gordon Fossum, Advisory Engineer IBM T.J. Watson Research/Data Centric Systems #OpenPOWERSummit Data Centric
Data Visualization for Atomistic/Molecular Simulations. Douglas E. Spearot University of Arkansas
 Data Visualization for Atomistic/Molecular Simulations Douglas E. Spearot University of Arkansas What is Atomistic Simulation? Molecular dynamics (MD) involves the explicit simulation of atomic scale particles
Hue Streams. Seismic Compression Technology. Years of my life were wasted waiting for data loading and copying
 Hue Streams Seismic Compression Technology Hue Streams real-time seismic compression results in a massive reduction in storage utilization and significant time savings for all seismic-consuming workflows.
Jean-Pierre Panziera Teratec 2011
 Technologies for the future HPC systems Jean-Pierre Panziera Teratec 2011 3 petaflop systems : TERA 100, CURIE & IFERC Tera100 Curie IFERC 1.25 PetaFlops 256 TB ory 30 PB disk storage 140 000+ Xeon cores
MEng, BSc Applied Computer Science
 School of Computing FACULTY OF ENGINEERING MEng, BSc Applied Computer Science Year 1 COMP1212 Computer Processor Effective programming depends on understanding not only how to give a machine instructions
An Integrated Simulation and Visualization Framework for Tracking Cyclone Aila
 An Integrated Simulation and Visualization Framework for Tracking Cyclone Aila Preeti Malakar 1, Vijay Natarajan, Sathish S. Vadhiyar, Ravi S. Nanjundiah Department of Computer Science and Automation Supercomputer
Scalable and High Performance Computing for Big Data Analytics in Understanding the Human Dynamics in the Mobile Age
 Scalable and High Performance Computing for Big Data Analytics in Understanding the Human Dynamics in the Mobile Age Xuan Shi GRA: Bowei Xue University of Arkansas Spatiotemporal Modeling of Human Dynamics
HETEROGENEOUS HPC, ARCHITECTURE OPTIMIZATION, AND NVLINK
 HETEROGENEOUS HPC, ARCHITECTURE OPTIMIZATION, AND NVLINK Steve Oberlin CTO, Accelerated Computing US to Build Two Flagship Supercomputers SUMMIT SIERRA Partnership for Science 100-300 PFLOPS Peak Performance
How To Visualize At The Dlr
 Interactive Visualization of Large Simulation Datasets Andreas Gerndt, Rolf Hempel, Robin Wolff DLR Simulation and Software Technology EuroMPI 2010 Conference, Stuttgart, Sept. 13-15, 2010 Folie 1 Introduction
GPU Computing with CUDA Lecture 2 - CUDA Memories. Christopher Cooper Boston University August, 2011 UTFSM, Valparaíso, Chile
 GPU Computing with CUDA Lecture 2 - CUDA Memories Christopher Cooper Boston University August, 2011 UTFSM, Valparaíso, Chile 1 Outline of lecture Recap of Lecture 1 Warp scheduling CUDA Memory hierarchy
Volume visualization I Elvins
 Volume visualization I Elvins 1 surface fitting algorithms marching cubes dividing cubes direct volume rendering algorithms ray casting, integration methods voxel projection, projected tetrahedra, splatting
Visualization Plugin for ParaView
 Alexey I. Baranov Visualization Plugin for ParaView version 1.3 Springer Contents 1 Visualization with ParaView..................................... 1 1.1 ParaView plugin installation.................................
Overview Motivation and applications Challenges. Dynamic Volume Computation and Visualization on the GPU. GPU feature requests Conclusions
 Module 4: Beyond Static Scalar Fields Dynamic Volume Computation and Visualization on the GPU Visualization and Computer Graphics Group University of California, Davis Overview Motivation and applications
COMP/CS 605: Intro to Parallel Computing Lecture 01: Parallel Computing Overview (Part 1)
") COMP/CS 605: Intro to Parallel Computing Lecture 01: Parallel Computing Overview (Part 1) Mary Thomas Department of Computer Science Computational Science Research Center (CSRC) San Diego State University
COMP/CS 605: Intro to Parallel Computing Lecture 01: Parallel Computing Overview (Part 1) Mary Thomas Department of Computer Science Computational Science Research Center (CSRC) San Diego State University
The Ultra-scale Visualization Climate Data Analysis Tools (UV-CDAT): A Vision for Large-Scale Climate Data
: A Vision for Large-Scale Climate Data") The Ultra-scale Visualization Climate Data Analysis Tools (UV-CDAT): A Vision for Large-Scale Climate Data Lawrence Livermore National Laboratory? Hank Childs (LBNL) and Charles Doutriaux (LLNL) September
The Ultra-scale Visualization Climate Data Analysis Tools (UV-CDAT): A Vision for Large-Scale Climate Data Lawrence Livermore National Laboratory? Hank Childs (LBNL) and Charles Doutriaux (LLNL) September
Comp 410/510. Computer Graphics Spring 2016. Introduction to Graphics Systems
 Comp 410/510 Computer Graphics Spring 2016 Introduction to Graphics Systems Computer Graphics Computer graphics deals with all aspects of creating images with a computer Hardware (PC with graphics card)
MEng, BSc Computer Science with Artificial Intelligence
 School of Computing FACULTY OF ENGINEERING MEng, BSc Computer Science with Artificial Intelligence Year 1 COMP1212 Computer Processor Effective programming depends on understanding not only how to give
VisCMD: Visualizing Cloud Modeling Data
 CPSC-533C Information Visualization Project Report VisCMD: Visualizing Cloud Modeling Data Quanzhen Geng (#63546014) and Jing Li (#90814013) Email: [email protected] [email protected] (Master of Software
Interactive Level-Set Deformation On the GPU
 Interactive Level-Set Deformation On the GPU Institute for Data Analysis and Visualization University of California, Davis Problem Statement Goal Interactive system for deformable surface manipulation
A Short Introduction to Computer Graphics
 A Short Introduction to Computer Graphics Frédo Durand MIT Laboratory for Computer Science 1 Introduction Chapter I: Basics Although computer graphics is a vast field that encompasses almost any graphical
Visualization Process. Alark Joshi
 Visualization Process Alark Joshi Task-specific Visualization Design LA Treinish, Task-specific visualization design, IEEE Computer Graphics and Applications, 1999 Generalized visualization systems are
Parallel Computing with MATLAB
 Parallel Computing with MATLAB Scott Benway Senior Account Manager Jiro Doke, Ph.D. Senior Application Engineer 2013 The MathWorks, Inc. 1 Acceleration Strategies Applied in MATLAB Approach Options Best
Petascale Visualization: Approaches and Initial Results
 Petascale Visualization: Approaches and Initial Results James Ahrens Li-Ta Lo, Boonthanome Nouanesengsy, John Patchett, Allen McPherson Los Alamos National Laboratory LA-UR- 08-07337 Operated by Los Alamos
Curves and Surfaces. Goals. How do we draw surfaces? How do we specify a surface? How do we approximate a surface?
 Curves and Surfaces Parametric Representations Cubic Polynomial Forms Hermite Curves Bezier Curves and Surfaces [Angel 10.1-10.6] Goals How do we draw surfaces? Approximate with polygons Draw polygons
What is Visualization? Information Visualization An Overview. Information Visualization. Definitions
 What is Visualization? Information Visualization An Overview Jonathan I. Maletic, Ph.D. Computer Science Kent State University Visualize/Visualization: To form a mental image or vision of [some
PARALLEL & CLUSTER COMPUTING CS 6260 PROFESSOR: ELISE DE DONCKER BY: LINA HUSSEIN
 1 PARALLEL & CLUSTER COMPUTING CS 6260 PROFESSOR: ELISE DE DONCKER BY: LINA HUSSEIN Introduction What is cluster computing? Classification of Cluster Computing Technologies: Beowulf cluster Construction
Writing Applications for the GPU Using the RapidMind Development Platform
 Writing Applications for the GPU Using the RapidMind Development Platform Contents Introduction... 1 Graphics Processing Units... 1 RapidMind Development Platform... 2 Writing RapidMind Enabled Applications...
Data Centric Systems (DCS)
") Data Centric Systems (DCS) Architecture and Solutions for High Performance Computing, Big Data and High Performance Analytics High Performance Computing with Data Centric Systems 1 Data Centric Systems
Data Centric Systems (DCS) Architecture and Solutions for High Performance Computing, Big Data and High Performance Analytics High Performance Computing with Data Centric Systems 1 Data Centric Systems
Estonian Scientific Computing Infrastructure (ETAIS)
") Estonian Scientific Computing Infrastructure (ETAIS) Week #7 Hardi Teder [email protected] University of Tartu March 27th 2013 Overview Estonian Scientific Computing Infrastructure Estonian Research infrastructures
Estonian Scientific Computing Infrastructure (ETAIS) Week #7 Hardi Teder [email protected] University of Tartu March 27th 2013 Overview Estonian Scientific Computing Infrastructure Estonian Research infrastructures
Visualization Infrastructure and Services at the MPCDF
 Visualization Infrastructure and Services at the MPCDF Markus Rampp & Klaus Reuter Max Planck Computing and Data Facility (MPCDF) ([email protected]) Interdisciplinary Cluster Workshop on Visualization
Mixed Precision Iterative Refinement Methods Energy Efficiency on Hybrid Hardware Platforms
 Mixed Precision Iterative Refinement Methods Energy Efficiency on Hybrid Hardware Platforms Björn Rocker Hamburg, June 17th 2010 Engineering Mathematics and Computing Lab (EMCL) KIT University of the State
Interactive Level-Set Segmentation on the GPU
 Interactive Level-Set Segmentation on the GPU Problem Statement Goal Interactive system for deformable surface manipulation Level-sets Challenges Deformation is slow Deformation is hard to control Solution
The Scientific Data Mining Process
 Chapter 4 The Scientific Data Mining Process When I use a word, Humpty Dumpty said, in rather a scornful tone, it means just what I choose it to mean neither more nor less. Lewis Carroll [87, p. 214] In
Interactive Visualization of Magnetic Fields
 JOURNAL OF APPLIED COMPUTER SCIENCE Vol. 21 No. 1 (2013), pp. 107-117 Interactive Visualization of Magnetic Fields Piotr Napieralski 1, Krzysztof Guzek 1 1 Institute of Information Technology, Lodz University
Lecture Notes, CEng 477
 Computer Graphics Hardware and Software Lecture Notes, CEng 477 What is Computer Graphics? Different things in different contexts: pictures, scenes that are generated by a computer. tools used to make
Study of Large-Scale Data Visualization
 Study of Large-Scale Data Visualization Project Representative Fumiaki Araki The Earth Simulator Center, Japan Agency for Marine-Earth Science and Technology Authors Fumiaki Araki 1, Shintaro Kawahara
How To Use Hadoop For Gis
 2013 Esri International User Conference July 8 12, 2013 San Diego, California Technical Workshop Big Data: Using ArcGIS with Apache Hadoop David Kaiser Erik Hoel Offering 1330 Esri UC2013. Technical Workshop.
Technical Report. An Interactive Iso-Surface Based 3D Weather Radar Data Visualization Package Using VisAD for WDSSII
 Technical Report An Interactive Iso-Surface Based 3D Weather Radar Data Visualization Package Using VisAD for WDSSII (Jianting Zhang, Last Modified 2/5/2004) Abstract... 2 1 Introduction... 3 2 Overviews
Dell High-Performance Computing Clusters and Reservoir Simulation Research at UT Austin. http://www.dell.com/clustering
 Dell High-Performance Computing Clusters and Reservoir Simulation Research at UT Austin Reza Rooholamini, Ph.D. Director Enterprise Solutions Dell Computer Corp. [email protected] http://www.dell.com/clustering
Outline. High Performance Computing (HPC) Big Data meets HPC. Case Studies: Some facts about Big Data Technologies HPC and Big Data converging
 Big Data meets HPC. Case Studies: Some facts about Big Data Technologies HPC and Big Data converging") Outline High Performance Computing (HPC) Towards exascale computing: a brief history Challenges in the exascale era Big Data meets HPC Some facts about Big Data Technologies HPC and Big Data converging
Outline High Performance Computing (HPC) Towards exascale computing: a brief history Challenges in the exascale era Big Data meets HPC Some facts about Big Data Technologies HPC and Big Data converging
AN EFFECT OF GRID QUALITY ON THE RESULTS OF NUMERICAL SIMULATIONS OF THE FLUID FLOW FIELD IN AN AGITATED VESSEL
 14 th European Conference on Mixing Warszawa, 10-13 September 2012 AN EFFECT OF GRID QUALITY ON THE RESULTS OF NUMERICAL SIMULATIONS OF THE FLUID FLOW FIELD IN AN AGITATED VESSEL Joanna Karcz, Lukasz Kacperski
1. INTRODUCTION Graphics 2
 1. INTRODUCTION Graphics 2 06-02408 Level 3 10 credits in Semester 2 Professor Aleš Leonardis Slides by Professor Ela Claridge What is computer graphics? The art of 3D graphics is the art of fooling the
Data-intensive HPC: opportunities and challenges. Patrick Valduriez
 Data-intensive HPC: opportunities and challenges Patrick Valduriez Big Data Landscape Multi-$billion market! Big data = Hadoop = MapReduce? No one-size-fits-all solution: SQL, NoSQL, MapReduce, No standard,
Introduction to Paraview. H.D.Rajesh
 Introduction to Paraview H.D.Rajesh 1.Introduction 2.file formats 3.How to use Brief Overview Info: www.paraview.org http://www.paraview.org/wiki/paraview Open source,multi-platform application (Linux,
Efficient Storage, Compression and Transmission
 Efficient Storage, Compression and Transmission of Complex 3D Models context & problem definition general framework & classification our new algorithm applications for digital documents Mesh Decimation
Outline. Fundamentals. Rendering (of 3D data) Data mappings. Evaluation Interaction
 Data mappings. Evaluation Interaction") Outline Fundamentals What is vis? Some history Design principles The visualization process Data sources and data structures Basic visual mapping approaches Rendering (of 3D data) Scalar fields (isosurfaces
Outline Fundamentals What is vis? Some history Design principles The visualization process Data sources and data structures Basic visual mapping approaches Rendering (of 3D data) Scalar fields (isosurfaces
Calculation of Eigenfields for the European XFEL Cavities
 Calculation of Eigenfields for the European XFEL Cavities Wolfgang Ackermann, Erion Gjonaj, Wolfgang F. O. Müller, Thomas Weiland Institut Theorie Elektromagnetischer Felder, TU Darmstadt Status Meeting
High-Performance Computing and Big Data Challenge
 High-Performance Computing and Big Data Challenge Dr Violeta Holmes Matthew Newall The University of Huddersfield Outline High-Performance Computing E-Infrastructure Top500 -Tianhe-II UoH experience: HPC
Visualization methods for patent data
 Visualization methods for patent data Treparel 2013 Dr. Anton Heijs (CTO & Founder) Delft, The Netherlands Introduction Treparel can provide advanced visualizations for patent data. This document describes
Using Photorealistic RenderMan for High-Quality Direct Volume Rendering
 Using Photorealistic RenderMan for High-Quality Direct Volume Rendering Cyrus Jam [email protected] Mike Bailey [email protected] San Diego Supercomputer Center University of California San Diego Abstract With
FRIEDRICH-ALEXANDER-UNIVERSITÄT ERLANGEN-NÜRNBERG
 FRIEDRICH-ALEXANDER-UNIVERSITÄT ERLANGEN-NÜRNBERG INSTITUT FÜR INFORMATIK (MATHEMATISCHE MASCHINEN UND DATENVERARBEITUNG) Lehrstuhl für Informatik 10 (Systemsimulation) Massively Parallel Multilevel Finite
HPC technology and future architecture
 HPC technology and future architecture Visual Analysis for Extremely Large-Scale Scientific Computing KGT2 Internal Meeting INRIA France Benoit Lange [email protected] Toàn Nguyên [email protected]
Introduction to Computer Graphics
 Introduction to Computer Graphics Torsten Möller TASC 8021 778-782-2215 [email protected] www.cs.sfu.ca/~torsten Today What is computer graphics? Contents of this course Syllabus Overview of course topics
Improving Data Mining of Multi-dimension Objects Using a Hybrid Database and Visualization System
 Improving Data Mining of Multi-dimension Objects Using a Hybrid Database and Visualization System Yan Xia, Anthony Tung Shuen Ho School of Electrical and Electronic Engineering Nanyang Technological University,
IBM Deep Computing Visualization Offering
 P - 271 IBM Deep Computing Visualization Offering Parijat Sharma, Infrastructure Solution Architect, IBM India Pvt Ltd. email: [email protected] Summary Deep Computing Visualization in Oil & Gas
Stream Processing on GPUs Using Distributed Multimedia Middleware
 Stream Processing on GPUs Using Distributed Multimedia Middleware Michael Repplinger 1,2, and Philipp Slusallek 1,2 1 Computer Graphics Lab, Saarland University, Saarbrücken, Germany 2 German Research
Visualization. For Novices. ( Ted Hall ) University of Michigan 3D Lab Digital Media Commons, Library http://um3d.dc.umich.edu
 University of Michigan 3D Lab Digital Media Commons, Library http://um3d.dc.umich.edu") Visualization For Novices ( Ted Hall ) University of Michigan 3D Lab Digital Media Commons, Library http://um3d.dc.umich.edu Data Visualization Data visualization deals with communicating information about
Visualization For Novices ( Ted Hall ) University of Michigan 3D Lab Digital Media Commons, Library http://um3d.dc.umich.edu Data Visualization Data visualization deals with communicating information about
The STC for Event Analysis: Scalability Issues
 The STC for Event Analysis: Scalability Issues Georg Fuchs Gennady Andrienko http://geoanalytics.net Events Something [significant] happened somewhere, sometime Analysis goal and domain dependent, e.g.
Visualizing Uncertainty: Computer Science Perspective
 Visualizing Uncertainty: Computer Science Perspective Ben Shneiderman, Univ of Maryland, College Park Alex Pang, Univ of California, Santa Cruz National Academy of Sciences Workshop, Washington, DC What
Advanced discretisation techniques (a collection of first and second order schemes); Innovative algorithms and robust solvers for fast convergence.
; Innovative algorithms and robust solvers for fast convergence.") New generation CFD Software APUS-CFD APUS-CFD is a fully interactive Arbitrary Polyhedral Unstructured Solver. APUS-CFD is a new generation of CFD software for modelling fluid flow and heat transfer in
New generation CFD Software APUS-CFD APUS-CFD is a fully interactive Arbitrary Polyhedral Unstructured Solver. APUS-CFD is a new generation of CFD software for modelling fluid flow and heat transfer in
Course Overview. CSCI 480 Computer Graphics Lecture 1. Administrative Issues Modeling Animation Rendering OpenGL Programming [Angel Ch.
 CSCI 480 Computer Graphics Lecture 1 Course Overview January 14, 2013 Jernej Barbic University of Southern California http://www-bcf.usc.edu/~jbarbic/cs480-s13/ Administrative Issues Modeling Animation