The Basics of 12 Lead EKG s
|
|
|
- Jayson Chapman
- 8 years ago
- Views:
Transcription
1 EMS Solutions Presents The Basics of 12 Lead EKG s

2 NOTICE: You DO NOT Have the Right to Reprint or Resell this Publication. However, you MAY give this report away, provided you do not change or alter the contents. Copyright EMS Solutions ALL RIGHTS RESERVED. No part of this publication may be reproduced or transmitted in any form whatsoever, electronic, or mechanical, including photocopying, recording, or by any informational storage or retrieval system without the expressed written, dated and signed permission from the author. DISCLAIMER AND/OR LEGAL NOTICES: The information presented herein represents the views of the author as of the date of publication. Because of the rate with which conditions change, the author reserves the right to alter and update this information based on the new conditions. The publication is for informational purposes only. While every attempt has been made to verify the information provided in this publication, neither the author nor its affiliates/partners assume any responsibility for errors, inaccuracies or omissions. Any slights of people or organizations are unintentional. If advice concerning medical, legal or related matters is needed, the services of a fully qualified professional should be sought. You should be aware of any laws/practices or local policies which govern emergency care or other pre hospital care practices in your country and state. Any reference to any person or business whether living or dead is purely coincidental.

3 12-LEAD ECG INTERPRETATION INTRODUCTION The objective of this report is to provide Paramedics with basic knowledge prior to the introduction of acquiring 12-lead ECGs as part of their scope of practice. Acquisition of 12-lead ECGs will become an additional tool, along with current assessment skills, for identifying patients suffering from an acute myocardial infarction. The importance of obtaining a 12-lead ECG is for early identification of potential myocardial ischemia so that the cause can be appropriately treated and, hopefully, reversed. Don t be alarmed if you have difficulty with rhythm interpretation or reading a Lead II strip. When reading a 12-lead ECG, you are looking for different information that is not seen in the basic Lead II strip. These differences will become obvious to you as you work through this package. Why 12-Leads? I Have Enough Problems with Lead II! This question is constantly being asked by paramedics that see the tracings of a 12- lead ECG as something too imposing for them to even consider being useful in prehospital care. This is primarily due to the fact that we normally look at a tracing generated by our monitors (Lead II) and we are expected to be able to quickly come up with one of the fancy names for the bizarre, electrically generated line. Doctors frequently argue over what the Lead II tracing reveals and this is why it is referred to as rhythm interpretation. One individual or doctor s interpretation can be different from another and that is frequently acceptable as long as the rules of rhythm interpretation were used. A 12-lead ECG is much more specific as it is a diagnostic tool looking at the electrical activity of various sections of the heart simultaneously. It can allow the person reading the 12-lead ECG to identify early signs of ischemia, injury and infarction of very valuable heart muscle. By obtaining a 12-lead ECG early in our prehospital assessment, we are also able to provide a premedicated picture of the electrical activity of the heart. How important is this? We have all heard the story of a patient that a crew picked up, assessed as having ischemic chest pain, treated with oxygen, nitroglycerin and ASA, and arrived at the hospital with the patient being pain free. The patient was assessed, including having a 12-lead ECG done, and was discharged prior to completion of the ACR. The ambulance crew working the next shift found the patient VSA. This is a scenario that can happen to any one of us. Will the 12-lead prevent this from ever happening again, if the ECG obtained in the emergency department did not show anything? No, it may not prevent it from happening again but having a 12-lead ECG of the patient s electrical conduction in the myocardium may provide enough information to encourage the doctor to order additional tests to rule out a myocardial infarction (MI) and, if necessary, take the appropriate steps to prevent a reoccurrence. 4

4 Consider this - approximately 50% of MIs result in prehospital death due to arrhythmias (VF). Paramedics, as well as the community at large, have been educated regarding the reduction of deaths due to arrhythmias possible from the use of rapid defibrillation. The next logical step is the reduction of these fatal arrhythmias. Studies show that the first 60 minutes following the onset of ischemic chest pain is the time of highest risk for VF or VT; we need to try to affect care in this 60-minute window. When you also consider that, due to denial or lack of identification, many patients wait greater than two hours before seeking assistance, we as paramedics or as one of the first links of the chain of life are already working on borrowed time. Early identification of the signs of a myocardial infarction by the patient, by EMS with appropriate prehospital care and by the emergency department should reduce this 50% mortality rate in MIs 1. GETTING STARTED We will be looking at only one main aspect of the 12-lead ECG and that is to be able to recognize and localize an Acute Myocardial Infarction (AMI). While many aspects of 12- lead interpretation require much study and practice, we will be focusing on identifying the pattern of ST segment elevation produced by an AMI. To do this we must use consistent terminology and reference points on the 12-lead printout. We will start at the very beginning with the paper the tracing is printed on. It is the same paper the monitor normally prints on, so all of the same factors apply. o o Small squares = 1 mm in height and 1 mm in width Large squares = 5 mm in height and 5 mm in width You require this knowledge because when assessing the 12-lead ECG you will be looking for ST segment elevation greater than 1 mm. Knowing that one small square is 1 mm in height means you do not require a measuring tape. The paper runs at a constant speed of 25 mm/sec, so 1 small square (1 mm in width) equals 0.04 seconds. Each block of 5 small squares (5 mm or one large square) equals 0.20 seconds. This information is needed to help calculate rate and other timed intervals of the ECG. A major difference between a tracing used for rhythm interpretation and the tracing of the 12-lead is in the time. Strips between 6 and 10 seconds are required for rhythm interpretation to be able to review the pattern and, therefore, identify the rhythm. The 12-lead tracing prints approximately only 2.5 seconds of the rhythm which is not enough to do accurate rhythm interpretation but is usually enough to give you one good complex in each lead. With the 12-lead you compare the complexes generated simultaneously by the various views or leads. 5

5 Identifying Components of the ECG (A Review) P Wave The P wave is the first positive (upward) deflection on the ECG. It represents atrial depolarization (contraction). It is normally nicely rounded and precedes the QRS complex. The QRS complex may not always be related or following a P wave if conduction disturbances are present. Changes in the shape of the P wave or inversion, indicate a change in the originating site of the P wave in the atria. This is frequently referred to as a wandering pacemaker. Q Wave The Q wave is a negative wave preceding an R wave. Not all complexes have a visible Q wave, but if there is any negative deflection in front of the R wave, it is labeled a Q wave. When a Q wave is noted in any lead, always measure its width and height. The width is measured from the start of the downward deflection to its return to the isoelectric line. When present a Q wave that is less then 0.04 seconds (<1 small square in width) in Q Wave duration is referred to as a physiological Q wave and is considered a normal occurrence. A Q wave that is greater then 0.04 seconds (>1 small square in width) and is at least 25% of the height of the R wave is considered a pathological Q Wave and indicates irreversible damage (necrosis). This may be part of the presenting complaint or indicative of a previous infarction. R Wave The R wave is the first positive deflection of the QRS complex. No matter where it occurs in the complex, the R wave is the first positive deflection above the isoelectric (base) line. The R wave includes the upstroke and the down stroke returning to the isoelectric line. S Wave R Wave The S wave is a negative deflection following the R wave. Measuring the S wave is the same as the Q and R waves; it starts at the base line and returns to the base line. 6

6 The R and S waves combined represent the sum of electrical forces resulting from simultaneous depolarization of the right and left ventricles (systole, contraction). It is possible to have more then one R wave and more then one S wave in a complex. This will be discussed further at a later time but, for now and for your reference, this is often what you will hear people refer to as bunny ears which is indicative of a bundle branch block. The combination of the Q, R and S waves makes up the QRS complex. The normal QRS complex is narrow and sharply pointed. Its width is considered normal if less than 0.12 seconds or 3 small boxes. If the QRS complex is equal to or greater than 0.12 seconds or 3 boxes, this is indicative of some sort of conduction problem through the heart tissue. T Wave The T wave follows the QRS complex and represents the repolarization of the ventricular myocardial cells. It is identified as the first deviation from the ST segment and ends where the wave returns to the baseline. The shape of the T wave can indicate different aspects of myocardial health. Healthy myocardial tissue will produce a rounded, slightly asymmetrical positive deflection. Inverted or depressed T waves may indicate previous or current cardiac ischemia but are usually an early sign of an ongoing or current ischemic event. Elevated T waves (> half the height of the QRS complex) are referred to as peaked or tented T waves and are usually indicative of new ischemia or hyperkalemia. J-Point The J-point is the junction between the end of the QRS complex and the beginning of the ST segment. It is best located by looking for the point where the T Wave QRS stops and makes a sudden sharp change in direction. Any time that you have measured the J-Point width of a QRS complex you have measured from the start of the Q wave to the end of the S wave which means you have identified the J- point many times so this should not be new to you, it now just has a name. The J-point is used to help determine the length of the ST segment. ST Segment S Wave The ST segment is the portion of the ECG located between the J-point and the start of the T wave. For our purposes in reading a 12-lead ECG the ST segment is probably the single most important element when looking for ST T Wave TP P Wave 7

7 evidence of an Acute Myocardial Infarction. To determine if the ST segment is elevated or depressed, we need an isoelectric base line. The TP segment is used to determine the isoelectric baseline. TP Segment The TP segment is the section of the ECG between the end of one complex s T wave and the beginning of the next complex s P wave. This is where the tracing returns as close as possible to the baseline or isoelectric line. It is important to use the TP segment as your reference point as there are times that if the PR segment was used it could be depressed and give the illusion of ST segment elevation. WHAT S IN A LEAD? An important point in 12-lead interpretation is knowing which part of the heart each lead views. This, combined with knowing what changes can take place in each of those leads, can result in the recognition of an acute myocardial infarction. Early identification of an acute myocardial infarction and early treatment can lead to reperfusion of valuable myocardium preventing both tissue death and the potential for a life threatening arrhythmia. Let s review some basic terminology so that we are all talking the same language about the same things: Electrode the end of the wire that connects the patient to the monitor Cables the bundle of wires used to connect electrodes from the patient to the monitor Lead made up of a negative and positive electrode that looks at different aspects of the heart depending on where the electrodes are located relative to each other. This may seem basic but keeping these terms straight will help out as we move along. A 12-lead ECG is made up of a tracing of the electrical activity of the heart from 12 different points of view. The point of view comes from the location of the positive electrode of each lead. The positioning of these electrodes is broken down into 3 categories, the limb leads (lead I, II & III), the augmented leads (avr, avl & avf) and the precordial or chest leads (V1, V2, V3, V4, V5 & V6). 8

8 The 12-lead ECG, when printed, is laid out in a standard fashion as per the diagram. We will look at this again a little later on. I avr V1 V4 II avl V2 V5 III avf V3 V6 Limb Leads It is important to remember where the positive and negative electrode of each lead is placed in relation to the heart, so that you can identify which part of the heart the lead is looking at. If you were to place a camera at the positive electrode, facing the negative electrode, you would be taking a picture of the area of the heart that particular lead is looking at. The lead we are most familiar with is Lead II, which is one of the limb leads. Lead I, Lead II and Lead III combine to form a triangle around the perimeter of the heart. This triangle is frequently referred to as Einthoven s Triangle, named in the early 1900 s after a pioneer in electrocardiography. When acquiring a 12-lead, the limb leads are normally placed close to the ankles and wrists, but it is acceptable to use the upper arm/thigh. The right arm electrode is always negative and the left leg electrode is always positive. This combination, with the camera sitting at the positive electrode looking at the negative electrode, gives us Lead II and a view of the inferior wall of the left ventricle. The left arm electrode can be switched between positive and negative depending on which lead is being viewed. Picture the camera sitting on the left arm when it is positive looking towards the negative (right arm) electrode. This is Lead I and gives us a view of the high lateral wall of the left ventricle. When the left arm electrode is negative and the view is from the positive left leg electrode, we are again looking up at the inferior wall of the left ventricle with just a slightly different angle. 9

9 Augmented Leads The augmented leads use the same lead locations as the limb leads. What gives us the difference in the view of the heart is the fact that all of the electrodes on the limbs are positive and they look towards the neutral center of the heart. Fortunately, changing the polarity of the electrodes is controlled by and completed rapidly by the monitor so we don t have to worry about how it s done, just what it s looking at. When the positive electrode is at the right shoulder, this is referred to as augmented voltage right (avr). The view we receive is of the upper right area of the heart and great vessels. This view is normally the least used view in 12-lead ECG interpretation. When the positive electrode is at the left shoulder, this is referred to as augmented voltage left (avl). The view we receive is of the high lateral wall of the left ventricle. The final view, positive electrode on the left foot, is avf or augmented voltage left foot. This lead gives us a view of the inferior wall of the left ventricle. Precordial Leads The precordial leads, like the augmented leads, are all positive and all use the neutral center of the heart as their focus point. We will go into the actual physical identification for locating these leads in another module, for now it will be simplest to use the following chart to identify each electrode location and the section of the heart that the lead is viewing. Lead Location View V1 ß 4 th intercostal space, right sternal border ß Ventricular septum V2 ß 4 th intercostal space, left sternal border ß Ventricular septum V3 ß Between V2 and V4 ß Anterior wall of left ventricle V4 ß 5 th intercostal space, midclavicular line ß Anterior wall of left ventricle V5 ß Lateral to V4 at the anterior axillary line ß Lateral wall of left ventricle V6 ß Lateral to V5 at midaxillary line ß Lateral wall of left ventricle You may have noticed that in a 12-lead ECG, the left ventricle is the target or viewpoint. Remember that the left ventricle is the largest, most muscled portion of the heart and, therefore, is an area that is first to complain of the pain associated with a decrease in tissue perfusion (for example, angina). As well, tissue damage in the left ventricle can result in a potentially more lethal arrhythmia (atrial fibrillation compared to ventricular fibrillation). Something else you may have noticed is leads that look at the same portion of the left ventricle. These are considered Anatomically Contiguous leads. This particular grouping of leads is a very important aspect of 12-lead ECG interpretation. 10
. The view we receive is of the upper right area of the heart and great vessels.")
10 Anatomically contiguous leads are two or more leads that look at adjoining areas of tissue. Determining which leads are contiguous may be confusing, but the easiest explanation is this; if the leads have the same name (for example, inferior) they are contiguous. With the chest leads, if they are consecutively numbered they are also contiguous. For example, V2 is called a septal lead and V3 an anterior lead, not the same name but they are both chest leads and numerically consecutive so, therefore, they are contiguous. REVIEW The following illustrations may make the previous section a little clearer. Understanding what the leads are viewing and if they are contiguous is as important in interpreting a 12-lead ECG as the changes that you will be looking for. Leads II, III and avf are leads that have their positive electrode located at the left foot. They are contiguous leads that all look at the inferior wall of the left ventricle. I & avl Leads I and avl are leads that have their positive electrode located on the left arm. These leads view the high lateral wall of the left ventricle. anterior Lateral Wall posterior 11

11 Leads V5 and V6 are positioned on the left lateral chest and view the lower lateral wall of the left ventricle. V5 & V6 Since Leads 1, avl, V5 and V6 all view the lateral wall of the left ventricle they are considered contiguous. Leads V3 and V4 are on the anterior wall of the left chest which correlates with the viewing the anterior wall of the left ventricle. Leads V1 and V2 are positioned on each side of the sternum and from that placement they look through the right ventricle and see the septal wall. 12

12 Going back to the earlier diagram of the 12-lead ECG and putting everything together on an overlaid diagram may look confusing at first but will become an excellent reference as you learn to interpret a 12-lead ECG. I LATERAL avr V1 SEPTAL V4 ANTERIOR II INFERIOR avl LATERAL V2 SEPTAL V5 LATERAL III INFERIOR avf INFERIOR V3 ANTERIOR V6 LATERAL RECOGNIZING AN ACUTE MYOCARDIAL INFARCTION Let s do a brief recap. We have looked at the components of an ECG tracing including identification of the QRS complex, and the ST segments. We have looked at what area individual leads are looking at or viewing. If I was to tell you there is only one more item required and a few rules to follow, would you believe you are ready to interpret 12-lead ECGs for the purpose of recognizing an acute myocardial infarction (AMI)? It s true. For AMI recognition there are two things to know: what to look for and where to look. It will take some time to feel comfortable with interpreting the information of the 12-lead ECG but like most things it will come with time. What to Look For When reviewing the 12-lead ECG there are two aspects to look at and consider. First look at the ST segments. Elevation of the ST segment equal to or greater than 1 mm 13

13 (1 small box) is the first indicator. The ST segment elevation is measured from the J- point. Secondly, look at the different leads. Is there ST segment elevation in two anatomically contiguous leads? If you review a 12-lead ECG and you discover ST segment elevation greater than or equal to 1 mm in two contiguous leads, combined with the appropriate clinical presentation (found during your patient assessment), you have what is termed presumptive evidence of an AMI. This is generally a strong indication for acute reperfusion therapy usually in the form of a thrombolytic drug or coronary angioplasty. SUMMARY This report has focused on some of the basics of 12-lead ECG interpretation. Remember the goal of prehospital 12-lead ECG interpretation is to help to lessen the door to needle time for patients experiencing an AMI. We now have a prime opportunity for paramedics to impact on the phrase time is muscle. Our impact can be identified in two ways. The first is by obtaining a pre-medication 12- lead ECG for comparison with a post-medication 12-lead ECG done in the hospital. Remember to always treat your patient first. If your patient is in severe distress, do not withhold treatment to do a 12-lead ECG. Changes can occur rapidly and the comparison of the 12-lead ECGs may indicate an increase in an infarcting area or may indicate that our prehospital treatment of oxygen, nitroglycerin and ASA had an immediate impact. The second is by rapid identification of patients who are candidates for reperfusion therapy. The patient benefits from both ways. Many of you may be thinking that the time wasted taking a 12-lead ECG in the field could be better spent transporting the patient to the hospital. This is one of the hardest assumptions to deal with. Several studies have shown that obtaining a 12-lead ECG in the field takes minimal extra time. You will see that with practice, you will become more comfortable with land marking for the location of electrode placement. Your speed will pick up and this will be where a strong teamwork approach will have to take place to minimize the time spent with the patient. 14

14 BIBLIOGRAPHY Campbell MD, John Emory, Basic Prehospital Trauma Care, New Jersey: Brady Books, Davis RCT, Dale, Differential Diagnosis of Arrhythmias, Philadelphia: W.B. Saunders Co.,1997. Eishner MD, Gilber M.; Dox, Ida; Melloni, Biagio John; Melloni s Illustrated Medical Dictionary, Baltimore: The Williams & Wilkens Company, Hazinski RN MSN, Mary Fran, Handbook of Emergency Cardiovascular Care for Healthcare Providers, Texas: American Heart Association, Hole, John, Human Anatomy And Physiology, Iowa: Wm. C. Brown Company Publishers, Justice, Bryan, ACLS Essentials, Mississauga: Canadian Health Educators, Phalen, Tim, 12-Lead ECG in the Acute Coronary Syndromes, Redmond: Acute Coronary Syndromes, Inc. / Medtronic Physio-Control Corp., 2000 Sanders. Mick J., Mosby s Paramedic Textbook St. Louis: Mosby Lifeline Books,

15 PRACTICE PART 1 Indicate on each of the following tracings the P wave, QRS complex, T wave, J point and ST section Name: OASIS: 16

16 Name: OASIS: 17

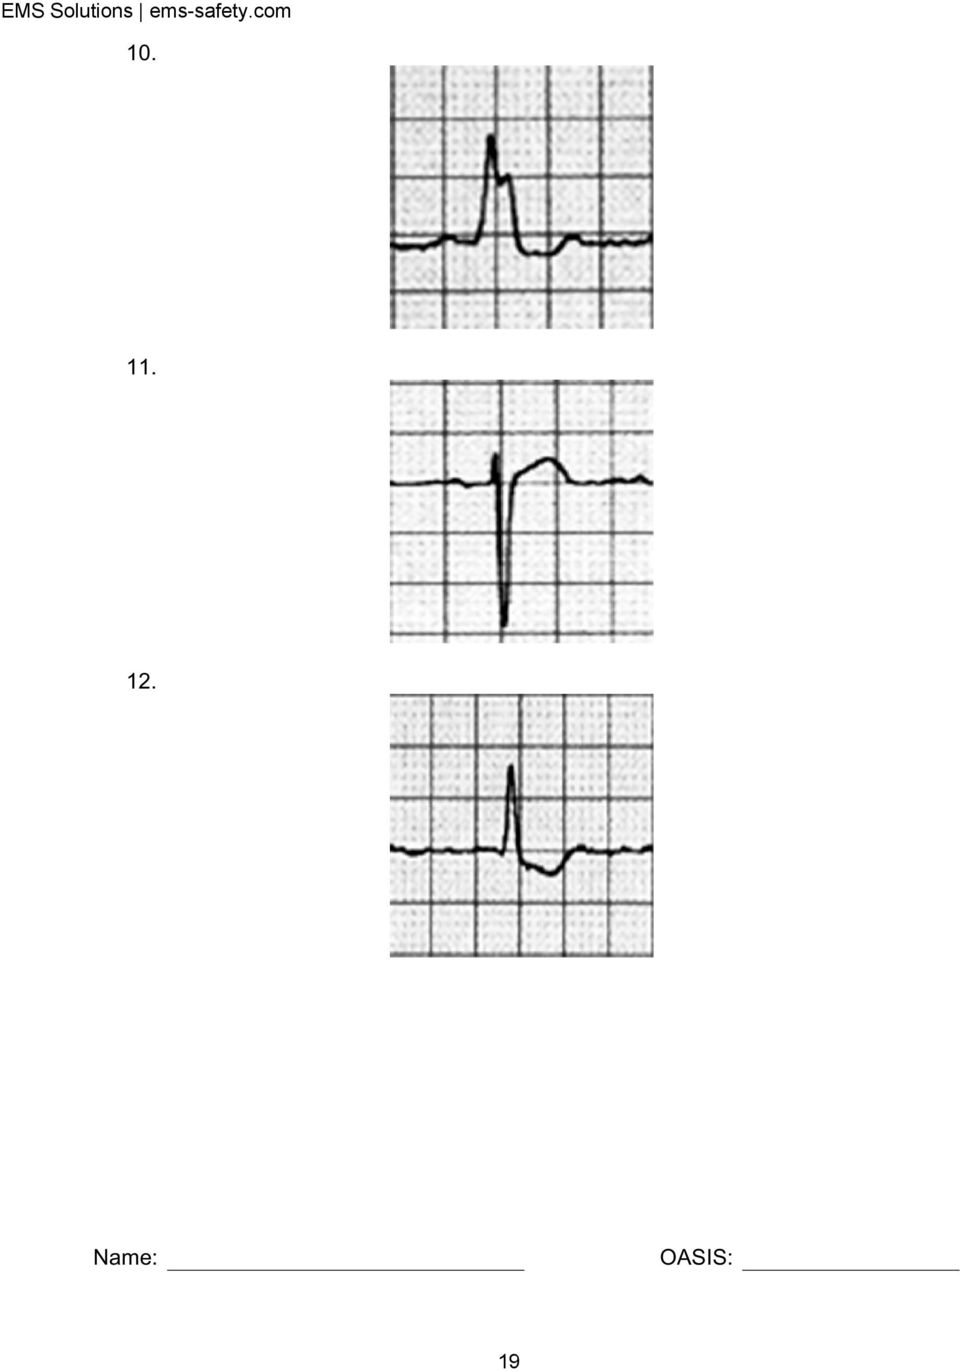
17 7. On the following tracings find the J-point and indicate if the ST segment is elevated > then 1 mm above the TP segment Name: OASIS: 18

18 Name: OASIS: 19
19 If you found this report useful, EMS Solutions recommends the following for further EKG study. Download the Practice Resource pages from Rapid Interpretation of EKG s for Free. Visit - Don t forget that you can also get the absolute meat and potatoes of EMS study by using EMS Solutions Quick Study Guide Now available in paperback. Visit - Sign up for our newsletter for more free downloads and unique products from EMS Solutions. Send a blank to emssafe@aweber.com 20

Understanding the Electrocardiogram. David C. Kasarda M.D. FAAEM St. Luke s Hospital, Bethlehem
 Understanding the Electrocardiogram David C. Kasarda M.D. FAAEM St. Luke s Hospital, Bethlehem Overview 1. History 2. Review of the conduction system 3. EKG: Electrodes and Leads 4. EKG: Waves and Intervals
12-Lead EKG Interpretation. Judith M. Haluka BS, RCIS, EMT-P
 12-Lead EKG Interpretation Judith M. Haluka BS, RCIS, EMT-P ECG Grid Left to Right = Time/duration Vertical measure of voltage (amplitude) Expressed in mm P-Wave Depolarization of atrial muscle Low voltage
BIPOLAR LIMB LEADS UNIPOLAR LIMB LEADS PRECORDIAL (UNIPOLAR) LEADS VIEW OF EACH LEAD INDICATIVE ECG CHANGES
 LEADS VIEW OF EACH LEAD INDICATIVE ECG CHANGES") BIPOLAR LIMB LEADS Have both a distinctive positive and negative pole. Lead I LA (positive) RA (negative) Lead II LL (positive) RA (negative) Lead III LL (positive) LA (negative) UNIPOLAR LIMB LEADS Have
BIPOLAR LIMB LEADS Have both a distinctive positive and negative pole. Lead I LA (positive) RA (negative) Lead II LL (positive) RA (negative) Lead III LL (positive) LA (negative) UNIPOLAR LIMB LEADS Have
Electrophysiology Introduction, Basics. The Myocardial Cell. Chapter 1- Thaler
 Electrophysiology Introduction, Basics Chapter 1- Thaler The Myocardial Cell Syncytium Resting state Polarized negative Membrane pump Depolarization fundamental electrical event of the heart Repolarization
Scott Hubbell, MHSc, RRT-NPS, C-NPT, CCT Clinical Education Coordinator/Flight RRT EagleMed
 Scott Hubbell, MHSc, RRT-NPS, C-NPT, CCT Clinical Education Coordinator/Flight RRT EagleMed Identify the 12-Lead Views Explain the vessels of occlusion Describe the three I s Basic Interpretation of 12-Lead
ACLS Chapter 3 Rhythm Review Instructor Lesson Plan to Accompany ACLS Study Guide 3e
 ACLS Chapter 3 Rhythm Review Lesson Plan Required reading before this lesson: ACLS Study Guide 3e Textbook Chapter 3 Materials needed: Multimedia projector, computer, ACLS Chapter 3 Recommended minimum
the basics Perfect Heart Institue, Piyavate Hospital
 ECG INTERPRETATION: the basics Damrong Sukitpunyaroj MD Damrong Sukitpunyaroj, MD Perfect Heart Institue, Piyavate Hospital Overview Conduction Pathways Systematic Interpretation Common abnormalities in
12/15-Lead ECG Protocol approved October 2005 revised October 2008
 approved October 2005 revised October 2008 Preamble Rapid diagnosis of acute myocardial infarction is essential to initiating appropriate treatment and improving outcomes. In selected practice environments
ST Segment Elevation Nothing is ever as hard (or easy) as it looks
 as it looks") ST Segment Elevation Nothing is ever as hard (or easy) as it looks Cameron Guild, MD Division of Cardiology University of Mississippi Medical Center February 17, 2012 Objectives 1. Describe the electrical
ST Segment Elevation Nothing is ever as hard (or easy) as it looks Cameron Guild, MD Division of Cardiology University of Mississippi Medical Center February 17, 2012 Objectives 1. Describe the electrical
Tips and Tricks to Demystify 12 Lead ECG Interpretation
 Tips and Tricks to Demystify 12 Lead ECG Interpretation Mission: Lifeline North Dakota Regional EMS and Hospital Conference Samantha Kapphahn, DO Essentia Health- Interventional Cardiology June 5th, 2014
Biology 347 General Physiology Lab Advanced Cardiac Functions ECG Leads and Einthoven s Triangle
 Biology 347 General Physiology Lab Advanced Cardiac Functions ECG Leads and Einthoven s Triangle Objectives Students will record a six-lead ECG from a resting subject and determine the QRS axis of the
Evaluation copy. Analyzing the Heart with EKG. Computer
 Analyzing the Heart with EKG Computer An electrocardiogram (ECG or EKG) is a graphical recording of the electrical events occurring within the heart. In a healthy heart there is a natural pacemaker in
Introduction to Electrocardiography. The Genesis and Conduction of Cardiac Rhythm
 Introduction to Electrocardiography Munther K. Homoud, M.D. Tufts-New England Medical Center Spring 2008 The Genesis and Conduction of Cardiac Rhythm Automaticity is the cardiac cell s ability to spontaneously
Electrocardiography Review and the Normal EKG Response to Exercise
 Electrocardiography Review and the Normal EKG Response to Exercise Cardiac Anatomy Electrical Pathways in the Heart Which valves are the a-v valves? Closure of the a-v valves is associated with which heart
An ECG Primer. Quick Look. I saw it, but I did not realize it. Elizabeth Peabody
 4 An ECG Primer Quick Look Cardiac Monitoring System - p. 64 ECG Paper - p. 73 Lead Polarity and Vectors - p. 77 Basic ECG Components - p. 79 Heart Rate and Pulse Rate - p. 91 Summary - p. 94 Chapter Quiz
For more information about the use of the Propaq monitor, refer to the Propaq Directions For Use.
 Clinical Support 8500 S.W. Creekside Pl. Beaverton, OR 97008-7107 U.S.A. Telephone: 503-526-4200 Toll Free: 800-289-2500 clinicalsupport@protocol.com ELECTROCARDIOGRAPHY Introduction This article provides
The P Wave: Indicator of Atrial Enlargement
 Marquette University e-publications@marquette Physician Assistant Studies Faculty Research and Publications Health Sciences, College of 8-12-2010 The P Wave: Indicator of Atrial Enlargement Patrick Loftis
BASIC CARDIAC ARRHYTHMIAS Revised 10/2001
 BASIC CARDIAC ARRHYTHMIAS Revised 10/2001 A Basic Arrhythmia course is a recommended prerequisite for ACLS. A test will be given that will require you to recognize cardiac arrest rhythms and the most common
NEONATAL & PEDIATRIC ECG BASICS RHYTHM INTERPRETATION
 NEONATAL & PEDIATRIC ECG BASICS & RHYTHM INTERPRETATION VIKAS KOHLI MD FAAP FACC SENIOR CONSULATANT PEDIATRIC CARDIOLOGY APOLLO HOSPITAL MOB: 9891362233 ECG FAX LINE: 011-26941746 THE BASICS: GRAPH PAPER
ECG made extra easy. medics.cc
 ElectroCardioGraphyraphy ECG made extra easy Overview Objectives for this tutorial What is an ECG? Overview of performing electrocardiography on a patient Simple physiology Interpreting the ECG Objectives
Activity 4.2.3: EKG. Introduction. Equipment. Procedure
 Activity 4.2.3: EKG The following is used with permission of Vernier Software and Technology. This activity is based on the experiment Analyzing the Heart with EKG from the book Human Physiology with Vernier,
Podcast with Dr. Kossick
 Podcast with Dr. Kossick Interviewed by Western Carolina University Graduate Anesthesia Student Kristin Andrejco From the Head of the Bed main@fromtheheadofthebed.com December 5, 2014 (33 min) EKG Lead
Electrocardiography I Laboratory
 Introduction The body relies on the heart to circulate blood throughout the body. The heart is responsible for pumping oxygenated blood from the lungs out to the body through the arteries and also circulating
By the end of this continuing education module the clinician will be able to:
 EKG Interpretation WWW.RN.ORG Reviewed March, 2015, Expires April, 2017 Provider Information and Specifics available on our Website Unauthorized Distribution Prohibited 2015 RN.ORG, S.A., RN.ORG, LLC Developed
INTRODUCTORY GUIDE TO IDENTIFYING ECG IRREGULARITIES
 INTRODUCTORY GUIDE TO IDENTIFYING ECG IRREGULARITIES NOTICE: This is an introductory guide for a user to understand basic ECG tracings and parameters. The guide will allow user to identify some of the
ELECTROCARDIOGRAPHY (I) THE GENESIS OF THE ELECTROCARDIOGRAM
 THE GENESIS OF THE ELECTROCARDIOGRAM") ELECTROCARDIOGRAPHY (I) THE GENESIS OF THE ELECTROCARDIOGRAM Scridon Alina, Șerban Răzvan Constantin 1. Definition The electrocardiogram (abbreviated ECG or EKG) represents the graphic recording of electrical
ELECTROCARDIOGRAPHY (I) THE GENESIS OF THE ELECTROCARDIOGRAM Scridon Alina, Șerban Răzvan Constantin 1. Definition The electrocardiogram (abbreviated ECG or EKG) represents the graphic recording of electrical
The Electrocardiogram (ECG)
") The Electrocardiogram (ECG) Preparation for RWM Lab Experiment The first ECG was measured by Augustus Désiré Waller in 1887 using Lippmann's capillary electrometer. Recorded ECG: http://www.youtube.com/watch_popup?v=q0jmfivadue&vq=large
The Electrocardiogram (ECG) Preparation for RWM Lab Experiment The first ECG was measured by Augustus Désiré Waller in 1887 using Lippmann's capillary electrometer. Recorded ECG: http://www.youtube.com/watch_popup?v=q0jmfivadue&vq=large
Clinical Observations with the Lead System
 Clinical Observations with the Lead System Frank Precordial By J. A. ABILDSKOv, M.D., W. W. STREET, M.D., N. SOLOMON, B.A., AND A. H. TOOMAJIAN, B.A. Several new lead systems for electrocardiography and
12 Lead ECGs: Ischemia, Injury & Infarction Part 2
 12 Lead ECGs: Ischemia, Injury & Infarction Part 2 McHenry Western Lake County EMS Localization: Left Coronary Artery Right Coronary Artery Right Ventricle Septal Wall Anterior Descending Artery Left Main
Section Four: Pulmonary Artery Waveform Interpretation
 Section Four: Pulmonary Artery Waveform Interpretation All hemodynamic pressures and waveforms are generated by pressure changes in the heart caused by myocardial contraction (systole) and relaxation/filling
Policy & Procedures. I.D. Number: 1142
 Policy & Procedures Title: CARDIAC (ECG) MONITORING I.D. Number: 1142 Authorization: [X] SHR Nursing Practice Committee Source: Date Revised: November 2012 Date Effective: October 2004 Scope: SHR - Acute
Monitoring EKG. Evaluation copy
 Monitoring EKG Computer 28 An electrocardiogram, or EKG, is a graphical recording of the electrical events occurring within the heart. A typical EKG tracing consists of five identifiable deflections. Each
Systematic Approach to 12 Lead EKG Interpretation
 Systematic Approach to 12 Lead EKG Interpretation Maureen Knechtel MPAS, PA-C Wellmont CVA Heart Institute Disclosure Statement of Financial Interest I, Maureen Knechtel, do not have a financial interest/arrangement
MULTIPLE CHOICE. Choose the one alternative that best completes the statement or answers the question.
 Exam Name MULTIPLE CHOICE. Choose the one alternative that best completes the statement or answers the question. 1) What term is used to refer to the process of electrical discharge and the flow of electrical
REFERRAL HOSPITAL. The Importance of Door In Door Out Time DIDO
 REFERRAL HOSPITAL The Importance of Door In Door Out Time DIDO Time to Treatment is critical for STEMI patients For patients with ST-segment elevation myocardial infarction (STEMI), percutaneous coronary
QRS Complexes. Fast & Easy ECGs A Self-Paced Learning Program
 6 QRS Complexes Fast & Easy ECGs A Self-Paced Learning Program Q I A ECG Waveforms Normally the heart beats in a regular, rhythmic fashion producing a P wave, QRS complex and T wave I Step 4 of ECG Analysis
Table of Contents Error! Bookmark not defined.
 Table of Contents EKG TRACING...1 Figure 1 - EKG Tracing... Error! Bookmark not defined. STEP 1...1 Rate... 1 Figure 2 - Determining the Rate... 1 Step 2...2 Rhythm... 2 Figure 3 - Determining the Rhythm
6/5/2014. Objectives. Acute Coronary Syndromes. Epidemiology. Epidemiology. Epidemiology and Health Care Impact Pathophysiology
 Objectives Acute Coronary Syndromes Epidemiology and Health Care Impact Pathophysiology Unstable Angina NSTEMI STEMI Clinical Clues Pre-hospital Spokane County EMS Epidemiology About 600,000 people die
Interpreting AV (Heart) Blocks: Breaking Down the Mystery
 Blocks: Breaking Down the Mystery") Interpreting AV (Heart) Blocks: Breaking Down the Mystery 2 Contact Hours Copyright 2012 by RN.com. All Rights Reserved. Reproduction and distribution of these materials is prohibited without the express
Interpreting AV (Heart) Blocks: Breaking Down the Mystery 2 Contact Hours Copyright 2012 by RN.com. All Rights Reserved. Reproduction and distribution of these materials is prohibited without the express
RAPID INTERPRETATION OF. EKG s
 Personal Quick Reference Sheets 333 (pages 333 to 346) There is no need to remove these reference pages from your book. To download and print them in full color, go to: www.themdsite.com Reference Sheets
ECG Findings. IV Access. 12 Lead Interpretation: STEMI and NSTEMI. ACLS Acute Coronary Syndrome Chest Pain Suggestive of Ischemia.
 12 Lead Interpretation: STEMI and NSTEMI Presented by Annmarie Keck, RN, BSN, CEN Northwest MedStar Clinical Outreach Educator ACLS Acute Coronary Syndrome Chest Pain Suggestive of Ischemia Immediate Assessment
Distance Learning Program Anatomy of the Human Heart/Pig Heart Dissection Middle School/ High School
 Distance Learning Program Anatomy of the Human Heart/Pig Heart Dissection Middle School/ High School This guide is for middle and high school students participating in AIMS Anatomy of the Human Heart and
ST Segment Monitoring. IntelliVue Patient Monitor and Information Center, Application Note
 ST Segment Monitoring ST/AR Algorithm IntelliVue Patient Monitor and Information Center, Application Note This application note describes principles and uses for continuous ST segment monitoring. It also
The abbreviation EKG, for electrocardiogram,
 CLIN PEDIATR OnlineFirst, published on January 28, 2010 as doi:10.1177/0009922809336206 Simplified Pediatric Electrocardiogram Interpretation Clinical Pediatrics Volume XX Number X Month XXXX xx-xx 2009
12 LEAD ECG ACQUISITION & TRANSMISSION FOR BLS PROVIDERS
 LESSON PLAN I. Introduction (Slide 1-2) a. Course development and philosophy b. Course agenda i. Lecture 1. PPT with instructor notes 2. Resource citations 3. Credit to contributors and reviewers ii. Hands
Automatic External Defibrillators
 Last Review Date: May 27, 2016 Number: MG.MM.DM.10dC2 Medical Guideline Disclaimer Property of EmblemHealth. All rights reserved. The treating physician or primary care provider must submit to EmblemHealth
Diagnosis Code Crosswalk : ICD-9-CM to ICD-10-CM Cardiac Rhythm and Heart Failure Diagnoses
 Diagnosis Code Crosswalk : to 402.01 Hypertensive heart disease, malignant, with heart failure 402.11 Hypertensive heart disease, benign, with heart failure 402.91 Hypertensive heart disease, unspecified,
2 ECG basics. Leads and planes. Leads. Planes. from different perspectives, which are called leads and planes.
 558302.qxp 3/14/12 10:47 PM Page 12 2 ECG basics One of the most valuable diagnostic tools available, an electrocardiogram (ECG) records the heart s electrical activity as waveforms. By interpreting these
Emergency Scenario. Chest Pain
 Emergency Scenario Chest Pain This emergency scenario reviews chest pain in a primary care patient, and is set up for roleplay and case review with your staff. 1) The person facilitating scenarios can
The American Heart Association released new resuscitation science and treatment guidelines on October 19, 2010.
 ACLS Study Guide The American Heart Association released new resuscitation science and treatment guidelines on October 19, 2010. Please read the below information carefully This letter is to confirm your
GENERAL HEART DISEASE KNOW THE FACTS
 GENERAL HEART DISEASE KNOW THE FACTS WHAT IS Heart disease is a broad term meaning any disease affecting the heart. It is commonly used to refer to coronary heart disease (CHD), a more specific term to
Adult & Paediatric Resting Electrocardiography (ECG) Cardiac Sciences
 Cardiac Sciences") Document Number # QH-GDL-387:2012 Adult & Paediatric Resting Electrocardiography (ECG) Cardiac Sciences Custodian/Review Officer: Chief Allied Health Officer Version no: 1.0 Applicable To: All health practitioners
Document Number # QH-GDL-387:2012 Adult & Paediatric Resting Electrocardiography (ECG) Cardiac Sciences Custodian/Review Officer: Chief Allied Health Officer Version no: 1.0 Applicable To: All health practitioners
Is it really so? : Varying Presentations for ACS among Elderly, Women and Diabetics. Yen Tibayan, M.D. Division of Cardiovascular Medicine
 Is it really so? : Varying Presentations for ACS among Elderly, Women and Diabetics Yen Tibayan, M.D. Division of Cardiovascular Medicine Case Presentation 69 y.o. woman calls 911 with the complaint of
Greater Hartford EMS Education STEMI Workbook
 Greater Hartford EMS Education STEMI Workbook Welcome to The North Central Connecticut EMS Regional STEMI Care Training Program on CT Train. After you have read this workbook, please refer to the email
HEART MONITOR TREADMILL 12 LEAD EKG
 2 HEART MONITOR TREADMILL 12 LEAD EKG Portable ambulatory monitoring system Continuously records electrical activity of the heart for 24 hours or more Also known as ambulatory electrocardiographic monitor
Lancashire Teaching Hospitals Cardio-Respiratory Department. Lead systems. Paula Hignett
 Lancashire Teaching Hospitals Cardio-Respiratory Department Lead systems Paula Hignett Objectives Understand the terminology and theory of the 12 views of the heart with reference to: Unipolar and Bipolar
THE SOCIETY FOR. Recording a standard 12-lead electrocardiogram. An Approved Methodology
 THE SOCIETY FOR Recording a standard 12-lead electrocardiogram An Approved Methodology February 2010 Review Date: February 2013 Introduction Practice varies across the Health Service predominantly due
Coronary Artery Disease leading cause of morbidity & mortality in industrialised nations.
 INTRODUCTION Coronary Artery Disease leading cause of morbidity & mortality in industrialised nations. Although decrease in cardiovascular mortality still major cause of morbidity & burden of disease.
How to read the ECG in athletes: distinguishing normal form abnormal
 How to read the ECG in athletes: distinguishing normal form abnormal Antonio Pelliccia, MD Institute of Sport Medicine and Science www.antoniopelliccia.it Cardiac adaptations to Rowing Vagotonia Sinus
Interpreting a rhythm strip
 3 Interpreting a rhythm strip Just the facts In this chapter, you ll learn: the components of an ECG complex and their significance and variations techniques for calculating the rate and rhythm of an ECG
Anatomy and Physiology: Understanding the Importance of CPR
 Anatomy and Physiology: Understanding the Importance of CPR Overview This document gives you more information about the body s structure (anatomy) and function (physiology). This information will help
Improving PCI Benchmark times in a Non-PCI World
 Improving PCI Benchmark times in a Non-PCI World May 2011 St David s Georgetown Hospital, Georgetown Texas Margaret Connors BSN, RN, CEN Kirk Sinclair BSN, RN, CEN National Processes/ Mission LifeLine
The new generation in ECG interpretation
 The new generation in ECG interpretation Philips DXL ECG Algorithm, Release PH100B The Philips DXL ECG Algorithm, developed by the Advanced Algorithm Research Center, uses sophisticated analytical methods
Mission: Lifeline Recommendations for Criteria for STEMI Systems of Care
 Mission: Lifeline Recommendations for Criteria for STEMI Systems of Care The Mission: Lifeline Certification Program will acknowledge STEMI Systems, EMS, Non-PCI/STEMI Referral Centers and PCI/STEMI Receiving
Feature Vector Selection for Automatic Classification of ECG Arrhythmias
 Feature Vector Selection for Automatic Classification of ECG Arrhythmias Ch.Venkanna 1, B. Raja Ganapathi 2 Assistant Professor, Dept. of ECE, G.V.P. College of Engineering (A), Madhurawada, A.P., India
Equine Cardiovascular Disease
 Equine Cardiovascular Disease 3 rd most common cause of poor performance in athletic horses (after musculoskeletal and respiratory) Cardiac abnormalities are rare Clinical Signs: Poor performance/exercise
Management of Pacing Wires After Cardiac Surgery
 Management of Pacing Wires After Cardiac Surgery David E. Lizotte, Jr. PA C, MPAS, FAPACVS President, Association of Physician Assistants in Cardiovascular Surgery Conflicts: None Indications 2008 Journal
Signal-averaged electrocardiography late potentials
 SIGNAL AVERAGED ECG INTRODUCTION Signal-averaged electrocardiography (SAECG) is a special electrocardiographic technique, in which multiple electric signals from the heart are averaged to remove interference
Electrodes placed on the body s surface can detect electrical activity, APPLIED ANATOMY AND PHYSIOLOGY. Circulatory system
 4 READING AND INTERPRETING THE ELECTROCARDIOGRAM Electrodes placed on the body s surface can detect electrical activity, which occurs in the heart. The recording of these electrical events comprises an
Tachyarrhythmias (fast heart rhythms)
") Patient information factsheet Tachyarrhythmias (fast heart rhythms) The normal electrical system of the heart The heart has its own electrical conduction system. The conduction system sends signals throughout
Patient information factsheet Tachyarrhythmias (fast heart rhythms) The normal electrical system of the heart The heart has its own electrical conduction system. The conduction system sends signals throughout
EMR Tutorial Acute Coronary Syndrome
 EMR Tutorial Acute Coronary Syndrome How to find the Acute Coronary Syndrome AAA Home Page 1 of 26 Master Tool Bar Icon When the Template button is clicked you will be presented with the preference list.
Exchange solutes and water with cells of the body
 Chapter 8 Heart and Blood Vessels Three Types of Blood Vessels Transport Blood Arteries Carry blood away from the heart Transport blood under high pressure Capillaries Exchange solutes and water with cells
VCA Veterinary Specialty Center of Seattle
 An electrocardiogram (ECG) is a graph of the heart`s electrical current, which allows evaluation of heart rate, rhythm and conduction. Identification of conduction problems within the heart begins with
The choice for quality ECG arrhythmia monitoring
 GE Healthcare EK-Pro The choice for quality ECG arrhythmia monitoring David A. Sitzman, MSEE. Mikko Kaski, MSAM. Ian Rowlandson, MSBE. Tarja Sivonen, RN. Olli Väisänen, MD, PhD. Clinical care environments
Normal Sinus Rhythm. Sinus Bradycardia. Sinus Tachycardia. Rhythm ECG Characteristics Example (NSR) & consistent. & consistent.
 & consistent. & consistent.") Normal Sinus Rhythm (NSR) Rate: 60-100 per minute Rhythm: R- R = P waves: Upright, similar P-R: 0.12-0.20 second & consistent P:qRs: 1P:1qRs Sinus Tachycardia Exercise Hypovolemia Medications Fever Hypoxia
Normal Sinus Rhythm (NSR) Rate: 60-100 per minute Rhythm: R- R = P waves: Upright, similar P-R: 0.12-0.20 second & consistent P:qRs: 1P:1qRs Sinus Tachycardia Exercise Hypovolemia Medications Fever Hypoxia
School of Health Sciences
 School of Health Sciences Cardiology Teaching Package A Beginners Guide to Normal Heart Function, Sinus Rhythm & Common Cardiac Arrhythmias Welcome This document extends subjects covered in the Cardiology
Heart Attack: What You Need to Know
 A WorkLife4You Guide Heart Attack: What You Need to Know What is a Heart Attack? The heart works 24 hours a day, pumping oxygen and nutrient-rich blood to the body. Blood is supplied to the heart through
NHA Certified Clinical Medical Assistant (CCMA)
") NHA Certified Clinical Medical Assistant (CCMA) Detailed Test Plan 150 scored items, 20 pretest Exam Time: 2 hours 50 minutes # items 1. Patient Care 70 A. General Patient Care 53 1. Identify patients
NHA Certified Clinical Medical Assistant (CCMA) Detailed Test Plan 150 scored items, 20 pretest Exam Time: 2 hours 50 minutes # items 1. Patient Care 70 A. General Patient Care 53 1. Identify patients
BC101 BLS Basic Life Support for Heathcare Providers
 BC101 BLS Basic Life Support for Heathcare Providers The BLS for Healthcare Providers course is designed to provide a wide variety of certified or noncertified, licensed or non-licensed, healthcare professionals
Cardiac Arrest Pediatric Ventricular Fibrillation / Pulseless Ventricular Tachycardia Protocol revised October 2008
 Cardiac Arrest Pediatric Ventricular Fibrillation / Pulseless Ventricular Tachycardia Protocol revised October 2008 Preamble In contrast to cardiac arrest in adults, cardiopulmonary arrest in pediatric
Sleep Heart Health Study (SHHS) ECG Protocol
 ECG Protocol") Sleep Heart Health Study (SHHS) ECG Protocol SHHS 1 Electrocardiography (ECG) Baseline ECG is performed in all parent study clinic visits preceding the PSG. All sites perform a standard resting 12-lead
Sleep Heart Health Study (SHHS) ECG Protocol SHHS 1 Electrocardiography (ECG) Baseline ECG is performed in all parent study clinic visits preceding the PSG. All sites perform a standard resting 12-lead
Deriving the 12-lead Electrocardiogram From Four Standard Leads Based on the Frank Torso Model
 Deriving the 12-lead Electrocardiogram From Four Standard Leads Based on the Frank Torso Model Daming Wei Graduate School of Information System The University of Aizu, Fukushima Prefecture, Japan A b s
A Patient s Guide to Primary and Secondary Prevention of Cardiovascular Disease Using Blood-Thinning (Anticoagulant) Drugs
 Drugs") A Patient s Guide to Primary and Secondary Prevention of PATIENT EDUCATION GUIDE What Is Cardiovascular Disease? Cardiovascular disease (CVD) is a broad term that covers any disease of the heart and circulatory
A Patient s Guide to Primary and Secondary Prevention of PATIENT EDUCATION GUIDE What Is Cardiovascular Disease? Cardiovascular disease (CVD) is a broad term that covers any disease of the heart and circulatory
Instytut Fizyki Doświadczalnej Wydział Matematyki, Fizyki i Informatyki UNIWERSYTET GDAŃSKI
 Instytut Fizyki Doświadczalnej Wydział Matematyki, Fizyki i Informatyki UNIWERSYTET GDAŃSKI 12 Experiment 12 : Examination of the heart using ECG and PCG I. Background theory. 1. Construction and functioning
The heart walls and coronary circulation
 CHAPTER 1 The heart walls and coronary circulation The heart is located in the central-left part of the thorax (lying on the diaphragm) and is oriented anteriorly, with the apex directed forward, downward,
RISK STRATIFICATION for Acute Coronary Syndrome in the Emergency Department
 RISK STRATIFICATION for Acute Coronary Syndrome in the Emergency Department Sohil Pothiawala FAMS (EM), MRCSEd (A&E), M.Med (EM), MBBS Consultant Dept. of Emergency Medicine Singapore General Hospital
Ischemia and Infarction
 Harvard-MIT Division of Health Sciences and Technology HST.035: Principle and Practice of Human Pathology Dr. Badizadegan Ischemia and Infarction HST.035 Spring 2003 In the US: ~50% of deaths are due to
ECG Measurments and Interpretation Programs
 ECG Measurments and Interpretation Programs Physician s Guide Distributed by Welch Allyn 4341 State Street Road, PO Box 220 Skaneateles Falls, NY 13153-0220 www.welchallyn.com Sales and Service information:
Spatial Vector Electrocardiography
 Spatial Vector Electrocardiography A Method for Calculating the Spatial Electrical Vectors of the Heart from Conventional Leads By ROBERT P. GRANT, M.D. A new method for the interpretation of conventional
Cardiac Arrest: General Considerations
 Andrea Gabrielli, MD, FCCM Cardiac Arrest: General Considerations Cardiopulmonary resuscitation (CPR) is described as a series of assessments and interventions performed during a variety of acute medical
QT analysis: A guide for statistical programmers. Prabhakar Munkampalli Statistical Analyst II Hyderabad, 7 th September 2012
 QT analysis: A guide for statistical programmers Prabhakar Munkampalli Statistical Analyst II Hyderabad, 7 th September 2012 Agenda ECG ICH E14 Thorough QT/QTc study Role of Statistical Programmer References
Basics of EKG Interpretation: A Programmed Study - Barbara Ritter Ed.D, FNP
 Basics of EKG Interpretation: A Programmed Study - Barbara Ritter Ed.D, FNP Acknowledgement is given to Leslie K. Muma, MS, RN, NP for assistance in preparation of this learning module. Description The
Objectives. The ECG in Pulmonary and Congenital Heart Disease. Lead II P-Wave Amplitude during COPD Exacerbation and after Treatment (50 pts.
 The ECG in Pulmonary and Congenital Heart Disease Gabriel Gregoratos, MD Objectives Review the pathophysiology and ECG signs of pulmonary dysfunction Review the ECG findings in patients with: COPD (chronic
Short Duration High-Level Exposure to Halon Substitutes: Potential Cardiovascular Effects
 Short Duration High-Level Exposure to Halon Substitutes: Potential Cardiovascular Effects Halon Alternatives Technical Working Conference 1993 Reva Rubenstein, Ph.D. U.S.Environmenta1 Protection Agency
DEFIBRILLATION AND THE AUTOMATIC EXTERNAL DEFIBRILLATOR A GUIDE
 DEFIBRILLATION AND THE AUTOMATIC EXTERNAL DEFIBRILLATOR A GUIDE Defibrillation and the AED, A guide Revised February 2012 Page 1 of 22 Original document complied by Pat Standen, Grampians Trauma, Emergency
Biopac Student Lab Lesson 6 ELECTROCARDIOGRAPHY (ECG) II Introduction. Rev. 06132012
 II Introduction. Rev. 06132012") 42 Aero Camino, Goleta, CA 93117 www.biopac.com Biopac Student Lab Lesson 6 ELECTROCARDIOGRAPHY (ECG) II Introduction Rev. 06132012 Richard Pflanzer, Ph.D. Associate Professor Emeritus Indiana University
42 Aero Camino, Goleta, CA 93117 www.biopac.com Biopac Student Lab Lesson 6 ELECTROCARDIOGRAPHY (ECG) II Introduction Rev. 06132012 Richard Pflanzer, Ph.D. Associate Professor Emeritus Indiana University
Official Online ACLS Exam
 \ Official Online ACLS Exam Please fill out this form before you take the exam. Name : Email : Phone : 1. Hypovolemia initially produces which arrhythmia? A. PEA B. Sinus tachycardia C. Symptomatic bradyarrhythmia
2015 Interim Resources for BLS
 2015 Interim Resources for BLS Original Release: November 25, 2015 Starting in 2016, new versions of American Heart Association online courses will be released to reflect the changes published in the 2015
Electrocardiogram and Heart Sounds
 Electrocardiogram and Heart Sounds An introduction to the recording and analysis of electrocardiograms, and the sounds of the heart. Written by Staff of ADInstruments Introduction The beating of the heart
Acquired, Drug-Induced Long QT Syndrome
 Acquired, Drug-Induced Long QT Syndrome A Guide for Patients and Health Care Providers Sudden Arrhythmia Death Syndromes (SADS) Foundation 508 E. South Temple, Suite 202 Salt Lake City, Utah 84102 800-STOP