Singular Spectrum Analysis with Rssa
|
|
|
- Isaac Horn
- 8 years ago
- Views:
Transcription
1 Singular Spectrum Analysis with Rssa Maurizio Sanarico Chief Data Scientist SDG Consulting Milano R June 4, 2014

2 Motivation Discover structural components in complex time series Working hypothesis: a signal is composed by trend (possibly multiple ones), oscillatory components (often more than one) and noise (white noise or colored noise) It works combining concepts and tools from classical time series analysis, multivariate statistics, multivariate geometry, dynamical systems and signal processing + statistics as a tools for inference

3 The basics: univariate case XN = (x1,..., xn ) : time series L (1 < L < N): window length construct L-lagged vectors Xi = (xi,..., xi+l 1) T, i =1, 2,..., K, where K = N L + 1 Form the trajectory matrix X from these vectors The eigen-analysis of the matrix XX T (equivalently, the SVD of the matrix X) yields a collection of L eigenvalues and eigenvectors A combination r of these eigenvectors determine an r-dimensional subspace L r in R L, r < L. The L-dimensional data {X 1,..., X K } is then projected onto the subspace Lr Averaging over the diagonals yields some Hankel matrix X* Time series ( x* 1,..., x* N ), in one-to-one correspondence with X* provides an approximation either the whole series X N or a particular component of X N.

4 Features of SSA Non-parametric and model-free Main assumption behind Basic SSA: time series can be represented as a sum of different components such as trend (which we define as any slowly varying series), modulated periodicities, and noise Interpretable components can be approximated by low-rank time series and described via Linear Recurrence Relations Obtaining such components helps interpretation and improve reliability of the analysis

5 Parameters in Basic SSA Window length: L Group indices: r Choice of such parameters can be derived by analysis of the results Automatic selection can also be done but it depends on the situations

6 Applications of SSA Forecasting Missing value imputation (gap-filling methods) Change-point detection Density estimation Multivariate time series analysis Image processing

7 Where has been applied Climatic, meteorological and geophysical time series Engineering Image processing Medicine Actuarial sciences Predictive maintenance Financial and econometric data

8 The Algorithm 1. Embedding: using the N-L+1 lagged vectors to form the trajectory matrix XX T 2. Singular value decomposition of the matrix obtained 3. Grouping the components (eigentriples) 4. Reconstruct the series by diagonal averaging (the better the closer components are to independence)
 4.")
9 Properties Discover automatically: Trends (one o multiple) Oscillatory components (multi-periodic or modulated periodicities) Residual Support natural forecasting methods: Linear recurrent or vector May be used as a pre-processing step for many other analyses: Forecasting Spectral density estimation of specific components Gap filling in time series

10 Some issues: Separability Separability of two time series X(1) and X(2) means the possibility of extracting X(1) from the observed sum X(1) + X(2) Time series components can be identified on the basis of the following principle: the form of an eigenvector replicates the form of the time series component that produces this eigenvector Graphs of eigenvectors can help in the process of identification A sinusoid generates, exactly or approximately, two sine wave components with the same frequency and the phase shift =2 Therefore, the scatterplot of a pair of eigenvectors, which produces a more or less regular T-vertex polygon, can help to identify a sinusoid of period T

11 Some issues: Separability Very helpful information for separation is contained in the so-called w-correlation matrix This is the matrix consisting of weighted correlations between the reconstructed time series components. The weights reflects the number of entries of the time series terms into its trajectory matrix Well-separated components have small correlation whereas badly separated components have large correlation Therefore, looking at the w-correlation matrix one can find groups of correlated elementary reconstructed series and use this information for the consequent grouping. One of the rules is not to include into different groups the correlated components.

12 Some issues: Choice of the Embedding The embedding L should be large enough (es., L = N/2) and if we want to extract a periodic component with known period, then the window lengths which are divisible by the period provide better separability If the time series has a complex structure, the so-called Sequential SSA is recommended. Sequential SSA consists of two stages, at the first stage the trend is extracted with small window length and then periodic components are detected and extracted from the residual with L=N/2

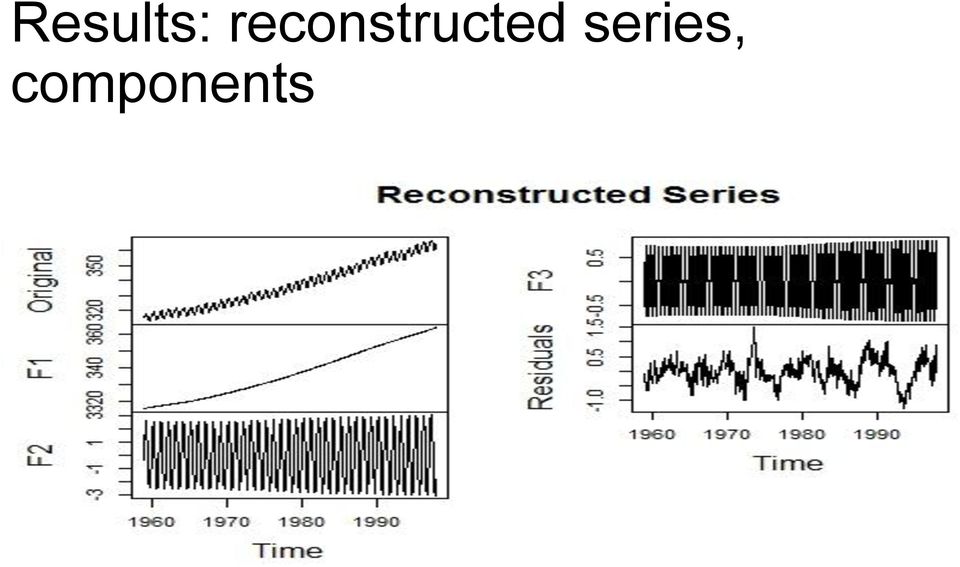
13 Rssa, SSA in R: first example library(rssa) # Decomposition stage s <- ssa(co2, L = 120) plot(s) plot(s,type="vector") plot(s,type="paired") plot(s,type="wcor") # Reconstruction stage # Grouping from looking at the W Cor matrix # The results are the reconstructed series r$f1, r$f2, and r$f3 recon <- reconstruct(s, groups = list(c(1,4), c(2, 3), c(5, 6))) # Calculate the residuals res <- residuals(recon) plot(recon, type = "cumsum") plot(wcor(s, groups = list(c(1,4), c(2,3), c(5, 6)))) plot(recon)
 plot(recon, type = \"cumsum\") plot(wcor(s, groups = list(c(1,4), c(2,3), c(5,")
14 Results
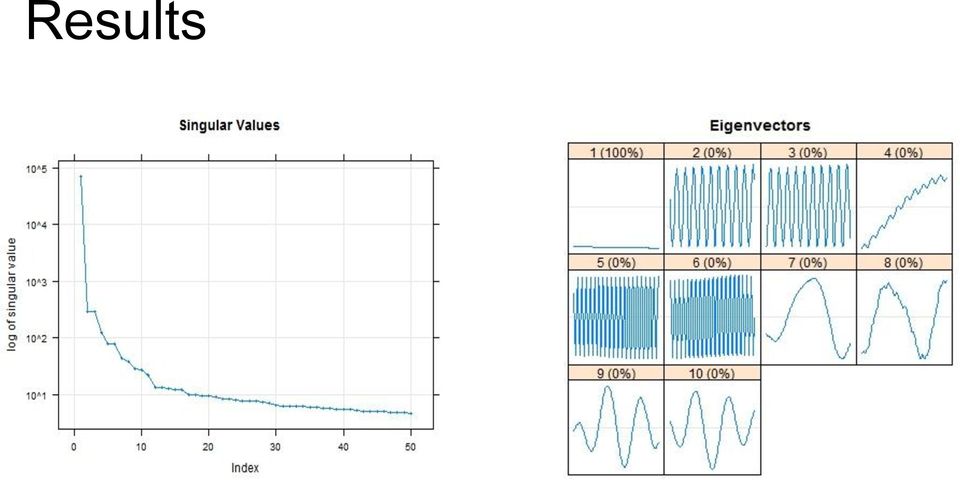
15 Results

16 Results: reconstructed series, cumulative view

17 Results: Wcor reconstructed series

18 Results: reconstructed series, components
19 Another grouping method # Alternative grouping, using cluster analysis on the eigen triples lst<-clusterify(s,group = 1:6, nclust=3) lst r <- reconstruct(s, groups = list(c(1), c(2, 3, 4), c(5, 6))) plot(wcor(s, groups = list(c(1), c(2,3, 4), c(5, 6)))) plot(r)
)) plot(wcor(s, groups = list(c(1), c(2,3, 4), c(5, 6))))")
20 Results

21 Comparison with wavelets Wavelets PROS Naturally multiscale CONS Choice of the basis Choice of boundary conditions (reflexive / periodic) Choice of the levels in the decomposition Depth of the wavelet decomposition Length of the testing window SSA PROS Single parameter (window length) Adaptive / data-driven basis (EOF=empirical orthogonal functions) CONS Not naturally multiscale (but can be adapted)
22 Another example: Power consumption data
23 Another example: ctd.
24 Another example: ctd.
25 Another example: ctd., cumulative view
26 Another example: ctd., component view
27 Forecasting: Co2 series s <- ssa(co2) f <- forecast(s, groups = list(1:6), method = "bootstrap-recurrent", len = 24, R = 10) # Plot the result including the last 24 points of the series plot(f, include = 24, shadecols = "green", type = "l")
28 Forecasting: the CO2 series
1 Example of Time Series Analysis by SSA 1
 1 Example of Time Series Analysis by SSA 1 Let us illustrate the 'Caterpillar'-SSA technique [1] by the example of time series analysis. Consider the time series FORT (monthly volumes of fortied wine sales
Possibilities of Automation of the Caterpillar -SSA Method for Time Series Analysis and Forecast. Th.Alexandrov, N.Golyandina
 Possibilities of Automation of the Caterpillar -SSA Method for Time Series Analysis and Forecast Th.Alexandrov, N.Golyandina theo@pdmi.ras.ru, nina@ng1174.spb.edu St.Petersburg State University, Russia
Nonlinear Iterative Partial Least Squares Method
 Numerical Methods for Determining Principal Component Analysis Abstract Factors Béchu, S., Richard-Plouet, M., Fernandez, V., Walton, J., and Fairley, N. (2016) Developments in numerical treatments for
CS 591.03 Introduction to Data Mining Instructor: Abdullah Mueen
 CS 591.03 Introduction to Data Mining Instructor: Abdullah Mueen LECTURE 3: DATA TRANSFORMATION AND DIMENSIONALITY REDUCTION Chapter 3: Data Preprocessing Data Preprocessing: An Overview Data Quality Major
Chapter 4: Vector Autoregressive Models
 Chapter 4: Vector Autoregressive Models 1 Contents: Lehrstuhl für Department Empirische of Wirtschaftsforschung Empirical Research and und Econometrics Ökonometrie IV.1 Vector Autoregressive Models (VAR)...
Manifold Learning Examples PCA, LLE and ISOMAP
 Manifold Learning Examples PCA, LLE and ISOMAP Dan Ventura October 14, 28 Abstract We try to give a helpful concrete example that demonstrates how to use PCA, LLE and Isomap, attempts to provide some intuition
Multivariate Analysis of Ecological Data
 Multivariate Analysis of Ecological Data MICHAEL GREENACRE Professor of Statistics at the Pompeu Fabra University in Barcelona, Spain RAUL PRIMICERIO Associate Professor of Ecology, Evolutionary Biology
Principal components analysis
 CS229 Lecture notes Andrew Ng Part XI Principal components analysis In our discussion of factor analysis, we gave a way to model data x R n as approximately lying in some k-dimension subspace, where k
AUTOMATION OF ENERGY DEMAND FORECASTING. Sanzad Siddique, B.S.
 AUTOMATION OF ENERGY DEMAND FORECASTING by Sanzad Siddique, B.S. A Thesis submitted to the Faculty of the Graduate School, Marquette University, in Partial Fulfillment of the Requirements for the Degree
Part 2: Community Detection
 Chapter 8: Graph Data Part 2: Community Detection Based on Leskovec, Rajaraman, Ullman 2014: Mining of Massive Datasets Big Data Management and Analytics Outline Community Detection - Social networks -
Linear Algebra Review. Vectors
 Linear Algebra Review By Tim K. Marks UCSD Borrows heavily from: Jana Kosecka kosecka@cs.gmu.edu http://cs.gmu.edu/~kosecka/cs682.html Virginia de Sa Cogsci 8F Linear Algebra review UCSD Vectors The length
BEHAVIOR BASED CREDIT CARD FRAUD DETECTION USING SUPPORT VECTOR MACHINES
 BEHAVIOR BASED CREDIT CARD FRAUD DETECTION USING SUPPORT VECTOR MACHINES 123 CHAPTER 7 BEHAVIOR BASED CREDIT CARD FRAUD DETECTION USING SUPPORT VECTOR MACHINES 7.1 Introduction Even though using SVM presents
Principle Component Analysis and Partial Least Squares: Two Dimension Reduction Techniques for Regression
 Principle Component Analysis and Partial Least Squares: Two Dimension Reduction Techniques for Regression Saikat Maitra and Jun Yan Abstract: Dimension reduction is one of the major tasks for multivariate
Review Jeopardy. Blue vs. Orange. Review Jeopardy
 Review Jeopardy Blue vs. Orange Review Jeopardy Jeopardy Round Lectures 0-3 Jeopardy Round $200 How could I measure how far apart (i.e. how different) two observations, y 1 and y 2, are from each other?
CHAPTER 2. Eigenvalue Problems (EVP s) for ODE s
 for ODE s") A SERIES OF CLASS NOTES FOR 005-006 TO INTRODUCE LINEAR AND NONLINEAR PROBLEMS TO ENGINEERS, SCIENTISTS, AND APPLIED MATHEMATICIANS DE CLASS NOTES 4 A COLLECTION OF HANDOUTS ON PARTIAL DIFFERENTIAL EQUATIONS
A SERIES OF CLASS NOTES FOR 005-006 TO INTRODUCE LINEAR AND NONLINEAR PROBLEMS TO ENGINEERS, SCIENTISTS, AND APPLIED MATHEMATICIANS DE CLASS NOTES 4 A COLLECTION OF HANDOUTS ON PARTIAL DIFFERENTIAL EQUATIONS
Introduction Epipolar Geometry Calibration Methods Further Readings. Stereo Camera Calibration
 Stereo Camera Calibration Stereo Camera Calibration Stereo Camera Calibration Stereo Camera Calibration 12.10.2004 Overview Introduction Summary / Motivation Depth Perception Ambiguity of Correspondence
Time Domain and Frequency Domain Techniques For Multi Shaker Time Waveform Replication
 Time Domain and Frequency Domain Techniques For Multi Shaker Time Waveform Replication Thomas Reilly Data Physics Corporation 1741 Technology Drive, Suite 260 San Jose, CA 95110 (408) 216-8440 This paper
3. Regression & Exponential Smoothing
 3. Regression & Exponential Smoothing 3.1 Forecasting a Single Time Series Two main approaches are traditionally used to model a single time series z 1, z 2,..., z n 1. Models the observation z t as a
DATA ANALYSIS II. Matrix Algorithms
 DATA ANALYSIS II Matrix Algorithms Similarity Matrix Given a dataset D = {x i }, i=1,..,n consisting of n points in R d, let A denote the n n symmetric similarity matrix between the points, given as where
Performance Evaluation. Trend forecasting based on Singular Spectrum Analysis of traffic workload in a large-scale wireless LAN
 Performance Evaluation 66 (2009) 173 190 Contents lists available at ScienceDirect Performance Evaluation journal homepage: www.elsevier.com/locate/peva Trend forecasting based on Singular Spectrum Analysis
Visualizing Data. Contents. 1 Visualizing Data. Anthony Tanbakuchi Department of Mathematics Pima Community College. Introductory Statistics Lectures
 Introductory Statistics Lectures Visualizing Data Descriptive Statistics I Department of Mathematics Pima Community College Redistribution of this material is prohibited without written permission of the
4. Matrix Methods for Analysis of Structure in Data Sets:
 ATM 552 Notes: Matrix Methods: EOF, SVD, ETC. D.L.Hartmann Page 64 4. Matrix Methods for Analysis of Structure in Data Sets: Empirical Orthogonal Functions, Principal Component Analysis, Singular Value
Multivariate normal distribution and testing for means (see MKB Ch 3)
") Multivariate normal distribution and testing for means (see MKB Ch 3) Where are we going? 2 One-sample t-test (univariate).................................................. 3 Two-sample t-test (univariate).................................................
Multivariate normal distribution and testing for means (see MKB Ch 3) Where are we going? 2 One-sample t-test (univariate).................................................. 3 Two-sample t-test (univariate).................................................
Going Big in Data Dimensionality:
 LUDWIG- MAXIMILIANS- UNIVERSITY MUNICH DEPARTMENT INSTITUTE FOR INFORMATICS DATABASE Going Big in Data Dimensionality: Challenges and Solutions for Mining High Dimensional Data Peer Kröger Lehrstuhl für
Forecasting Financial Time Series
 Canberra, February, 2007 Contents Introduction 1 Introduction : Problems and Approaches 2 3 : Problems and Approaches : Problems and Approaches Time series: (Relative) returns r t = p t p t 1 p t 1, t
Lecture 8: Signal Detection and Noise Assumption
 ECE 83 Fall Statistical Signal Processing instructor: R. Nowak, scribe: Feng Ju Lecture 8: Signal Detection and Noise Assumption Signal Detection : X = W H : X = S + W where W N(, σ I n n and S = [s, s,...,
Supervised Feature Selection & Unsupervised Dimensionality Reduction
 Supervised Feature Selection & Unsupervised Dimensionality Reduction Feature Subset Selection Supervised: class labels are given Select a subset of the problem features Why? Redundant features much or
NONLINEAR TIME SERIES ANALYSIS
 NONLINEAR TIME SERIES ANALYSIS HOLGER KANTZ AND THOMAS SCHREIBER Max Planck Institute for the Physics of Complex Sy stems, Dresden I CAMBRIDGE UNIVERSITY PRESS Preface to the first edition pug e xi Preface
Principal Component Analysis
 Principal Component Analysis ERS70D George Fernandez INTRODUCTION Analysis of multivariate data plays a key role in data analysis. Multivariate data consists of many different attributes or variables recorded
Mean value theorem, Taylors Theorem, Maxima and Minima.
 MA 001 Preparatory Mathematics I. Complex numbers as ordered pairs. Argand s diagram. Triangle inequality. De Moivre s Theorem. Algebra: Quadratic equations and express-ions. Permutations and Combinations.
Subspace Analysis and Optimization for AAM Based Face Alignment
 Subspace Analysis and Optimization for AAM Based Face Alignment Ming Zhao Chun Chen College of Computer Science Zhejiang University Hangzhou, 310027, P.R.China zhaoming1999@zju.edu.cn Stan Z. Li Microsoft
USING SPECTRAL RADIUS RATIO FOR NODE DEGREE TO ANALYZE THE EVOLUTION OF SCALE- FREE NETWORKS AND SMALL-WORLD NETWORKS
 USING SPECTRAL RADIUS RATIO FOR NODE DEGREE TO ANALYZE THE EVOLUTION OF SCALE- FREE NETWORKS AND SMALL-WORLD NETWORKS Natarajan Meghanathan Jackson State University, 1400 Lynch St, Jackson, MS, USA natarajan.meghanathan@jsums.edu
Lecture 2: Descriptive Statistics and Exploratory Data Analysis
 Lecture 2: Descriptive Statistics and Exploratory Data Analysis Further Thoughts on Experimental Design 16 Individuals (8 each from two populations) with replicates Pop 1 Pop 2 Randomly sample 4 individuals
Comparison of Non-linear Dimensionality Reduction Techniques for Classification with Gene Expression Microarray Data
 CMPE 59H Comparison of Non-linear Dimensionality Reduction Techniques for Classification with Gene Expression Microarray Data Term Project Report Fatma Güney, Kübra Kalkan 1/15/2013 Keywords: Non-linear
Teaching Multivariate Analysis to Business-Major Students
 Teaching Multivariate Analysis to Business-Major Students Wing-Keung Wong and Teck-Wong Soon - Kent Ridge, Singapore 1. Introduction During the last two or three decades, multivariate statistical analysis
USE OF EIGENVALUES AND EIGENVECTORS TO ANALYZE BIPARTIVITY OF NETWORK GRAPHS
 USE OF EIGENVALUES AND EIGENVECTORS TO ANALYZE BIPARTIVITY OF NETWORK GRAPHS Natarajan Meghanathan Jackson State University, 1400 Lynch St, Jackson, MS, USA natarajan.meghanathan@jsums.edu ABSTRACT This
SINGULAR SPECTRUM ANALYSIS HYBRID FORECASTING METHODS WITH APPLICATION TO AIR TRANSPORT DEMAND
 SINGULAR SPECTRUM ANALYSIS HYBRID FORECASTING METHODS WITH APPLICATION TO AIR TRANSPORT DEMAND K. Adjenughwure, Delft University of Technology, Transport Institute, Ph.D. candidate V. Balopoulos, Democritus
1 2 3 1 1 2 x = + x 2 + x 4 1 0 1
 (d) If the vector b is the sum of the four columns of A, write down the complete solution to Ax = b. 1 2 3 1 1 2 x = + x 2 + x 4 1 0 0 1 0 1 2. (11 points) This problem finds the curve y = C + D 2 t which
2.2 Elimination of Trend and Seasonality
 26 CHAPTER 2. TREND AND SEASONAL COMPONENTS 2.2 Elimination of Trend and Seasonality Here we assume that the TS model is additive and there exist both trend and seasonal components, that is X t = m t +
Structural Health Monitoring Tools (SHMTools)
") Structural Health Monitoring Tools (SHMTools) Parameter Specifications LANL/UCSD Engineering Institute LA-CC-14-046 c Copyright 2014, Los Alamos National Security, LLC All rights reserved. May 30, 2014
Structural Health Monitoring Tools (SHMTools) Parameter Specifications LANL/UCSD Engineering Institute LA-CC-14-046 c Copyright 2014, Los Alamos National Security, LLC All rights reserved. May 30, 2014
Orthogonal Diagonalization of Symmetric Matrices
 MATH10212 Linear Algebra Brief lecture notes 57 Gram Schmidt Process enables us to find an orthogonal basis of a subspace. Let u 1,..., u k be a basis of a subspace V of R n. We begin the process of finding
Why Taking This Course? Course Introduction, Descriptive Statistics and Data Visualization. Learning Goals. GENOME 560, Spring 2012
 Why Taking This Course? Course Introduction, Descriptive Statistics and Data Visualization GENOME 560, Spring 2012 Data are interesting because they help us understand the world Genomics: Massive Amounts
P164 Tomographic Velocity Model Building Using Iterative Eigendecomposition
 P164 Tomographic Velocity Model Building Using Iterative Eigendecomposition K. Osypov* (WesternGeco), D. Nichols (WesternGeco), M. Woodward (WesternGeco) & C.E. Yarman (WesternGeco) SUMMARY Tomographic
Machine Learning in Statistical Arbitrage
 Machine Learning in Statistical Arbitrage Xing Fu, Avinash Patra December 11, 2009 Abstract We apply machine learning methods to obtain an index arbitrage strategy. In particular, we employ linear regression
4 MT210 Notebook 4 3. 4.1 Eigenvalues and Eigenvectors... 3. 4.1.1 Definitions; Graphical Illustrations... 3
 MT Notebook Fall / prepared by Professor Jenny Baglivo c Copyright 9 by Jenny A. Baglivo. All Rights Reserved. Contents MT Notebook. Eigenvalues and Eigenvectors................................... Definitions;
Principal Component Analysis
 Principal Component Analysis Principle Component Analysis: A statistical technique used to examine the interrelations among a set of variables in order to identify the underlying structure of those variables.
A New Method for Dimensionality Reduction using K- Means Clustering Algorithm for High Dimensional Data Set
 A New Method for Dimensionality Reduction using K- Means Clustering Algorithm for High Dimensional Data Set D.Napoleon Assistant Professor Department of Computer Science Bharathiar University Coimbatore
Structural Analysis of Network Traffic Flows Eric Kolaczyk
 Structural Analysis of Network Traffic Flows Eric Kolaczyk Anukool Lakhina, Dina Papagiannaki, Mark Crovella, Christophe Diot, and Nina Taft Traditional Network Traffic Analysis Focus on Short stationary
Performance of Dynamic Load Balancing Algorithms for Unstructured Mesh Calculations
 Performance of Dynamic Load Balancing Algorithms for Unstructured Mesh Calculations Roy D. Williams, 1990 Presented by Chris Eldred Outline Summary Finite Element Solver Load Balancing Results Types Conclusions
Mehtap Ergüven Abstract of Ph.D. Dissertation for the degree of PhD of Engineering in Informatics
 INTERNATIONAL BLACK SEA UNIVERSITY COMPUTER TECHNOLOGIES AND ENGINEERING FACULTY ELABORATION OF AN ALGORITHM OF DETECTING TESTS DIMENSIONALITY Mehtap Ergüven Abstract of Ph.D. Dissertation for the degree
Mathematics (MAT) MAT 061 Basic Euclidean Geometry 3 Hours. MAT 051 Pre-Algebra 4 Hours
 MAT 061 Basic Euclidean Geometry 3 Hours. MAT 051 Pre-Algebra 4 Hours") MAT 051 Pre-Algebra Mathematics (MAT) MAT 051 is designed as a review of the basic operations of arithmetic and an introduction to algebra. The student must earn a grade of C or in order to enroll in MAT
MAT 051 Pre-Algebra Mathematics (MAT) MAT 051 is designed as a review of the basic operations of arithmetic and an introduction to algebra. The student must earn a grade of C or in order to enroll in MAT
CS 5614: (Big) Data Management Systems. B. Aditya Prakash Lecture #18: Dimensionality Reduc7on
 Data Management Systems. B. Aditya Prakash Lecture #18: Dimensionality Reduc7on") CS 5614: (Big) Data Management Systems B. Aditya Prakash Lecture #18: Dimensionality Reduc7on Dimensionality Reduc=on Assump=on: Data lies on or near a low d- dimensional subspace Axes of this subspace
CS 5614: (Big) Data Management Systems B. Aditya Prakash Lecture #18: Dimensionality Reduc7on Dimensionality Reduc=on Assump=on: Data lies on or near a low d- dimensional subspace Axes of this subspace
Exploratory Data Analysis with MATLAB
 Computer Science and Data Analysis Series Exploratory Data Analysis with MATLAB Second Edition Wendy L Martinez Angel R. Martinez Jeffrey L. Solka ( r ec) CRC Press VV J Taylor & Francis Group Boca Raton
Data, Measurements, Features
 Data, Measurements, Features Middle East Technical University Dep. of Computer Engineering 2009 compiled by V. Atalay What do you think of when someone says Data? We might abstract the idea that data are
Global Seasonal Phase Lag between Solar Heating and Surface Temperature
 Global Seasonal Phase Lag between Solar Heating and Surface Temperature Summer REU Program Professor Tom Witten By Abstract There is a seasonal phase lag between solar heating from the sun and the surface
Factor analysis. Angela Montanari
 Factor analysis Angela Montanari 1 Introduction Factor analysis is a statistical model that allows to explain the correlations between a large number of observed correlated variables through a small number
Introduction to Principal Components and FactorAnalysis
 Introduction to Principal Components and FactorAnalysis Multivariate Analysis often starts out with data involving a substantial number of correlated variables. Principal Component Analysis (PCA) is a
by the matrix A results in a vector which is a reflection of the given
 Eigenvalues & Eigenvectors Example Suppose Then So, geometrically, multiplying a vector in by the matrix A results in a vector which is a reflection of the given vector about the y-axis We observe that
Tutorial on Exploratory Data Analysis
 Tutorial on Exploratory Data Analysis Julie Josse, François Husson, Sébastien Lê julie.josse at agrocampus-ouest.fr francois.husson at agrocampus-ouest.fr Applied Mathematics Department, Agrocampus Ouest
Generalized association plots (GAP): Dimension free information visualization environment for multivariate data structure
: Dimension free information visualization environment for multivariate data structure") Generalized association plots (GAP): Dimension free information visualization environment for multivariate data structure Chun-houh Chen, hun-chuan Chang, Yueh-Yun Chi, and Chih-Wen Ou-Young Academia inica,
Generalized association plots (GAP): Dimension free information visualization environment for multivariate data structure Chun-houh Chen, hun-chuan Chang, Yueh-Yun Chi, and Chih-Wen Ou-Young Academia inica,
Partial Least Squares (PLS) Regression.
 Regression.") Partial Least Squares (PLS) Regression. Hervé Abdi 1 The University of Texas at Dallas Introduction Pls regression is a recent technique that generalizes and combines features from principal component
Partial Least Squares (PLS) Regression. Hervé Abdi 1 The University of Texas at Dallas Introduction Pls regression is a recent technique that generalizes and combines features from principal component
So which is the best?
 Manifold Learning Techniques: So which is the best? Todd Wittman Math 8600: Geometric Data Analysis Instructor: Gilad Lerman Spring 2005 Note: This presentation does not contain information on LTSA, which
SIGNAL PROCESSING & SIMULATION NEWSLETTER
 1 of 10 1/25/2008 3:38 AM SIGNAL PROCESSING & SIMULATION NEWSLETTER Note: This is not a particularly interesting topic for anyone other than those who ar e involved in simulation. So if you have difficulty
An Introduction to Partial Least Squares Regression
 An Introduction to Partial Least Squares Regression Randall D. Tobias, SAS Institute Inc., Cary, NC Abstract Partial least squares is a popular method for soft modelling in industrial applications. This
SF2940: Probability theory Lecture 8: Multivariate Normal Distribution
 SF2940: Probability theory Lecture 8: Multivariate Normal Distribution Timo Koski 24.09.2015 Timo Koski Matematisk statistik 24.09.2015 1 / 1 Learning outcomes Random vectors, mean vector, covariance matrix,
Summary Nonstationary Time Series Multitude of Representations Possibilities from Applied Computational Harmonic Analysis Tests of Stationarity
 Nonstationary Time Series, Priestley s Evolutionary Spectra and Wavelets Guy Nason, School of Mathematics, University of Bristol Summary Nonstationary Time Series Multitude of Representations Possibilities
Chapter 6: Multivariate Cointegration Analysis
 Chapter 6: Multivariate Cointegration Analysis 1 Contents: Lehrstuhl für Department Empirische of Wirtschaftsforschung Empirical Research and und Econometrics Ökonometrie VI. Multivariate Cointegration
Software Review: ITSM 2000 Professional Version 6.0.
 Lee, J. & Strazicich, M.C. (2002). Software Review: ITSM 2000 Professional Version 6.0. International Journal of Forecasting, 18(3): 455-459 (June 2002). Published by Elsevier (ISSN: 0169-2070). http://0-
APPM4720/5720: Fast algorithms for big data. Gunnar Martinsson The University of Colorado at Boulder
 APPM4720/5720: Fast algorithms for big data Gunnar Martinsson The University of Colorado at Boulder Course objectives: The purpose of this course is to teach efficient algorithms for processing very large
Factor Analysis. Chapter 420. Introduction
 Chapter 420 Introduction (FA) is an exploratory technique applied to a set of observed variables that seeks to find underlying factors (subsets of variables) from which the observed variables were generated.
Java Modules for Time Series Analysis
 Java Modules for Time Series Analysis Agenda Clustering Non-normal distributions Multifactor modeling Implied ratings Time series prediction 1. Clustering + Cluster 1 Synthetic Clustering + Time series
Detection of changes in variance using binary segmentation and optimal partitioning
 Detection of changes in variance using binary segmentation and optimal partitioning Christian Rohrbeck Abstract This work explores the performance of binary segmentation and optimal partitioning in the
The Method of Least Squares
 Hervé Abdi 1 1 Introduction The least square methods (LSM) is probably the most popular technique in statistics. This is due to several factors. First, most common estimators can be casted within this
Institute of Actuaries of India Subject CT3 Probability and Mathematical Statistics
 Institute of Actuaries of India Subject CT3 Probability and Mathematical Statistics For 2015 Examinations Aim The aim of the Probability and Mathematical Statistics subject is to provide a grounding in
7 Time series analysis
 7 Time series analysis In Chapters 16, 17, 33 36 in Zuur, Ieno and Smith (2007), various time series techniques are discussed. Applying these methods in Brodgar is straightforward, and most choices are
Time Series Analysis and Forecasting Methods for Temporal Mining of Interlinked Documents
 Time Series Analysis and Forecasting Methods for Temporal Mining of Interlinked Documents Prasanna Desikan and Jaideep Srivastava Department of Computer Science University of Minnesota. @cs.umn.edu
Factor Analysis. Principal components factor analysis. Use of extracted factors in multivariate dependency models
 Factor Analysis Principal components factor analysis Use of extracted factors in multivariate dependency models 2 KEY CONCEPTS ***** Factor Analysis Interdependency technique Assumptions of factor analysis
Lecture Topic: Low-Rank Approximations
 Lecture Topic: Low-Rank Approximations Low-Rank Approximations We have seen principal component analysis. The extraction of the first principle eigenvalue could be seen as an approximation of the original
Predict the Popularity of YouTube Videos Using Early View Data
 000 001 002 003 004 005 006 007 008 009 010 011 012 013 014 015 016 017 018 019 020 021 022 023 024 025 026 027 028 029 030 031 032 033 034 035 036 037 038 039 040 041 042 043 044 045 046 047 048 049 050
Univariate and Multivariate Methods PEARSON. Addison Wesley
 Time Series Analysis Univariate and Multivariate Methods SECOND EDITION William W. S. Wei Department of Statistics The Fox School of Business and Management Temple University PEARSON Addison Wesley Boston
The Image Deblurring Problem
 page 1 Chapter 1 The Image Deblurring Problem You cannot depend on your eyes when your imagination is out of focus. Mark Twain When we use a camera, we want the recorded image to be a faithful representation
Dynamic Modeling, Predictive Control and Performance Monitoring
 Biao Huang, Ramesh Kadali Dynamic Modeling, Predictive Control and Performance Monitoring A Data-driven Subspace Approach 4y Spri nnger g< Contents Notation XIX 1 Introduction 1 1.1 An Overview of This
Detecting Network Anomalies. Anant Shah
 Detecting Network Anomalies using Traffic Modeling Anant Shah Anomaly Detection Anomalies are deviations from established behavior In most cases anomalies are indications of problems The science of extracting
Multidimensional data and factorial methods
 Multidimensional data and factorial methods Bidimensional data x 5 4 3 4 X 3 6 X 3 5 4 3 3 3 4 5 6 x Cartesian plane Multidimensional data n X x x x n X x x x n X m x m x m x nm Factorial plane Interpretation
Netzcope - A Tool to Display and Analyze Complex Networks
 NEMO Working Paper #16 Netzcope - A Tool to Display and Analyze Complex Networks Oleg Strogan and Ludwig Streit (CCM, University of Madeira) Supported by the EU FP6-NEST-Adventure Programme Contract n
Data Exploration and Preprocessing. Data Mining and Text Mining (UIC 583 @ Politecnico di Milano)
") Data Exploration and Preprocessing Data Mining and Text Mining (UIC 583 @ Politecnico di Milano) References Jiawei Han and Micheline Kamber, "Data Mining: Concepts and Techniques", The Morgan Kaufmann
Data Exploration and Preprocessing Data Mining and Text Mining (UIC 583 @ Politecnico di Milano) References Jiawei Han and Micheline Kamber, "Data Mining: Concepts and Techniques", The Morgan Kaufmann
IEEE TRANSACTIONS ON POWER SYSTEMS, VOL. 23, NO. 3, AUGUST 2008 877
 IEEE TRANSACTIONS ON POWER SYSTEMS, VOL. 23, NO. 3, AUGUST 2008 877 Electricity Price Curve Modeling and Forecasting by Manifold Learning Jie Chen, Student Member, IEEE, Shi-Jie Deng, Senior Member, IEEE,
Wavelet analysis. Wavelet requirements. Example signals. Stationary signal 2 Hz + 10 Hz + 20Hz. Zero mean, oscillatory (wave) Fast decay (let)
 Fast decay (let)") Wavelet analysis In the case of Fourier series, the orthonormal basis is generated by integral dilation of a single function e jx Every 2π-periodic square-integrable function is generated by a superposition
Wavelet analysis In the case of Fourier series, the orthonormal basis is generated by integral dilation of a single function e jx Every 2π-periodic square-integrable function is generated by a superposition
A Trading Strategy Based on the Lead-Lag Relationship of Spot and Futures Prices of the S&P 500
 A Trading Strategy Based on the Lead-Lag Relationship of Spot and Futures Prices of the S&P 500 FE8827 Quantitative Trading Strategies 2010/11 Mini-Term 5 Nanyang Technological University Submitted By:
Overview of Violations of the Basic Assumptions in the Classical Normal Linear Regression Model
 Overview of Violations of the Basic Assumptions in the Classical Normal Linear Regression Model 1 September 004 A. Introduction and assumptions The classical normal linear regression model can be written
Solutions to Exam in Speech Signal Processing EN2300
 Solutions to Exam in Speech Signal Processing EN23 Date: Thursday, Dec 2, 8: 3: Place: Allowed: Grades: Language: Solutions: Q34, Q36 Beta Math Handbook (or corresponding), calculator with empty memory.
Applied Linear Algebra I Review page 1
 Applied Linear Algebra Review 1 I. Determinants A. Definition of a determinant 1. Using sum a. Permutations i. Sign of a permutation ii. Cycle 2. Uniqueness of the determinant function in terms of properties
Least-Squares Intersection of Lines
 Least-Squares Intersection of Lines Johannes Traa - UIUC 2013 This write-up derives the least-squares solution for the intersection of lines. In the general case, a set of lines will not intersect at a
Analysis of Internet Topologies: A Historical View
 Analysis of Internet Topologies: A Historical View Mohamadreza Najiminaini, Laxmi Subedi, and Ljiljana Trajković Communication Networks Laboratory http://www.ensc.sfu.ca/cnl Simon Fraser University Vancouver,
ANALYTICS IN BIG DATA ERA
 ANALYTICS IN BIG DATA ERA ANALYTICS TECHNOLOGY AND ARCHITECTURE TO MANAGE VELOCITY AND VARIETY, DISCOVER RELATIONSHIPS AND CLASSIFY HUGE AMOUNT OF DATA MAURIZIO SALUSTI SAS Copyr i g ht 2012, SAS Ins titut
An Interactive Tool for Residual Diagnostics for Fitting Spatial Dependencies (with Implementation in R)
") DSC 2003 Working Papers (Draft Versions) http://www.ci.tuwien.ac.at/conferences/dsc-2003/ An Interactive Tool for Residual Diagnostics for Fitting Spatial Dependencies (with Implementation in R) Ernst
DSC 2003 Working Papers (Draft Versions) http://www.ci.tuwien.ac.at/conferences/dsc-2003/ An Interactive Tool for Residual Diagnostics for Fitting Spatial Dependencies (with Implementation in R) Ernst
How To Use Neural Networks In Data Mining
 International Journal of Electronics and Computer Science Engineering 1449 Available Online at www.ijecse.org ISSN- 2277-1956 Neural Networks in Data Mining Priyanka Gaur Department of Information and
Lecture 5: Singular Value Decomposition SVD (1)
") EEM3L1: Numerical and Analytical Techniques Lecture 5: Singular Value Decomposition SVD (1) EE3L1, slide 1, Version 4: 25-Sep-02 Motivation for SVD (1) SVD = Singular Value Decomposition Consider the system
EEM3L1: Numerical and Analytical Techniques Lecture 5: Singular Value Decomposition SVD (1) EE3L1, slide 1, Version 4: 25-Sep-02 Motivation for SVD (1) SVD = Singular Value Decomposition Consider the system
Chapter 1. Vector autoregressions. 1.1 VARs and the identi cation problem
 Chapter Vector autoregressions We begin by taking a look at the data of macroeconomics. A way to summarize the dynamics of macroeconomic data is to make use of vector autoregressions. VAR models have become
CONTENTS PREFACE 1 INTRODUCTION 1 2 DATA VISUALIZATION 19
 PREFACE xi 1 INTRODUCTION 1 1.1 Overview 1 1.2 Definition 1 1.3 Preparation 2 1.3.1 Overview 2 1.3.2 Accessing Tabular Data 3 1.3.3 Accessing Unstructured Data 3 1.3.4 Understanding the Variables and Observations