1.1 What is Statistics?
|
|
|
- Roy King
- 10 years ago
- Views:
Transcription
1 1.1 What is Statistics? (Page 1 of 15) 1.1 What is Statistics? Definition of Statistics Statistics is the study of how to collect, organize, analyze, and interpret numerical information from data. Descriptive statistics involves methods of organizing, picturing and summarizing information from data. Inferential statistics involves methods of using information from a sample to draw conclusions about the population. Keep in Mind: * Statistical inferences are no more accurate than the data they are based on (weakest link). * Statistical results should be interpreted by one who understands the methods used as well as the subject matter. Individuals and Variables Individuals are the people or objects included in the study. A variable is the characteristic of the individual to be measured or observed. For example, if we want to do a study about the people who have climbed Mt. Everest, then the individuals in the study are the actual people who made it to the top. The variables to measure or observe might be the height, weight, race, gender, income, etc of the individuals that made it to the top of Mt. Everest. Variables: Quantitative vs. Qualitative A quantitative variable has a value or numerical measurement for which operations such as addition or averaging make sense. A qualitative variable describes and individual by placing the individual into a category or group such as male or female.
.")
2 1.1 What is Statistics? (Page 2 of 15) Example A State whether the data is qualitative or quantitative. 1. The color of a person s eye. 2. The height of a person in inches. 3. The a/b/c/d responses on a questionnaire. Population Data and Sample Data In population data, the variable is from every individual of interest. In sample data the variable is only from some of the individuals of interest. Guided Exercise 1 Television station QUE wants to know the proportion of TV owners in Virginia who watch the stations new program at least once a week. The station asked a group of 1000 TV owners in Virginia if they watch the program at least once a week. a. Identify the individuals in the study. b. Identify the variable. c. Do the data comprise a sample? If so, what is the underlying population? Yes. The implied population is the responses (watch/not watch) of all TV owners in Virginia. d. Is the variable quantitative or qualitative? e. Identify a quantitative variable that might of interest.

3 1.1 What is Statistics? (Page 3 of 15) Example 1 Suppose the Hawaii Department of Agriculture wishes to conduct a study of pineapples in an experimental field. a. What are the individuals in the study? b. What are some possible quantitative variables of interest? The weight of each pineapple in the experimental field. The maximum girth of each pineapple in the experimental field. c. What are some possible qualitative variables of interest? The taste [color] of every pineapple in the field.

4 1.1 What is Statistics? (Page 4 of 15) Levels of Measurement 1. Nominal Level (in name only): Qualities with no ranking/ordering; no numerical or quantitative value. Data consists of names, labels and categories. a. Taos, Acoma, Zuni and Cochiti are names of four native American pueblos. b. Car colors for a certain model are: red, silver, blue and black. 2. Ordinal Level: Can be arranged in some order, but the differences between the data values are meaningless. a. Of 17 fishing reels rated: 6 were rated good quality, 4 were rated better quality, and 7 were rated best quality. b. Out of a high school class of 319, Walter ranked 4th, June ranked 12th, and Jim ranked 20th. 3. Interval Level: Data values can be ranked and the differences between data values are meaningful. However, there is no intrinsic zero, or starting point, and the ratio of data values are meaningless. Note: Calendar dates and Celsius & Fahrenheit temperature readings have no meaningful zero and ratios are meaningless. a. The years in which democrats won presidential elections. b. Body temperature in degrees Celsius (or Fahrenheit) of trout swimming in the North River. c. Building A was built in 1284, Building B in 1492 and Building C in 5 bce. 4. Ratio Level: Similar to interval, except there is a true zero, or starting point, and the ratios of data values have meaning. a. Core temperature of stars measured in degrees Kelvin. b. Time elapsed between the deposit of a check and the clearance of that check. c. Length of trout in the North River.

5 1.1 What is Statistics? (Page 5 of 15) Levels of Measurement 1. Nominal Level (in name only): Qualities with no ranking/ordering; no numerical or quantitative value. 2. Ordinal Level: Can be arranged in some numerical order, but the differences between the data values are meaningless. 3. Interval Level: Data values can be ranked and the differences between data values are meaningful. However, there is no intrinsic zero, or starting point, and the ratio of data values are meaningless. 4. Ratio Level: Similar to interval, except there is an inherent zero, or starting point, and the ratios of data values have meaning. Guided Exercise 2 State the level of measurement for each of the following: a. The senator s name is Sam Wilson. b. The senator is 58 years old. c. The senator was elected in 1963, 1969, 1981, and d. His taxable income is $278, e. Of 1100 voters in his district: 400 strongly favor his bill; 300 favor; 200 neutral; 150 do not favor, and 50 strongly do not favor his bill. f. The senator is married. g. The senator had divorces in 1965 and h. A newspaper ranked the senator 7th for his voting record on public education.

6 1.2 Random Samples (Page 6 of 15) 1.2 Random Samples Simple Random Sample A simple random sample of n measurements from a population is one selected in such a manner that 1. every sample of size n from the population has equal probability of being selected, and 2. every member of the population has equal probability of being included in the sample. Example C Consider the population of all coyotes in the western U.S. The sample of that population that ranchers observe is largely the coyotes that prefer to live near a ranch; they also like to eat lamb. The ranchers concluded that all coyotes are dangerous and got the government to assist in distributing a poison bait to reduce the overall coyote population. The overall population of coyotes was reduced, but the ranchers still lost almost as many sheep as before. Why? a. Is the sample the ranchers observed a random sample? b. If not, is it safe to use the results to describe the entire population? c. Is the idea of reducing the size of the entire population justified based on the ranchers experience? Note: Further study has shown that coyotes who eat sheep are consistent in their preference for sheep, whereas the majority of coyotes in the wild stick to foods found in the wild.

7 1.2 Random Samples (Page 7 of 15) Example D Do the following procedures give a random sample for the entire population of New York City? Why / Why not? a. Select every third woman entering a beauty shop. b. Select every third person coming out of a boxing match at Madison Square Garden. Example 6: Random Number Table To determine if the latest shipment of 500 Toyotas meets emission standards, a random sample of 30 is chosen and tested. How can you make sure the sample of 30 chosen is a random sample? See the random number table in Appendix II, page A Simulation A simulation is a numerical facsimile or representation of a realworld phenomenon. Random Number Generator on the TI MATH / PRB / 1:rand 2. MATH / PRB / 5:randInt(min, max, number of integers)

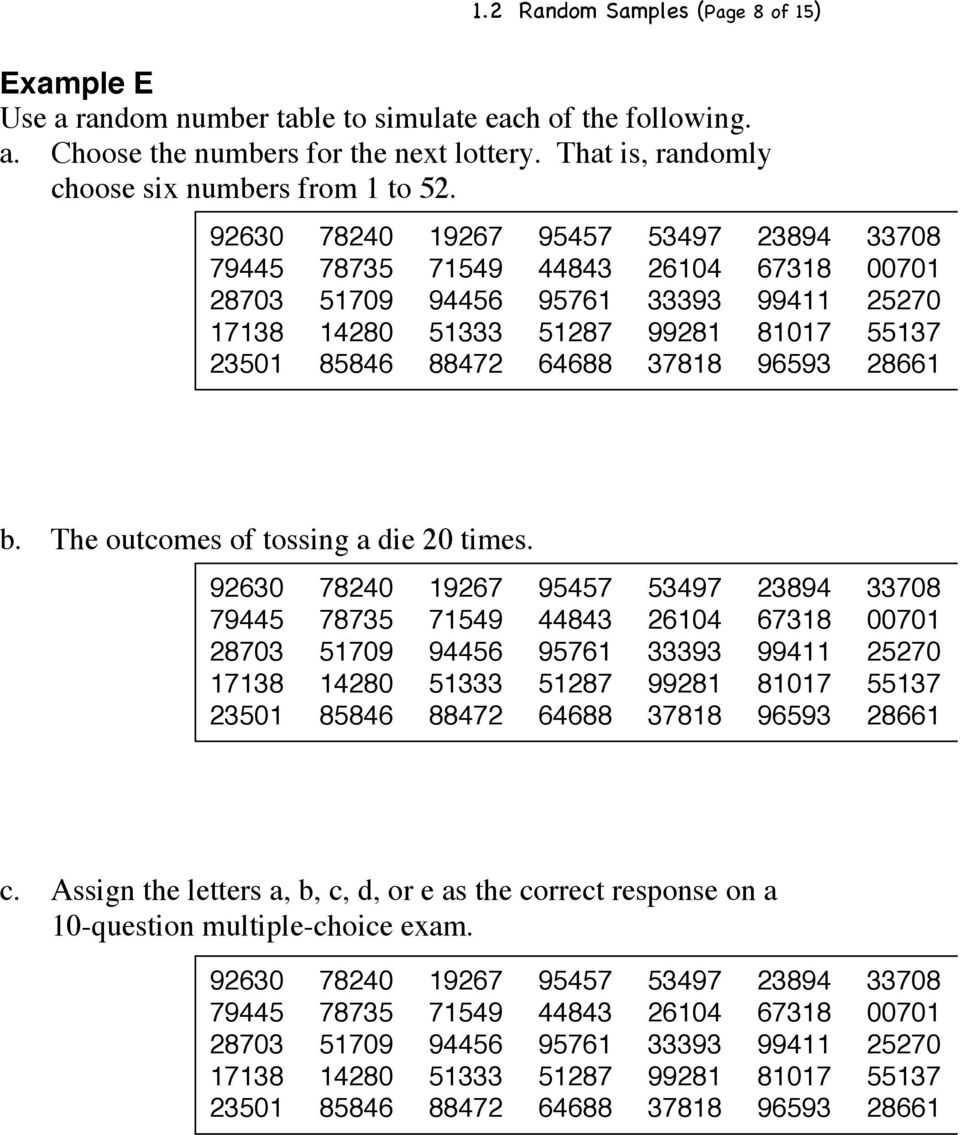
8 1.2 Random Samples (Page 8 of 15) Example E Use a random number table to simulate each of the following. a. Choose the numbers for the next lottery. That is, randomly choose six numbers from 1 to b. The outcomes of tossing a die 20 times c. Assign the letters a, b, c, d, or e as the correct response on a 10-question multiple-choice exam
9 1.2 Random Samples (Page 9 of 15) Other Sampling Techniques 1. Stratified Sampling Stratify (divide) the population by a common characteristic (such as age, class, gender, etc.) and take a random sample of each stratum [often in accordance to their percent of the population]. e.g. divide the population by race and survey a number of randomly selected individuals from each race (often in the same proportion they occur in the overall population). 2. Systematic Sampling Used when the elements of the population are arranged in a natural sequential order. e.g. take every 5th person coming through a cafeteria line. 3. Cluster Sampling Used extensively by government and research organizations. Randomly select a sample of pre-existing sections or clusters (often geographic sections). Every member of the cluster is included in the sample/survey. e.g. randomly select 30 schools and survey every student in each school. 4. Convenience Sampling Uses data that are conveniently and readily obtained. e.g. walk outside and survey the first 100 people that will talk to you.

10 1.3 Experimental Design (Page 10 of 15) 1.3 Experimental Design Basic guidelines for planning a statistical study 1. Identify the individuals or objects of interest. 2. Specify the variables to measure or observe. 3. Determine if you will use the population or a representative sample. Decides on a viable sampling method. 4. Collect the data. 5. Use the appropriate descriptive statistics methods (Chapters 2, 3 and 10) and make decisions using the appropriate inferential statistics methods (Chapters 8-12). 6. Note any concern you might have about your data collection methods and list any recommendations for future studies. Ways to Produce Data 1. Census: Measurements or observations of the entire population. 2. Sampling: Measurements or observations from a representative part of the population i.e. simple random sample. 3. Simulation: Numerical modeling of real-world phenomena. 2. Experiment: Impose a treatment and measure/observe the change in the variable of interest. 3. Observational Study: Observations and measurements are made in a way that does not change the response or the variable being measured.

11 1.3 Experimental Design (Page 11 of 15) Example F Which data gathering technique might be best suited for each of the following situations? a. Study the effect of stopping the cooling process in a nuclear reactor. b. Study the amount of time college students taking a full course load would spend watching TV. c. Study the effect of a calcium supplement given to young girls on bone mass. d. Study the credit hour load of each student enrolled at Palomar at the end of the add/drop period.

12 1.3 Experimental Design (Page 12 of 15) Experiment and Observational Study In an observational study, observations and measurements of individuals are conducted in a way that does not change the response or the variable being measured. In an experiment, a treatment is deliberately imposed on the individuals in order to observe a possible change in the response or variable being measured. In a study, often the individuals are divided into two groups a control group and an experimental group. The experimental group is actually given the treatment and the control group is not given the treatment. Example 8 In 1778 Captain James Cook introduced goats to the Hawaiian Islands. It was later observed that the Silver Sword plant appeared to be less and less common. Botanists suspected the goats to be the cause and conducted a statistical study. They set up stations around the islands with similar climate and soil conditions. Each station consisted of two plots of land, one with a fence around it to keep the goats out. Identify the a. treatment b. experimental group c. control group

13 1.3 Experimental Design (Page 13 of 15) Randomized 2-Treatment Experiments Placebo Effect The placebo effect occurs when a subject in the control group receives no treatment, but believes she is in fact receiving treatment and responds favorably. Example 9 For more than a decade doctors have been using lasers to drill holes in the heart to reduce angina (chest pain). Many patients reported lasting and significant relief from the procedure. To test if the relief is due to the placebo effect or not a randomized twotreatment experiment was completed. A group of 298 volunteers with severe, untreatable chest pain were randomly assigned to get the laser treatment or not. The patients were sedated but awake. They could hear the doctors discuss the laser process. Each patient thought he or she was receiving the treatment. Conclusion: The laser patients did well. But shockingly, the placebo patients showed more improvement in pain relief. The medical impacts of this study are still being investigated. The study of example 9 has many features of good experimental design. There is a control group who received the dummy treatment and the experimental group who received the actual treatment. The control group is used to account for influence of lurking or confounding variables that might account for some of the changes observed. Randomization is used to assign individuals to the two treatment groups. This helps prevent bias in selecting members for each group. Replication of the experiment on many patients reduces the possibility that the differences in pain relief for the two groups occurred by chance alone.

14 1.3 Experimental Design (Page 14 of 15) Double-Blind Experiment A double-blind experiment is one in which neither the patients, nor the observers know which subjects are receiving the treatment. They help control the biases of doctors and researchers. Survey Questions and their Pitfalls Gathering data by simply asking people questions is the essence of a survey. Cautions with Survey Questions 1. Can you convert the data to numbers? 2. Is the wording of the question unbiased? 3. Voluntary responses often over-represent strong [negative] opinions. 4. Can you expect a truthful response? 5. Is the sample representative of the population? 6. Hidden Bias: How would you design/administer a survey of Palomar College Students? 7. Other Variables may establish a Cause-Effect Relationship. Since, in general, events with higher ticket prices have higher attendance, should you raise ticket prices to increase revenue 8. Over Generalizing Results Results of drug experiments on lab rats cannot be generalized to other animals. 9. How do you handle a significant proportion of non-responses. 10. Poll registered versus likely voters.
![Cautions with Survey Questions 1. Can you convert the data to numbers? 2. Is the wording of the question unbiased? 3. Voluntary responses often over-represent strong [negative] opinions. 4.](/docs-images/44/13575914/images/page_14.jpg "Can you expect a truthful response? 5. Is the sample representative of the population? 6. Hidden Bias: How would you design/administer a survey of Palomar College Students? 7.")
15 1.3 Experimental Design (Page 15 of 15) Guided Exercise 4 Comment on the usefulness of data collected as described: a. A uniformed law officer asks a group of college freshman their name and if he/she has used drugs in the last month. b. Jane saw data that show that cities with more homeless people have more low-income housing. Does building low-income housing produce more homelessness? c. A survey about food in the cafeteria was conducted by having survey forms available at the register. A drop box for the forms is outside the cafeteria. d. Extensive studies on coronary problems were conducted using men over age 50 as the subjects.

MULTIPLE CHOICE. Choose the one alternative that best completes the statement or answers the question.
 Exam Name MULTIPLE CHOICE. Choose the one alternative that best completes the statement or answers the question. 1) The government of a town needs to determine if the city's residents will support the
SHORT ANSWER. Write the word or phrase that best completes each statement or answers the question.
 Ch. 1 Introduction to Statistics 1.1 An Overview of Statistics 1 Distinguish Between a Population and a Sample Identify the population and the sample. survey of 1353 American households found that 18%
Determine whether the data are qualitative or quantitative. 8) the colors of automobiles on a used car lot Answer: qualitative
 the colors of automobiles on a used car lot Answer: qualitative") Name Score: Math 227 Review Exam 1 Chapter 2& Fall 2011 ********************************************************************************************************************** SHORT ANSWER. Show work on
Name Score: Math 227 Review Exam 1 Chapter 2& Fall 2011 ********************************************************************************************************************** SHORT ANSWER. Show work on
Chapter 1: The Nature of Probability and Statistics
 Chapter 1: The Nature of Probability and Statistics Learning Objectives Upon successful completion of Chapter 1, you will have applicable knowledge of the following concepts: Statistics: An Overview and
AP Stats- Mrs. Daniel Chapter 4 MC Practice
 AP Stats- Mrs. Daniel Chapter 4 MC Practice Name: 1. Archaeologists plan to examine a sample of 2-meter-square plots near an ancient Greek city for artifacts visible in the ground. They choose separate
Elementary Statistics
 Elementary Statistics Chapter 1 Dr. Ghamsary Page 1 Elementary Statistics M. Ghamsary, Ph.D. Chap 01 1 Elementary Statistics Chapter 1 Dr. Ghamsary Page 2 Statistics: Statistics is the science of collecting,
AP * Statistics Review. Designing a Study
 AP * Statistics Review Designing a Study Teacher Packet Advanced Placement and AP are registered trademark of the College Entrance Examination Board. The College Board was not involved in the production
6. Decide which method of data collection you would use to collect data for the study (observational study, experiment, simulation, or survey):
:") MATH 1040 REVIEW (EXAM I) Chapter 1 1. For the studies described, identify the population, sample, population parameters, and sample statistics: a) The Gallup Organization conducted a poll of 1003 Americans
MATH 1040 REVIEW (EXAM I) Chapter 1 1. For the studies described, identify the population, sample, population parameters, and sample statistics: a) The Gallup Organization conducted a poll of 1003 Americans
Data Collection and Sampling OPRE 6301
 Data Collection and Sampling OPRE 6301 Recall... Statistics is a tool for converting data into information: Statistics Data Information But where then does data come from? How is it gathered? How do we
Second Midterm Exam (MATH1070 Spring 2012)
") Second Midterm Exam (MATH1070 Spring 2012) Instructions: This is a one hour exam. You can use a notecard. Calculators are allowed, but other electronics are prohibited. 1. [60pts] Multiple Choice Problems
Second Midterm Exam (MATH1070 Spring 2012) Instructions: This is a one hour exam. You can use a notecard. Calculators are allowed, but other electronics are prohibited. 1. [60pts] Multiple Choice Problems
Problems for Chapter 9: Producing data: Experiments. STAT 145-023. Fall 2015.
 How Data are Obtained The distinction between observational study and experiment is important in statistics. Observational Study Experiment Observes individuals and measures variables of interest but does
Topic #1: Introduction to measurement and statistics
 Topic #1: Introduction to measurement and statistics "Statistics can be fun or at least they don't need to be feared." Many folks have trouble believing this premise. Often, individuals walk into their
Mind on Statistics. Chapter 15
 Mind on Statistics Chapter 15 Section 15.1 1. A student survey was done to study the relationship between class standing (freshman, sophomore, junior, or senior) and major subject (English, Biology, French,
MULTIPLE CHOICE. Choose the one alternative that best completes the statement or answers the question.
 Final Exam Review MULTIPLE CHOICE. Choose the one alternative that best completes the statement or answers the question. 1) A researcher for an airline interviews all of the passengers on five randomly
Math and Science Bridge Program. Session 1 WHAT IS STATISTICS? 2/22/13. Research Paperwork. Agenda. Professional Development Website
 Math and Science Bridge Program Year 1: Statistics and Probability Dr. Tamara Pearson Assistant Professor of Mathematics Research Paperwork Informed Consent Pre-Survey After you complete the survey please
 There are three kinds of people in the world those who are good at math and those who are not. PSY 511: Advanced Statistics for Psychological and Behavioral Research 1 Positive Views The record of a month
Basic Concepts in Research and Data Analysis
 Basic Concepts in Research and Data Analysis Introduction: A Common Language for Researchers...2 Steps to Follow When Conducting Research...3 The Research Question... 3 The Hypothesis... 4 Defining the
Selecting Research Participants
 C H A P T E R 6 Selecting Research Participants OBJECTIVES After studying this chapter, students should be able to Define the term sampling frame Describe the difference between random sampling and random
9. Sampling Distributions
 9. Sampling Distributions Prerequisites none A. Introduction B. Sampling Distribution of the Mean C. Sampling Distribution of Difference Between Means D. Sampling Distribution of Pearson's r E. Sampling
How To Understand The Scientific Theory Of Evolution
 Introduction to Statistics for the Life Sciences Fall 2014 Volunteer Definition A biased sample systematically overestimates or underestimates a characteristic of the population Paid subjects for drug
Cell Phone Impairment?
 Cell Phone Impairment? Overview of Lesson This lesson is based upon data collected by researchers at the University of Utah (Strayer and Johnston, 2001). The researchers asked student volunteers (subjects)
Business Statistics: Intorduction
 Business Statistics: Intorduction Donglei Du ([email protected]) Faculty of Business Administration, University of New Brunswick, NB Canada Fredericton E3B 9Y2 September 23, 2015 Donglei Du (UNB) AlgoTrading
How To Collect Data From A Large Group
 Section 2: Ten Tools for Applying Sociology CHAPTER 2.6: DATA COLLECTION METHODS QUICK START: In this chapter, you will learn The basics of data collection methods. To know when to use quantitative and/or
A probability experiment is a chance process that leads to well-defined outcomes. 3) What is the difference between an outcome and an event?
 What is the difference between an outcome and an event?") Ch 4.2 pg.191~(1-10 all), 12 (a, c, e, g), 13, 14, (a, b, c, d, e, h, i, j), 17, 21, 25, 31, 32. 1) What is a probability experiment? A probability experiment is a chance process that leads to well-defined
Ch 4.2 pg.191~(1-10 all), 12 (a, c, e, g), 13, 14, (a, b, c, d, e, h, i, j), 17, 21, 25, 31, 32. 1) What is a probability experiment? A probability experiment is a chance process that leads to well-defined
Descriptive Statistics and Measurement Scales
 Descriptive Statistics 1 Descriptive Statistics and Measurement Scales Descriptive statistics are used to describe the basic features of the data in a study. They provide simple summaries about the sample
Problem Solving and Data Analysis
 Chapter 20 Problem Solving and Data Analysis The Problem Solving and Data Analysis section of the SAT Math Test assesses your ability to use your math understanding and skills to solve problems set in
AMS 5 CHANCE VARIABILITY
 AMS 5 CHANCE VARIABILITY The Law of Averages When tossing a fair coin the chances of tails and heads are the same: 50% and 50%. So if the coin is tossed a large number of times, the number of heads and
Designing & Conducting Survey Research
 Designing & Conducting Survey Research Santa Monica College Fall 2011 Presented by: Hannah Alford, Director Office of Institutional Research 1 Workshop Overview Part I: Overview of Survey Method Paper/Pencil
Unit 8 Data Analysis and Probability
 Accelerated Mathematics II Frameworks Student Edition Unit 8 Data Analysis and Probability 2 nd Edition April, 2011 Table of Contents Introduction............................................................
Problems Before Experimental Design Assessment #1 Answers
 Problems Before Experimental Design Assessment #1 Answers 1. Below is a list of cities. Assign numbers to each city from left to right starting at 01. Use the line of random digits shown below to choose
Choose a simple random sample of size three from the following employees of a small company.
 Name: Date: 1. In order to select a sample of undergraduate students in the United States, I select a simple random sample of four states. From each of these states, I select a simple random sample of
Two-Way Tables. Lesson 16. Main Idea. New Vocabulary two-way table relative frequency
 Lesson 16 Main Idea Construct and interpret two-way tables. New Vocabulary two-way table relative frequency Math Online glencoe.com Two-Way Tables SCHOOL The data from a survey of 50 students is shown
Sampling Procedures Y520. Strategies for Educational Inquiry. Robert S Michael
 Sampling Procedures Y520 Strategies for Educational Inquiry Robert S Michael RSMichael 2-1 Terms Population (or universe) The group to which inferences are made based on a sample drawn from the population.
c. Construct a boxplot for the data. Write a one sentence interpretation of your graph.
 MBA/MIB 5315 Sample Test Problems Page 1 of 1 1. An English survey of 3000 medical records showed that smokers are more inclined to get depressed than non-smokers. Does this imply that smoking causes depression?
Statistics 151 Practice Midterm 1 Mike Kowalski
 Statistics 151 Practice Midterm 1 Mike Kowalski Statistics 151 Practice Midterm 1 Multiple Choice (50 minutes) Instructions: 1. This is a closed book exam. 2. You may use the STAT 151 formula sheets and
Chapter 5: Analysis of The National Education Longitudinal Study (NELS:88)
") Chapter 5: Analysis of The National Education Longitudinal Study (NELS:88) Introduction The National Educational Longitudinal Survey (NELS:88) followed students from 8 th grade in 1988 to 10 th grade in
Chapter 5: Analysis of The National Education Longitudinal Study (NELS:88) Introduction The National Educational Longitudinal Survey (NELS:88) followed students from 8 th grade in 1988 to 10 th grade in
AP Statistics Chapters 11-13 Practice Test MULTIPLE CHOICE. Choose the one alternative that best completes the statement or answers the question.
 AP Statistics Chapters 11-13 Practice Test Name MULTIPLE CHOICE. Choose the one alternative that best completes the statement or answers the question. 1) A company sponsoring a new Internet search engine
Data Analysis, Statistics, and Probability
 Chapter 6 Data Analysis, Statistics, and Probability Content Strand Description Questions in this content strand assessed students skills in collecting, organizing, reading, representing, and interpreting
Basic Probability. Probability: The part of Mathematics devoted to quantify uncertainty
 AMS 5 PROBABILITY Basic Probability Probability: The part of Mathematics devoted to quantify uncertainty Frequency Theory Bayesian Theory Game: Playing Backgammon. The chance of getting (6,6) is 1/36.
Chapter 6. Examples (details given in class) Who is Measured: Units, Subjects, Participants. Research Studies to Detect Relationships
 Who is Measured: Units, Subjects, Participants. Research Studies to Detect Relationships") Announcements: Midterm Friday. Bring calculator and one sheet of notes. Can t use the calculator on your cell phone. Assigned seats, random ID check. Review Wed. Review sheet posted on website. Fri discussion
Announcements: Midterm Friday. Bring calculator and one sheet of notes. Can t use the calculator on your cell phone. Assigned seats, random ID check. Review Wed. Review sheet posted on website. Fri discussion
Mind on Statistics. Chapter 10
 Mind on Statistics Chapter 10 Section 10.1 Questions 1 to 4: Some statistical procedures move from population to sample; some move from sample to population. For each of the following procedures, determine
Intro to GIS Winter 2011. Data Visualization Part I
 Intro to GIS Winter 2011 Data Visualization Part I Cartographer Code of Ethics Always have a straightforward agenda and have a defining purpose or goal for each map Always strive to know your audience
A Guide to Understanding and Using Data for Effective Advocacy
 A Guide to Understanding and Using Data for Effective Advocacy Voices For Virginia's Children Voices For V Child We encounter data constantly in our daily lives. From newspaper articles to political campaign
Best Practices in Data Visualizations. Vihao Pham January 29, 2014
 Best Practices in Data Visualizations Vihao Pham January 29, 2014 Agenda Best Practices in Data Visualizations Why We Visualize Understanding Data Visualizations Enhancing Visualizations Visualization
Best Practices in Data Visualizations. Vihao Pham 2014
 Best Practices in Data Visualizations Vihao Pham 2014 Agenda Best Practices in Data Visualizations Why We Visualize Understanding Data Visualizations Enhancing Visualizations Visualization Considerations
Practice Midterm Exam #2
 The Islamic University of Gaza Faculty of Engineering Department of Civil Engineering 12/12/2009 Statistics and Probability for Engineering Applications 9.2 X is a binomial random variable, show that (
Practice#1(chapter1,2) Name
 Name") Practice#1(chapter1,2) Name Solve the problem. 1) The average age of the students in a statistics class is 22 years. Does this statement describe descriptive or inferential statistics? A) inferential statistics
Practice#1(chapter1,2) Name Solve the problem. 1) The average age of the students in a statistics class is 22 years. Does this statement describe descriptive or inferential statistics? A) inferential statistics
Randomization in Clinical Trials
 in Clinical Trials Versio.0 May 2011 1. Simple 2. Block randomization 3. Minimization method Stratification RELATED ISSUES 1. Accidental Bias 2. Selection Bias 3. Prognostic Factors 4. Random selection
Review for Grade 9 June Exam - Unit 9 - Probability and Statistics
 Name: Date: Review for Grade 9 June Exam - Unit 9 - Probability and Statistics Multiple Choice Identify the choice that best completes the statement or answers the question. 1. The last three days Alexa
NON-PROBABILITY SAMPLING TECHNIQUES
 NON-PROBABILITY SAMPLING TECHNIQUES PRESENTED BY Name: WINNIE MUGERA Reg No: L50/62004/2013 RESEARCH METHODS LDP 603 UNIVERSITY OF NAIROBI Date: APRIL 2013 SAMPLING Sampling is the use of a subset of the
Northumberland Knowledge
 Northumberland Knowledge Know Guide How to Analyse Data - November 2012 - This page has been left blank 2 About this guide The Know Guides are a suite of documents that provide useful information about
The Math. P (x) = 5! = 1 2 3 4 5 = 120.
 = 5! = 1 2 3 4 5 = 120.") The Math Suppose there are n experiments, and the probability that someone gets the right answer on any given experiment is p. So in the first example above, n = 5 and p = 0.2. Let X be the number of correct
The Math Suppose there are n experiments, and the probability that someone gets the right answer on any given experiment is p. So in the first example above, n = 5 and p = 0.2. Let X be the number of correct
3. Data Analysis, Statistics, and Probability
 3. Data Analysis, Statistics, and Probability Data and probability sense provides students with tools to understand information and uncertainty. Students ask questions and gather and use data to answer
Lecture 2: Types of Variables
 2typesofvariables.pdf Michael Hallstone, Ph.D. [email protected] Lecture 2: Types of Variables Recap what we talked about last time Recall how we study social world using populations and samples. Recall
Levels of measurement in psychological research:
 Research Skills: Levels of Measurement. Graham Hole, February 2011 Page 1 Levels of measurement in psychological research: Psychology is a science. As such it generally involves objective measurement of
Foundation of Quantitative Data Analysis
 Foundation of Quantitative Data Analysis Part 1: Data manipulation and descriptive statistics with SPSS/Excel HSRS #10 - October 17, 2013 Reference : A. Aczel, Complete Business Statistics. Chapters 1
Self-Check and Review Chapter 1 Sections 1.1-1.2
 Self-Check and Review Chapter 1 Sections 1.1-1.2 Practice True/False 1. The entire collection of individuals or objects about which information is desired is called a sample. 2. A study is an observational
MULTIPLE CHOICE. Choose the one alternative that best completes the statement or answers the question.
 Ch. 4 Discrete Probability Distributions 4.1 Probability Distributions 1 Decide if a Random Variable is Discrete or Continuous 1) State whether the variable is discrete or continuous. The number of cups
Midterm Review Problems
 Midterm Review Problems October 19, 2013 1. Consider the following research title: Cooperation among nursery school children under two types of instruction. In this study, what is the independent variable?
Math 58. Rumbos Fall 2008 1. Solutions to Review Problems for Exam 2
 Math 58. Rumbos Fall 2008 1 Solutions to Review Problems for Exam 2 1. For each of the following scenarios, determine whether the binomial distribution is the appropriate distribution for the random variable
Measurement. How are variables measured?
 Measurement Y520 Strategies for Educational Inquiry Robert S Michael Measurement-1 How are variables measured? First, variables are defined by conceptual definitions (constructs) that explain the concept
Concepts of Variables. Levels of Measurement. The Four Levels of Measurement. Nominal Scale. Greg C Elvers, Ph.D.
 Concepts of Variables Greg C Elvers, Ph.D. 1 Levels of Measurement When we observe and record a variable, it has characteristics that influence the type of statistical analysis that we can perform on it
AP Statistics Chapters 11-12 Practice Problems MULTIPLE CHOICE. Choose the one alternative that best completes the statement or answers the question.
 AP Statistics Chapters 11-12 Practice Problems Name MULTIPLE CHOICE. Choose the one alternative that best completes the statement or answers the question. 1) Criticize the following simulation: A student
Research design and methods Part II. Dr Brian van Wyk POST-GRADUATE ENROLMENT AND THROUGHPUT
 Research design and methods Part II Dr Brian van Wyk POST-GRADUATE ENROLMENT AND THROUGHPUT From last week Research methodology Quantitative vs. Qualitative vs. Participatory/action research Research methods
Opinion Poll. Minnesota Small Business Owners Support Reforming U.S. Elections. October 30, 2014
 Opinion Poll Minnesota Small Business Owners Support Reforming U.S. Elections October 30, 2014 Small Business Majority 1101 14 th Street, NW, Suite 1001 Washington, DC 20005 (202) 828-8357 www.smallbusinessmajority.org
2012 Demographics PROFILE OF THE MILITARY COMMUNITY
 2012 Demographics PROFILE OF THE MILITARY COMMUNITY Acknowledgements ACKNOWLEDGEMENTS This report is published by the Office of the Deputy Assistant Secretary of Defense (Military Community and Family
Open-Ended Problem-Solving Projections
 MATHEMATICS Open-Ended Problem-Solving Projections Organized by TEKS Categories TEKSING TOWARD STAAR 2014 GRADE 7 PROJECTION MASTERS for PROBLEM-SOLVING OVERVIEW The Projection Masters for Problem-Solving
Mind on Statistics. Chapter 8
 Mind on Statistics Chapter 8 Sections 8.1-8.2 Questions 1 to 4: For each situation, decide if the random variable described is a discrete random variable or a continuous random variable. 1. Random variable
Descriptive Inferential. The First Measured Century. Statistics. Statistics. We will focus on two types of statistical applications
 Introduction: Statistics, Data and Statistical Thinking The First Measured Century FREC 408 Dr. Tom Ilvento 213 Townsend Hall [email protected] http://www.udel.edu/frec/ilvento http://www.pbs.org/fmc/index.htm
How To Write A Data Analysis
 Mathematics Probability and Statistics Curriculum Guide Revised 2010 This page is intentionally left blank. Introduction The Mathematics Curriculum Guide serves as a guide for teachers when planning instruction
Math 9 Unit 9 Probability and Statistics Practice Test
 Name: Class: _ Date: _ ID: A Math 9 Unit 9 Probability and Statistics Practice Test Multiple Choice Identify the choice that best completes the statement or answers the question. 1. Leila arrives at the
MATH 103/GRACEY PRACTICE QUIZ/CHAPTER 1. MULTIPLE CHOICE. Choose the one alternative that best completes the statement or answers the question.
 MATH 103/GRACEY PRACTICE QUIZ/CHAPTER 1 Name MULTIPLE CHOICE. Choose the one alternative that best completes the statement or answers the question. Use common sense to determine whether the given event
List of Examples. Examples 319
 Examples 319 List of Examples DiMaggio and Mantle. 6 Weed seeds. 6, 23, 37, 38 Vole reproduction. 7, 24, 37 Wooly bear caterpillar cocoons. 7 Homophone confusion and Alzheimer s disease. 8 Gear tooth strength.
Name Date: Period: 4) A study of 3700 college students in the city of Pemblington found that 8% had been victims of violent crimes.
 A study of 3700 college students in the city of Pemblington found that 8% had been victims of violent crimes.") Chapter 1 Test Review Test: Thursday March 12 Name Date: Period: Provide an appropriate response. 1) Which of the following is not true of statistics? Determine whether the underlined value is a parameter
Chapter 1 Test Review Test: Thursday March 12 Name Date: Period: Provide an appropriate response. 1) Which of the following is not true of statistics? Determine whether the underlined value is a parameter
(Following Paper ID and Roll No. to be filled in your Answer Book) Roll No. METHODOLOGY
 Roll No. METHODOLOGY") (Following Paper ID and Roll No. to be filled in your Answer Book) Roll No. ~ n.- (SEM.J:V VEN SEMESTER THEORY EXAMINATION, 2009-2010 RESEARCH METHODOLOGY Note: The question paper contains three parts.
(Following Paper ID and Roll No. to be filled in your Answer Book) Roll No. ~ n.- (SEM.J:V VEN SEMESTER THEORY EXAMINATION, 2009-2010 RESEARCH METHODOLOGY Note: The question paper contains three parts.
What TV Ratings Really Mean
 What TV Ratings Really Mean You just heard that a TV Show was ranked #1 in the Nielsen Media Research ratings. What does that really mean? How does Nielsen Media Research "rate" TV shows? Why do shows
MAT 155. Chapter 1 Introduction to Statistics. Key Concept. Basics of Collecting Data. 155S1.5_3 Collecting Sample Data.
 MAT 155 Dr. Claude Moore Cape Fear Community College Chapter 1 Introduction to Statistics 1 1 Review and Preview 1 2 Statistical Thinking 1 3 Types of Data 1 4 Critical Thinking 1 5 Collecting Sample Data
Introduction to. Hypothesis Testing CHAPTER LEARNING OBJECTIVES. 1 Identify the four steps of hypothesis testing.
 Introduction to Hypothesis Testing CHAPTER 8 LEARNING OBJECTIVES After reading this chapter, you should be able to: 1 Identify the four steps of hypothesis testing. 2 Define null hypothesis, alternative
2009 Mississippi Youth Tobacco Survey. Office of Health Data and Research Office of Tobacco Control Mississippi State Department of Health
 9 Mississippi Youth Tobacco Survey Office of Health Data and Research Office of Tobacco Control Mississippi State Department of Health Acknowledgements... 1 Glossary... 2 Introduction... 3 Sample Design
AP Stats - Probability Review
 AP Stats - Probability Review Multiple Choice Identify the choice that best completes the statement or answers the question. 1. I toss a penny and observe whether it lands heads up or tails up. Suppose
Group Unweighted N Plus or minus Total sample 5,113 2.0 percentage points
 METHODOLOGY The NBC News Online Survey was conducted online by SurveyMonkey September 16-8, 2015 among a national sample of 5,113 adults aged 18 and over. Respondents for this non-probability survey were
Statistics Review PSY379
 Statistics Review PSY379 Basic concepts Measurement scales Populations vs. samples Continuous vs. discrete variable Independent vs. dependent variable Descriptive vs. inferential stats Common analyses
Mind on Statistics. Chapter 4
 Mind on Statistics Chapter 4 Sections 4.1 Questions 1 to 4: The table below shows the counts by gender and highest degree attained for 498 respondents in the General Social Survey. Highest Degree Gender
Data Mining 5. Cluster Analysis
 Data Mining 5. Cluster Analysis 5.2 Fall 2009 Instructor: Dr. Masoud Yaghini Outline Data Structures Interval-Valued (Numeric) Variables Binary Variables Categorical Variables Ordinal Variables Variables
Hypothesis Testing. Steps for a hypothesis test:
 Hypothesis Testing Steps for a hypothesis test: 1. State the claim H 0 and the alternative, H a 2. Choose a significance level or use the given one. 3. Draw the sampling distribution based on the assumption
STAT/MATH 3379: Dr. Manage Chapter Assignment Chapter 1: The Nature of Statistics-Solutions
 STAT/MATH 3379: Dr. Manage Chapter Assignment Chapter 1: The Nature of Statistics-Solutions 1. statistics consists of methods for estimating and drawing conclusions about population characteristics based
HAMILTON COLLEGE NATIONAL YOUTH POLLS CLIMATE CHANGE AND ENVIRONMENTAL ISSUES POLL
 HAMILTON COLLEGE NATIONAL YOUTH POLLS CLIMATE CHANGE AND ENVIRONMENTAL ISSUES POLL January 2007 Climate Change and Environment Issues Poll November, 2006 Developed by Philip W. Arscott 07 Patrick C. Hooper
Chi Square Distribution
 17. Chi Square A. Chi Square Distribution B. One-Way Tables C. Contingency Tables D. Exercises Chi Square is a distribution that has proven to be particularly useful in statistics. The first section describes
Math 370/408, Spring 2008 Prof. A.J. Hildebrand. Actuarial Exam Practice Problem Set 1
 Math 370/408, Spring 2008 Prof. A.J. Hildebrand Actuarial Exam Practice Problem Set 1 About this problem set: These are problems from Course 1/P actuarial exams that I have collected over the years, grouped
11. Analysis of Case-control Studies Logistic Regression
 Research methods II 113 11. Analysis of Case-control Studies Logistic Regression This chapter builds upon and further develops the concepts and strategies described in Ch.6 of Mother and Child Health:
6. Let X be a binomial random variable with distribution B(10, 0.6). What is the probability that X equals 8? A) (0.6) (0.4) B) 8! C) 45(0.6) (0.
. What is the probability that X equals 8? A) (0.6) (0.4) B) 8! C) 45(0.6) (0.") Name: Date:. For each of the following scenarios, determine the appropriate distribution for the random variable X. A) A fair die is rolled seven times. Let X = the number of times we see an even number.
Name: Date:. For each of the following scenarios, determine the appropriate distribution for the random variable X. A) A fair die is rolled seven times. Let X = the number of times we see an even number.
STATISTICS 8: CHAPTERS 7 TO 10, SAMPLE MULTIPLE CHOICE QUESTIONS
 STATISTICS 8: CHAPTERS 7 TO 10, SAMPLE MULTIPLE CHOICE QUESTIONS 1. If two events (both with probability greater than 0) are mutually exclusive, then: A. They also must be independent. B. They also could
THE PAN ATLANTIC SMS GROUP 54 th OMNIBUS POLL The Benchmark of Maine Public Opinion
 THE PAN ATLANTIC SMS GROUP 54 th OMNIBUS POLL The Benchmark of Maine Public Opinion 3 rd Maine Gubernatorial Election Poll Fall 2014 1 6 City Center, Suite 200, Portland, Maine 04101 207-871-8622 www.panatlanticsmsgroup.com
STA-201-TE. 5. Measures of relationship: correlation (5%) Correlation coefficient; Pearson r; correlation and causation; proportion of common variance
 Correlation coefficient; Pearson r; correlation and causation; proportion of common variance") Principles of Statistics STA-201-TE This TECEP is an introduction to descriptive and inferential statistics. Topics include: measures of central tendency, variability, correlation, regression, hypothesis
Principles of Statistics STA-201-TE This TECEP is an introduction to descriptive and inferential statistics. Topics include: measures of central tendency, variability, correlation, regression, hypothesis
AP STATISTICS (Warm-Up Exercises)
") AP STATISTICS (Warm-Up Exercises) 1. Describe the distribution of ages in a city: 2. Graph a box plot on your calculator for the following test scores: {90, 80, 96, 54, 80, 95, 100, 75, 87, 62, 65, 85,
AP STATISTICS (Warm-Up Exercises) 1. Describe the distribution of ages in a city: 2. Graph a box plot on your calculator for the following test scores: {90, 80, 96, 54, 80, 95, 100, 75, 87, 62, 65, 85,
SAMPLING METHODS IN SOCIAL RESEARCH
 SAMPLING METHODS IN SOCIAL RESEARCH Muzammil Haque Ph.D Scholar Visva Bharati, Santiniketan,West Bangal Sampling may be defined as the selection of some part of an aggregate or totality on the basis of
The American Cancer Society Cancer Prevention Study I: 12-Year Followup
 Chapter 3 The American Cancer Society Cancer Prevention Study I: 12-Year Followup of 1 Million Men and Women David M. Burns, Thomas G. Shanks, Won Choi, Michael J. Thun, Clark W. Heath, Jr., and Lawrence
socscimajor yes no TOTAL female 25 35 60 male 30 27 57 TOTAL 55 62 117
 Review for Final Stat 10 (1) The table below shows data for a sample of students from UCLA. (a) What percent of the sampled students are male? 57/117 (b) What proportion of sampled students are social
Introduction to Regression and Data Analysis
 Statlab Workshop Introduction to Regression and Data Analysis with Dan Campbell and Sherlock Campbell October 28, 2008 I. The basics A. Types of variables Your variables may take several forms, and it