AfNOG Monitoring of IP Services. Ayitey Bulley Material generously borrowed from the NSRC NME course
|
|
|
- Nelson Bryant
- 8 years ago
- Views:
Transcription
1 AfNOG-2013 Monitoring of IP Services Ayitey Bulley Material generously borrowed from the NSRC NME course

2 Introduction To monitor or monitoring generally means to be aware of the state of a system. To observe a situation for any changes which may occur over time, using a monitor or measuring device of some sort. The term network monitoring describes the use of a system that constantly monitors a computer network for faults and notifies the network administrator (via , SMS or other alarms) in case of outages. It is a subset of the functions involved in network management.
 in case of outages.")
3 Monitoring Types Application Performance Monitoring Environmental Monitoring Network Monitoring System Monitoring Website Monitoring

4 What do we Monitor? Systems/Service Availability and Reliability Resource Utilization Reliability & Performance (RTT & Throughput) Configuration changes

5 Why Monitor? Deliver on targets (KPIs/SLAs) Early detection and fault resolution (MTTR) Accurately report on the state of the systems being managed
 Accurately report on the")
6 Monitoring Tools Nagios Availability of services, servers and network devices. Cacti Utilization of resources such as bandwidth, cpu, memory, disk space etc. Smokeping Reliability and performance of systems and services. For monitoring IP services, we will focus on monitoring availability (Nagios) and reliability (Smokeping)
 and")
7 Nagios Nagios actively monitors the availability of devices and services Availability of services, servers and network devices. Possibly the most used open source network monitoring software. Sends alerts and/or triggers alerts Logs history and generates SLA reports Can support up to thousands of devices and services.

8 Perspective on Availability? Availability % Downtime per Year Downtime per Month Downtime per Week 90% ("one nine") 36.5 days 72 hours 16.8 hours 98% 7.30 days 14.4 hours 3.36 hours 99% ("two nines") 99.9% ("three nines") 99.99% ("four nines") % ("five nines") 3.65 days 7.20 hours 1.68 hours 8.76 hours 43.8 minutes 10.1 minutes minutes 4.32 minutes 1.01 minutes 5.26 minutes 25.9 seconds 6.05 seconds
 99.99% (\"four nines\") 99.999% (\"five nines\") 3.65 days 7.20 hours 1.68 hours 8.")
9 Nagios FreeBSD Installation Dependencies: MySQL, Apache & PHP Install nagios from ports: # cd /usr/ports/net-mgmt/nagios # make all install clean Key directories: /usr/local/etc/nagios /usr/local/etc/nagios/objects /usr/local/libexec/nagios /usr/local/www/nagios Nagios web interface sample is here:

10 Nagios Architecture Plugins are used to verify the state of devices & services. Small, self-contained applications which make a single connection to test a service then quit Return OK, Warning, Critical or Unknown Many plugins supplied, even more available Data storage: plain text files Data visualisation: CGI web interface Configuration: plain text files

11 Nagios Configuration Files Located in /usr/local/etc/nagios: cgi.cfg Controls the web interface and security options nagios.cfg Main configuration file resource.cfg Used to specify an optional resource file that can contain $USERn$ macro definitions. objects/ All other configuration files go here.

12 Nagios Configuration Files The /usr/local/etc/nagios/objects directory: commands.cfg The commands that nagios uses for notifications contacts.cfg Users and groups localhost.cfg Definition of the nagios host printer.cfg, switch.cfg Definition of printers and switches templates.cfg Sample object templates timeperiods.cfg Defines when to check the state of objects

13 Nagios Features Allows you to acknowledge an event. A user can add comments via the GUI You can define maintenance periods By device or a group of devices Maintains availability statistics. Can detect flapping and suppress additional notifications. Allows for multiple notification methods: , pager, SMS, win-popup, audio, etc... Allows you to define notification levels for escalation

14 Nagios Exercise

15 SmokePing - Introduction Based on RRDTool (the same author) Measures latency and can measure performance and status of services such as HTTP, DNS, SMTP, SSH, LDAP, etc. Define ranges on statistics and generate alarms. Written in Perl for portability Easy to install harder to configure.

16 SmokePing Marketing SmokePing keeps track of your network latency: Best of breed latency visualization. Interactive graph explorer. Wide range of latency measurement plugins. Master/Slave System for distributed measurement. Highly configurable alerting system. Live Latency Charts with the most 'interesting' graphs. Free and OpenSource Software written in Perl written by Tobi Oetiker, the creator of MRTG and RRDtool

17 Sample Screenshot
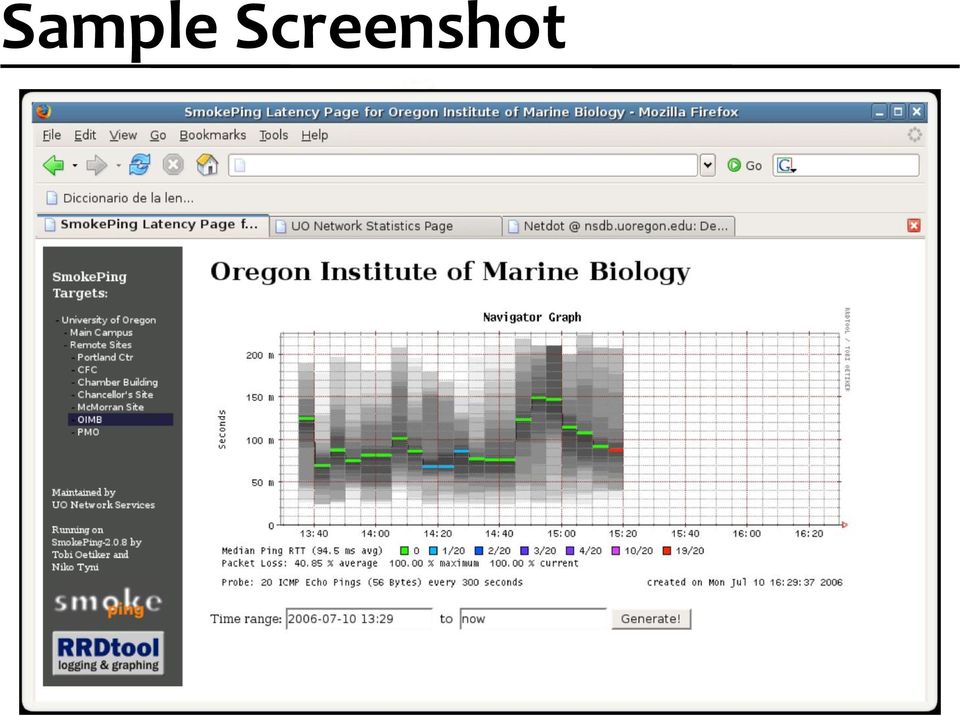
18 Reading Smokeping Graphs Smokeping sends multiples tests (pings), makes note of RTT, orders these and selects the median. The different values of RTT are shown graphically as lighter and darker shades of grey (the smoke ). This conveys the idea of variable round trip times or jitter. The number of lost packets (if any) changes the color of the horizontal line across the graph.
. This conveys the idea of variable round trip times or jitter.")
19 Reading Smokeping Graphs

20 Dependencies RRDtool Fping Echoping Apache Perl FCGI speedycgi

21 SmokePing Installation FreeBSD ports: # cd /usr/ports/net-mgmt/smokeping # make all install clean Configuration file: /usr/local/etc/smokeping/config Change Smokeping s appearance: /usr/local/etc/smokeping/basepage.html Restart the service: /usr/local/etc/smokeping restart /usr/local/etc/smokeping reload
22 SmokePing config file Config file is set out in the following sections: General Database Presentation Probes Slaves Targets Generally most time is spent configuring Targets, Probes and Alerts

23 SmokePing config - General *** General *** owner = Peter Random contact = noc@localhost mailhost = localhost sendmail = /usr/sbin/sendmail # NOTE: do not put the Image Cache below cgi-bin # since all files under cgi-bin will be executed... this is not # good for images. imgcache = /usr/local/smokeping/htdocs/img imgurl = img datadir = /usr/local/var/smokeping piddir = /usr/local/var/smokeping cgiurl = smok = /usr/local/etc/smokeping/smok tmail = /usr/local/etc/smokeping/tmail # specify this to get syslog logging syslogfacility = local0 # each probe is now run in its own process # disable this to revert to the old behaviour # concurrentprobes = no

24 SmokePing config - Alerts Very flexible and you can create your own type of alert. Send alerts to ticket queues (RT using rt-mailgate, for instance) Somewhat complex to understand. Read the Alerts section of the Smokeping on-line configuration documentation: *** Alerts *** to = noc@localhost from = smoke-alert@localhost +someloss type = loss # in percent pattern = >0%,*12*,>0%,*12*,>0% comment = loss 3 times in a row

25 SmokePing config - Database Defines how RRDtool will save data over time in Round Robin Archives (RRAs) By default each step is 300 seconds (5 minutes). You cannot trivially change the step setting once data has been collected. Details on each column in the Database section of the Smokeping on-line configuration documentation: *** Database *** step = 300 pings = 20 # consfn mrhb steps total AVERAGE AVERAGE MIN MAX AVERAGE MAX MIN consfn: Consolidation function mrhb: Percent of consolidated steps that must be known to warrant an entry. steps: How many steps to consolidate for each entry in the RRA. total: Total number of rows to keep in the RRA. Use rows and steps to determine time data will be saved. 12 steps = 12 x 300 sec = 1 hour 4320 rows = 4320 hours = 180 days

26 SmokePing config - Presentation If you wish to customize Smokeping s look and feel you can edit the file /etc/smokeping/basepage.html To change how Smokeping presents graphs you can edit this section. *** Presentation *** template = /usr/local/etc/smokeping/basepage.html + charts menu = Charts title = The most interesting destinations ++ stddev sorter = StdDev(entries=>4) title = Top Standard Deviation menu = Std Deviation format = Standard Deviation %f ++ max sorter = Max(entries=>5) title = Top Max Roundtrip Time menu = by Max format = Max Roundtrip Time %f seconds

27 SmokePing config - Probes Smokeping is installed with a number of additional probes. They must, however, be specified here including their default behaviors. *** Probes *** + FPing binary = /usr/local/sbin/fping + DNS binary = /usr/bin/dig lookup = afnog.org pings = 5 step = EchoPingHttp binary = /usr/bin/echoping ignore_cache = yes pings = 5 url = / Use the DNS probe to verify that your services are available and responding as expected. We use afnog.org as a sample hostname to lookup, to verify that the DNS works. + EchoPingHttps binary = /usr/bin/echoping pings = 5 url = / + EchoPingSmtp binary = /usr/bin/echoping forks = 5

28 SmokePing config - Slaves Smokeping slave servers allow for multi-viewpoint monitoring and graphing of the same services, machines or links. Details here: *** Slaves *** secrets=/usr/local/etc/smokeping/smokeping_secrets +boomer display_name=boomer color=0000ff +slave2 display_name=another color=00ff00 That is, you can externally monitor your network!

29 SmokePing config - Targets Where we spend most of our time configuring Smokeping. Web menu hierarchy defined by +, ++, etc. Each new probe statement resets the default probe in use. Probes have defaults set in the Probes config file. These can be overridden in Targets section. *** Targets *** probe = FPing menu = Top title = Network Latency Grapher + UO menu = University of Oregon title = UO webserver host = + NSRC menu = NSRC title = Network Startup Resource Center host = ++ HTTP menu = HTTP probe = EchoPingHttp +++ www menu = NSRC web host = ++ DNS menu = DNS probe = DNS +++ dns menu = NSRC DNS host =
30 SmokePing Default Probe Probing for delay and jitter (ping) Performance and availability probe of a server. Entry belongs in the Targets section of the config file: +++ LocalMachine menu = localhost title = Our Local Machine alerts = someloss host = localhost
31 SmokePing DNS Check Entry belongs in the Targets section of the config file: ++ DNS probe = DNS menu = External DNS Check title = DNS Latency +++ nsrc host = nsrc.org
32 SmokePing Other Probes More information available here: A few more probes... - DNS - HTTP(S) - LDAP - Whois - SMTP - CiscoRTTMonDNS - CiscoRTTMonTcpCon - Tacacs - WebProxyFilter - Etc. -WWW-Cache - Radius - IOS - FPing6 - etc.
33 SmokePing Summary Simple but powerful network monitoring Monitor machines, services and link health Distributed instances for external views often a paid-for service Easy to configure and customize, but very extensible. Can be used with Ticketing Systems to automate alerts Very small disk and CPU footprint
34 Smokeping website: References Smokeping Demo: Good examples:
Network Monitoring & Management Measuring Delay with Smokeping
 Network Monitoring & Management Measuring Delay with Smokeping Network Startup Resource Center www.nsrc.org These materials are licensed under the Creative Commons Attribution-NonCommercial 4.0 International
Network Management & Monitoring
 Network Management & Monitoring Smokeping - Part I Contents 0.1 Exercises............................... 1 0.2 1. Install Smokeping......................... 1 0.3 2. Initial Configuration........................
Introduction to Network Monitoring and Management
 Introduction to Network Monitoring and Management Jonathan Brewer Network Startup Resource Center jon@nsrc.org These materials are licensed under the Creative Commons Attribution-NonCommercial 4.0 International
There are numerous ways to access monitors:
 Remote Monitors REMOTE MONITORS... 1 Overview... 1 Accessing Monitors... 1 Creating Monitors... 2 Monitor Wizard Options... 11 Editing the Monitor Configuration... 14 Status... 15 Location... 17 Alerting...
Introduction to Network Monitoring and Management
 Introduction to Network Monitoring and Management Network Startup Resource Center www.nsrc.org These materials are licensed under the Creative Commons Attribution-NonCommercial 4.0 International license
Network Monitoring and Management Introduction to Networking Monitoring and Management
 Network Monitoring and Management Introduction to Networking Monitoring and Management These materials are licensed under the Creative Commons Attribution-Noncommercial 3.0 Unported license (http://creativecommons.org/licenses/by-nc/3.0/)
Availability Management Nagios overview. TEIN2 training Bangkok September 2005
 1 Availability Management Nagios overview Agenda 2 Introduction Objectives Functionalities Requirement. Architecture & Operation Operation Description WEB portal Plugins and extensions Plugins description
Network Management & Monitoring Overview
 Network Management & Monitoring Overview Advanced cctld Workshop September, 2008, Holland What is network management? System & Service monitoring Reachability, availability Resource measurement/monitoring
DEPLOYMENT GUIDE Version 1.0. Deploying the BIG-IP LTM with the Nagios Open Source Network Monitoring System
 DEPLOYMENT GUIDE Version 1.0 Deploying the BIG-IP LTM with the Nagios Open Source Network Monitoring System Deploying F5 with Nagios Open Source Network Monitoring System Welcome to the F5 and Nagios deployment
Network Monitoring. Sebastian Büttrich, sebastian@less.dk NSRC / IT University of Copenhagen Last edit: February 2012, ICTP Trieste
 Network Monitoring Sebastian Büttrich, sebastian@less.dk NSRC / IT University of Copenhagen Last edit: February 2012, ICTP Trieste http://creativecommons.org/licenses/by-nc-sa/3.0/ Agenda What is network
Nagios introduction. Dhruba Raj Bhandari (CCNA) Additions by Phil Regnauld. bhandari.dhruba@scp.com.np
 Additions by Phil Regnauld. bhandari.dhruba@scp.com.np") Nagios introduction Dhruba Raj Bhandari (CCNA) Additions by Phil Regnauld bhandari.dhruba@scp.com.np Why Nagios? Open source Relatively scaleable, Manageable, Secure and more Best documentation available
Nagios introduction Dhruba Raj Bhandari (CCNA) Additions by Phil Regnauld bhandari.dhruba@scp.com.np Why Nagios? Open source Relatively scaleable, Manageable, Secure and more Best documentation available
AusCERT Remote Monitoring Service (ARMS) User Guide for AusCERT Members
 User Guide for AusCERT Members") AusCERT Remote Monitoring Service (ARMS) User Guide for AusCERT Members Last updated: 27/06/2014 Contents 1 Introduction... 2 1.1 What is ARMS?... 2 1.2 Glossary Terms... 2 2 Setting up your ARMS configuration
AusCERT Remote Monitoring Service (ARMS) User Guide for AusCERT Members Last updated: 27/06/2014 Contents 1 Introduction... 2 1.1 What is ARMS?... 2 1.2 Glossary Terms... 2 2 Setting up your ARMS configuration
Network Management & Monitoring Overview
 Network Management & Monitoring Overview Unix & Network Management June 16-18 Papeete, French Polynesia Hervey Allen, Phil Regnauld Introduction This is a big topic... We'll try to respond to what you
AfNOG 2010 Network Monitoring and Management Tutorial. Introduction to Networking Monitoring and Management
 AfNOG 2010 Network Monitoring and Management Tutorial Introduction to Networking Monitoring and Management Part I: Overview Core concepts presented: What is network monitoring What is network management
Grids & networks monitoring - practical approach
 Session 2 Networking for the Grid Grids & networks monitoring - practical approach Jedrzej Jajor Cezary Mazurek Wiktor Procyk INGRID 2007 Instrumenting the Grid Outline Introduction to monitoring Tools:
Network Management & Monitoring Overview
 Network Management & Monitoring Overview PacNOG 6 November 17, 2009 Nadi, Fiji hervey@nsrc.org Introduction This is a big topic... There are a lot of tools to choose from: - Open Source - Commercial -
Network and Server Statistics Using Cacti
 Network Management & Monitoring Network and Server Statistics Using Cacti These materials are licensed under the Creative Commons Attribution-Noncommercial 3.0 Unported license (http://creativecommons.org/licenses/by-nc/3.0/)
MFPConnect Monitoring. Monitoring with IPCheck Server Monitor. Integration Manual Version 2.05.00 Edition 1
 MFPConnect Monitoring Monitoring with IPCheck Server Monitor Integration Manual Version 2.05.00 Edition 1 TABLE OF CONTENTS 1. INTRODUCTION...3 2. REQUIREMENTS...4 3. RESTRICTIONS...5 4. INSTALLATION...6
Network and Server Statistics Using Cacti
 Network Management & Monitoring Network and Server Statistics Using Cacti These materials are licensed under the Creative Commons Attribution-Noncommercial 3.0 Unported license (http://creativecommons.org/licenses/by-nc/3.0/)
Network Monitoring Systems / Nagios. 2/19/08 Michael Miller e mail: mike.mikemiller@gmail.com
 Network Monitoring Systems / Nagios 2/19/08 Michael Miller e mail: mike.mikemiller@gmail.com Network Monitoring System What is a Network Monitoring System ( NMS ) What types of devices can you monitor?
Best of Breed of an ITIL based IT Monitoring. The System Management strategy of NetEye
 Best of Breed of an ITIL based IT Monitoring The System Management strategy of NetEye by Georg Kostner 5/11/2012 1 IT Services and IT Service Management IT Services means provisioning of added value for
Chapter 8 Monitoring and Logging
 Chapter 8 Monitoring and Logging This chapter describes the SSL VPN Concentrator status information, logging, alerting and reporting features. It describes: SSL VPN Concentrator Status Active Users Event
The new services in nagios: network bandwidth utility, email notification and sms alert in improving the network performance
 The new services in nagios: network bandwidth utility, email notification and sms alert in improving the network performance Mohammad Ali Arsyad bin Mohd Shuhaimi Hang Tuah Jaya, 76100 Durian Tunggal,
Network Monitoring and Management Introduction to Networking Monitoring and Management
 Network Monitoring and Management Introduction to Networking Monitoring and Management These materials are licensed under the Creative Commons Attribution-Noncommercial 3.0 Unported license (http://creativecommons.org/licenses/by-nc/3.0/)
Service Level Agreement
 Service Level Agreement Addendum Dedicated Server Managed Server Service Versie 1.0 6/08/2012 Telenet N.V.-S.A., Liersesteenweg 4, 2800 Mechelen, Belgium l BTW-TVA BE0473.416.418 RPR-RPM Mechelen l IBAN
WHITE PAPER September 2012. CA Nimsoft Monitor for Servers
 WHITE PAPER September 2012 CA Nimsoft Monitor for Servers Table of Contents CA Nimsoft Monitor for servers 3 solution overview CA Nimsoft Monitor service-centric 5 server monitoring CA Nimsoft Monitor
Kaseya 2. User Guide. for Network Monitor 4.1
 Kaseya 2 Ping Monitor User Guide for Network Monitor 4.1 June 5, 2012 About Kaseya Kaseya is a global provider of IT automation software for IT Solution Providers and Public and Private Sector IT organizations.
Free Network Monitoring Software for Small Networks
 Free Network Monitoring Software for Small Networks > WHITEPAPER Introduction Networks are becoming critical components of business success - irrespective of whether you are small or BIG. When network
Robust & Reliable DNS Operations Logging & Monitoring
 Robust & Reliable DNS Operations Logging & Monitoring These materials are licensed under the Creative Commons Attribution-Noncommercial 3.0 Unported license (http://creativecommons.org/licenses/by-nc/3.0/)
Network Monitoring. Dhruba Raj Bhandari (CCNA) Manager Systems Soaltee Crowne Plaza Kathmandu NEPAL bhandari.dhruba@scp.com.np
 Manager Systems Soaltee Crowne Plaza Kathmandu NEPAL bhandari.dhruba@scp.com.np") Network Monitoring Dhruba Raj Bhandari (CCNA) Manager Systems Soaltee Crowne Plaza Kathmandu NEPAL bhandari.dhruba@scp.com.np Welcome! Network Management Workshop Network Monitoring Concepts, Tools And
Network Monitoring Dhruba Raj Bhandari (CCNA) Manager Systems Soaltee Crowne Plaza Kathmandu NEPAL bhandari.dhruba@scp.com.np Welcome! Network Management Workshop Network Monitoring Concepts, Tools And
Network monitoring systems & tools
 Network monitoring systems & tools Network & Service Monitoring tools Nagios server and service monitor Can monitor pretty much anything HTTP, SMTP, DNS, Disk space, CPU usage,... Easy to write new plugins
Tk20 Network Infrastructure
 Tk20 Network Infrastructure Tk20 Network Infrastructure Table of Contents Overview... 4 Physical Layout... 4 Air Conditioning:... 4 Backup Power:... 4 Personnel Security:... 4 Fire Prevention and Suppression:...
Nagios. cooler than it looks. Wednesday, 31 October 2007
 Nagios cooler than it looks 1 Outline sysadmin 101 Nagios Overview Installing nagios NRPE / NSCA Other Stuff Questions 2 Sysadmin 101 Every sysadmin needs a decent toolkit... 3 Sysadmin 101 Every sysadmin
mbits Network Operations Centrec
 mbits Network Operations Centrec The mbits Network Operations Centre (NOC) is co-located and fully operationally integrated with the mbits Service Desk. The NOC is staffed by fulltime mbits employees,
Network Probe User Guide
 Network Probe User Guide Network Probe User Guide Table of Contents 1. Introduction...1 2. Installation...2 Windows installation...2 Linux installation...3 Mac installation...4 License key...5 Deployment...5
Part I: Overview. Core concepts presented:
 Part I: Overview Core concepts presented: What is network monitoring What is network management Getting started Why network management Attack detection Consolidating the data The big picture What is network
DOSarrest External MULTI-SENSOR ARRAY FOR ANALYSIS OF YOUR CDN'S PERFORMANCE IMMEDIATE DETECTION AND REPORTING OF OUTAGES AND / OR ISSUES
 .com DOSarrest External Monitoring S ystem (DEMS) User s Guide REAL BROWSER MONITORING OF YOUR WEBSITE MULTI-SENSOR ARRAY FOR ANALYSIS OF YOUR CDN'S PERFORMANCE IMMEDIATE DETECTION AND REPORTING OF OUTAGES
Snapt Balancer Manual
 Snapt Balancer Manual Version 1.2 pg. 1 Contents Chapter 1: Introduction... 3 Chapter 2: General Usage... 4 Configuration Default Settings... 4 Configuration Performance Tuning... 6 Configuration Snapt
Network Monitoring Tools
 Network Monitoring Tools (Nagios, MRTG) CSD Fall 2010 Version: 1.3 Identifier: ISP-003 Project owners Björn Pehrson Sven Jonsson Amos Nungu Project coach Hans Eriksson Team members Contact ECTS credits
Network Management and Monitoring Software
 Page 1 of 7 Network Management and Monitoring Software Many products on the market today provide analytical information to those who are responsible for the management of networked systems or what the
MALAYSIAN PUBLIC SECTOR OPEN SOURCE SOFTWARE (OSS) PROGRAMME. COMPARISON REPORT ON NETWORK MONITORING SYSTEMS (Nagios and Zabbix)
 PROGRAMME. COMPARISON REPORT ON NETWORK MONITORING SYSTEMS (Nagios and Zabbix)") MALAYSIAN PUBLIC SECTOR OPEN SOURCE SOFTWARE (OSS) PROGRAMME COMPARISON REPORT ON NETWORK MONITORING SYSTEMS (Nagios and Zabbix) JANUARY 2010 Phase II -Network Monitoring System- Copyright The government
MALAYSIAN PUBLIC SECTOR OPEN SOURCE SOFTWARE (OSS) PROGRAMME COMPARISON REPORT ON NETWORK MONITORING SYSTEMS (Nagios and Zabbix) JANUARY 2010 Phase II -Network Monitoring System- Copyright The government
Customer Tips. Configuration and Use of the MeterAssistant Option. for the user. Purpose. Xerox Device Configuration. Xerox Multifunction Devices
 Xerox Multifunction Devices Customer Tips June 21, 2006 This document applies to the Xerox products This indicated document in the applies table to below. these For Xerox some products: products, it is
Using Actions and Alerts
 Using Actions and Alerts Depending on the responses received from polling, or the types of messages received, WhatsUp Gold can be set up to fire actions to notify you of any change on your network. Actions
ITSM Service Monitoring Using Open Source Tools
 ITSM Service Monitoring Using Open Source Tools Presented to University of Utah I.T. Managers Monthly Meeting August 3, 2011 ITSM and Service Monitoring INFORMATION TECHNOLOGY SERVICE MANAGEMENT IT Service
Setting Up A Nagios Monitoring System Warren Block, May 2005
 Setting Up A Nagios Monitoring System Warren Block, May 2005 What Is Nagios? NAGIOS (na gee ose) is a system that will monitor the status of other network computers or components. It can watch your network
Deploying the BIG-IP LTM with the Cacti Open Source Network Monitoring System
 DEPLOYMENT GUIDE Deploying the BIG-IP LTM with the Cacti Open Source Network Monitoring System Version 1.0 Deploying F5 with Cacti Open Source Network Monitoring System Welcome to the F5 and Cacti deployment
Monitoring and Alerting
 Monitoring and Alerting All the things I've tried that didn't work, plus a few others. By Aaron S. Joyner Senior System Administrator Google, Inc. Blackbox vs Whitebox Blackbox: Requires no participation
3M Command Center. Installation and Upgrade Guide
 3M Command Center Installation and Upgrade Guide Copyright 3M, 2015. All rights reserved., 78-8129-3760-1d 3M is a trademark of 3M. Microsoft, Windows, Windows Server, Windows Vista and SQL Server are
PA File Sight. Version 5.5 Ultra. Last Update: August 20, 2014. Power Admin LLC. support@poweradmin.com www.poweradmin.com Prepared in the USA
 PA File Sight Version 5.5 Ultra Last Update: August 20, 2014 Power Admin LLC support@poweradmin.com www.poweradmin.com Prepared in the USA Power Admin and the PowerAdmin.com web site are 2002 2014 Power
A FAULT MANAGEMENT WHITEPAPER
 ManageEngine OpManager A FAULT MANAGEMENT WHITEPAPER Fault Management Perception The common perception of fault management is identifying all the events. This, however, is not true. There is more to it
Open Source in the Data Centre. John Ferlito Bulletproof Networks
 Open Source in the Data Centre John Ferlito Bulletproof Networks About Me Experience Previous Engineer, ZipWorld (ISP) Senior Engineer, Pacific Internet (ISP) Current Technical Guru, linux.conf.au 2007
Maintaining Non-Stop Services with Multi Layer Monitoring
 Maintaining Non-Stop Services with Multi Layer Monitoring Lahav Savir System Architect and CEO of Emind Systems lahavs@emindsys.com www.emindsys.com The approach Non-stop applications can t leave on their
WHITE PAPER September 2012. CA Nimsoft For Network Monitoring
 WHITE PAPER September 2012 CA Nimsoft For Network Monitoring Table of Contents EXECUTIVE SUMMARY 3 Solution overview 3 CA Nimsoft Monitor specialized probes 3 Network and application connectivity probe
SMT v4.0 Users Guide (Linux version)
") SMT v4.0 Users Guide (Linux version) Table of Contents 1. Manage Customer Billing 2. Provision Web Services a. Add a virtual host b. Password protect a directory c. Enable virtual host logs d. Change password
SMT v4.0 Users Guide (Linux version) Table of Contents 1. Manage Customer Billing 2. Provision Web Services a. Add a virtual host b. Password protect a directory c. Enable virtual host logs d. Change password
Assignment One. ITN534 Network Management. Title: Report on an Integrated Network Management Product (Solar winds 2001 Engineer s Edition)
") Assignment One ITN534 Network Management Title: Report on an Integrated Network Management Product (Solar winds 2001 Engineer s Edition) Unit Co-coordinator, Mr. Neville Richter By, Vijayakrishnan Pasupathinathan
Assignment One ITN534 Network Management Title: Report on an Integrated Network Management Product (Solar winds 2001 Engineer s Edition) Unit Co-coordinator, Mr. Neville Richter By, Vijayakrishnan Pasupathinathan
http://www.trendmicro.com/download
 Trend Micro Incorporated reserves the right to make changes to this document and to the products described herein without notice. Before installing and using the software, please review the readme files,
Volume SYSLOG JUNCTION. User s Guide. User s Guide
 Volume 1 SYSLOG JUNCTION User s Guide User s Guide SYSLOG JUNCTION USER S GUIDE Introduction I n simple terms, Syslog junction is a log viewer with graphing capabilities. It can receive syslog messages
IT Support Tracking with Request Tracker (RT)
") IT Support Tracking with Request Tracker (RT) Archibald Steiner AfNOG 2013 LUSAKA Overview What is RT? A bit of terminology Demonstration of the RT web interface Behind the scenes configuration options
IT Support Tracking with Request Tracker (RT) Archibald Steiner AfNOG 2013 LUSAKA Overview What is RT? A bit of terminology Demonstration of the RT web interface Behind the scenes configuration options
One software solution to monitor your entire network, including devices, applications traffic and availability.
 One software solution to monitor your entire network, including devices, applications traffic and availability. About Britannic Expert Integrators We are award winning specialists in IP communications,
[D-View 7 Advanced Hands-On Practice] Version 1.0
![[D-View 7 Advanced Hands-On Practice] Version 1.0](/thumbs/26/8760364.jpg "[D-View 7 Advanced Hands-On Practice] Version 1.0") [D-View 7 Advanced Hands-On Practice] Version 1.0 Agenda Batch Management Dashboard Management D-View 7 System Management D-View 7 System Troubleshooting 2 Agenda Batch Management Dashboard Management
[D-View 7 Advanced Hands-On Practice] Version 1.0 Agenda Batch Management Dashboard Management D-View 7 System Management D-View 7 System Troubleshooting 2 Agenda Batch Management Dashboard Management
Network Monitoring. Easy, failsafe, and complete visibility of your network. Our customers have the same view as our NOC technicians.
 One software solution to monitor your entire network, including devices, applications, traffic, and availability. Network monitoring is the constant evaluation fo your systems performance within the IT
WHITE PAPER OCTOBER 2014. CA Unified Infrastructure Management for Networks
 WHITE PAPER OCTOBER 2014 CA Unified Infrastructure Management for Networks 2 WHITE PAPER: CA UNIFIED INFRASTRUCTURE MANAGEMENT FOR NETWORKS ca.com Table of Contents Solution Overview 3 Specialized Probes
Notes on network monitoring, by Oliver Gorwits
 hm. I've lost a machine.. literally *lost*. It responds to ping, it works completely, I just can't figure out where in my apartment it is. -- bash.org #5273 Notes on network monitoring, by Oliver
Kaseya 2. Quick Start Guide. for Network Monitor 4.1
 Kaseya 2 Syslog Monitor Quick Start Guide for Network Monitor 4.1 June 5, 2012 About Kaseya Kaseya is a global provider of IT automation software for IT Solution Providers and Public and Private Sector
W3Perl A free logfile analyzer
 W3Perl A free logfile analyzer Features Works on Unix / Windows / Mac View last entries based on Perl scripts Web / FTP / Squid / Email servers Session tracking Others log format can be added easily Detailed
USING OPEN SOURCE SOFTWARE IN DAILY ISP OPERATIONS
 USING OPEN SOURCE SOFTWARE IN DAILY ISP OPERATIONS Yaman Hakmi Systems Engineer yhakmi@cisco.com v3.0 October 29, 2009 Agenda Introduction ISP Operational Background ISP Operational Challenges Open-source
Net Inspector Performance Manager 2015
 MG-SOFT Corporation Net Inspector Performance Manager 2015 USER MANUAL (Document Version: 10.6) Document published on October 16, 2015 Copyright 1995-2015 MG-SOFT Corporation Introduction In order to improve
CAREN NOC MONITORING AND SECURITY
 CAREN CAREN Manager: Zarlyk Jumabek uulu 1-2 OCTOBER 2014 ALMATY, KAZAKHSTAN Copyright 2010 CAREN / Doc ID : PS01102014 / Address : Chui ave, 265a, Bishkek, The Kyrgyz Republic Tel: +996 312 900275 website:
ManageEngine (division of ZOHO Corporation) www.manageengine.com. Infrastructure Management Solution (IMS)
 www.manageengine.com. Infrastructure Management Solution (IMS)") ManageEngine (division of ZOHO Corporation) www.manageengine.com Infrastructure Management Solution (IMS) Contents Primer on IM (Infrastructure Management)... 3 What is Infrastructure Management?... 3
ManageEngine (division of ZOHO Corporation) www.manageengine.com Infrastructure Management Solution (IMS) Contents Primer on IM (Infrastructure Management)... 3 What is Infrastructure Management?... 3
SERVICE LEVEL AGREEMENT
 SERVICE LEVEL AGREEMENT This service level agreement ( SLA ) is incorporated into the master services agreement ( MSA ) and applies to all services delivered to customers. This SLA does not apply to the
IBM Tivoli Monitoring Version 6.3 Fix Pack 2. Windows OS Agent Reference
 IBM Tioli Monitoring Version 6.3 Fix Pack 2 Windows OS Agent Reference IBM Tioli Monitoring Version 6.3 Fix Pack 2 Windows OS Agent Reference Note Before using this information and the product it supports,
OMNITURE MONITORING. Ensuring the Security and Availability of Customer Data. June 16, 2008 Version 2.0
 Ensuring the Security and Availability of Customer Data June 16, 2008 Version 2.0 CHAPTER 1 1 Omniture Monitoring The Omniture Network Operations (NetOps) team has built a highly customized monitoring
Chapter 15: Advanced Networks
 Chapter 15: Advanced Networks IT Essentials: PC Hardware and Software v4.0 1 Determine a Network Topology A site survey is a physical inspection of the building that will help determine a basic logical
Monitoring Your Enterprise PACS With Nagios, Cacti And Smokeping
 Monitoring Your Enterprise PACS With Nagios, Cacti And Smokeping Ron Sweeney, Engineer 2 ClubPACS Western Michigan Drafted: 09/02/04 Revised: 11/03/04 back cover Index 1 Introduction... 2 1.1 What we are
Healthstone Monitoring System
 Healthstone Monitoring System Patrick Lambert v1.1.0 Healthstone Monitoring System 1 Contents 1 Introduction 2 2 Windows client 2 2.1 Installation.............................................. 2 2.2 Troubleshooting...........................................
Bandwidth Management. Chris Wilson Aptivate Ltd, UK AfNOG 2010
 Bandwidth Management Chris Wilson Aptivate Ltd, UK AfNOG 2010 Ingredients What is bandwidth management When to manage bandwidth Troubleshooting an Internet connection Monitoring an Internet connection
Virtual Web Appliance Setup Guide
 Virtual Web Appliance Setup Guide 2 Sophos Installing a Virtual Appliance Installing a Virtual Appliance This guide describes the procedures for installing a Virtual Web Appliance. If you are installing
TOTAL VIEW ONE Technical FAQ
 TOTAL VIEW ONE Technical FAQ System Overview What kind of data does TVO provide and how is it effectively delivered? TVO mirrors and records the state of every connection to deliver actionable real-time
Enterprise Manager. Version 6.2. Installation Guide
 Enterprise Manager Version 6.2 Installation Guide Enterprise Manager 6.2 Installation Guide Document Number 680-028-014 Revision Date Description A August 2012 Initial release to support version 6.2.1
A recipe using an Open Source monitoring tool for performance monitoring of a SaaS application.
 A recipe using an Open Source monitoring tool for performance monitoring of a SaaS application. Sergiy Fakas, TOA Technologies Nagios is a popular open-source tool for fault-monitoring. Because it does
42goISP Documentation
 42goISP Documentation 42goISP Documentation I Table of Contents General...1 1 What is 42goISP?...1 2 Terms and structure of the manual...1 3 Installation/Upgrade/Deinstallation...1 3.1 Installation...1
McAfee SIEM Alarms. Setting up and Managing Alarms. Introduction. What does it do? What doesn t it do?
 McAfee SIEM Alarms Setting up and Managing Alarms Introduction McAfee SIEM provides the ability to send alarms on a multitude of conditions. These alarms allow for users to be notified in near real time
COMMANDS 1 Overview... 1 Default Commands... 2 Creating a Script from a Command... 10 Document Revision History... 10
 LabTech Commands COMMANDS 1 Overview... 1 Default Commands... 2 Creating a Script from a Command... 10 Document Revision History... 10 Overview Commands in the LabTech Control Center send specific instructions
What s new in ProactiveWatch 2.1!
 What s new in ProactiveWatch 2.1! 1. ProactiveWatch 2.1 brings tighter integration with the RemoteCommand (FreeMyIT) system, providing new Task Manager -like features available from Manage Computers, including
MONITORING RED HAT GLUSTER SERVER DEPLOYMENTS With the Nagios IT infrastructure monitoring tool
 TECHNOLOGY DETAIL MONITORING RED HAT GLUSTER SERVER DEPLOYMENTS With the Nagios IT infrastructure monitoring tool INTRODUCTION Storage system monitoring is a fundamental task for a storage administrator.
User s Manual. Management Software for Inverter
 WatchPower User s Manual Management Software for Inverter Table of Contents 1. WatchPower Overview... 2 1.1. Introduction... 2 1.2. Features... 2 2. WatchPower Install and Uninstall... 2 2.1. System Requirement...
Integration Guide. Help Desk Authority, Perspective and sl360. 1.800.424.9411 www.scriptlogic.com
 Integration Guide Help Desk Authority, Perspective and sl360 1.800.424.9411 www.scriptlogic.com Table of Contents Introduction... 3 Product Overview... 3 Benefits of Product Integration... 3 Advanced Help
Details. Some details on the core concepts:
 Details Some details on the core concepts: Network documentation Diagnostic tools Monitoring tools Performance tools Active and passive tools SNMP Ticket systems Configuration and change management Documentation
Optimization of QoS for Cloud-Based Services through Elasticity and Network Awareness
 Master Thesis: Optimization of QoS for Cloud-Based Services through Elasticity and Network Awareness Alexander Fedulov 1 Agenda BonFIRE Project overview Motivation General System Architecture Monitoring
DiskPulse DISK CHANGE MONITOR
 DiskPulse DISK CHANGE MONITOR User Manual Version 7.9 Oct 2015 www.diskpulse.com info@flexense.com 1 1 DiskPulse Overview...3 2 DiskPulse Product Versions...5 3 Using Desktop Product Version...6 3.1 Product
Virtual Managment Appliance Setup Guide
 Virtual Managment Appliance Setup Guide 2 Sophos Installing a Virtual Appliance Installing a Virtual Appliance As an alternative to the hardware-based version of the Sophos Web Appliance, you can deploy
Network Monitoring and Management Tutorial: SANOG 2015
 Network Monitoring and Management Tutorial: SANOG 2015 These materials are licensed under the Creative Commons Attribution-Noncommercial 3.0 Unported license (http://creativecommons.org/licenses/by-nc/3.0/)
Network Monitoring. Review of Software
 Network Monitoring Review of Software Components Network Discovery Availability monitoring Alerting system Service Monitoring Network Performance Asset Control Version Control Configuration Management
AXIGEN Mail Server Reporting Service
 AXIGEN Mail Server Reporting Service Usage and Configuration The article describes in full details how to properly configure and use the AXIGEN reporting service, as well as the steps for integrating it
Creating Basic Custom Monitoring Dashboards Antonio Mangiacotti, Stefania Oliverio & Randy Allen
 Creating Basic Custom Monitoring Dashboards by Antonio Mangiacotti, Stefania Oliverio & Randy Allen v1.1 Introduction With the release of IBM Tivoli Monitoring 6.3 and IBM Dashboard Application Services
Kaseya Traverse. Kaseya Product Brief. Predictive SLA Management and Monitoring. Kaseya Traverse. Service Containers and Views
 Kaseya Product Brief Kaseya Traverse Predictive SLA Management and Monitoring Kaseya Traverse Traverse is a breakthrough cloud and service-level monitoring solution that provides real time visibility into
Network performance overview. TEIN2 Bangkok September 2005
 Network performance overview TEIN2 Bangkok September 2005 Agenda Network performance RRDtool Cacti (RRDtool Front-end) Network performance monitoring MRTG The first, open-source, easy to use performance
Company & Solution Profile
 Company & Solution Profile About Us NMSWorks Software Limited is an information technology company specializing in developing Carrier grade Integrated Network Management Solutions for the emerging convergent
NetCrunch 6. AdRem. Network Monitoring Server. Document. Monitor. Manage
 AdRem NetCrunch 6 Network Monitoring Server With NetCrunch, you always know exactly what is happening with your critical applications, servers, and devices. Document Explore physical and logical network
Kaseya 2. Quick Start Guide. for Network Monitor 4.1
 Kaseya 2 VMware Performance Monitor Quick Start Guide for Network Monitor 4.1 June 7, 2012 About Kaseya Kaseya is a global provider of IT automation software for IT Solution Providers and Public and Private