Network and Server Statistics Using Cacti
|
|
|
- Lynne Pierce
- 8 years ago
- Views:
Transcription
1 Network Management & Monitoring Network and Server Statistics Using Cacti These materials are licensed under the Creative Commons Attribution-Noncommercial 3.0 Unported license (

2 Introduction Network Monitoring Tools Availability Reliability Performance Cacti monitors the performance and usage of devices.

3 Introduction A tool to monitor, store and present network and system/server statistics Designed around RRDTool with a special emphasis on the graphical interface Almost all of Cacti's functionality can be configured via the Web. You can find Cacti here:

4 Introduction Cacti: Uses RRDtool, PHP and stores data in MySQL. It supports the use of SNMP and graphics with MRTG. Cacti is a complete frontend to RRDTool, it stores all of the necessary information to create graphs and populate them with data in a MySQL database. The frontend is completely PHP driven. Along with being able to maintain Graphs, Data Sources, and Round Robin Archives in a database, cacti handles the data gathering. There is also SNMP support for those used to creating traffic graphs with MRTG.

5 General Description 1. Cacti is written as a group of PHP scripts. 2. The key script is poller.php, which runs every 5 minutes (by default). It resides in /usr/share/cacti/site. 3. To work poller.php needs to be in /etc/cron.d/cacti like this: MAILTO=root */5 * * * * www-data php /usr/share/cacti/site/poller.php >/dev/null 2>/var/log/cacti/poller-error.log 4. Cacti uses RRDtool to create graphs for each device and data that is collected about that device. You can adjust all of this from within the Cacti web interface. 5. The RRD files are located in /var/lib/cacti/rra when cacti is installed from packages.

6 Advantages You can measure Availability, Load, Errors and more all with history. Cacti con view your router and switch interfaces and their traffic, including all error traffic as well. Cacti can measure drive capacity, CPU load (network h/w and servers) and much more. It can react to conditions and send notifications based on specified ranges. Graphics Allows you to use all the functionality of rrdgraph to define graphics and automate how they are displayed. Allows you to organize information in hierarchical tree structures. Data Sources Permits you to utilize all the functions of rrdcreate and rrdupdate including defining several sources of information for each RRD file.

7 Advantages cont. Data Collection Supports SNMP including the use of php-snmp or net-snmp Data sources can be updated via SNMP or by defining scripts to capture required data. An optional component, cactid, implements SNMP routines in C with multi-threading. Critical for very large installations. Templates You can create templates to reutilize graphics definitions, data and device sources Cacti Plugin Architecture Extends Cacti functionality. Many, many plugins are available. User Management You can manage users locally or via LDAP and you can assign granular levels of authorization by user or groups of users.

8 Disadvantages Configuration of Interfaces is Tedious Configuration of Plugin Architecture is non-trivial Upgrading versions con be complex Advice: For continuous use or large installations it is likely that you will be using scripts and tools to automate the configuration of Cacti.

9 Steps to add and monitor devices Before we install Cacti we demonstrate how to use the interface to add and monitor some devices

10 Adding a Device Management -> Devices -> Add Specify device attributes We ll add an entry for our gateway router, gw.ws.nsrc.org* *Actual device name may be different.

11 Add Devices: 2
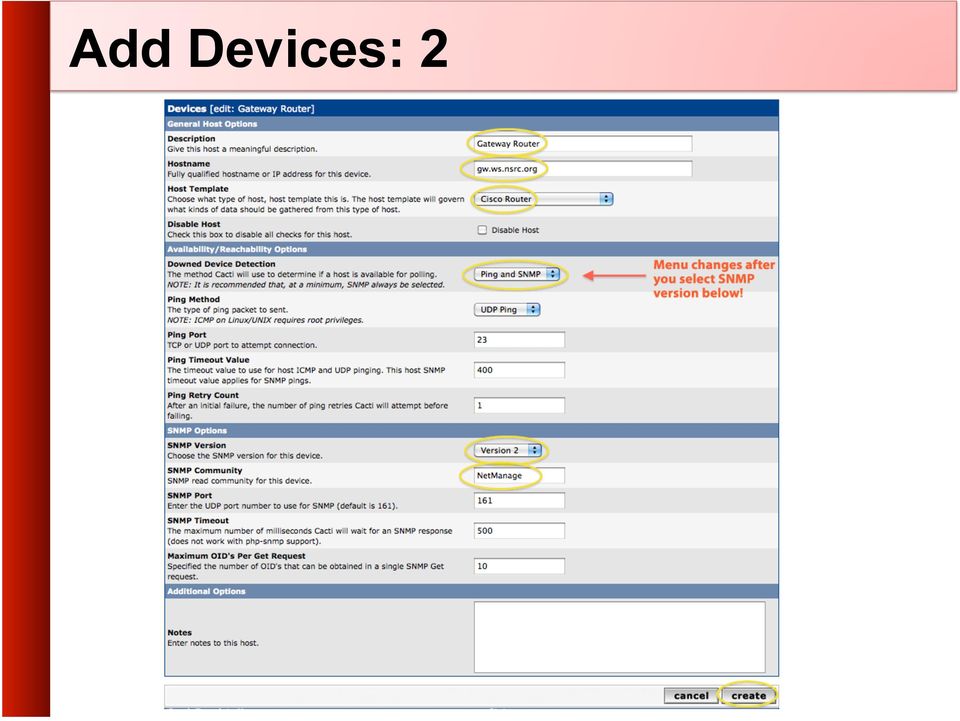
12 Add Devices: 3 Choose SNMP version 2 for this workshop. For Downed Device Detection we recommend either using Ping and SNMP, or just Ping. Use NetManage for the SNMP Community string. SNMP access is a security issue: - Version 2 is not encrypted - Watch out for globally readable public communities - Be careful about who can access r/w communities. - Replace xxxxxxx with your local public r/o string

13 Add Devices: 4 For a router you may see a lot of potential network interfaces that are detected by SNMP. Your decision is to create graphs for all of these are not. Generally the answer is, Yes Why?

14 Create Graphics Chose the Create graphs for this host Under Graph Templates generally check the top box that chooses all the available graphs to be displayed. Press Create. You can change the default colors, but the predefined definitions generally work well.

15 Create Graphics: 2

16 Create Graphics: 3

17 Create Graphics: 4 You ll see this screen later when you are creating graphics for hosts vs. routers

18 View the Graphics Place the new device in its proper location in your tree hierarchy. Building your display hierarchy is your decision. It might make sense to try drawing this out on paper first. Under Management Graph Trees select the Default Tree hierarchy (or, create one of your own).

19 Graphics Tree First, press Add if you want a new graphing tree: Second, name your tree, choose the sorting order (the author likes Natural Sorting and press create :

20 Graphics Tree Third, add devices to your new tree: Once you click Add you can add Headers (separators), graphs or hosts. Now we'll add Hosts to our newly created graph tree:

21 Graphics Tree with 2 Devices Our graphics tree just after the first two devices were added. So far, no graphics are displayed the first graphics can take up to 5 minutes to display. Cacti graphs are stored on disk and updated using RRDTool via the poller.php script, which, by default, is run every five minutes using cron.
22 Initial Graphs
23 Over time you ll see tendencies
24 Next Steps You can extend cacti by installing the Cacti Plugin Architecture: There are a number of popular Cacti plugins, such as: - Settings - thold - PHP Weathermap A good place to start is and Google. To send to RT from Cacti via rt-mailgate you can use the Cacti settings plugin:
25 Conclusions Cacti is very flexible due to its use of templates. Once you understand the concepts behind RRDTool, then how Cacti works should be (more or less) intuitive. The visualization hierarchy of devices helps to organize and discover new devices quickly. It is not easy to do a rediscover of devices. To add lots of devices requires lots of time and effort. Software such as Netdot, Netdisco, IPPlan, TIPP can help as well as local scripts that update the Cacti backend MySQL database directly.
26 References Cacti Web Site: Cacti Discussion Group: Cacti Users Plugin Architecture Home Instructions to Install Cacti from Source and configure the thold and settings plugins are available on the class wiki
27 Cacti Demonstration Before we install Cacti we are going to do a live demonstration of how to use the Cacti interface to add and monitor a few devices.
28 Cacti Installation and Configuration
29 Exercises Your Mission... Install Cacti Create device entry for your local router Create device entries for your local servers Create graphs for each item Place PCs, Routers, Switches in a tree hierarchy of your design. If you have time Create device entries for any additional network equipment in the classroom. Use SNMP for all items. Use the Network Diagram on the class wiki as a reference.
30 Installation: Ubuntu Server Available in RPM form and packages for Gentoo, Red Hat, Fedora, SuSE, FreeBSD, etc. It is necessary to install cactid separately if you wish to use this for larger installations. This is the cacti-spine package in Ubuntu. In Ubuntu/Debian (we d do this on our local machines:) # apt-get install cacti
31 Installation: 2 We may have already done this for you. If so, you can use these slides for informational purposes. Skip to the Cacti Web installation steps to continue Use the workshop password for your sysadm user
32 Installation: 3 Again, use the workshop password
33 Installation: 4 Informational message. Is not normally an issue.
34 Installation: 5 We are using Apache2. Be sure this is chosen then highlight <Ok> and press <ENTER> to continue.
35 Installation: 6 Choose <Yes>
36 Installation: 7 Use our workshop password. Do no use a different password. You can break later exercises.
37 Installation: 8 Again, use the workshop password.
38 Installation: 9 Finally, one last time, use the workshop password.
39 Cacti: Installation - Web Now use a web browser and open the following address: You will see the following...
40 Cacti: Installation - Web Press Next >>
41 Cacti: Installation - Web Choose New Install and press Next >> again.
42 Cacti: Installation - Web Your screen should look like this. If it does not ask your instructor for help. Press Finish Note! Be sure that RRDTool 1.3.x (or higher) is chosen and not 1.0.x.
43 Cacti: First Time Login First time login use: User Name: admin Password: admin
44 Cacti: Change Default Password Now you must change the admin password. Please use the workshop password.
Network and Server Statistics Using Cacti
 Network Management & Monitoring Network and Server Statistics Using Cacti These materials are licensed under the Creative Commons Attribution-Noncommercial 3.0 Unported license (http://creativecommons.org/licenses/by-nc/3.0/)
Network and Server Statistics using Cacti
 Network and Server Statistics using Cacti PacNOG 6 November 2009 Hervey Allen Carlos Vicente Introduction A tool to monitor, store and present network and system/server statistics Designed around RRDTool
Cacti complete network graphing solution. Oz Melamed E&M Computing Jun 2009
 Cacti complete network graphing solution Oz Melamed E&M Computing Jun 2009 About Cacti Cacti is a complete network graphing solution designed to harness the power of RRDTool's data storage and graphing
Install Cacti Network Monitoring Tool on CentOS 6.4 / RHEL 6.4 / Scientific Linux 6.4
 Install Cacti Network Monitoring Tool on CentOS 6.4 / RHEL 6.4 / Scientific Linux 6.4 by SK Cacti is an open source, front-end for the data logging tool called RRDtool. It is a web based network monitoring
Ticketing Systems with RT
 Network Management & Monitoring Ticketing Systems with RT These materials are licensed under the Creative Commons Attribution-Noncommercial 3.0 Unported license (http://creativecommons.org/licenses/by-nc/3.0/)
Network Management & Monitoring Ticketing Systems with RT
 Network Management & Monitoring Ticketing Systems with RT These materials are licensed under the Creative Commons Attribution-Noncommercial 3.0 Unported license (http://creativecommons.org/licenses/by-nc/3.0/)
How To Create A Ticketing System With Rt.Org
 Ticketing Systems with RT Jonathan Brewer Network Startup Resource Center jon@nsrc.org These materials are licensed under the Creative Commons Attribution-NonCommercial 4.0 International license (http://creativecommons.org/licenses/by-nc/4.0/)
Details. Some details on the core concepts:
 Details Some details on the core concepts: Network documentation Diagnostic tools Monitoring tools Performance tools Active and passive tools SNMP Ticket systems Configuration and change management Documentation
Newton Linux User Group Graphing SNMP with Cacti and RRDtool
 Newton Linux User Group Graphing SNMP with Cacti and RRDtool Summary: Cacti is an interface that can be used to easily manage the graphing of SNMP data. These graphs allow you to visualize performance
Network Documentation & Netdot
 Network Monitoring and Management Network Documentation & Netdot These materials are licensed under the Creative Commons Attribution-Noncommercial 3.0 Unported license (http://creativecommons.org/licenses/by-nc/3.0/)
System Monitoring Using NAGIOS, Cacti, and Prism.
 System Monitoring Using NAGIOS, Cacti, and Prism. Thomas Davis, NERSC and David Skinner, NERSC ABSTRACT: NERSC uses three Opensource projects and one internal project to provide systems fault and performance
Результат запроса: Cacti weathermap
 Результат запроса: Cacti weathermap Weathermap is a network visualisation tool, to take data you already have in MRTG, Cacti or any other RRDtool-based monitoring system, and show you an overview of. Supported
Deploying the BIG-IP LTM with the Cacti Open Source Network Monitoring System
 DEPLOYMENT GUIDE Deploying the BIG-IP LTM with the Cacti Open Source Network Monitoring System Version 1.0 Deploying F5 with Cacti Open Source Network Monitoring System Welcome to the F5 and Cacti deployment
Monitoring disk stats with Cacti
 Monitoring disk stats with Cacti February 13, 2013 Contents 1 Disk space utilisation 1 1.1 hrstoragetable (.1.3.6.1.2.1.25.2.3)................. 2 1.2 dsktable (.1.3.6.1.4.1.2021.9)....................
Do you know how your TSM environment is evolving?
 Trend reporting for Tivoli Storage Manager Holger Speh Consulting IT Specialist Do you know how your TSM environment is evolving? Healthy? Well integrated? Data Growth? Accounting? 2 2 Historical Reporting
Network Monitoring. Review of Software
 Network Monitoring Review of Software Components Network Discovery Availability monitoring Alerting system Service Monitoring Network Performance Asset Control Version Control Configuration Management
Network Monitoring & Management Measuring Delay with Smokeping
 Network Monitoring & Management Measuring Delay with Smokeping Network Startup Resource Center www.nsrc.org These materials are licensed under the Creative Commons Attribution-NonCommercial 4.0 International
Using Cacti To Graph MySQL s Metrics
 Using Cacti To Graph MySQL s Metrics Kenny Gryp kenny.gryp@percona.com Principal Consultant @ Percona Collaborate 2011 1 Percona MySQL/LAMP Consulting MySQL Support Percona Server (XtraDB) Percona XtraBackup
USING OPEN SOURCE SOFTWARE IN DAILY ISP OPERATIONS
 USING OPEN SOURCE SOFTWARE IN DAILY ISP OPERATIONS Yaman Hakmi Systems Engineer yhakmi@cisco.com v3.0 October 29, 2009 Agenda Introduction ISP Operational Background ISP Operational Challenges Open-source
Your eyes in the network
 Your eyes in the network init.at informationstechnologie GmbH Tannhäuserplatz 2/5.OG 1150 Wien Austria Page 2 of 10 1 Table of contents 2 Why NOCTUA by init.at... 3 3 Your benefits with NOCTUA:... 4 4
Network Management & Monitoring
 Network Management & Monitoring Smokeping - Part I Contents 0.1 Exercises............................... 1 0.2 1. Install Smokeping......................... 1 0.3 2. Initial Configuration........................
Robust & Reliable DNS Operations Logging & Monitoring
 Robust & Reliable DNS Operations Logging & Monitoring These materials are licensed under the Creative Commons Attribution-Noncommercial 3.0 Unported license (http://creativecommons.org/licenses/by-nc/3.0/)
Network Monitoring and Management Introduction to Networking Monitoring and Management
 Network Monitoring and Management Introduction to Networking Monitoring and Management These materials are licensed under the Creative Commons Attribution-Noncommercial 3.0 Unported license (http://creativecommons.org/licenses/by-nc/3.0/)
Network Management & Monitoring Request Tracker (RT) Installation and Configuration
 Installation and Configuration") Network Management & Monitoring Request Tracker (RT) Installation and Configuration Notes: Commands preceded with "$" imply that you should execute the command as a general user - not as root. Commands
Network Management & Monitoring Request Tracker (RT) Installation and Configuration Notes: Commands preceded with "$" imply that you should execute the command as a general user - not as root. Commands
Grids & networks monitoring - practical approach
 Session 2 Networking for the Grid Grids & networks monitoring - practical approach Jedrzej Jajor Cezary Mazurek Wiktor Procyk INGRID 2007 Instrumenting the Grid Outline Introduction to monitoring Tools:
Introduction to Network Monitoring and Management
 Introduction to Network Monitoring and Management Jonathan Brewer Network Startup Resource Center jon@nsrc.org These materials are licensed under the Creative Commons Attribution-NonCommercial 4.0 International
Network performance overview. TEIN2 Bangkok September 2005
 Network performance overview TEIN2 Bangkok September 2005 Agenda Network performance RRDtool Cacti (RRDtool Front-end) Network performance monitoring MRTG The first, open-source, easy to use performance
May 2002 16PZ-0502A-WWEN Prepared by: Internet & E-Commerce Solutions
 May 2002 Prepared by: Internet & E-Commerce Solutions Contents Introduction... 3 Solution Overview... 3 Obtaining Compaq Management Agents (CMA) for Linux... 3 Integrating Compaq Management Agents MIBs
CARENET-SE. NOC Tools Review. Communication System Design Summer 2010. Project team. Champion Björn Pehrson Coach Hans Eriksson
 NOC Tools Review CARENET-SE Communication System Design Summer 2010 Project team IK2207 Alin Pastrama pastrama@kth.se Champion Björn Pehrson Coach Hans Eriksson IK2207 Annika Holmgren annika.holmgren@gmail.com
Monitoring MySQL. Presented by, MySQL & O Reilly Media, Inc. A quick overview of available tools
 Monitoring MySQL Presented by, MySQL & O Reilly Media, Inc. A quick overview of available tools Monitoring! Monitoring your database is as important as benchmarking! You want to view trends over time!
NRC Publications Archive Archives des publications du CNRC
 NRC Publications Archive Archives des publications du CNRC for Network Traffic Graphing Conway, C. For the publisher s version, please access the DOI link below./ Pour consulter la version de l éditeur,
Network Monitoring and Management Introduction to Networking Monitoring and Management
 Network Monitoring and Management Introduction to Networking Monitoring and Management These materials are licensed under the Creative Commons Attribution-Noncommercial 3.0 Unported license (http://creativecommons.org/licenses/by-nc/3.0/)
Introduction to Network Monitoring and Management
 Introduction to Network Monitoring and Management Network Startup Resource Center www.nsrc.org These materials are licensed under the Creative Commons Attribution-NonCommercial 4.0 International license
Cacti-ReportItv0.6.1. A small introduction to the use of ReportIt
 Cacti-ReportItv0.6.1 A small introduction to the use of ReportIt Copyright (c) 2009 Andreas Braun Permission is granted to copy, distribute and/or modify this document under the terms of the GNU Free Documentation
There are numerous ways to access monitors:
 Remote Monitors REMOTE MONITORS... 1 Overview... 1 Accessing Monitors... 1 Creating Monitors... 2 Monitor Wizard Options... 11 Editing the Monitor Configuration... 14 Status... 15 Location... 17 Alerting...
CS197U: A Hands on Introduction to Unix
 CS197U: A Hands on Introduction to Unix Lecture 4: My First Linux System J.D. DeVaughn-Brown University of Massachusetts Amherst Department of Computer Science jddevaughn@cs.umass.edu 1 Reminders After
Maintaining Non-Stop Services with Multi Layer Monitoring
 Maintaining Non-Stop Services with Multi Layer Monitoring Lahav Savir System Architect and CEO of Emind Systems lahavs@emindsys.com www.emindsys.com The approach Non-stop applications can t leave on their
Acronis Monitoring Service
 Acronis Monitoring Service USER GUIDE Table of contents 1 About the Acronis Monitoring Service...4 2 Software Requirements...4 3 Understanding basic concepts...5 4 Getting started...7 4.1 Setting up website
MRTG / RRDTool. Network Management Workshop. June 2009 Papeete, French Polynesia
 MRTG / RRDTool Network Management Workshop June 2009 Papeete, French Polynesia MRTG The Multi Router Traffic Grapher (MRTG) is a tool to monitor the traffic load on network-links. MRTG generates HTML pages
NMS300 Network Management System
 NMS300 Network Management System User Manual June 2013 202-11289-01 350 East Plumeria Drive San Jose, CA 95134 USA Support Thank you for purchasing this NETGEAR product. After installing your device, locate
CAREN NOC MONITORING AND SECURITY
 CAREN CAREN Manager: Zarlyk Jumabek uulu 1-2 OCTOBER 2014 ALMATY, KAZAKHSTAN Copyright 2010 CAREN / Doc ID : PS01102014 / Address : Chui ave, 265a, Bishkek, The Kyrgyz Republic Tel: +996 312 900275 website:
Application Notes for Configuring Dorado Software Redcell Enterprise Bundle using SNMP with Avaya Communication Manager - Issue 1.
 Avaya Solution & Interoperability Test Lab Application Notes for Configuring Dorado Software Redcell Enterprise Bundle using SNMP with Avaya Communication Manager - Issue 1.0 Abstract These Application
Advanced Science and Technology Institute Department of Science and Technology
 PAWIKAN: A Scalable Network Management System for the Philippine Research, Education, and Government Information Network (PREGINET) http://pawikan.sourceforge.net Authors: Edwin Vinas, Jerremeo Gabas,
NOCTUA by init.at THE FLEXIBLE MONITORING WEB FRONTEND
 NOCTUA by init.at THE FLEXIBLE MONITORING WEB FRONTEND init.at informationstechnologie GmbH - Tannhäuserplatz 2 - A-1150 Wien - www.init.at Dieses Dokument und alle Teile von ihm bilden ein geistiges Eigentum
A simple name for your cluster brain
 A simple name for your cluster brain init.at informationstechnologie GmbH Tannhäuserplatz 2/5.OG 1150 Wien Austria Page 2 of 10 1 Table of contents 2 Why CORVUS by init.at... 3 3 Your advantages with CORVUS...
Cacti 0.8 Network Monitoring
 Cacti 0.8 Network Monitoring Dinangkur Kundu S. M. Ibrahim Lavlu Chapter No. 4 "Creating and Using Templates" In this package, you will find: A Biography of the authors of the book A preview chapter from
Monitoring Network Availablity Using Nagios
 Mohammedadem Abdulkadir Monitoring Network Availablity Using Nagios Helsinki Metropolia University of Applied Sciences Bachelor of Engineering Information Technology Thesis 5 May 2015 Abstract Author(s)
CTERA Agent for Linux
 User Guide CTERA Agent for Linux September 2013 Version 4.0 Copyright 2009-2013 CTERA Networks Ltd. All rights reserved. No part of this document may be reproduced in any form or by any means without written
Welcome to Collage (Draft v0.1)
") Welcome to Collage (Draft v0.1) Table of Contents Welcome to Collage (Draft v0.1)... 1 Table of Contents... 1 Overview... 2 What is Collage?... 3 Getting started... 4 Searching for Images in Collage...
Welcome to Collage (Draft v0.1) Table of Contents Welcome to Collage (Draft v0.1)... 1 Table of Contents... 1 Overview... 2 What is Collage?... 3 Getting started... 4 Searching for Images in Collage...
GRNET NOC network monitoring & visualization tools
 http://www.grnet.gr GRNET NOC network monitoring & TF-NOC Zurich Alex Kosiaris (alex@noc.grnet.gr) Leonidas Poulopoulos (leopoul@noc.grnet.gr) Network monitoring Constant monitoring of network for components
AfNOG 2010 Network Monitoring and Management Tutorial. Introduction to Networking Monitoring and Management
 AfNOG 2010 Network Monitoring and Management Tutorial Introduction to Networking Monitoring and Management Part I: Overview Core concepts presented: What is network monitoring What is network management
WordPress Security Scan Configuration
 WordPress Security Scan Configuration To configure the - WordPress Security Scan - plugin in your WordPress driven Blog, login to WordPress as administrator, by simply entering the url_of_your_website/wp-admin
OnCommand Performance Manager 1.1
 OnCommand Performance Manager 1.1 Installation and Setup Guide For Red Hat Enterprise Linux NetApp, Inc. 495 East Java Drive Sunnyvale, CA 94089 U.S. Telephone: +1 (408) 822-6000 Fax: +1 (408) 822-4501
Network Management & Monitoring Overview
 Network Management & Monitoring Overview Advanced cctld Workshop September, 2008, Holland What is network management? System & Service monitoring Reachability, availability Resource measurement/monitoring
Kaseya 2. User Guide. for Network Monitor 4.1
 Kaseya 2 Ping Monitor User Guide for Network Monitor 4.1 June 5, 2012 About Kaseya Kaseya is a global provider of IT automation software for IT Solution Providers and Public and Private Sector IT organizations.
AfNOG-2013. Monitoring of IP Services. Ayitey Bulley Material generously borrowed from the NSRC NME course
 AfNOG-2013 Monitoring of IP Services Ayitey Bulley Material generously borrowed from the NSRC NME course Introduction To monitor or monitoring generally means to be aware of the state of a system. To observe
Configuring Color Access on the WorkCentre 7120 Using Microsoft Active Directory Customer Tip
 Configuring Color Access on the WorkCentre 7120 Using Microsoft Active Directory Customer Tip October 21, 2010 Overview This document describes how to limit access to color copying and printing on the
HPCC Monitoring and Reporting (Technical Preview) Boca Raton Documentation Team
 Boca Raton Documentation Team") HPCC Monitoring and Reporting (Technical Preview) Boca Raton Documentation Team HPCC Monitoring and Reporting (Technical Preview) Boca Raton Documentation Team Copyright 2015 HPCC Systems. All rights reserved
HPCC Monitoring and Reporting (Technical Preview) Boca Raton Documentation Team HPCC Monitoring and Reporting (Technical Preview) Boca Raton Documentation Team Copyright 2015 HPCC Systems. All rights reserved
Monitoring backbone networks
 R O N E N N M A N I A D U C A T I O E T W O R K Ro Net Edu Monitoring backbone networks Manuel Șubredu, Valeriu Vraciu RoEduNet Chișinău, September 9, 2014 Agenda Why? What? How? Tools? Facts! Why? A picture
USER GUIDE WEB-BASED SYSTEM CONTROL APPLICATION. www.pesa.com August 2014 Phone: 256.726.9200. Publication: 81-9059-0703-0, Rev. C
 USER GUIDE WEB-BASED SYSTEM CONTROL APPLICATION Publication: 81-9059-0703-0, Rev. C www.pesa.com Phone: 256.726.9200 Thank You for Choosing PESA!! We appreciate your confidence in our products. PESA produces
AKIPS Network Monitor Installation, Configuration & Upgrade Guide Version 15. AKIPS Pty Ltd
 AKIPS Network Monitor Installation, Configuration & Upgrade Guide Version 15 AKIPS Pty Ltd November 12, 2015 1 Copyright Copyright 2015 AKIPS Holdings Pty Ltd. All rights reserved worldwide. No part of
WÜRTHPHOENIX NetEye Version 3
 WÜRTHPHOENIX NetEye Release Note WÜRTHPHOENIX NetEye Version 3 Release date: March 2009 Overview of the updates and newly introduced functionalities in VS 3 In the following summaries, you can obtain a
PRiSM Security. Configuration and considerations
 PRiSM Security Configuration and considerations Agenda Security overview Authentication Adding a User Security Groups Security Roles Asset Roles Security Overview Three Aspects of Security Authentication
Free Network Monitoring Software for Small Networks
 Free Network Monitoring Software for Small Networks > WHITEPAPER Introduction Networks are becoming critical components of business success - irrespective of whether you are small or BIG. When network
Getting Started with PRTG Network Monitor 2012 Paessler AG
 Getting Started with PRTG Network Monitor 2012 Paessler AG All rights reserved. No parts of this work may be reproduced in any form or by any means graphic, electronic, or mechanical, including photocopying,
Installation documentation for Ulteo Open Virtual Desktop
 Installation documentation for Ulteo Open Virtual Desktop Copyright 2008 Ulteo SAS - 1 PREREQUISITES CONTENTS Contents 1 Prerequisites 1 1.1 Installation of MySQL.......................................
Ulteo Open Virtual Desktop Installation
 Ulteo Open Virtual Desktop Installation Copyright 2008 Ulteo SAS - CONTENTS CONTENTS Contents 1 Prerequisites 2 1.1 Installation of MySQL....................................... 2 2 Session Manager (sm.ulteo.com)
User Guide. version 1.2
 Network Discovery User Guide version 1.2 February 15, 2012 About Kaseya Kaseya is a global provider of IT automation software for IT Solution Providers and Public and Private Sector IT organizations. Kaseya's
Ticketing Systems and Documentation
 Ticketing Systems and Documentation APRICOT 2009 February 20 Hervey Allen Why Ticketing Systems? Remember this? - Monitoring - Data collection - Accounting Notifications - Change control & monitoring -
Pharos Control User Guide
 Outdoor Wireless Solution Pharos Control User Guide REV1.0.0 1910011083 Contents Contents... I Chapter 1 Quick Start Guide... 1 1.1 Introduction... 1 1.2 Installation... 1 1.3 Before Login... 8 Chapter
TPAf KTl Pen source. System Monitoring. Zenoss Core 3.x Network and
 Zenoss Core 3.x Network and System Monitoring A step-by-step guide to configuring, using, and adapting this free Open Source network monitoring system Michael Badger TPAf KTl Pen source I I flli\ I I community
DEPLOYMENT GUIDE Version 1.0. Deploying the BIG-IP LTM with the Nagios Open Source Network Monitoring System
 DEPLOYMENT GUIDE Version 1.0 Deploying the BIG-IP LTM with the Nagios Open Source Network Monitoring System Deploying F5 with Nagios Open Source Network Monitoring System Welcome to the F5 and Nagios deployment
Network Monitoring. Dhruba Raj Bhandari (CCNA) Manager Systems Soaltee Crowne Plaza Kathmandu NEPAL bhandari.dhruba@scp.com.np
 Manager Systems Soaltee Crowne Plaza Kathmandu NEPAL bhandari.dhruba@scp.com.np") Network Monitoring Dhruba Raj Bhandari (CCNA) Manager Systems Soaltee Crowne Plaza Kathmandu NEPAL bhandari.dhruba@scp.com.np Welcome! Network Management Workshop Network Monitoring Concepts, Tools And
Network Monitoring Dhruba Raj Bhandari (CCNA) Manager Systems Soaltee Crowne Plaza Kathmandu NEPAL bhandari.dhruba@scp.com.np Welcome! Network Management Workshop Network Monitoring Concepts, Tools And
Network Management & Monitoring Overview
 Network Management & Monitoring Overview PacNOG 6 November 17, 2009 Nadi, Fiji hervey@nsrc.org Introduction This is a big topic... There are a lot of tools to choose from: - Open Source - Commercial -
WordPress File Monitor Plus Plugin Configuration
 WordPress File Monitor Plus Plugin Configuration Open Source Varsity To configure the WordPress file monitor plus plugin on your WordPress driven Blog / website, login to WordPress as administrator, by
Network Monitoring. Sebastian Büttrich, sebastian@less.dk NSRC / IT University of Copenhagen Last edit: February 2012, ICTP Trieste
 Network Monitoring Sebastian Büttrich, sebastian@less.dk NSRC / IT University of Copenhagen Last edit: February 2012, ICTP Trieste http://creativecommons.org/licenses/by-nc-sa/3.0/ Agenda What is network
Attix5 Pro Server Edition
 Attix5 Pro Server Edition V7.0.3 User Manual for Linux and Unix operating systems Your guide to protecting data with Attix5 Pro Server Edition. Copyright notice and proprietary information All rights reserved.
W3Perl A free logfile analyzer
 W3Perl A free logfile analyzer Features Works on Unix / Windows / Mac View last entries based on Perl scripts Web / FTP / Squid / Email servers Session tracking Others log format can be added easily Detailed
Monitoring ESX/ESXi servers with Verax NMS & APM
 Monitoring ESX/ESXi servers with Verax NMS & APM Table of contents Abstract... 3 Preparing VMware server for monitoring... 3 1. Adding a VMware ESX/ESXi server to device inventory... 4 2. Adding sensors
How to Install Multicraft on a VPS or Dedicated Server (Ubuntu 13.04 64 bit)
") How to Install Multicraft on a VPS or Dedicated Server (Ubuntu 13.04 64 bit) Introduction Prerequisites This tutorial will show you step-by-step on how to install Multicraft 1.8.2 on a new VPS or dedicated
How to Install Multicraft on a VPS or Dedicated Server (Ubuntu 13.04 64 bit) Introduction Prerequisites This tutorial will show you step-by-step on how to install Multicraft 1.8.2 on a new VPS or dedicated
MONITORING RED HAT GLUSTER SERVER DEPLOYMENTS With the Nagios IT infrastructure monitoring tool
 TECHNOLOGY DETAIL MONITORING RED HAT GLUSTER SERVER DEPLOYMENTS With the Nagios IT infrastructure monitoring tool INTRODUCTION Storage system monitoring is a fundamental task for a storage administrator.
Fluke Networks NetFlow Tracker
 Fluke Networks NetFlow Tracker Quick Install Guide for Product Evaluations Pre-installation and Installation Tasks Minimum System Requirements The type of system required to run NetFlow Tracker depends
Elgg 1.8 Social Networking
 Elgg 1.8 Social Networking Create, customize, and deploy your very networking site with Elgg own social Cash Costello PACKT PUBLISHING open source* community experience distilled - BIRMINGHAM MUMBAI Preface
Features Overview Guide About new features in WhatsUp Gold v14
 Features Overview Guide About new features in WhatsUp Gold v14 Contents New Features in Ipswitch WhatsUp Gold v14 Welcome to WhatsUp Gold v14!... 1 About the Welcome Center About the Quick Setup Assistant...
GestióIP IPAM v3.0 IP address management software Installation Guide v0.1 www.gestioip.net
 GestióIP IPAM v3.0 IP address management software Installation Guide v0.1 www.gestioip.net GestióIP Copyright Marc Uebel 2011 Table of Contents 1 Introduction... 3 2 Requirements... 3 3 Installation...
Application Note. Cacti monitoring. Document version: v1.0 Last update: 8th November 2013
 Application Note Document version: v1.0 Last update: 8th November 2013 Purpose Monitor your ALOHA Load-Balancer with Cacti Complexity Versions concerned Aloha 4.2 and above Changelog 2013-10-03: Initial
OPENPROJECT. Setup Draft Notes. Draft Setup notes for Openproject
 OPENPROJECT Setup Draft Notes Draft Setup notes for Openproject Contents Introduction... 2 Application Installation... 2 Configuring the Plugins... 2 Configure the Help link... 2 Configure the Costs Plugin...
How To Install Storegrid Server On Linux On A Microsoft Ubuntu 7.5 (Amd64) Or Ubuntu (Amd86) (Amd77) (Orchestra) (For Ubuntu) (Permanent) (Powerpoint
 Or Ubuntu (Amd86) (Amd77) (Orchestra) (For Ubuntu) (Permanent) (Powerpoint") StoreGrid Linux Server Installation Guide Before installing StoreGrid as Backup Server (or) Replication Server in your machine, you should install MySQL Server in your machine (or) in any other dedicated
StoreGrid Linux Server Installation Guide Before installing StoreGrid as Backup Server (or) Replication Server in your machine, you should install MySQL Server in your machine (or) in any other dedicated
Livezilla How to Install on Shared Hosting http://www.jonathanmanning.com By: Jon Manning
 Livezilla How to Install on Shared Hosting By: Jon Manning This is an easy to follow tutorial on how to install Livezilla 3.2.0.2 live chat program on a linux shared hosting server using cpanel, linux
CMS and e-commerce Solutions. version 1.0. Please, visit us at: http://www.itoris.com or contact directly by email: sales@itoris.
 Layered Navigation for Magento User Guide version 1.0 created by IToris IToris Table of contents 1. Introduction... 3 1.1. Purpose... 3 2. Installation and License... 3 2.1. System Requirements... 3 2.2.
AKIPS Network Monitor Installation, Configuration & Upgrade Guide Version 16. AKIPS Pty Ltd
 AKIPS Network Monitor Installation, Configuration & Upgrade Guide Version 16 AKIPS Pty Ltd July 5, 2016 1 Copyright Copyright 2015 AKIPS Holdings Pty Ltd. All rights reserved worldwide. No part of this
itop: the open-source ITSM solution
 itop: the open-source ITSM solution itop is a multi-client web portal designed for service providers and businesses. Simple and easy to use, it allows all configuration items and their relationships to
Network management tools: Torrus, Gerty, Mooxu
 Network management tools: Torrus, Gerty, Mooxu DENOG3 Frankfurt am Main, October 20 th 2011 Stanislav Sinyagin ssinyagin@k-open.com Copyright notice This work is licensed under the Creative Commons Attribution-Share
SQL Server Setup for Assistant/Pro applications Compliance Information Systems
 SQL Server Setup for Assistant/Pro applications Compliance Information Systems The following document covers the process of setting up the SQL Server databases for the Assistant/PRO software products form
Network Monitoring Lab
 2016/07/11 05:53 1/7 Network Monitoring Lab Network Monitoring Lab Introduction In this exercise, we will set up LibreNMS as our network monitoring package. The software will poll your routers and switches
Novell ZENworks Asset Management 7.5
 Novell ZENworks Asset Management 7.5 w w w. n o v e l l. c o m October 2006 USING THE WEB CONSOLE Table Of Contents Getting Started with ZENworks Asset Management Web Console... 1 How to Get Started...
CMS and e-commerce Solutions. version 1.0. Please, visit us at: http://www.itoris.com or contact directly by email: sales@itoris.
 Help Desk for Magento User Guide version 1.0 created by IToris IToris Table of contents 1. Introduction... 3 1.1. Purpose... 3 2. Installation and License... 3 2.1. System Requirements... 3 2.2. Installation...
Zabbix 1.8 Network Monitoring
 Zabbix 1.8 Network Monitoring Monitor your network's hardware, servers, and web performance effectively and efficiently Rihards Olups - PUBLISHING - 1 BIRMINGHAM - MUMBAI Preface 1 Chapter 1: Getting Started
Open Source in the Data Centre. John Ferlito Bulletproof Networks
 Open Source in the Data Centre John Ferlito Bulletproof Networks About Me Experience Previous Engineer, ZipWorld (ISP) Senior Engineer, Pacific Internet (ISP) Current Technical Guru, linux.conf.au 2007
Getting Started - The Control Panel
 Table of Contents 1. Getting Started - the Control Panel Login Navigation Bar Domain Limits Domain User Account Properties Session Management 2. FTP Management Creating and Editing Users Accessing FTP