ADVANCED VISUALIZATION
|
|
|
- Austen Russell
- 8 years ago
- Views:
Transcription
1 Cyberinfrastructure Technology Integration (CITI) Advanced Visualization Division ADVANCED VISUALIZATION Tech-Talk by Vetria L. Byrd Visualization Scientist November 05, 2013

2 THIS TECH TALK Will Provide an overview of The Visualization Process Resources available via the Advanced Visualization Division Provide an introduction to the types of handson visualization workshops available Will NOT Provide hands-on tutorial for specific software

3 VETRIA L. BYRD, PHD Visualization Scientist Advanced Visualization Division Clemson Computing & Information Technology Located in Barre Hall (behind McAdams)

4 MISSION STATEMENT Enable researchers to gain keen insight into their data by equipping them with tools and resources that will allow for visualizing the expected, and discovering the unexpected in their data. í ixàü t Agent of Insight Insight

5 AGENT OF INSIGHT Introduce Visualization to the greater Clemson University community Increase Clemson s presence in the visualization community Visualization Workshops Designed to provide varying levels of interest Open source tools

6 WHAT DOES VISUALIZATION MEAN?
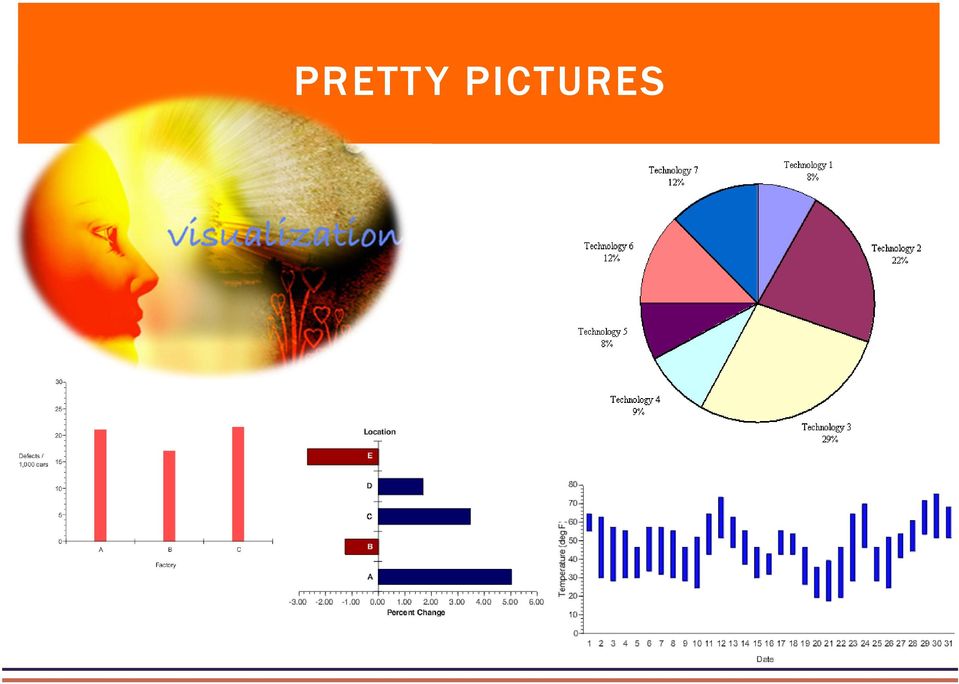
7 PRETTY PICTURES
8 WHEN SHOULD YOU START THINKING ABOUT VISUALIZATION?

9 Where is Visualization?

10 WHAT IS THE PURPOSE OF VISUALIZATION?

11 The purpose of visualization is insight, not pictures. ~Ben Shneiderman

12 Dictionary.com IN SIGHT [IN IN-SAHYT] noun 1. an instance of apprehending the true nature of a thing, especially through intuitive understanding. 2. penetrating mental vision or discernment; faculty of seeing into inner character or underlying truth. 3. Psychology. a. an understanding of relationships that sheds light on or helps solve a problem. b. (in psychotherapy) the recognition of sources of emotional difficulty. c. an understanding of the motivational forces behind one's actions, thoughts, or behavior; self-knowledge.

13 WHY IS INSIGHT IMPORTANT?

14 Insight Leads to... Visualizing Patterns over Time DISCOVERY 14

15 Insight Insight Leads to Discovery Spotting Differences

16 Insight Leads to... Allows users to answer questions they didn t know they had DECISION MAKING 16

17 Insight Leads to... ANALYSIS OF DATA The Challenger Disaster File: Challenger_explosion.jpg 17

18 Insight Leads to... Visualizing Spatial Relationships EXPLANATION Normal Overweight Obese Source: A Tour through the Visualization Zoo by Heer, Bostock & Ogievetsky (ACM Queue, 2010) 18

19 CAN ANYONE THINK OF ANOTHER REASON WHY INSIGHT IS IMPORTANT?

20 Insight... Tells a Story THE USE OF VISUALIZATION IN THE ANALYSIS OF POLLUTION AND AIR FLOWS IN MANHATTAN, NEW YORK CITY

21 NAPOLEON S INVASION OF RUSSIA IN 1812 BY JACQUE MINARD Best Statistical Graphic, Ever! Army Size: 100,000 Army Size: 422,000 Moscow Path of retreat Army Size: 10, Temperature
22 Importance of Insight Explanation Insight Tells a Story...
23 VISUALIZATION APPLICATIONS 23
24 VISUALIZATION APPLICATIONS Biovisualization The visualization of biological data; Often grouped with computer animation BioVis
25 VISUALIZATION APPLICATIONS Information Visualization Interdisciplinary Study of the visual representation of largescale collections of non-numerical information InfoVis
26 VISUALIZATION APPLICATIONS Geographic Visualization Interdisciplinary Study of the visual representation of largescale collections of non-numerical information GeoVis
27 VISUALIZATION APPLICATIONS Scientific Visualization Primarily concerned with the visualization of three-dimensional phenomena Emphases on realistic renderings of volumes, surfaces, illumination sources, etc. SciVis
28 UNDERLYING PRINCIPLES 28
29 Evolution of Presenting Information 3D Renderings of a Simulation Over Time Animated 2D Images 3D Static Images Vector Display and Plotter Graphics Characters on Paper 29
30 THE DATA BioVis Biological Data VISUALIZATION InfoVis Non-numerical Data GeoVis Geospatial Data Scientific Visualization Simulated, 3D Data
31 THE PRACTICE OF SCIENTIFIC VISUALIZATION SCIENTIFIC VISUALIZATION PIPELINE 31
32 THE PRACTICE OF INFORMATION VISUALIZATION 32
33 THE INFORMATION VISUALIZATION PROCESS Source:
34 INTRODUCTION TO SCIENTIFIC VISUALIZATION 34
35 SCIENTIFIC VISUALIZATION SOFTWARE Using open-source, multi-platform data analysis and visualization applications Visualization Workshops: Introduction to Scientific Visualization Using VisIt Introduction to Scientific Visualization Using ParaView
36 INTRODUCTION TO INFORMATION VISUALIZATION 36
37 INFORMATION VISUALIZATION SOFTWARE Visualization Workshop: Introduction to Information Visualization Using Gephi Open Graph Visualization Platform Same dataset visualized differently (Using Gephi)
38 INFORMATION VISUALIZATION SOFTWARE Visualization Workshop: Introduction to Data Visualization on the Web using D3.js Data Driven Documents Interactive Data Visualization
39 WHAT S NEW 39
40 BROWN DIGITAL RESOURCE LABORATORY Cooper Library Laptops available for DRL Use
41 NEW WORKSHOPS For Faculty & Staff Visualization as a tool for pedagogical purposes Visualization as a Conduit for Collaboration For All Navigating Through the Visualization Zoo New Workshop Series on Visual Analytics
42 ON THE HORIZON 42
43 BEGINNER WORKSHOPS Scientific Visualization Introduction to Scientific Visualization Using VisIt 2.7 ParaView Introduction to ParaView Information Visualization Gephi Data Driven Documents (D3.js) Tableau
44 INTERMEDIATE WORKSHOPS Scientific Visualization Using Visit Getting Data Into VisIt Running VisIt on Palmetto Volume Rendering Information Visualization Using Gephi Using D3.js Tableau
45 ADVANCED WORKSHOPS Scientific Visualization Visit Python Scripting Information Visualization Using Gephi Using D3.js Tableau Raspberry Pi Workshop
46 COMING SPRING Visualization Contest Open to faculty, students and staff Submissions will be displayed on the outside projection of the Brown Digital Resource Laboratory in Cooper Library From all disciplines Look for details in your inbox
47 SPREAD THE WORD Advanced Visualization Division Data Visualization Internships (for undergraduates) Actively looking for a Visualization Scientist to join the Advanced Visualization Division Actively looking for a graduate student assistant If interested or know someone who is.... Send me an
48 Thank You! Vetria (Vee-Tree-Ah) L. Byrd, PhD Visualization Scientist 2097 Barre Hall
Tableau's data visualization software is provided through the Tableau for Teaching program.
 A BEGINNER S GUIDE TO VISUALIZATION Featuring REU Site Collaborative Data Visualization Applications June 10, 2014 Vetria L. Byrd, PhD Advanced Visualization, Director REU Coordinator Visualization Scientist
COSC 6344 Visualization
 COSC 64 Visualization University of Houston, Fall 2015 Instructor: Guoning Chen chengu@cs.uh.edu Course Information Location: AH 2 Time: 10am~11:am Tu/Th Office Hours: 11:am~12:pm Tu /Th or by appointment
Big Data in Pictures: Data Visualization
 Big Data in Pictures: Data Visualization Huamin Qu Hong Kong University of Science and Technology What is data visualization? Data visualization is the creation and study of the visual representation of
An example. Visualization? An example. Scientific Visualization. This talk. Information Visualization & Visual Analytics. 30 items, 30 x 3 values
 Information Visualization & Visual Analytics Jack van Wijk Technische Universiteit Eindhoven An example y 30 items, 30 x 3 values I-science for Astronomy, October 13-17, 2008 Lorentz center, Leiden x An
Information Visualization WS 2013/14 11 Visual Analytics
 1 11.1 Definitions and Motivation Lot of research and papers in this emerging field: Visual Analytics: Scope and Challenges of Keim et al. Illuminating the path of Thomas and Cook 2 11.1 Definitions and
Network VisualizationS
 Network VisualizationS When do they make sense? Where to start? Clement Levallois, Assist. Prof. EMLYON Business School v. 1.1, January 2014 Bio notes Education in economics, management, history of science
可 视 化 与 可 视 计 算 概 论. Introduction to Visualization and Visual Computing 袁 晓 如 北 京 大 学 2015.12.23
 可 视 化 与 可 视 计 算 概 论 Introduction to Visualization and Visual Computing 袁 晓 如 北 京 大 学 2015.12.23 2 Visual Analytics Adapted from Jim Thomas s slides 3 Visual Analytics Definition Visual Analytics is the
How To Create A Data Visualization
 CSCI 552 Data Visualization Shiaofen Fang What Is Visualization? We observe and draw conclusions A picture says more than a thousand words/numbers Seeing is believing, seeing is understanding Beware of
Geospatial Literacy as Digital Literacy: Building GIS Program to Support and Engage with Interdisciplinary and Multidisciplinary Research Communities
 Submitted on: 16.06.2015 Geospatial Literacy as Digital Literacy: Building GIS Program to Support and Engage with Interdisciplinary and Multidisciplinary Research Communities Raymond Pun Reference and
IC05 Introduction on Networks &Visualization Nov. 2009. <mathieu.bastian@gmail.com>
 IC05 Introduction on Networks &Visualization Nov. 2009 Overview 1. Networks Introduction Networks across disciplines Properties Models 2. Visualization InfoVis Data exploration
Introduction to Information Visualization
 Universidade de Aveiro Departamento de Electrónica, Telecomunicações e Informática Introduction to Information Visualization www.portugal-migration.info Information Visualization Beatriz Sousa Santos,
The Visualization Pipeline
 The Visualization Pipeline Conceptual perspective Implementation considerations Algorithms used in the visualization Structure of the visualization applications Contents The focus is on presenting the
Introduction to Data Visualization. Alark Joshi
 Introduction to Data Visualization Alark Joshi Introduction Ph.D. in Computer Science with an emphasis on Data Visualization - University of Maryland Postdoctoral Fellow - Yale University Conduct research
A Short Introduction on Data Visualization. Guoning Chen
 A Short Introduction on Data Visualization Guoning Chen Data is generated everywhere and everyday Age of Big Data Data in ever increasing sizes need an effective way to understand them History of Visualization
Professional Organization Checklist for the Computer Information Systems Curriculum
 Professional Organization Checklist f the Computer Infmation Systems Curriculum Association of Computing Machinery and Association of Infmation Systems IS 2002 Model Curriculum and Guidelines f Undergraduate
Indiana University School of Informatics and Computing
 SCHOOL OF INFORMATICS AND COMPUTING Exceed Expectations Our programs will exceed your expectations and help you exceed your own. Our students and faculty are breaking new ground every day: creating applications
Information Systems and Tech (IST)
") California State University, San Bernardino 1 Information Systems and Tech (IST) Courses IST 101. Introduction to Information Technology. 4 Introduction to information technology concepts and skills. Survey
California State University, San Bernardino 1 Information Systems and Tech (IST) Courses IST 101. Introduction to Information Technology. 4 Introduction to information technology concepts and skills. Survey
Introduction to Visualization with VTK and ParaView
 Introduction to Visualization with VTK and ParaView R. Sungkorn and J. Derksen Department of Chemical and Materials Engineering University of Alberta Canada August 24, 2011 / LBM Workshop 1 Introduction
Does the program qualify for supplemental Palmetto Fellows and LIFE Scholarship awards? Yes No
 Name of Institution Clemson University Name of Program (include concentrations, options, and tracks) MBA with a concentration in Business Analytics Program Designation Associate s Degree Bachelor s Degree:
COMPUTER SCIENCE. FACULTY: Jennifer Bowen, Chair Denise Byrnes, Associate Chair Sofia Visa
 FACULTY: Jennifer Bowen, Chair Denise Byrnes, Associate Chair Sofia Visa COMPUTER SCIENCE Computer Science is the study of computer programs, abstract models of computers, and applications of computing.
Introduction to Data Visualization. Alark Joshi
 Introduction to Data Visualization Alark Joshi Introduction Ph.D. in Computer Science with an emphasis on Data Visualization - University of Maryland Postdoctoral Fellow - Yale University Conduct research
Computer Graphics and Visualization in a Computational Science Program
 Computer Graphics and Visualization in a Computational Science Program Steve Cunningham California State University Stanislaus Oregon State University, October 16, 2000 The imperative to scientific visualization
MoM, Dr. Beam, and Visual Mechanics: Direct Manipulation Software for Learning Mechanics of Materials. University of Wisconsin-Madison
 MoM, Dr. Beam, and Visual Mechanics: Direct Manipulation Software for Learning Mechanics of Materials at the University of Wisconsin-Madison prepared for The Institute on Learning Technology part of the
Data Visualization VINH PHAN AW1 06/01/2014
 1 Data Visualization VINH PHAN AW1 06/01/2014 Agenda 2 1. Dealing with Data 2. Foundations of Visualization 3. Some Visualization Techniques 4. Life Cycle of Visualizations 5. Conclusion 6. Key Persons
Information Visualization and Visual Analytics 可 视 化 与 可 视 分 析 简 介. Xiaoru Yuan School of EECS, Peking University Aug 14th, 2010
 Information Visualization and Visual Analytics 可 视 化 与 可 视 分 析 简 介 Xiaoru Yuan School of EECS, Peking University Aug 14th, 2010 1 2 Ted Roslling s Talk 3 What is Visualization 4 Napoleon s March to Moscow,
BS Environmental Science (2013-2014)
") BS Environmental Science (2013-2014) Program Information Point of Contact Brian M. Morgan (brian.morgan@marshall.edu) Support for University and College Missions Marshall University is a multi-campus public
BS Environmental Science (2013-2014) Program Information Point of Contact Brian M. Morgan (brian.morgan@marshall.edu) Support for University and College Missions Marshall University is a multi-campus public
City Research Online. Permanent City Research Online URL: http://openaccess.city.ac.uk/1134/
 Dove, G. & Jones, S. (2012). Narrative Visualization: Sharing Insights into Complex Data. Paper presented at the Interfaces and Human Computer Interaction (IHCI 2012), 21-23 Jul 2012, Lisbon, Portugal.
Outline. Fundamentals. Rendering (of 3D data) Data mappings. Evaluation Interaction
 Data mappings. Evaluation Interaction") Outline Fundamentals What is vis? Some history Design principles The visualization process Data sources and data structures Basic visual mapping approaches Rendering (of 3D data) Scalar fields (isosurfaces
Outline Fundamentals What is vis? Some history Design principles The visualization process Data sources and data structures Basic visual mapping approaches Rendering (of 3D data) Scalar fields (isosurfaces
LET S GO BACK TO THE VERY FIRST HISTORICAL KNOWN EXAMPLES OF INFORMATION VISUALIZATIONS
 Introduction to InfoVis and Geovisual Analytics Prof Mikael Jern NCVA, Linköping University Prof http://ncva.itn.liu.se/ Mikael Jern 2014 Discovery consists of seeing what everybody has seen and thinking
A User Centered Approach for the Design and Evaluation of Interactive Information Visualization Tools
 A User Centered Approach for the Design and Evaluation of Interactive Information Visualization Tools Sarah Faisal, Paul Cairns, Ann Blandford University College London Interaction Centre (UCLIC) Remax
How To Become A Data Scientist
 Programme Specification Awarding Body/Institution Teaching Institution Queen Mary, University of London Queen Mary, University of London Name of Final Award and Programme Title Master of Science (MSc)
UniGR Workshop: Big Data «The challenge of visualizing big data»
 Dept. ISC Informatics, Systems & Collaboration UniGR Workshop: Big Data «The challenge of visualizing big data» Dr Ir Benoît Otjacques Deputy Scientific Director ISC The Future is Data-based Can we help?
DESIGN. College of the Arts. Career Possibilities. Undergraduate Programs. Bachelor of Arts in Design (120 Units) 342 Design 2015-2016 CSULB Catalog
 342 Design 2015-2016 CSULB Catalog") DESIGN College of the Arts Department Chair: Martin Herman Department Office: Design (DESN), Room 101 Telephone / FAX: (562) 985 5089 / (562) 985 2284 Website: http://www.csulb.edu/depts/design/ Undergraduate
DESIGN College of the Arts Department Chair: Martin Herman Department Office: Design (DESN), Room 101 Telephone / FAX: (562) 985 5089 / (562) 985 2284 Website: http://www.csulb.edu/depts/design/ Undergraduate
Guidelines for Integrative Core Curriculum Themes and Perspectives Designations
 Guidelines for Integrative Core Curriculum Themes and Perspectives Designations The purpose of this document is to provide guidelines for faculty wishing to have new or existing courses carry Themes and
Representing, Analyzing, and Visualizing Scholarly Data in Support of Research Management
 Representing, Analyzing, and Visualizing Scholarly Data in Support of Research Management Dr. Katy Börner Cyberinfrastructure for Network Science Center, Director Information Visualization Laboratory,
Computer Science Electives and Clusters
 Course Number CSCI- Computer Science Electives and Clusters Computer Science electives belong to one or more groupings called clusters. Undergraduate students with the proper prerequisites are permitted
Data Science and Business Analytics Certificate Data Science and Business Intelligence Certificate
 Data Science and Business Analytics Certificate Data Science and Business Intelligence Certificate Description The Helzberg School of Management has launched two graduate-level certificates: one in Data
HANDBOOK FOR THE APPLIED AND COMPUTATIONAL MATHEMATICS OPTION. Department of Mathematics Virginia Polytechnic Institute & State University
 HANDBOOK FOR THE APPLIED AND COMPUTATIONAL MATHEMATICS OPTION Department of Mathematics Virginia Polytechnic Institute & State University Revised June 2013 2 THE APPLIED AND COMPUTATIONAL MATHEMATICS OPTION
Wyoming Geographic Information Science Center University Planning 3 Unit Plan, 2009-2014 #
 I. Mission and Aspirations Wyoming Geographic Information Science Center University Planning 3 Unit Plan, 2009-2014 # The mission of the Wyoming Geographic Information Science Center (WyGISC) is to advance
Teaching Game Development: At the Intersection of Computer Science and Humanities & Arts
 Teaching Game Development: At the Intersection of Computer Science and Humanities & Arts David Finkel, Mark Claypool, Michael A. Gennert Department of Computer Science Fred Bianchi, Dean O Donnell, Patrick
Introduction of Information Visualization and Visual Analytics. Chapter 2. Introduction and Motivation
 Introduction of Information Visualization and Visual Analytics Chapter 2 Introduction and Motivation Overview! 2 Overview and Motivation! Information Visualization (InfoVis)! InfoVis Application Areas!
DATA VISUALIZATION. Lecture 1 Introduction. Lin Lu http://vr.sdu.edu.cn/~lulin/ llu@sdu.edu.cn
 DATA VISUALIZATION Lecture 1 Introduction Lin Lu http://vr.sdu.edu.cn/~lulin/ llu@sdu.edu.cn Visualization 可 视 化 Visualization now seen as key part of modern computing High performance computing generates
Dr V. J. Brown. Neuroscience (see Biomedical Sciences) History, Philosophy, Social Anthropology, Theological Studies.
 History, Philosophy, Social Anthropology, Theological Studies.") Psychology - pathways & 1000 Level modules School of Psychology Head of School Degree Programmes Single Honours Degree: Joint Honours Degrees: Dr V. J. Brown Psychology Neuroscience (see Biomedical Sciences)
Psychology - pathways & 1000 Level modules School of Psychology Head of School Degree Programmes Single Honours Degree: Joint Honours Degrees: Dr V. J. Brown Psychology Neuroscience (see Biomedical Sciences)
ICS Summer School 2016
 ICS Summer School 2016 Scientific Trends at the Interfaces Scientific Visualization Data Science Organisers: Pascal Frey, Patrick Gallinari, Agathe Guilloux, Sylvie Thiria, Julien Tierny July 18th August
Innovative Information Visualization of Electronic Health Record Data: a Systematic Review
 Innovative Information Visualization of Electronic Health Record Data: a Systematic Review Vivian West, David Borland, W. Ed Hammond February 5, 2015 Outline Background Objective Methods & Criteria Analysis
The UCC-21 cognitive skills that are listed above will be met via the following objectives.
 Master Syllabus Department of Geography GEOG 265: Introduction to Geographic Information Systems Course Description Fundamentals of geographic information systems (GIS). How to visualize geographic information
The Role, Mission, Vision, and Goals of Graduate Education at Central Washington University
 The Role, Mission, Vision, and Goals of Graduate Education at Central Washington University Role: The role of graduate education at Central Washington University is multi-faceted. Graduate education, first
MIDLAND ISD ADVANCED PLACEMENT CURRICULUM STANDARDS AP ENVIRONMENTAL SCIENCE
 Science Practices Standard SP.1: Scientific Questions and Predictions Asking scientific questions that can be tested empirically and structuring these questions in the form of testable predictions SP.1.1
Visualization with ParaView. Greg Johnson
 Visualization with Greg Johnson Before we begin Make sure you have 3.8.0 installed so you can follow along in the lab section http://paraview.org/paraview/resources/software.html http://www.paraview.org/
The Spatial Analysis and Visualization Initiative (SAVI) CERTIFICATE PROGRAM
 CERTIFICATE PROGRAM") The Spatial Analysis and Visualization Initiative (SAVI) CERTIFICATE PROGRAM Mapping is transforming how we communicate and interpret data. Creative professionals, designers, developers, programmers, architects,
The Spatial Analysis and Visualization Initiative (SAVI) CERTIFICATE PROGRAM Mapping is transforming how we communicate and interpret data. Creative professionals, designers, developers, programmers, architects,
Assessment Plan Mission
 Assessment Plan B.S. Environmental Biology, B.S. Earth Science School of Environmental and Sustainability Sciences College of Natural, Applied and Health Sciences Kean University The School of Environmental
Essential Study Partner/ ESP: http://highered.mcgraw-hill.com/sites/0072970480/student_view0/essential_study_partner.html
 Course: Environmental Science Course Number: 2001340 Title: Environmental Science: A Study of Interrelationships, 10 th edition Authors: Enger, Smith Publisher: Glencoe/McGraw-Hill Copyright: 2006 Online
School of Management and Information Systems
 School of Management and Information Systems Business and Management Systems Information Science and Technology 176 Business and Management Systems Business and Management Systems Bachelor of Science Business
College of Nursing and Professional Disciplines Instructional Design Strategic Plan 2014-2019
 College of Nursing and Professional Disciplines Instructional Design Strategic Plan 2014-2019 Enrich Teaching & Learning Innovation Exceptional Instructional Design Quality Client Service Expand Presence
Visualisatie BMT. Introduction, visualization, visualization pipeline. Arjan Kok Huub van de Wetering (h.v.d.wetering@tue.nl)
") Visualisatie BMT Introduction, visualization, visualization pipeline Arjan Kok Huub van de Wetering (h.v.d.wetering@tue.nl) 1 Lecture overview Goal Summary Study material What is visualization Examples
Visualisatie BMT Introduction, visualization, visualization pipeline Arjan Kok Huub van de Wetering (h.v.d.wetering@tue.nl) 1 Lecture overview Goal Summary Study material What is visualization Examples
COMPUTER SCIENCE/ COMPUTER NETWORKING AND TECHNOLOGIES (COSC)
") COMPUTER SCIENCE/ COMPUTER NETWORKING AND TECHNOLOGIES (COSC) Computer Science (COSC) courses are offered by the School of Information Arts and Technologies within the Yale Gordon College of Liberal Arts.
COMPUTER SCIENCE/ COMPUTER NETWORKING AND TECHNOLOGIES (COSC) Computer Science (COSC) courses are offered by the School of Information Arts and Technologies within the Yale Gordon College of Liberal Arts.
Teaching Computer Graphics in Context Computer Graphics Education 09 Workshop Munich, Germany, March 31-April 1, 2009
 Teaching Computer Graphics in Context Computer Graphics Education 09 Workshop Munich, Germany, March 31-April 1, 2009 Organizers: Colleen Case, Schoolcraft College Steve Cunningham, Brown Cunningham Associates
IT 415 Information Visualization Spring Semester
 The Department of Applied Information Technology The Volgenau School of Information Technology & Engineering George Mason University 4400 University Drive Fairfax. VA 22030-4444 IT 415 Information Visualization
Republic Polytechnic School of Information and Communications Technology C391 Animation and Visual Effect Automation.
 Republic Polytechnic School of Information and Communications Technology C391 Animation and Visual Effect Automation Module Curriculum This document addresses the content related abilities, with reference
Strategic Plan Proposal: Learning science by experiencing science: A proposal for new active learning courses in Psychology
 Strategic Plan Proposal: Learning science by experiencing science: A proposal for new active learning courses in Psychology Contacts: Jacob Feldman, (jacob.feldman@rutgers.edu, 848-445-1621) Eileen Kowler
BGSU MPA PROGRAM GUIDE
 Fall 2012 BGSU MPA PROGRAM GUIDE Mission Statement The mission of the Master of Public Administration (MPA) Program at Bowling Green State University is to educate students, preparing them to assume leadership
SERIOUSLY ADDING FUN THE NEXT LEVEL IN BUSINESS APPLICATION DESIGN
 CRYTEK SERIOUSLY ADDING FUN THE NEXT LEVEL IN BUSINESS APPLICATION DESIGN 1 YOUR TAKEAWAY Difference between Beating a game and Creating solutions in the business context? Can be almost = 0 Can a business
Unresolved issues with the course, grades, or instructor, should be taken to the point of contact.
 Graphics and Data Visualization CS1501 Fall 2013 Syllabus Course Description With the advent of powerful data-mining technologies, engineers in all disciplines are increasingly expected to be conscious
your innovative ideas into reality with an engineering degree customized to fit your interests. BACHELOR OF SCIENCE IN ENGINEERING
 BACHELOR OF SCIENCE IN ENGINEERING Turn your innovative ideas into reality with an engineering degree customized to fit your interests. SELECT YOUR EMPHASIS Would you like to pursue your own unique path
Professional Organization Checklist for the Computer Science Curriculum Updates. Association of Computing Machinery Computing Curricula 2008
 Professional Organization Checklist for the Computer Science Curriculum Updates Association of Computing Machinery Computing Curricula 2008 The curriculum guidelines can be found in Appendix C of the report
CAD and Creativity. Contents
 CAD and Creativity K C Hui Department of Automation and Computer- Aided Engineering Contents Various aspects of CAD CAD training in the university and the industry Conveying fundamental concepts in CAD
Design. Design. Certificates. Contact Information. Full-Time Faculty. Associate Degrees. Associate in Arts Degrees. Certificate of Achievement
 Design Associate in Arts Degrees Architectural Design Computer-Aided Drafting Computer-Aided Drafting and Design Mechanical Design Students may earn one of the above-named associate degrees by completing
A Paradigm for Interdisciplinary Research
 A Paradigm for Interdisciplinary Research A. H. Rebar, DVM, Ph.D. Senior Associate Vice President for Research Executive Director of Discovery Park DISCOVERY PARK IS: Purdue s hub for interdisciplinary
Guidelines for the Evaluation of Four-Year Undergraduate Biology
 Guidelines for the Evaluation of Four-Year Undergraduate Biology Evaluation Criteria: Faculty and Professional Development Recommendations for Faculty Size and Composition There should be a minimum of
CREDIT TRANSFER: GUIDELINES FOR STUDENT TRANSFER AND ARTICULATION AMONG MISSOURI COLLEGES AND UNIVERSITIES
 CREDIT TRANSFER: GUIDELINES FOR STUDENT TRANSFER AND ARTICULATION AMONG MISSOURI COLLEGES AND UNIVERSITIES With Revisions as Proposed by the General Education Steering Committee [Extracts] A. RATIONALE
Study Partner/Essential Study Partner (ESP): http://highered.mcgraw-hill.com/sites/0073211877/student_view0/study_partner.html
: http://highered.mcgraw-hill.com/sites/0073211877/student_view0/study_partner.html") Course: Anatomy and Physiology Honors Course Number: 2000360 Title: Hole s Human Anatomy and Physiology, 10 th Edition Authors: Shier, Butler, Lewis Publisher: Glencoe/McGraw-Hill Copyright: 2004 Online
Course: Anatomy and Physiology Honors Course Number: 2000360 Title: Hole s Human Anatomy and Physiology, 10 th Edition Authors: Shier, Butler, Lewis Publisher: Glencoe/McGraw-Hill Copyright: 2004 Online
An Introduction to Software Visualization. Visualization. Types of Software Visualization. Course Overview
 An Introduction to Software Dr. Jonathan I. Maletic Software DevelopMent Laboratory Department of Computer Science Kent State University Course Overview Introductory Lectures Software visualization
Assessment Plan Henderson State University
 Assessment Plan Mission Statement: The Department of Psychology is dedicated to scholarly excellence and the success of our students. Mirroring the shared mission of the Matt Locke Ellis College of Arts
 Mesa Community College Geographic Information Systems Technician Certificate (GISTC) Karen Blevins Faculty / GIS Program Coordinator Overview Program in brief Program development Original Program Current
INFORMATION VISUALIZATION
 School of Information & Library Science 144 West 14 th Street, 6 th floor New York, NY 10011 7301 INFORMATION VISUALIZATION Course: LIS 658 01 Semester: Spring 2014 Meeting Information: Thursdays, 6:30
Albright Digital Media Alumni: Where Are They Now? Combined Major in Digital Media
 Professor Daniel J. Falabella, Ph.D., Chair Associate Professor Matthew Garrison, M.F.A. Assistant Professors Jocelyn Kolb, M.F.A. and Wil Lindsay, M.F.A. Combined Major in Digital Media Interdisciplinary
SAS JOINT DATA MINING CERTIFICATION AT BRYANT UNIVERSITY
 SAS JOINT DATA MINING CERTIFICATION AT BRYANT UNIVERSITY Billie Anderson Bryant University, 1150 Douglas Pike, Smithfield, RI 02917 Phone: (401) 232-6089, e-mail: banderson@bryant.edu Phyllis Schumacher
FIVE REASONS TO STUDY PSYCHOLOGY AT UOW
 CONNECT: WELCOME Psychology, as an academic discipline, is the study of the human mind and behavior. We study both the why and how of human behavior. We try to understand how the human mind gives rise
SUMMER SCHOOL ON ADVANCES IN GIS
 SUMMER SCHOOL ON ADVANCES IN GIS Six Workshops Overview The workshop sequence at the UMD Center for Geospatial Information Science is designed to provide a comprehensive overview of current state-of-the-art
Internship Opportunities Xerox Research Centre India (XRCI), Bangalore Analytics Research Group
, Bangalore Analytics Research Group") Analytics Research Group The Analytics Research Group in Xerox Research Centre India (XRCI) is seeking bright Undergraduate, Masters and PhD students for research internships to participate in exciting
Analytics Research Group The Analytics Research Group in Xerox Research Centre India (XRCI) is seeking bright Undergraduate, Masters and PhD students for research internships to participate in exciting
Master of Science Degree in Applied Spatial Information Science. An Inter-Disciplinary Degree at Michigan Technological University
 Master of Science Degree in Applied Spatial Information Science An Inter-Disciplinary Degree at Michigan Technological University General Program Description and Characteristics This proposal is to create
Visualization and Astronomy
 Visualization and Astronomy Prof.dr. Jos Roerdink Institute for Mathematics and Computing Science University of Groningen URL: www.cs.rug.nl/svcg/ Scientific Visualization & Computer Graphics Group Institute
Integrating Writing and Computer Graphics to Improve Technical Communication Across Disciplines
 Integrating Writing and Computer Graphics to Improve Technical Communication Across Disciplines Daniel Keefe, Assistant Professor David Schroeder, Graduate Research Assistant Department of Computer Science
Computing, technology & Data Analysis in the Graduate Curriculum. Duncan Temple Lang UC Davis Dept. of Statistics
 Computing, technology & Data Analysis in the Graduate Curriculum Duncan Temple Lang UC Davis Dept. of Statistics JSM 08 Statistics is much broader than we represent in our educational programs Context
Dynamic Visualization and Time
 Dynamic Visualization and Time Markku Reunanen, marq@iki.fi Introduction Edward Tufte (1997, 23) asked five questions on a visualization in his book Visual Explanations: How many? How often? Where? How
CLUSTER ANALYSIS WITH R
 CLUSTER ANALYSIS WITH R [cluster analysis divides data into groups that are meaningful, useful, or both] LEARNING STAGE ADVANCED DURATION 3 DAY WHAT IS CLUSTER ANALYSIS? Cluster Analysis or Clustering
Explorable Visual Analytics (EVA) Interactive Exploration of LEHD. Saman Amraii - Amir Yahyavi Carnegie Mellon University
 Interactive Exploration of LEHD. Saman Amraii - Amir Yahyavi Carnegie Mellon University") Explorable Visual Analytics (EVA) Interactive Exploration of LEHD Saman Amraii - Amir Yahyavi Carnegie Mellon University Motivation Tuesday, June 23rd 2015 Explorable Visual Analytics (EVA) 2 Motivation
Explorable Visual Analytics (EVA) Interactive Exploration of LEHD Saman Amraii - Amir Yahyavi Carnegie Mellon University Motivation Tuesday, June 23rd 2015 Explorable Visual Analytics (EVA) 2 Motivation
Blue Collar Computing: Productivity and Workforce Development through Technology
 Blue Collar Computing: Productivity and Workforce Development through Technology Ashok Krishnamurthy, Ph.D. Director of Research and Scientific Development HPC for the Rest of US HPC for the Common Man
How do abiotic factors and physical processes impact life in the ocean?
 This website would like to remind you: Your browser (Apple Safari 7) is out of date. Update your browser for more security, comfort and the best experience on this site. Activitydevelop Ocean Abiotic Factors
San Diego Zoo Global Advanced Inquiry Program Course Descriptions*
 San Diego Zoo Global Advanced Inquiry Program Course Descriptions* Foundations of Inquiry 3 credits; Required as first course, Summer Year 1 5 in person discussion dates combined with online content In
M Majors MAJOR REQUIREMENTS. Management - small business & entrepreneurship. marketing. mathematics. medical assisting
 M Majors Click on the major below to get to the exact page. Management - small business & entrepreneurship marketing mathematics medical assisting music he following section details the required curriculum
A New Undergraduate Major: Interactive Media and Game Development
 A New Undergraduate Major: Interactive Media and Game Development David Finkel, Mark Claypool, Michael A. Gennert Department of Computer Science Fred Bianchi, Dean O Donnell, Patrick Quinn Department of
Why Get an M.Eng. in CS or Anything Else? Prof. Charlie Van Loan CS M.Eng. Program Director
 Why Get an M.Eng. in CS or Anything Else? Prof. Charlie Van Loan CS M.Eng. Program Director Some Questions to Answer Do I need a fifth year? Is Entrepreneurship part of the deal? Is the MEng a stepping
Visualization with ParaView
 Visualization with ParaView Before we begin Make sure you have ParaView 4.1.0 installed so you can follow along in the lab section http://paraview.org/paraview/resources/software.php Background http://www.paraview.org/
BIG DATA & DATA SCIENCE
 BIG DATA & DATA SCIENCE ACADEMY PROGRAMS IN-COMPANY TRAINING PORTFOLIO 2 TRAINING PORTFOLIO 2016 Synergic Academy Solutions BIG DATA FOR LEADING BUSINESS Big data promises a significant shift in the way
Using NVivo to Manage Qualitative Data. R e i d Roemmi c h R HS A s s e s s me n t Office A p r i l 6, 2 0 1 5
 Using NVivo to Manage Qualitative Data R e i d Roemmi c h R HS A s s e s s me n t Office A p r i l 6, 2 0 1 5 Introductions Please share: Your name Department Position and brief description of what you
Interactive Visual Data Analysis in the Times of Big Data
 Interactive Visual Data Analysis in the Times of Big Data Cagatay Turkay * gicentre, City University London Who? Lecturer (Asst. Prof.) in Applied Data Science Started December 2013 @ the gicentre (gicentre.net)
Undergraduate Degree in Graphic Design
 Biada 11, 08012 Barcelona in Graphic Design IED Barcelona is offering a 4 year official s in Design (240 ECTS). Its objective is to transform passion, talent and creativity into knowledge and abilities
CSE 512 - Data Visualization. Visualization Tools. Jeffrey Heer University of Washington
 CSE 512 - Data Visualization Visualization Tools Jeffrey Heer University of Washington How do people create visualizations? Chart Typology Pick from a stock of templates Easy-to-use but limited expressiveness
Bard Center for Environmental Policy
 Bard Center for Environmental Policy Education. Leadership. Change. 2011 2012 Master of Science (M.S) in Climate Science and Policy Master of Science in Climate Science and Policy The Bard Center for Environmental