Minto Asset Management Plan
|
|
|
- Ashlee Taylor
- 10 years ago
- Views:
Transcription

1 Minto Asset Management Plan
2 1. EXECUTIVE SUMMARY 1.1 What the Municipality Provides The Town of Minto has a significant portfolio of community assets under its care and control. These assets form an integral part of providing services to the community which support the governance and accountability of the Town. These services are provided in partnership with end users to enable a systematic process of capturing, organizing, sharing and using objectives and deliver services to our community. Sound asset management is a key to the financial sustainability of the Town of Minto. The Council has an obligation to ensure that current assets are managed efficiently and effectively and that decisions regarding the acquisition of new assets and the sale and maintenance of current assets are undertaken in an open and transparent fashion. The management of assets cannot be done in isolation and needs to consider financial, social and environmental factors in decision making. Most importantly, the assets Council is responsible for are community assets and as such the service level provided by each asset must be set in recognition of the feedback received from various customer survey avenues. 1.2 Asset Based Services Provided by Council The Town of Minto owns and is responsible for the management, operation and maintenance of a diverse asset portfolio that provides services and facilities to the community. Asset Management Plans have been developed to ensure that Council continues to provide effective and comprehensive management of its asset portfolios. Plans have been completed for the following asset portfolios as required by the Building Together Guide: Roads Bridges Culverts Water Wastewater Storm Water This document has been prepared as a summary of the above plans. Asset Management Plans are reviewed during the annual budget preparation and amended to recognize any changes in service levels and / or resources available to provide those services as a result of the budget decision process. 1

3 The Town of Minto has continued to improve our data collection and condition rating accuracy. This is an ongoing process. 1.3 What does it Cost? The projected outlays necessary to replace existing TCAs covered by this Asset Management Plan are shown in Tables 10a and 10b. On a replacement cost basis, this amount over the 10 year planning period is $6.9 million on average per year. One of the difficulties in arriving at exact values is that the numbers change greatly depending upon the criteria chosen to generate forecasts. For example, the annual required capital spending for stormwater on a current Replacement Cost basis is $295,000 while on an End of Life Replacement basis, the amount is $1,320,000. One of the top priorities for 2014 will be for Treasury and Public Works staff to review the data in the Citywide program and keep abreast of changes to the software as models are refined. Therefore, the numbers which reflect future forecasts contained in this plan should be used to illustrate broad trends rather than exact requirements. 1.4 Operational Plans for the Future Town of Minto plans to operate and maintain the assets network to achieve the following strategic objectives. i. Ensure the assets network is maintained at a safe and functional standard as set out in this Asset Management Plan. ii. Provide rapid response to assets problems. iii. Reduce the level of risk exposure to Council and ensure the network complements Council s strategies. iv. Meet community expectations in a financially sustainable manner via improved risk management, legislative compliance and management processes. v. Prompt wider community participation and engagement in local community activities. vi. Implement applicable actions in the Town s Strategic Plan 1.5 Measuring our Performance Quality It is the goal of the municipality to maintain assets in a reasonable condition. Defects found or reported that are outside our service standard will be repaired. Maintenance response service levels are in the detailed plans. 2

4 Safety All Assets are subject to a particular inspection schedule and the department in charge will repair defects to ensure they are safe and fully operational. State of the Local Infrastructure The Plan contains charts and graphs which provide a snapshot of the core asset classes. On age-based criteria, approximately 65% of the road surfaces are past their calculated useful lives, with figures for bridges and culverts at 58% and for linear water, sewer and stormwater infrastructure at only 5%. On condition-based criteria, the picture is much healthier, with 85% of road surfaces in good to excellent condition, with a similar figure of 85% for bridges and culverts and the figure for water, sewer and stormwater assets at 52%. The Town has engaged the engineering firm of BM Ross & Associates to develop a formula to determine Levels of Service of particular asset classes. The methodology used is extensively described both in the body of the plan and in Appendices A, B and C. The results of condition ratings and other data which has been entered into the model are shown in the Charts in Section 9. In general, it shows that the majority of the Town of Minto s tangible assets are delivering at least a good operating level of service. An important next step in enhancing this Plan is to decide on a Desired Level of Service for each category. This will require community engagement as well as input from Council and staff. Asset Management Strategies The Plan provides a summary of the rehabilitation and replacement strategies pursued by the Public Works department over the lifecycle of the core asset classes. The Town of Minto is responsible for a very large number and variety of assets considering its relatively small population. This creates financial pressure on both operating and capital budgets and the knowledge and expertise required of staff to efficiently utilize and maintain these assets continues to grow. Risk Management The core assets of the Town of Minto have been segmented in terms of the probability and consequences of failures to create a risk matrix for each asset class. This information was created using the criteria which is a part of the asset management software program, Citywide Tangible Assets module, and may be used as a tool to assess the criticality of 3

5 capital spending projects. There are several road projects which are classed as extremely high priority using this software selection. Financial Strategy There are many ways to look at the amount of money which should be spent on asset replacement and renewal. One criterion is to use historical cost and related amortization as a guide to determine adequate capital spending. This method is certain to produce a figure which is too low, as the municipality has owned many assets for a long period of time. Not only is the original historical cost very low, but many are fully amortized and the cost of their replacement is minimally represented in the annual amortization expense. A better way is to look at replacement costs on an aged-based method. This should give a better idea of when assets should be replaced, all things being equal and recognizes the impact of inflation on capital expenditures. In general, the Town uses consumer inflation indices such as the Consumer Price Index to determine the future cost of such items as equipment and vehicles. However, for the majority of assets, which are not subject to a large retail market, a better index to use is something geared to the construction or municipal sectors such as the Non-Residential Construction Index. The best method to use to determine the actual cost of asset replacement and the timing of capital spending is to complement the aged-based calculations with up to date condition ratings and then use End of Life replacement costs to arrive at the actual funds required. The problem with actually using this method is that the condition ratings may not be available, the inflation rates used to project into the future may be high or low and the future condition ratings are subject to improvements if betterments are made or rapid declines due such things as adverse environmental conditions. Therefore, the Town proposes to use software calculations but with a skeptical view. The real world experience of front line staff combined with the judgments of financial staff and Council should always be incorporated into multi-year financial plans. With that point being granted, the Town of Minto has consumed about 52% of tax-supported TCAs, 25% of water assets and 37% of wastewater assets. Software projections indicate that capital spending on the six core assets should be increased by about $5 million annually for these core assets. 1.6 The Next Steps It is very important for readers of this Plan to understand that it is a living document. Many amendments are necessary to improve the integrity of the data in the Plan and coordinate the various studies and reports which were received late in Where time permitted, the data from these reports are included, but much more work remains to provide inputs for 4

6 the Citywide software and train Public Works and Treasury staff to obtain useful information from the software. The priority actions resulting from this Asset Management Plan are: Maintain Geographic Information System data regarding assets using the document management Find It! Software and ARC Geographical Information System location software. Refine and improve opinions regarding condition ratings Public Works dept. will assume responsibility for asset condition and risk assessments where possible Incorporate tangible capital assets from other departments as an integral part of this plan in order to improve its usefulness as a capital budgeting tool and for long range financial planning Assess asset capacity and condition ratings. Include consideration of the Minto Integrated Community Sustainability Plan, Culture Plan, Fire Master Plan and Strategic Plan objectives as this AMP develops. Research best practices from OGRA, MFOA, AMO and other organizations. Develop processes that inspect and rate the condition of assets on a regular basis. Develop processes for capturing new and disposed assets, to ensure they are recorded into the asset register. Investigate maintenance and operating costs at an asset level. Improve the accuracy of financial forecasts using information produced by this Asset Management Plan. 5

7 2. INTRODUCTION 2.1 What is Asset Management? An asset management is a model for sustaining the Town s physical assets and practices that is applied to the entire portfolio of assets at all levels of the organization. It helps to minimize the total cost of acquiring, operating, maintaining and renewing the assets within an environment of limited resources while continuously delivering specified consistent with regulations at an acceptable level of business risk to the organization. 2.2 What is an Asset Management Plan? It is a tactical plan for managing an organization s infrastructure and other assets to deliver an agreed standard of service. Asset Management Plans will provide an understanding of: The extent of the Town s asset inventory and replacement valuation Condition of each asset in the inventory Existing and desired service levels Financial commitments needed to operate, maintain, renew and replace assets Policies and programmers needed to be sustainable 2.3 Goal and Benefits The goal of asset management is to meet a required level of service in the most cost effective way through the creation, acquisition, operation and maintenance, renewal and disposal of assets to meet the needs of present and future customers/communities. Asset management planning is to ensure investments are made in our infrastructure at the correct time, in order to minimize future repair and rehabilitation costs. Using data based decisions, the Municipality strives to ensure a level of acceptable service is being met across all infrastructure assets. The development of the Asset Management Plan will assist in the attainment of the objectives, actions and initiatives outlined in the Public Works section of the Town of Minto Strategic Plan which was recently updated in July 2013 and attached as Appendix D. The timeline of the information included in this Plan ranges from a minimum of ten years to the typical End of Useful Life (EOL) of assets where sufficient data is available. There are some benefits associated with an Asset Management Plan such as: Improve performance and control of levels of service Improve financial planning for maintenance and replacement Improve risk management strategies Improve safety of those using municipal assets Ensure sustainable performance and planning 6

8 3. SCOPE There is no single approach to improving how a municipality manages their assets. Where to focus your efforts in the development of an asset management plan, what to do and how to do it all depends on a municipality s priorities, needs and capabilities. These questions assist in determining project scope: 1. Does the municipality s current long range planning consider the useful life of an asset and the total lifecycle costs for an asset? 2. Does current long range planning take into account alternative strategies for asset maintenance, preservation, renewal and replacement? 3. Do current management practices provide guidance for capital and financial planning? 4. Is the allocation of resources for the provision of programs and services consistent with policy goals and objectives? 5. Are performance measures used to confirm achievement? 3.1 Assets to Include Asset management plans can be developed for all assets all at once. This can be a very onerous task for a small municipality and prevent the project from moving forward. According to the Building Together handbook, the asset classes Roads, Bridges, Water, Wastewater and Social Housing are the required asset classes to include in the 2013 AMP. For the Town of Minto, the asset classes are roads, bridges, culverts, stormwater, water and wastewater. All TCAs related to these classes have been included in the list of assets where possible. In 2014 and future years, there will be a staged implementation where assets from other departments such as recreation, fire and administration are added to the plan over time. The table below provides a list of road and bridge assets that may be included in an asset management plan. 3.2 Other Considerations The assets covered by this asset management plan are shown in Table 3a. These assets are used to provide the core services to our community. 7

9 Table 3a: Assets covered by this plan 8

10 3.3 Plan Framework Key elements of the plan are: Executive summary overview of the AMP. Introduction background of asset management planning and how it relates to the Town of Minto. State of local infrastructure Condition ratings and risk assessments. Expected levels of service discussion of what services the municipality is capable to deliver compared to community expectations. Asset management strategy practices physical care and maintenance of TCAs. Financing strategy how the municipality can fund the replacement and maintenance of the TCAs which are included in the AMP. 9

11 4. STATE OF LOCAL INFRASTRUCTURE The Town of Minto created an extensive inventory of municipal assets as part of the Province-wide adoption of the Public Sector Accounting Board s (PSAB) Section 3150 regarding Tangible Capital Assets (TCAs). From the beginning a component approach was used whereby large assets were broken into sections each with their own useful life and related amortization. For example, a road segment consists of land, subsurface and surface. A typical building would consist of foundation, structure, HVAC and roof. At present the Town is tracking over 3,400 assets including those allocated to departments such as fire, recreation and administration which are not covered in this Plan. Historical cost data was obtained through actual invoices where possible and benchmarks in combination with deflation indices were applied where other information was not available. This inventory was initially entered into the Keystone Fixed Assets module and in 2012 this database was replaced by the Citywide Tangible Capital Assets module which integrates with the Capital Planning & Analysis module to assist in the development of long range capital plans. The Citywide software is currently being used by over 120 Ontario municipalities to assist with Asset Management. It is a powerful but complex program and to take full advantage of its capabilities will take further staff training and input of data into the system. An example of some of the information which has been entered and processed for only one Road Surface segment is shown in Appendix R. The Town updated data on the condition of roads, bridges and culverts in the summer of 2013 through a Roads Needs Study. This information has been entered into the Citywide software. The Roads Needs Study was completed by Triton Engineering and the Bridges and Culverts Biennial Inspection report was completed by Burgess Engineering Inc. A partial sample of a typical bridge inspection report is shown in Appendix N. For stormwater, water and wastewater assets, conditions are based upon age except where Public Works staff have more information to replace the age assessment. These condition ratings take precedence over age-related replacement dates in the situations where age-related calculations differ from those which result from condition-rating calculations. The following table shows a few Quick Facts about the Town s assets: 10

12 Numbers of assets (%) This table was created from data entered into the Citywide Tangible Assets module and they provide a snapshot of the age and condition of various asset classes. The graphical data on the following pages is supported by detailed lists of assets which are included in the Appendices H to M. The condition ratings shown in the appendices are age-based, however the charts utilize physical inpsections where possible and are therefore a more accurate reflection of the state of the Town s infrastructure. For the Roads section of the graphs, only information for the Surface component is shown. 4.1 Asset Age Distribution Age Distribution---Roads % % % 7.32% 0 0 to 5 6 to 10 Over 10 Expired Roads Expected Useful Life (years) 11

13 Numbers of Assets (%) Numbers of assets (%) Age Distribution---Bridges & Culverts % % % % 7.41% 3.77% 3.70% 3.70% 0 to 5 6 to 10 Over 10 Expired Bridges Culvert Expected Useful Life (years) Age Distribution---Water, Wastewater & Storm Water % 100% 95% % 1.80% 0.42% 0.60% 5.23% 2.60% 0 to 5 6 to 10 Over 10 Expired Water Wastewater Storm Water Expected Useful Life (years) 12

14 4.2 Asset Condition Roads - Surface Bridges 13


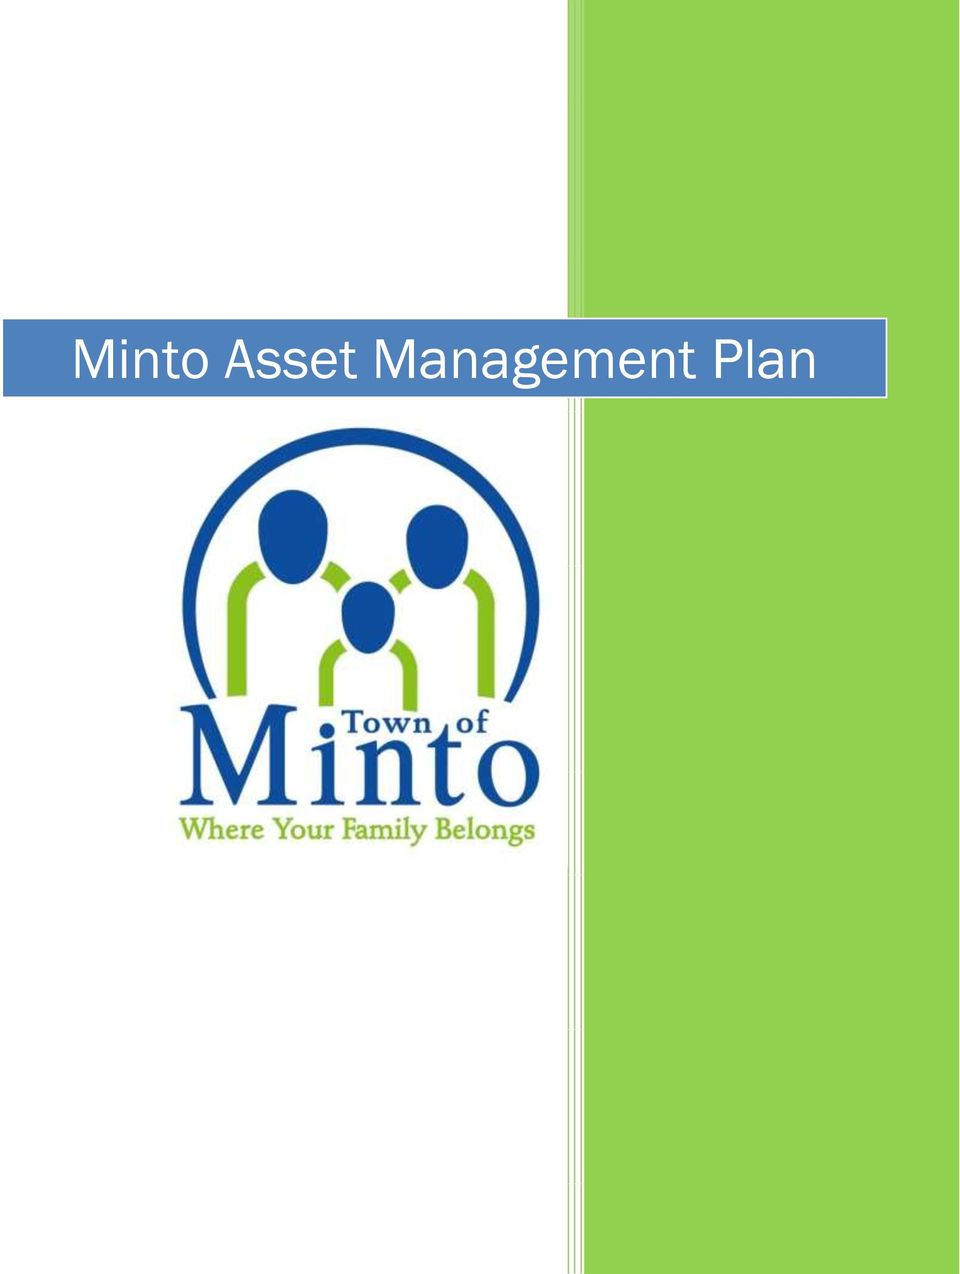
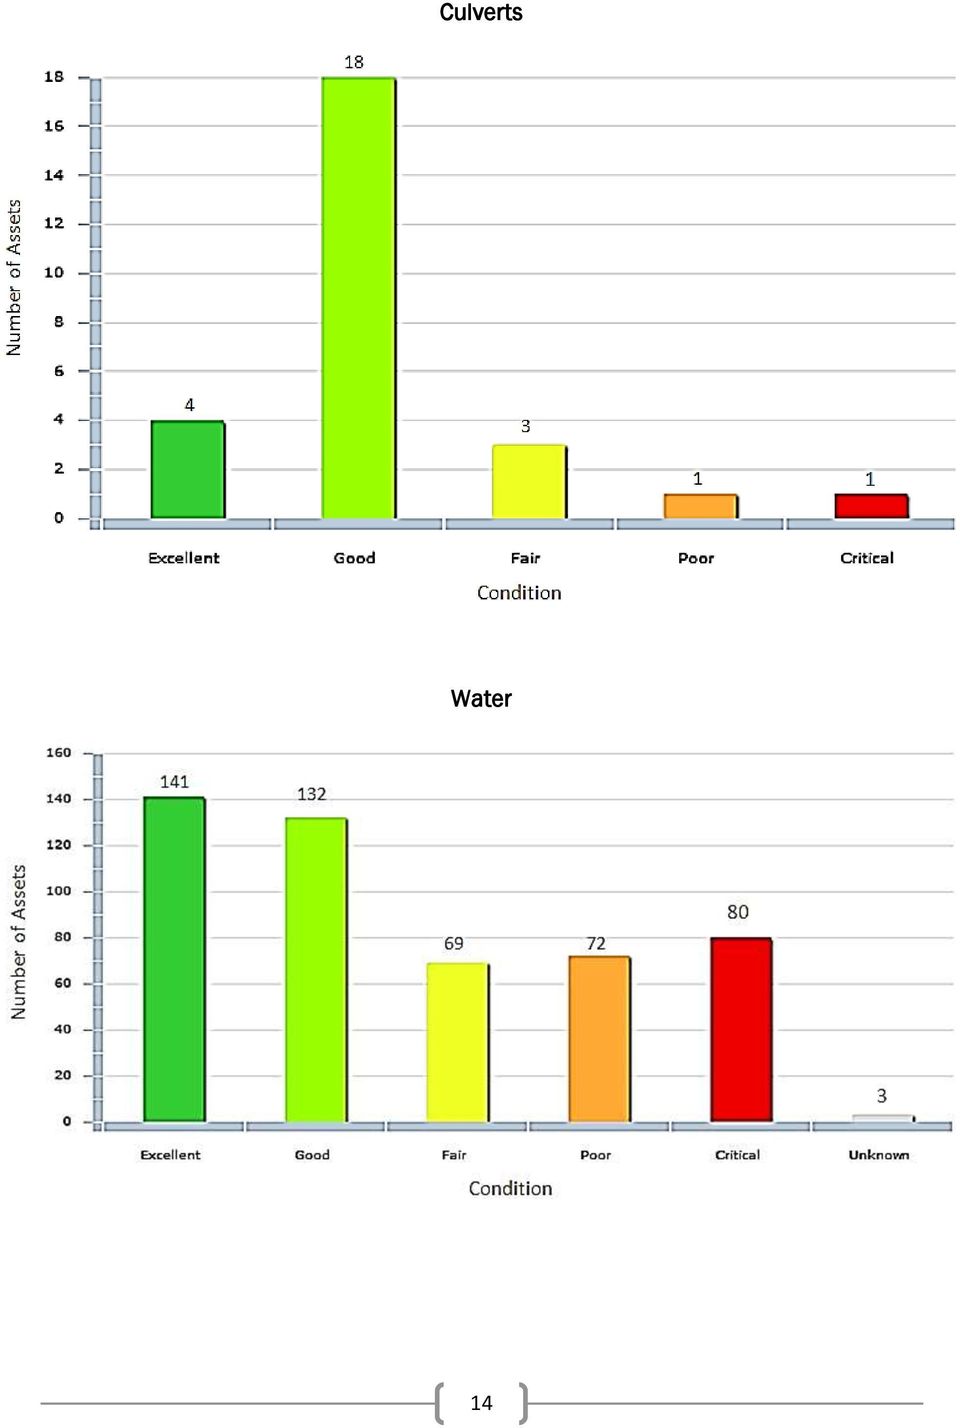
15 Culverts Water 14

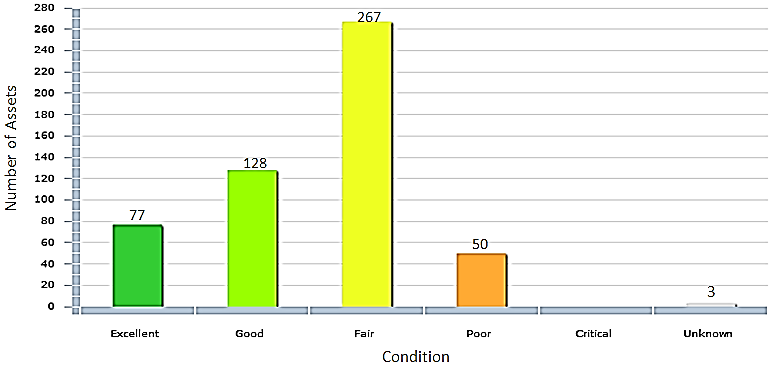
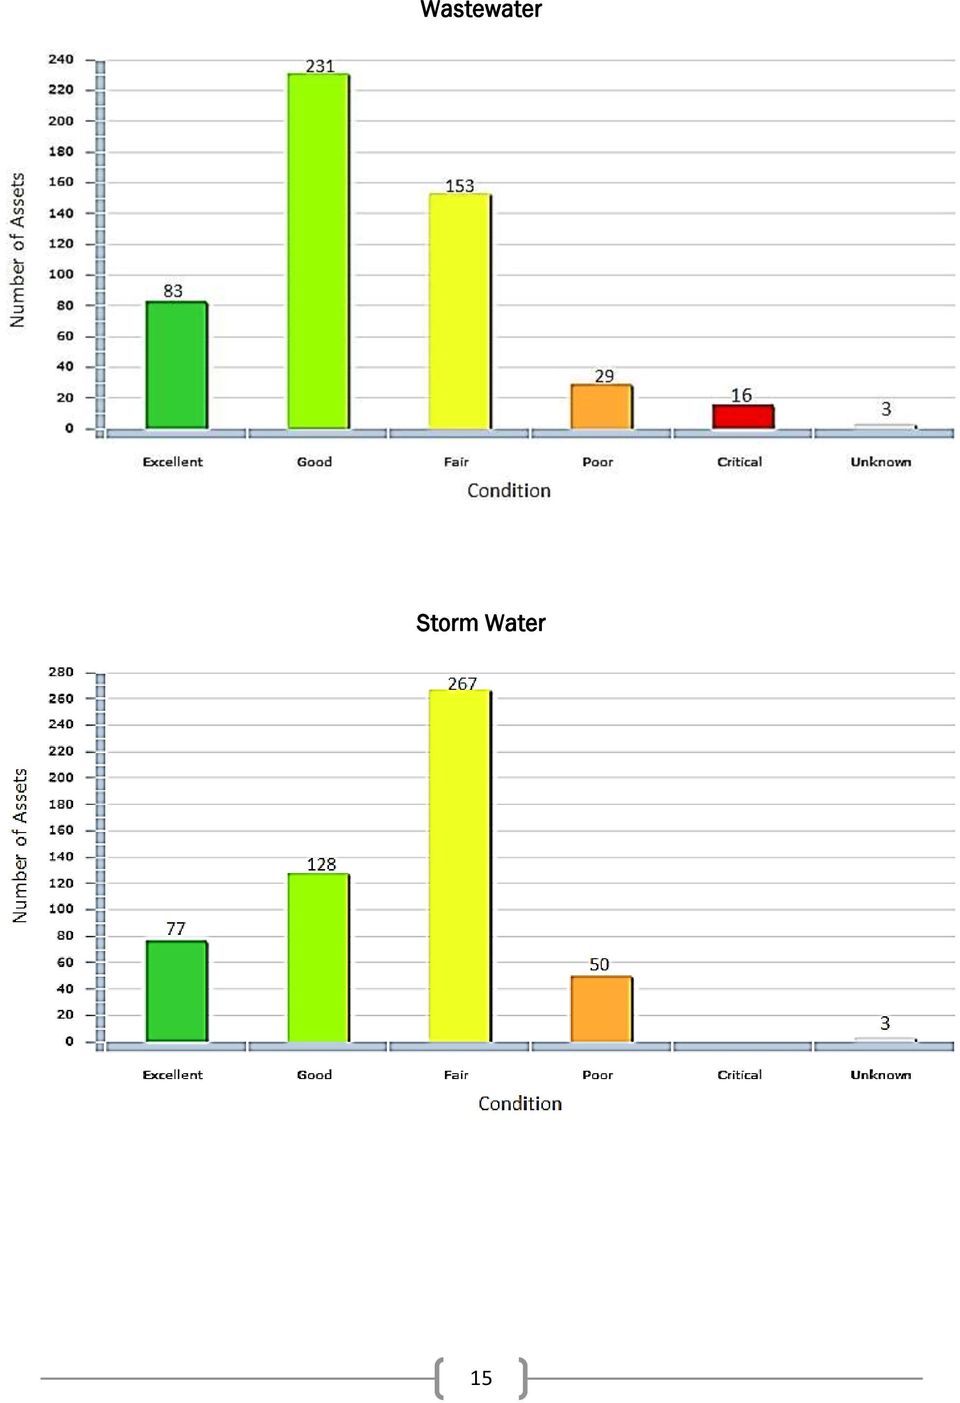
16 Wastewater Storm Water 15
17 5. ASSET REPLACEMENT PRIORITY RANKING 5.1 Snapshot of the Ranking System The Town has incorporated the data contained in Citywide Tangible Assets into the Asset Management Plan. The approach proposed by BMROSS uses a number of excel spreadsheets to supplement Citywide s asset registry, providing a more thorough way to generate Probability of Failure, Consequence of Failure and Levels of Service values for the individual assets. Citywide Tangible Assets and BMROSS approach uses the Probability of Failure, Consequence of Failure and Levels of Service values mentioned above to generate prioritized rankings of those assets in need of improvement. 5.2 Citywide Tangible Assets Approach Figure 5a presents a basic overview of the process that Citywide Tangible Assets uses to prioritize assets in need of improvement. Figure 5a: Citywide s Ranking Process As shown on Figure 5a, Probability of Failure and Consequence of Failure values are generated for each asset. This is done in the following way: Probability of Failure Citywide is setup to automatically (default setting) calculate an asset s condition value based on the current age of the asset and a user-defined life expectancy. Furthermore, the 16

18 program defaults to using a straight-line, age based deterioration assessment. For example, if an asset is 3 years old and defined as having a life expectancy of 4 years, Citywide will determine that 75% of its life has been used up and will report its condition grade as 25- poor. Alternatively, the user has the option of switching from the straight-line deterioration calculation to a deterioration curve, should that be a more appropriate approach. Citywide also provides the option of manually inserting a condition grade to override the default setting. This manually inserted value would likely be based on site inspections as Citywide provides space to record that completed the inspection and when. The condition grade is inserted as 1 (bad) to 100 (good), which is later converted to a 1 (very low) to 5 (very high) Probability of Failure value. Consequence of Failure Citywide is setup to automatically (default setting) calculate an asset s Consequence of Failure value. This is based on a calculation that Citywide performs which considers the original cost of a particular asset in relation to the original cost of other assets in the same group (i.e. bridges). For example, if a watermain costs $10,000 to build and other watermain assets cost $100,000 to build, Citywide may determine that the first watermain asset has a Consequence of Failure of 1 - very low. Consequence of Failure values are summarized between 1 (very low) and 5 (very high). Citywide provides the option of manually inserting a Consequence of Failure value to override the default setting. Risk As indicated by Figure 5a, Citywide s risk evaluation forms the basis for ranking asset improvement priorities. Risk is found by summing the Probability of Failure (1-5) value with the Consequence of Failure (1-5) value, resulting in a value ranging from 2 (very low) to 10 (very high). In other words, whichever asset is given the highest Risk value would consequently be ranked the highest in the priority list. 17

19 5.3 BMROSS s Approach Expanding on the work that Citywide Tangible Assets is already completing, BMROSS developed the process displayed in Figure 5b for prioritizing assets in need of improvement. Figure 5b: BMROSS s Ranking Process As shown on Figure 5b, Probability of Failure and Consequence of Failure values are again developed and used to generate a Risk of Failure value. BMROSS has suggested developing a Performance value that will be used, in conjunction with the Probability of Failure value, to generate an Operating Level of Service value. The Operating Level of Service value is then summed with the Risk of Failure value to create a Priority value. It is also suggested that once all of the Operating Level of Service values have been generated for a group of assets, they be reviewed and a benchmark or Desired Level of Service value be set. The following further defines each of the components that make up this proposed process: Probability of Failure An asset s Probability of Failure value should, whenever possible, be determined based on physical inspection and a rating system for that asset. Where this is not possible, the default method in Citywide should continue to be used (i.e. age/life expectancy). Due to the obvious differences between the asset groups, they cannot all be evaluated or scored using the same rating system (i.e. the condition of a road cannot be compared to the condition of a watermain, only to the condition of other roads). Therefore, condition assessments are proposed for each of the different types of assets as follows: 18

20 Roads Roads are relatively easy to access and compare with one another. It is proposed that condition grades for all roads be assigned based on physical inspections. BMROSS is not aware of a grading scheme that has been universally accepted for roads. The Inventory Manual for Municipal Transportation Networks (Ontario Good Roads Association) presents one possible way to assign condition grades. This method considers horizontal alignment, vertical alignment, surface condition, shoulder width, level of service, structural adequacy, drainage and maintenance demand when generating condition grades. BMROSS has their own system for rating the condition of roads beginning with condition ratings provided in the Road Needs Study. Only the surface condition and structural adequacy of the road has been considered. Horizontal alignment, vertical alignment, shoulder width, drainage and maintenance demand are considered performance criteria and it is open to question what application they have to the physical condition of the road. Furthermore, level of service (at least in the sense that the above Inventory Manual is using it) is based on the number of people using the road, which has an impact on the Consequence of Failure, but is not the most accurate way to judge the condition of the road. The values that BMROSS generate are in the range of 1 (bad) to 10 (good) consider the condition rating in the Roads Needs Study. They will have to be converted into Citywide s Probability of Failure range of 1 (very low) to 5 (very high). Regardless of who rates the condition of the roads, it is recommended that all roads be scored according to the same system for consistency. Bridges and Culverts Similar to roads, bridges and culverts are relatively easily accessed and their condition grades should be based on physical inspections. Bridges and culverts will have were inspected in 2013 using an Ontario Structure Inspection Manual (OSIM) inspection and report format. The Town s 2013 OSIM inspection and report provides a condition assessment of each component of the structure. These various assessments are then brought together into one overall condition grade called a bridge condition index or BCI. The BCI is a number between 0 (bad) and 100 (good). This BCI was used to generate the Probability of Failure number, which will have to be converted into Citywide s range of 1 (very low) to 5 (very high). Sanitary and Storm Sewers The most accurate way to understand the condition of a sanitary or storm sewer is to complete an inspection of that asset. Unlike roads and bridges, access becomes more difficult for buried pipelines. Camera inspection is a common way to inspect sanitary and storm sewers. There are two generally accepted processes to generate condition grades based on camera inspections: a Pipeline Assessment Certification Program (PACP) or a 19

21 Manual of Sewer Condition Classification (MSCC) program. Both methods will produce a condition grade in the range of 1 (good) to 5 (bad). These values could then be used to generate a Probability of Failure value by converted them into Citywide s range of 1 (very low) to 5 (very high). However, realistically this is cost-prohibitive. Minto therefore has relied upon the experience and technical knowledge of staff to modify age-based condition ratings and performance measures data where possible. In the case of Palmerston, earlier Inflow and Infiltration work by the engineering firm of Gamsby and Mannerow was integrated in the assessment as well. Both PACP and MSCC inspections require committed financial investments. Many Municipalities will have completed a limited number of these inspections in the past. This data should be used if available and in all other cases, Citywide s default method (where the asset s condition is determined based on the age and life expectancy of that asset) should be used. However, it is suggested that the Town consider using life expectancies that are dependent on the asset s material properties (e.g. a longer life expectancy for concrete sewers than for clay sewers). Watermain Compared to the other assets mentioned above, watermains are the most difficult to inspect, given that they are constantly pressurized. The most realistic way to estimate the condition of these assets is to use either the straight-line or deterioration curve approach, based on the age and life expectancy of the asset. The same cost pressures will limit the amount of actual inspections completed in Minto. The values will have to be presented in accordance with Citywide s Probability of Failure range of 1 (very low) to 5 (very high). Similar to sanitary and storm sewers, it is suggested that the Town consider using life expectancies that are dependent on the asset s material properties (e.g. a longer life expectancy for plastic watermain than for ductile iron watermain). Note that leak detection inspections are an affordable way to provide some form of physical inspection and can be used to supplement the asset s estimated condition grade. 5.4 Consequence of Failure It was mentioned earlier that Citywide uses a default method to calculate a Consequence of Failure value that considers the original cost of a particular asset in relation to the original cost of other assets in the same group of assets (i.e. bridges). It is suggested here that, whenever possible, the Consequence of Failure value should be determined based on a list of asset-specific environmental, economic, social and operational factors. Where this is not feasible, use Citywide s default method. This alternative method was developed because the failure of an asset will, in actuality, have an impact on more than just the replacement cost of that asset. For example, if a forcemain 20
22 fails, the consequence of this failure is potentially much greater when the forcemain is located at a stream crossing rather than in a road allowance. A list of factors (environmental, economic, social and operational) was developed for each asset group. The asset-specific ranking systems are included in Appendix A. Scoring the assets on the various factors and applying a weighting scheme to those scores (described later in this document and included in Appendix B) will generate a Consequence of Failure value in the range of 1 (low) to 5 (high). It should be noted that, in asset management terminology, the term Consequence of Failure is often used interchangeably with Overall Criticality Index. Also, in BMROSS documents, we have replaced Consequence of Failure with Consequence of Deterioration in the context of roads, since roads do not typically fail. A similar change may be noted regarding Risk of Failure and Risk of Deterioration. 5.5 Performance In addition to Citywide s process, BMROSS has recommended the creation of a third area by which to score assets, called Performance. How an asset is currently performing is not the same as the asset s Probability of Failure or Consequence of Failure. For example, a section of watermain may be identified as having inadequate pressures or flows, yet its condition (and subsequently its Probability of Failure) remains acceptable. Similarly, the flow and pressure has no bearing on what the consequence of that watermain failing might be. Level of Service is also occurring in two different forms. One form is the Desired Level of Service or, in other words, where the Town s target levels or benchmarks are set for that asset. The second form is the Operating Level of Service or, in other words, what state that asset is actually in. Both Performance and Probability of Failure contribute to the asset s Operating Level of Service. For example, if a sewer requires regular flushing (performance issue), there is a good possibility that the sewer is cracked (condition issue) which is allowing the ingress of sediments. Similar to Consequence of Failure, Performance should be determined based on a list of asset-specific factors. Factors were developed for each asset group and are included in Appendix A. Scoring the assets on the various factors and applying a weighting scheme to those scores (described later in this document and included in Appendix C) will generate a Performance value in the range of 1 (good) to 5 (bad). 5.6 Risk of Failure As indicated by Figure 5b, BMROSS approach produces a Risk of Failure (or Deterioration) value by summing the Probability of Failure (or Deterioration) (1-5 value) with the 21
23 Consequence of Failure (or Deterioration) (1-5 value), resulting in a value ranging from 2 (very low) to 10 (very high). 5.7 Priority Also indicated by Figure 5b, BMROSS approach produces a priority ranking by summing the Operating Level of Service (2-10 value) with the Risk of Failure (or Deterioration) (2-10 value), resulting in a value ranging from 4 (very low) to 20 (very high). 5.8 Assumptions and Limitations The above descriptions should only be considered in relation to the following assumptions and limitations: The prioritized rankings generated by BMROSS s approach are valid for a limited time only. As time progresses, past condition assessments, which form the basis of the Probability of Failure Value, should be redone or re-evaluated. The prioritized ranking system should only be used when comparing assets scheduled for replacement. More analysis in conjunction with a more detailed evaluation should be used when considering major upgrade/repair projects (i.e. a sewer pipe relining). Due to time constraints and limited resources, the development of the quantified BM Ross system of Levels of Service will be an ongoing process with calculations and refinements of the Priority Values to be completed in 2014 if sufficient staff resources are available. Overall Criticality Indices have been calculated for many of the key asset categories as condition ratings and other inputs are gathered and calculated. As a next step, Public Works staff will need to review and evaluate the data produced to date and these Priority Values will be included as part of the next edition of this AMP, possibly in time for posting in May,
24 6. SCORING THE ASSETS BMROSS, in coordination with Town staff, determined an approach for generating Consequence of Failure and Performance values for individual assets within a particular asset group. Examples for each asset grouping have been provided in Appendix B and C and descriptions of the processes are provided in the following sections. 6.1 Determining Values for Consequence of Failure As depicted by the asset-specific ranking systems included in Appendix A, there are four general categories that will ultimately determine the Consequence of Failure of an asset. The categories include economic, operational, environmental and social factors which are unique to a specific asset group. For example, the cost (economic factor) to replace a road is directly influenced by how many lanes that road has; whereas, the cost to replace a watermain is directly influenced by whether that watermain is located under the road or beside it. Appendix B provides suggested rating factors and weighting scales that were used to transform the following categories and factors into one overall Consequence of Failure value. The rating factors and weighting scales were established based on experience but can be adjusted. 23
25 6.1.1 Creating Consequence of Failure Values for Specific Asset Groups The following table describes the categories and factors that were used to determine Consequence of Failure values for each asset group: 24
26 25
27 6.2 Determining Performance Values As depicted by the asset-specific ranking systems included in Appendix A, there are different factors that establish how an asset is performing. These factors are unique to a specific asset group. For example, a watermain is not performing well when it is known to be leaking; whereas, a road is not performing well when water ponds on the surface instead of draining away easily. Appendix C displays the suggested rating factors and weighting scales that were used to transform the following factors into one overall Performance value. The rating factors and weighting scales were established based on experience but can be adjusted Creating Performance Values for Specific Asset Groups The following table on the next page describes the factors that were used to determine Performance values for each asset group: 26
28 27
29 6.3 Types of Division Roads Division An important consideration in asset management is the determination of what constitutes a satisfactory standard for roads assets. The proportion of our two broad roads asset types in various conditions are summarized in Table 6a. The condition of assets covered within this plan has been assessed using the one hundred point rating criteria. Condition rating : Excellent condition Condition rating 60-79: Good condition - minor deterioration Condition rating 40-59: Fair condition - medium deterioration Condition rating 20-39: Poor condition major deterioration Condition rating 1-20: Critical unserviceable Table 6a: Current Condition of Minto Road Surfaces, 2013 Asset Condition Rating 2013 % Historical $ Replacement (EOL) $ Excellent Good 26 3,354, ,546, ,666, ,942, Fair , ,026, Poor 1 12, , Critical 1 104, , A very small proportion of Minto s roads assets are in the Poor and Failed condition rating namely 0.8%. The amount of roads assets rated as Fair condition (14%) needs to be 28
30 monitored as it raises the possibility that significant replacement expenditure could be required in the future. Council has not conducted community surveys regarding these asset condition ratings and whether an asset condition Fair is acceptable. Bridges and Culverts Division To provide safe use of these structures, in a cost effective manner, these structures are inspected as follows: The use of the Bridge Condition Index (BCI) provides an overall rating of the complete structure. Detailed examination of each component was undertaken and the relative weighted scores of each component make up the BCI rating. The inspections are performed every two years and was last completed in 2013 by the Town. The 2013 version is over 630 pages long and contains many detailed descriptions and photographs. A small example is provided in Appendix N. Maintenance works are programmed as required: To prevent accelerated deterioration of the structure To repair any defect which poses a high risk to the public Capital works are carried out when funds are available to restore the original service level of the structure such as: Remedial works to restore or improve the original load capacity of the structure Upgrade or replace the structure if the existing structure is no longer serviceable or provides a level of service below the required level of service The current levels of service of the bridges in the Town of Minto are listed in Table 6b. 29
31 Table 6b: Current Condition of Bridges Asset Types, 2013 Taking into account the type and volume of traffic using the bridges and the type and growth rate of development in the area serviced by the bridges, and the chart of Bridge conditions in Section four, it appears that the current level of service will serve the community well into the future. 30
32 Water Division The level of service for water supply activity is the agreed quality of service that Town of Minto has established through community consultation. The process for the development and monitoring of levels of service can be summarized as follows: Identifying key stakeholders and their requirements Designing and carrying out consultation to define the desired service level Defining the current levels of service the organization delivers Establish service targets and review service achieved over a long period Measure and report to community on level of service achieved The Town through Council carries out reviews of the levels of service with stakeholders at regular intervals to check desirability and affordability of level of service provided. The asset management plan aims to document each of these steps for the activity, identify any issues such as adequacy of consultation, suitability of standards, or service gaps, and describe plans to address or improve them. It is common for customers and stakeholders to demand a continual improvement in service, and while Town of Minto will strive to deliver improvements, the level of service is constrained by cost considerations. It is therefore important that when Town of Minto consults with the community over levels of service, cost information is provided in order for the price/quality trade-off to be established. The Water Financial Plan adopted in January 2012 provides a road map for the operation of the municipal waterworks. The primary initiative is the installation of water meters in which may be read remotely and the subsequent conversion of all customers to a meter rate billing system with provision for a fixed component to ensure adequate capital asset lifecycle cost recoveries. 31
33 Table 6c indicates the levels of service and performance measures. Table 6c: Current Condition of Water Asset Types, 2013 Data from the Municipal Performance Measurement Program Performance Targets Level of Service Performance Measure Provide water that is safe and pleasant to 1. Number of waterborne disease drink outbreaks 2. Number of complaint events related to the bulk water supply 3. Percentage compliance with the Drinking Water Standards of Canada Ensure that water supply infrastructure is adequate to meet future needs while minimizing environmental impacts 4. Compliance with Safe Drinking Water Act regulations (Combined Minto water system scores) N/A N/A N/A
34 Wastewater Division The level of service for wastewater division may include a comparison between the existing sewage flow in the main and the capacity of the main. The Municipal Performance Measures Program includes two performance indicators as shown in the Table 6d. Table 6d: Current Condition of Wastewater Asset Types, 2013 Data from the Municipal Performance Measurement Program Performance Targets Level of Service Performance Measure Wastewater main Provide efficient backups per 100 and safe handling kilometres of of wastewater wastewater mains in a effluent year % of wastewater that is estimated to have bypassed treatment Storm Water Division Storm water level of service is a means of evaluating existing infrastructure and a basis for allocation of storm water resources. The challenge has been the determination of appropriate parameters for level of service evaluation. The management of storm water usually includes the reduction of flood risk and the improvement of water quality. There may be other objectives such as the protection of wetlands, improved sewage treatment efficiency, water reuse, or the improvement of ground water recharge. While there is widespread agreement that water quantity and water quality objectives are linked, LOS criteria have, in most cases, been considered separately. In general, the Town of Minto has relied upon such criteria as the amount of surcharge, infiltration and blockages, the need for regular flushing and the size of the stormwater pipes to evaluate the level of service of stormwater assets. The development of storm water LOS has been the purview of local government, and several different approaches have been proposed. While the objective seems to be a single parameter system that can be reduced to a letter grade from A to F, some have found it necessary to use multiple parameters to define the criteria. The maintenance status of the system has also been a level of service issue, and criteria for grading the maintenance status of a storm water facility have been proposed. In general, in Ontario stormwater infrastructure should allow a 1 ½ rainfall to be dissipated in a 24-hour period. The municipal stormwater pipes in Minto do not presently meet this standard in all cases. It is a long range objective to upgrade this infrastructure as pipes are replaced and new structures are added. 33
35 7. ASSET MANAGEMENT STRATEGY 7.1 Purpose and Benefits The purpose of an asset management strategy is to recognize asset consumption and ascertain likely future maintenance and renewal needs plus the need for any new additional assets to meet community service expectations. The costs inherent in an asset management plan need to be reflected in a Council s long-term financial plan and these documents are integral to, and will be heavily influenced by Departmental Business Plans and the Strategic Plan of Council. The Asset Management Strategy will enable Council to develop a set of actions aimed at improved asset management practices by: Improved stewardship and accountability for assets Improved communication and relationships with service users Improved risk management Improved allocation of resources Which will: Enable Council to effectively plan and fund its works programs Enable Council to competently deliver services to its community Enable Council to maintain its assets to an acceptable "level of service" The key elements of effective infrastructure asset management are: Ensuring appropriate use and maintenance. Recognizing that infrastructure assets must support the Council in the delivery of services to its community. Applying full life-cycle costing. Pursuing reduction or optimization and integration of those assets not achieving the most productive outcome. Defining clear responsibilities for asset, accountability and reporting. A common accepted practice to effectively manage infrastructure assets is to apply the correct rehabilitation strategy at the correct time. This includes applying preventative maintenance strategies in early stages of deterioration, then applying rehabilitation strategies in later stages and finally, replacement activities. 34
36 In order to maintain the condition, safety and to maximize the life of the asset, activities are broken into four components: 1. Minor maintenance (operating budget) 2. Major maintenance (operating budget) 3. Rehabilitations (capital/minor capital budget) 4. Replacements (capital budget) This section describes the elements of lifecycle activities which form the basis of the work carried on to maintain the Town s core infrastructure of roads, bridges and culverts, stormwater, water and wastewater assets. In fact, this AMP covers over $95 million ($247 million) of the $110 million ($288 million) (approximately 87%) of municipal TCAs as calculated on a historical cost and estimated replacement cost basis respectively as of
37 7.2 Overall Strategies and Desired Outcomes No Strategies Desired Outcome Move from Annual Budgeting to Long Term The long term implications of the level of 1 Financial Planning. municipal services are considered in Develop and annually review Asset Management Plans covering at least 10 years for all major asset classes (80% of asset value). Develop Long Term Financial Plans covering 10 years incorporating asset management plan expenditure projections with a sustainable funding position outcome. Review and update asset management plans and long term financial plans after adoption of annual budgets. Communicate any consequence of funding decisions on service levels and service risks. Ensure Council s decisions are made from accurate and current information in asset registers, on service level performance and costs and lifecycle costs. Ensure responsibilities for asset management are identified and incorporated into staff position descriptions. annual budget deliberations. Identification of services needed by the community and required funding to optimize lifecycle costs. Sustainable funding model to provide municipal. Council and the community are aware of changes to service levels and costs arising from budget decisions. Improved decision making and greater value for money. Responsibility for asset management is defined. 36
38 7.3 Types of Divisions Roads Division Roads staff, in accordance with the Ministry s minimum maintenance standards, carries out preventative maintenance activities. The Roads Department budgets for maintenance activities through the operating budget. The 2014 draft operating budget includes staff of 6 FTE s and an allocation of approximately $2.1 million in taxsupported activities for all activities which include hard and loose top road maintenance, sidewalks, winter control, traffic signals and signage, drainage, fleet vehicles, bridge and culvert maintenance, gravel pit operations and departmental administration. 37
39 38
40 Bridges and Culverts Division 39
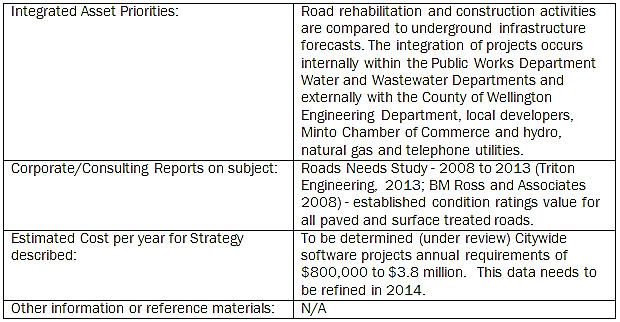
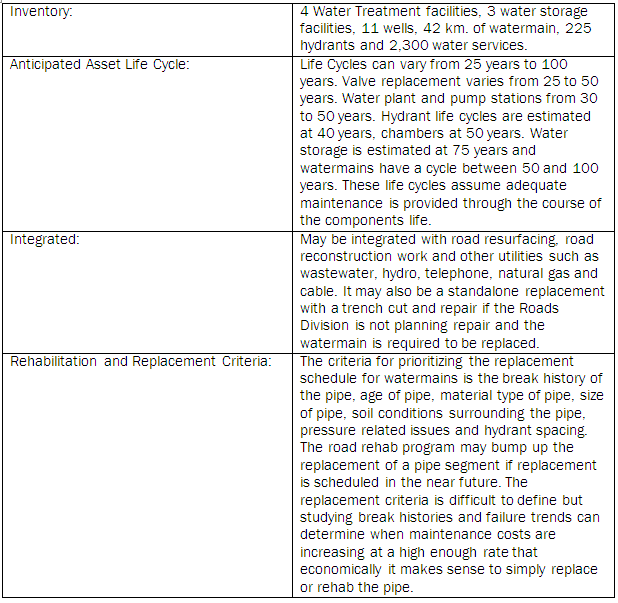
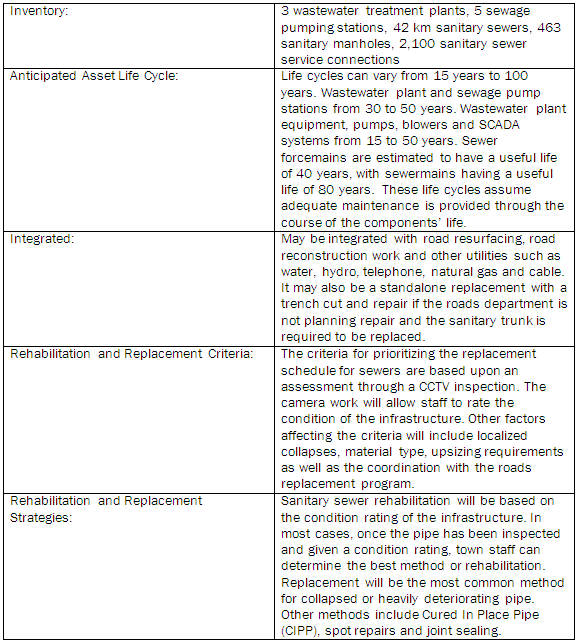
41 Inventory: Anticipated Asset Life Cycle: Integrated: Rehabilitation and Replacement Criteria: Rehabilitation and Replacement Strategies: Life Cycle Consequences: Integrated Asset Priorities: Corporate/Consulting Reports on subject: Estimated Cost per year for Strategy described: Other information or reference materials: 14 bridges and large culverts (over 3m span), 33 concrete or steel culverts (between 1.2m and 3m span) Depending on construction practices and materials, bridges and culverts have varying assumed lives. The life cycle can also be affected by traffic volumes and loads, climate and salt exposure. Bridge foundations are expected to last 80 years and bridge decks about 40 years. Concrete culverts are anticipated to last 80 years, while large corrugated steel culverts have an expected life of 40 years. May be integrated with road resurfacing or road widening projects however generally not integrated with other infrastructure. Criteria for prioritizing include level of service and traffic volumes, safety and to preserve infrastructure. Bi-annual visual inspections of bridges are completed and detailed bridge construction surveys are completed as required. Bridge components are evaluated and tested providing severity and extent of deterioration and overall condition. An overall Bridge Condition Index is provided for each bridge. A value of 100 indicates that the bridge is in excellent condition and a value of zero indicates that the bridge is in extremely poor condition. Bridge rehabilitation or replacement is based on bridge age and assumed life spans and result of condition surveys: Asphalt deck resurfacing - 25 years, joint replacement - 40 years, patching or waterproofing of concrete deck - 40 years. Bridge and culvert life cycles will be reduced, level of service is lowered and safety is compromised. N/A Bridge & Culvert 2013 Biennial Inspection Reports (Burgess Engineering Inc.). - established current condition values for all bridges and culverts To be determined (under review). Preliminary Citywide data indicates an annual requirement of $630,000. N/A 40
42 Water Division 41
43 42

44 43
45 Wastewater Division 44
46 45

47 46
48 Storm Water Division 47

49 48

50 49
51 8. RISK MANAGEMENT Risk Management is an integral part of good business practice and works in tandem with strategic and financial planning. Risk Management is the process identifying risks an organization faces and then developing policies, processes and actions that will mitigate the risk to minimize the impact of the risk. Developing and maintaining a risk management framework is an effective way to identify, manage and respond to risks within an organization. Risk Management allows for systemic change and continuous improvement in planning, resource allocation, decision making and processes and delivers outcomes such as: Improved asset management Improved planning, performance and effectiveness Providing a basis for higher standards of accountability and sound governance Protecting the organization from legal liability Reducing insurance premiums Protecting the Council s corporate image as a professional, responsible and ethical organization and an employer of choice Capacity to respond to new opportunities Improved prioritization of activities and projects Improved project outcomes and reporting by documenting objectives and key actions in Councils Risk Register Risks are rated according to the following matrix: Likelihood 5 Almost certain 4 Likely 3 Possible 2 Unlikely 1 Rare Consequences Insignificant Minor Moderate Major Severe M H H E E M M H H E L M M H E L M M M H L L M M H Rating Risk level (E) Extreme risk - detailed action/plan required (H) High risk - needs senior management attention (M) Moderate risk - specify management responsibility (L) Low risk - manage by routine procedures 50
52 The following charts illustrate the number of assets in each matrix box and their related historical costs for each division based on information produced by Citywide software. These ratings are of course subject to further review and refinement. Roads 51
53 Bridges Culverts 52
54 Water Wastewater 53
55 Storm Water The information contained in the above charts should be considered when determining asset replacement priorities, as the TCAs which have a high consequence of failure combined with a high probability of failure need to be placed at the top of capital budget allocations. 54
56 9. LEVELS OF SERVICE 9.1 What are Levels of Service? Levels of service are often documented as a commitment to carry out a given action or actions within a specified time frame in response to an event or asset condition data. The level of service is a reflection of the quality, function and capacity of the services being provided. Service levels may relate to reliability of service, quality of service, quantity of service, and safety/risk/security. Service levels are the result of balancing community need with the cost of providing the service at a given level of satisfaction. In most cases a decision to provide an increased level of service will require additional funding to provide the service. Alternatively a decision to reduce funding will generally result in lower service levels. Objectives Service-level objectives should be realistic, in line with a budget, understandable, and measurable. The definition of service-level objectives is iterative. The service-level objectives may change with every change in: Workload Resource consumption of the work Turnaround and response time requirements Needs or priorities of the business Product capabilities, which can lead to revised performance expectations Detailed objectives make such changes noticeable and help identify solutions to performance problems that arise because of the changing nature of the workload. The definition of service-level objectives is not a trivial task. It is necessary for disciplined performance analysis and for planning new applications and additional work. 9.2 Operating Level of Service As indicated by Figure 5a and discussed above, BMROSS s approach generates an Operating Level of Service value by summing the Performance (1-5) value with the Probability of Failure (1-5) value, resulting in a value ranging from 2 (very good) to 10 (very bad). 55
57 9.3 Desired Levels of Service At present, indications of desired levels of service are obtained from various sources including the focus groups included in the development of the 2013 updated Strategic Plan, residents feedback to Councilors and staff, service requests and correspondence. Council has yet to quantify all of its desired levels of service. This will be done in future revisions of this plan. As discussed above, BMROSS is suggesting that a Desired Level of Service value, in the range of 2 (very good) to 10 (very bad), be established once the Operating Level of Service values have all been generated for a particular asset group. This will essentially provide a group of assets with a minimum target level that they must achieve and will ensure that all the assets are kept to a defined performance standard. The Desired Level of Service value can take into account many different factors, such as: the status of the Operating Level of Service values in the other asset groups, how much the Town can afford to invest in their infrastructure, at what point the Operating Level of Service values become a danger to the public, the anticipated state (Operating Level of Service value) of the asset groups in the near or distant future, etc. This decision requires careful balancing between the different asset groups and the financial capabilities of the Town. The Desired Level of Service value can be adjusted over time. This value will become the driving force behind all future improvement initiatives and expenditures required. The following charts summarize the Operating Levels of Service for the core asset classes. These findings result from taking the input values as described in Section 5 and illustrated in Figure 5b and processing them through the spreadsheets such as shown in Appendix Q. The lower the number of the Operating Level of Service, the better the ranking is. Operating Level of Service rating 1-2: Operating Level of Service rating 3-4: Operating Level of Service rating 5-6: Operating Level of Service rating 7-8: Excellent Good Fair Poor Operating Level of Service rating 9-10: Critical 56
58 Numbers of segment Numbers of segment Roads Roads NOTE: The assets with a value of zero do not have sufficient data to calculate an accurate Operating Level of Service Bridges & Culverts Bridges & Culverts
59 Numbers of segment Numbers of segment Water Water Wastewater Wastewater
60 Numbers of segment Stormwater Stormwater Therefore, the results indicate that approximately 56% of road assets are currently delivering at least a Good Operating Level of Service according to this methodology. For Bridges and Culverts, the percentages of assets at the Good to Excellent level is 37%; for Water 56%; Wastewater 97%; and for Stormwater infrastructure 83%. From an overall point perspective, these calculations reflect the last decade s investments in the municipality s tangible capital assets but the figures show there is more to do. 59
61 10. FINANCIAL SUMMARY AND INFRASTRUCTURE GAP This section contains the financial requirements resulting from all the information presented in the previous sections of this plan. The financial projections will be improved as further information becomes available on desired levels of service and current and projected future asset performance. The development of a long term (20 year) Asset Renewal Plan for all Assets from the AMPs provides a direct input into Council s Long Term Financial Plan. This is a key outcome from the Asset Management Plan as it provides a forecast of what finances the Town requires to be sustainable over the longer term. Levels of service that the community requires are applied to detailed asset data within each Asset Management Plan. This enables service based decisions in the development of a sustainable Long Term Financial Plan. The value of long-term assets is used as it is expensed over the asset s useful life. The current consumption of infrastructure assets averages 50% used. Planning now for asset renewal requires a long term financing strategy to provide a framework to guide Council in planning and decision-making. The Asset Consumption Ratio compares accumulated amortization with original cost to determine a percentage of asset value which has been consumed to date. The Tax Supported assets included in the chart also includes such non-core TCAs as recreation, fire and administration buildings. 60
 Ratio Water Ratio Wastewater Ratio An infrastructure funding gap occurs when there is a difference")
62 Asset Consumption Ratio 34.1% 35.7% 37.0% 33.1% 21.8% 23.4% 24.5% 50.5% 51.6% 52.4% 29.8% 35.4% Minto 2010 Minto 2011 Minto 2012 Ontario Avg - 84 munic-2010 Tax (Exludes Water & Sewer Assets) Ratio Water Ratio Wastewater Ratio An infrastructure funding gap occurs when there is a difference between: a) The amount of funds required annually for the renewal of an asset class over the useful life of that asset class, and; b) The amount of funds currently being spent on renewing the asset class annually. The identification of the renewal gap, will allow the Council to predict what it will need to expend in the long term on maintenance of assets. The following information will need to be documented and consolidated into the management plans for each asset group to enable analysis to determine the current and project future funding gap levels. Asset inventory Renewal costs Renewal expenditure Asset life and Intervention criteria 61
63 Asset Category $ Capital Spending 2009 $ Capital Spending 2010 $ Capital Spending 2011 $ Capital Spending 2012 $ Capital Budget 2013 Annual Amortization (Historical Cost) It is intended that this strategy will form an important part of the future budget planning process. Once the above information has been documented an initial annual renewal gap, based on the condition of all of Council s infrastructure assets, will be derived. It is proposed that these initial results will form the basis of the Council s updated financial plan. The introduction of standardized definitions between asset maintenance, operational costs, renewal, upgrade and new projects will further enhance the robustness of the information. The financial gap analysis compares the average annual asset consumption with current renewal expenditure and improvement expenditure. The gap is identified firstly in dollars and then converted to a sustainability percent. The underlying basic aim of this strategy is to achieve 100% sustainability. Table 10a Roads 1,005, , , , , ,000 Bridges 131, ,818 65,544 5,571 15,000 22,000 Culverts 55, , ,186 60,000 43,000 Water 234, , , ,838 1,100, ,000 Wastewater 2,030,642 1,066, , ,131 1,165, ,000 Storm Water 44,377 9,760 46,350 50, , ,000 TOTAL 3,502,355 2,482,730 1,461,647 2,026,552 3,415,000 1,596,000 62
64 To achieve 100% sustainability for existing assets the level of funding needs to be increased to the levels shown in the levels shown in Table 10b. Specific Capital Expenditure Financial Actual Budget 2013-Avg Table 10b Funding Required for Historical Cost Replacement $ Calculated Annual Funding Required for EOL Replacement Cost Per Citywide $ $ $ Renewal (Capital) Roads 777, ,000 4,955,000 3,483,000 Bridges 131,000 21, , ,000 Culverts 104,000 34,000 73, ,000 Water 497, , ,000 2,069,000 Wastewater 994, , ,000 1,647,000 Storm Water 75, , ,000 1,242,000 Total Capital Budget 2,578,000 1,512,000 6,937,000 8,846,000 Gap The reader is cautioned that the Calculated Annual Funding amounts in Table 10b are those produced by Citywide software based upon the data contained in it and the particular criteria selected to produce these figures. For capital budget planning purposes, it is much more useful to rely on such reports as the Bridge Financial Planning (Appendix O) or the Road Construction Needs (Appendix P). For the six core asset categories, the Figure below shows the total capital expenditures required to replace existing assets based upon an End of Life Replacement Cost basis again using Citywide figures. The figures shown here have been developed by taking individual asset replacement projections and summing them into broad categories. These data points were then converted to a graph for visual presentation in this Plan. 63

65 Replacement Schedule Roads Bridges Culvert Water Wastewater Storm Water $9,000,000 $8,000,000 $7,000,000 $6,000,000 $5,000,000 $4,000,000 $3,000,000 $2,000,000 $1,000,000 $- 64
66 11. CONCLUSIONS Overall, the Town is in a good position to move forward with sustainable asset management planning: The ultimate objective of this Asset Management Plan is to provide the Town of Minto with better information to make decisions on how best to manage capital assets over the long term Summary of Key Findings The Town has made considerable investments in water and wastewater to modernize facilities and replace and improve the capacity of linear assets. The Town has made good use of infrastructure grants which were available during the 2008 to 2012 period in order to fund certain road and bridge projects which would have been difficult to finance using only money from property taxes. The development of the Asset Management Plan has provided a very good opportunity to review the state of the municipality s core assets using both outside experts and the knowledge of Public Works staff. It has of necessity required Treasury and Public Works staff to work together on obtaining data, analyzing the available information and reviewing the content of technical reports with the goal of making better capital investment reports for Council decision making. The large dollar figures involved in capital expenditures reinforce the importance of having sufficient municipal reserves and making judicious use of debt to undertake large projects. The adoption of full cost recovery for water and wastewater operations in the first decade of the 21 st century has put these vital departments on a firm financial footing for the long term. It will be a challenge to put tax-supported infrastructure on a similar sustainable footing given the relatively small assessment base of the Town of Minto in comparison to the large amount of capital assets which it is responsible to maintain. 65
67 11.2 Summary of Recommendations Based on the research and analysis undertaken for this Plan the following recommendations should be considered: The Town should continue to strive to adopt multi-year capital budgets and forecasts for all departments. As outlined in the Executive Summary of this Plan, there are many concrete actions which should take place to improve the quality of data contained in the Plan and make full use of the Citywide Capital Planning and Analysis module, take delivery of FindIt! Database technology and integrate GIS software into the Public Works and other departmental information resources. Given the complexity and volume of data required to maintain and improve Asset Management in the Town of Minto, it is crucial that adequate staff resources as well as funding for technology solutions be provided by Town Council. Repair and replacement capital works should be prioritized based on asset condition ratings with assets overdue for replacement and/or identified as "poor" identified for immediate attention. Assets which have been provided a "fair" condition rating should be targeted for maintenance to ensure they continue to perform at the expected level. The Town should continue to work to achieve comprehensive maintenance plans for all asset classes. Sound asset management decisions are only possible if information in the asset registry is accurate. The Town should regularly update the registry to account for asset purchases, upgrades, and replacements, as well as asset condition ratings and information on useful life. Town staff and Council should continue to be open to suggestions and learn from best practices to improve asset management in all departments. 66
Township of Enniskillen. Asset Management Plan
 Township of Enniskillen Asset Management Plan 2014 1 TABLE OF CONTENTS Page A. Introduction 3 B. State of Local Infrastructure 4 C. Desired Levels of Service 7 D. Asset Management Strategy 8 E. Financing
The City of Owen Sound Asset Management Plan
 The City of Owen Sound Asset Management Plan December 013 Adopted by Council March 4, 014 TABLE OF CONTENTS 1 EXECUTIVE SUMMARY... 1 INTRODUCTION....1 Vision.... What is Asset Management?....3 Link to
Bridges & Culverts Condition by Quantity
 3.4.3 What condition is it in? Approximately 93% of the municipality s bridge structures are in good to excellent condition, with the remaining 7% in fair condition. As a result, the municipality received
2014 ASSET MANAGEMENT PLAN Building, Stormwater & Linear Transportation
 2014 ASSET MANAGEMENT PLAN Building, Stormwater & Linear Transportation Version 1 Table of Contents Executive Summary... 5 1.1 Background... 5 1.2 State of Local Infrastructure... 5 1.3 Desired Levels
Asset Management Plan Final Report
 AssetManagementPlan FinalReport DillonConsultingLimited 10FifthStreetSouth Chatham,ONN7M4V4 T:519-352-7802 F:519-354-2050 May,2014 www.dillon.ca EXECUTIVE SUMMARY Public infrastructure is central to our
The Corporation of the Municipality of Callander. Asset Management Plan
 The Corporation of the Municipality of Callander Asset Management Plan April 2014 1 Index A) Executive Summary P. 3 B) Introduction P. 4 C) State of Local Infrastructure P. 7 D) Expected Levels of Service
Town of Mattawa Asset Management Plan. December 2013
 Town of Mattawa Asset Management Plan December 2013 2 P a g e Town of Mattawa Asset Management Plan Executive Summary This Asset Management Plan is intended to describe the infrastructure owned, operated,
Township of Amaranth. Asset Management Plan Report
 Township of Amaranth Prepared By: R.J. Burnside & Associates Limited 15 Townline Orangeville ON L9W 3R4 Prepared for: Township of Amaranth File No: 300033404 The material in this report reflects best judgement
RE: 2014 Asset Management Plan. OBJECTIVE: To present Council with an Asset Management Plan and recommended implementation strategy moving forward.
 HALDIMAND COUNTY Report PW-GM-01-2014 of the General Manager of Public Works For Consideration by RE: 2014 Asset Management Plan OBJECTIVE: To present Council with an Asset Management Plan and recommended
ASSET MANAGEMENT PLAN
 ASSET MANAGEMENT PLAN REPORT Prepared for: Township of South Frontenac December 2013 RVA 132914 This report is protected by copyright and was prepared by R.V. Anderson Associates Limited for the account
TOWN OF GRIMSBY ASSET MANAGEMENT PLAN
 TOWN OF GRIMSBY ASSET MANAGEMENT PLAN August 20, 2014 DFA Infrastructure International Inc. Executive Summary ES1 Background The Town of Grimsby (Town) with a population of approximately 25,325 is located
Asset Management Plan
 Asset Management Plan Contents Executive Summary... 4 Asset Management Plan... 6 Introduction... 6 Financial Overview... 11 Conclusion... 11 Attached Appendices... 11 Asset Management Strategy... 13 Introduction...
ASSET MANAGEMENT PLAN
 Tof Proud Heritage, Exciting Future ASSET MANAGEMENT PLAN 1 TABLE OF CONTENTS PAGE 3 OVERVIEW 8 FACILITIES 12 FLEET 16 PLAYGROUND EQUIPMENT 19 ROADWAYS 23 BRIDGES 26 WATER RELATED ASSETS 2 One of the goals
How To Manage The County Of Simcoe'S Infrastructure
 Asset Management Plan Asset Management Plan Table of Contents 1.0 Executive Summary... 2 2.0 Introduction... 4 3.0 State of County of Simcoe s Infrastructure... 7 4.0 Levels of Service... 14 5.0 Asset
Asset Management Plan
 Asset Management Plan Final Report May 2014 EXECUTIVE SUMMARY Adequate municipal infrastructure such as roads, bridges, and underground water and sewage pipes are essential to economic development, citizen
EXECUTIVE SUMMARY. Asset Management Relationships and Dependencies. Introduction
 EXECUTIVE SUMMARY Introduction The Asset Management Plan demonstrates sound stewardship of the Region s existing assets to support services at desired levels and to ensure the support of the Region s infrastructure
County of Oxford Asset Management Plan 2014. 1.0 Executive Summary... 2. 2.0 Introduction... 7. 3.0 Purpose and Methodology... 10
 Asset Management Plan AUGUST 2014 County of Oxford Asset Management Plan 2014 Table of Contents 1.0 Executive Summary... 2 2.0 Introduction... 7 3.0 Purpose and Methodology... 10 4.0 State of Infrastructure...
COMPREHENSIVE ASSET MANAGEMENT STRATEGY
 COMPREHENSIVE ASSET MANAGEMENT STRATEGY APPROVED BY SENIOR MANAGEMENT COMMITTEE ON AUGUST 23, 2012 (TO BE FINALIZED AFTER APPROVAL OF CAM POLICY BY COUNCIL) August 2012 Contents CONTENTS EXECUTIVE SUMMARY
CGAM022.1/12/10. Asset Management Improvement Strategy 2010
 Asset Management Improvement Strategy 2010 Version Control Version No. Date Details Author/s 1.0 July 2009 Adopted Strategy 2.0 October 2010 Update TABLE OF CONTENTS OF CONTENTS 4 OF THE ASSET MANAGEMENT
LONDON CORPORATE ASSET MANAGEMENT PLAN 2014
 LONDON CORPORATE ASSET MANAGEMENT PLAN 2014 ACKNOWLEDGEMENT Acknowledgement The Corporate Asset Management office would like to acknowledge the efforts of the staff of the individual City of London Service
Asset Management Plan Overview
 Council Strategy Asset Management Plan Overview City of Albany 2013 File Ref: CM.STD.6 Synergy Ref: NMP1331749 102 North Road, Yakamia WA 6330 Version: 25/06/2013 PO Box 484, ALBANY WA 6331 Tel: (08) 9841
Township of Terrace Bay Drinking Water System Financial Plan
 Township of Terrace Bay Drinking Water System Financial Plan August 2014 Introduction Municipalities in Ontario recently adopted a full accrual accounting approach to tangible municipal assets in accordance
The Corporation of the Town of Amherstburg, Ontario ASSET MANAGEMENT PLAN
 The Corporation of the Town of Amherstburg, Ontario ASSET MANAGEMENT PLAN December 2013 Asset Management Plan Preface An Asset Management Plan is a strategy that identifies how municipal assets will be
Town of Huntsville Municipal Asset Management Plan
 Town of Huntsville Municipal Asset Management Plan Adopted by Council (Resolution 470-13) December 20, 2013 1 P age Table of Contents Executive Summary... 3 Introduction... 4 State of Local Infrastructure...
CASE STUDY. City of Grand Rapids Stormwater Asset Management Program. City of Grand Rapids. By the Numbers
 United States Environmental Protection Agency CASE STUDY City of Grand Rapids Stormwater Asset Management Program Overview With increasing pressure to meet water quality targets, address population growth,
Asset Management Plan
 Corporation of the Town of Innisfil Asset Management Plan Prepared by: AECOM 55 Cedar Pointe Drive, Suite 620 705 721 9222 tel Barrie, ON, Canada L4N 5R7 705 734 0764 fax www.aecom.com Project Number:
Our Challenging Future
 Protecting Our Future by Making Advanced Asset Management Decisions < All stories in this section Gregory M. Baird Dec 23, 2011 America s economic dominance as a world power over the past several decades
Business Unit Asset Management Plan Framework & Guidelines
 Draft Report Business Unit Asset Management Plan Framework & Guidelines Prepared for March 2014 Contents Section Page Contents... i Background... 1 Asset Management Plans... 1 The AMP Framework... 1 About
1. INTRODUCTION... 1 2. PURPOSE OF THE ASSET MANAGEMENT STRATEGY... 2 3. ASSET MANAGEMENT... 3
 ASSET MANAGEMENT STRATEGY 2010-2020 November 2009 1. INTRODUCTION... 1 2. PURPOSE OF THE ASSET MANAGEMENT STRATEGY... 2 3. ASSET MANAGEMENT... 3 4. WESTERN AUSTRALIAN ASSET MANAGEMENT IMPROVEMENT PROGRAM
Road Asset Management vs Pavement Management A new Paradigm. Arthur Taute Stewart Russell
 Road Asset Management vs Pavement Management A new Paradigm Arthur Taute Stewart Russell Contents Background Definitions Improvements over PMS TMH22 elements Conclusions BACKGROUND Municipal AMS GRAP17
A Guide For Preparing The Financial Information Component Of An Asset Management Plan. Licensing, Monitoring and Customer Protection Division
 A Guide For Preparing The Financial Information Component Of An Asset Management Plan Licensing, Monitoring and Customer Protection Division July 2006 Contents 1 Important Notice 2 2 Scope and purpose
Chapter 5 RISK MANAGEMENT ANALYSIS CHAPTER 5 RISK MANAGEMENT ANALYSIS PAGE 49
 Chapter 5 RISK MANAGEMENT ANALYSIS CHAPTER 5 RISK MANAGEMENT ANALYSIS PAGE 49 This page intentionally left blank. PAGE 50 MINNESOTA GO MNDOT TRANSPORTATION ASSET MANAGEMENT PLAN RISK MANAGEMENT ANALYSIS
DEPARTMENT OF ENVIRONMENTAL QUALITY
 PROJECT IDENTIFICATION DEPARTMENT OF ENVIRONMENTAL QUALITY City of Burton Sanitary Sewer Collection System Improvements State Revolving Fund (SRF) Environmental Assessment April 2015 Applicant: Authorized
A NEW METHOD FOR DEVELOPING THE MOST COST- EFFECTIVE REHABILITATION PROGRAMS FOR OUR AGEING SEWER NETWORKS
 A NEW METHOD FOR DEVELOPING THE MOST COST- EFFECTIVE REHABILITATION PROGRAMS FOR OUR AGEING SEWER NETWORKS Introduction Toby Bourke (MWHSoft), Graham McGonigal (MWH) There is currently widespread concern
REPORT TITLE: TERM OF COUNCIL PRIORITY NO. 6 - ENHANCE INTEGRITY OF WASTEWATER COLLECTION SYSTEM INCLUDING FLOOD REMEDIATION PROGRAM
 J Wokking foh y or REPORT Meeting Date: November 28,2013 Regional Council DATE: October 22,201 3 REPORT TITLE: TERM OF COUNCIL PRIORITY NO. 6 - ENHANCE INTEGRITY OF WASTEWATER COLLECTION SYSTEM INCLUDING
16. ASSET MANAGEMENT POLICY
 16. ASSET MANAGEMENT POLICY Asset Management Policy Document No.: WT-HRM-16.00 Approved By: Council Issue No.: 1.00 Approved On: 10 June 2014 Responsibility: Infrastructure Services Department Review Date:
ASSET MANAGEMENT PLAN Town of Newmarket
 Town of Newmarket December 23, 2014 1 Acknowledgements The development of the Town of Newmarket s first Asset Management Plan was based on the contributions of many Town staff. This acknowledgement is
cugog TOWNSHIP OF Ian
 TOWNSHIP OF cugog EDUCATION AND TRAINING SESSION AGENDA MONDAY, OCTOBER 28, 2013 AT 9:00 A.M. IN COUNCIL CHAMBERS Road and Bridge Asset Management Plan The What and the How 9:00 a.m. The What Ian Roger
Capital Asset Management Plan
 2015 Capital Asset Management Plan City of Peterborough 12/15/2015 Executive Summary Asset management planning supports evidence based decisions regarding the building, operating, maintaining, renewing,
Glenorchy City Council Asset Management Strategy for Infrastructure Assets
 Glenorchy City Council Asset Strategy for Infrastructure Assets 2014/15 to 2017/18 Version 1.3 June 2014 Glenorchy City Council Asset Strategy for Infrastructure Assets Document Control Document Control
Asset Management Plan 2015 Facilities and Transit
 Asset Management Plan 2015 Facilities and Transit Prepared for Submitted by October 2015 Asset Management Plan Contents Section 1 Executive Summary Table of Content Section 2 Introduction Section 3 State
10.0 ASSET MANAGEMENT PRACTICES
 10.0 ASSET MANAGEMENT PRACTICES 10.1 Current Asset Management Practices This section outlines the decision making tools Taupo District Council (TDC) currently uses to determine long term maintenance, renewal
City of Cambridge and IBM Build a Smarter City
 City of Cambridge and IBM Build a Smarter City September 8, 2010 Presented by Mike Hausser, P.Eng Director of Asset Management and Support Services City of Cambridge Infrastructure Asset Life Cycle Install
2014 FINAL BUDGET TOWN OF AURORA. I. Simanovskis, Director of Infrastructure & Environmental Services
 TOWN OF AURORA GENERAL COMMITTEE REPORT No. IES14-007 SUBJECT: FROM: Water, Wastewater and Stormwater Budget I. Simanovskis, Director of Infrastructure & Environmental Services DATE: January 20, 2014 RECOMMENDATIONS
THE ASSET MANAGEMENT PLAN FOR THE TOWNSHIP OF ASHFIELD-COLBORNE-WAWANOSH
 THE ASSET MANAGEMENT PLAN FOR THE TOWNSHIP OF ASHFIELD-COLBORNE-WAWANOSH 2013 SUBMITTED DECEMBER 2013 BY PUBLIC SECTOR DIGEST 148 FULLARTON STREET, SUITE 1410 LONDON, ONTARIO, N6A 5P3 State of the Infrastructure
HIGHWAY INFRASTRUCTURE ASSET MANAGEMENT STRATEGY
 HIGHWAY INFRASTRUCTURE ASSET MANAGEMENT STRATEGY 16 November 2015 Highway Infrastructure Asset Management Strategy Contents Introduction 1.0 The Need for Asset Management 1.1. Background 1.2. Aims and
CONCEPTUAL REHABILITATION ALTERNATIVE
 Appendix D While federal law requires preservation/rehabilitation of historic bridges be considered, there is no standard procedure to determine when rehabilitation is appropriate and when replacement
STAFF REPORT TO COMMITTEE OF THE WHOLE
 STAFF REPORT TO COMMITTEE OF THE WHOLE DATE: November 7 2012 TO: FROM: SUBJECT: ATTACHMENT(S): COMMITTEE OF THE WHOLE GINA LAYTE-LISTON, SUPERVISOR, WASTEWATER Stormwater Management Funding Strategy None
The Town of Fort Frances POLICY SECTION ACCOUNTING FOR TANGIBLE CAPITAL ASSETS. ADMINISTRATION AND FINANCE NEW: May 2009 1. PURPOSE: 2.
 The Town of Fort Frances ACCOUNTING FOR TANGIBLE CAPITAL ASSETS SECTION ADMINISTRATION AND FINANCE NEW: May 2009 REVISED: POLICY Resolution Number: 05/09 Consent 156 Policy Number: 1.18 PAGE 1 of 11 Supercedes
Asset Management Plan Public Works and Social Housing Infrastructure City of Brantford, Ontario
 2013 Asset Management Plan Asset Management Plan City of Brantford, Ontario November 29, 2013 Prepared by: Capital Planning Facilities and Asset Management, Public Works Corporation of the City of Brantford
HOW DOES THIS SERVICE CONTRIBUTE TO THE QUALITY OF LIFE IN THE CITY OF LONDON?
 Service: Program: 3.4. Wastewater Removal & Storm Water Management Environmental Services HOW DOES THIS SERVICE CONTRIBUTE TO THE QUALITY OF LIFE IN THE CITY OF LONDON? The desired population results in
Asset Management Plan
 Asset Management Plan (DRAFT) 2014 The Town of Aurora Asset Management Plan T own of Aurora Asset Management Plan (DRAFT) 2014 TABLE OF CONTENTS Executive Summary... 1 Introduction... 2 Town of Aurora
Drinking Water Quality Management System Financial Plan Number 047-101 O.Reg. 453/07
 Drinking Water Quality Management System Financial Plan Number 047-101 O.Reg. 453/07 TABLE OF CONTENTS TABLE OF Contents... 2 1. INTRODUCTION... 4 1.1 MUNICIPAL DRINKING WATER LICENSING PROGRAM... 4 1.2
BEFORE THE PHILADELPHIA WATER, SEWER AND STORMWATER RATE BOARD DIRECT TESTIMONY OF STEPHEN J. FURTEK
 BEFORE THE PHILADELPHIA WATER, SEWER AND STORMWATER RATE BOARD Re Application of the Philadelphia Water Department for Increased Rates and Related Charges Fiscal Years 2017-2018 DIRECT TESTIMONY OF STEPHEN
City of Brantford Water and Wastewater Ontario Regulation 453/07 Financial Plans. Financial Plan #063-301
 City of Brantford Water and Wastewater Ontario Regulation 453/07 Financial Plans Financial Plan #063-301 May 26, 2015 Contents Page EXECUTIVE SUMMARY (i) 1. Introduction... 1-1 1.1 Study Purpose... 1-1
Components of a Basement Flooding Protection Plan: Sewer System Improvements. November 2000
 Components of a Basement Flooding Protection Plan: Sewer System Improvements November 2000 Components of a Basement Flooding Protection Plan: Sewer System Improvements November 2000 SEMCOG 2000 Prepared
TEC Capital Asset Management Standard January 2011
 TEC Capital Asset Management Standard January 2011 TEC Capital Asset Management Standard Tertiary Education Commission January 2011 0 Table of contents Introduction 2 Capital Asset Management 3 Defining
Glossary. means the asset valuation module of Municipal DataWorks. means Geographic Information System
 Getting Started The Prerequisites for Asset Management July 2009 Glossary Asset... means public infrastructure or a component thereof that has a tangible value, enables services to be provided and has
Infrastructure Asset Management Strategy
 Infrastructure Asset Management Strategy Strategy Owner Manager Parks and Assets Engineering and Infrastructure Creation Date 27 March 2006 Revision Date 4 March 2015 Please check Council s Intranet to
Table of Contents. WATER AND WASTEWATER MODEL AND SITUATIONAL ANALYSIS 6 Model Development 6 10-Year Water/WW - Challenges, Risks and Opportunities 7
 Table of Contents LONG-RANGE FINANCIAL PLAN INTRODUCTION 1 Water and Wastewater Financial Plan 2 What is a Long Range Financial Plan 3 Importance of a Long Range Financial Plan 4 General Approach to Preparing
ASSET MANAGEMENT STRATEGY
 ASSET MANAGEMENT STRATEGY Page 1 of 15 TABLE OF CONTENTS 1. INTRODUCTION...3 2. THE ASSET LIFECYCLE...3 2.1 Asset Planning...5 2.2 Asset Creation / Acquisition...6 2.3 Asset Operations...7 2.4 Asset Maintenance...7
Page 1 of 24. To present the Asset Management Policy 2014 for Council adoption.
 Page 1 of 24 COMMUNITY AND SERVICES SPECIAL COMMITTEE REPORT 9 DECEMBER 2104 AGENDA ITEM 6.1 ASSET MANAGEMENT POLICY 2014 REVIEW Director: Manager: Ian Butterworth Director Infrastructure and Engineering
This plan forms one part of a suite of Asset Management Plans that have been developed:
 E: D1: Levee Footpath Bank Asset Management Plan March July 2014 2015 This plan forms one part of a suite of Asset Management Plans that have been developed: A. Bridges B. Buildings C. Drainage D. Footpaths
TOWN OF RICHMOND HILL WATER AND WASTEWATER ONTARIO REGULATION 453/07 FINANCIAL PLAN
 TOWN OF RICHMOND HILL WATER AND WASTEWATER ONTARIO REGULATION 453/07 FINANCIAL PLAN Financial Plan #022-301 JUNE 3, 2010 CONTENTS Page 1. INTRODUCTION 1.1 Study Purpose 1-1 1.2 Background 1-1 1.2.1 Financial
2012-2016 Business Plan Summary
 Owner: 2012-2016 Business Plan Summary Program Corporate, Operational & Council Services Service grouping Corporate Services Service Type Internal Service Tom Johnson, Managing Director - Corporate Assets,
REPORT CITY OF WATERLOO ASSET MANAGEMENT PLAN OCTOBER 2014
 REPORT CITY OF WATERLOO ASSET MANAGEMENT PLAN OCTOBER 2014 City of Waterloo Asset Management Plan EXECUTIVE SUMMARY The City of Waterloo has prepared this asset management plan in accordance with the Ministry
Municipal Asset Management Toolkit
 Municipal Asset Management Toolkit A Guideline for Local Decision Makers Implemented by: Network of Associations of Local Authorities of South East Europe WHAT IS ASSET MANAGEMENT? An integrated approach
Asset Management and Industry Solutions - A Municipal Perspective
 Asset Management and Industry Solutions - A Municipal Perspective Saidur Rahman, Ph.D., P. Eng. Senior Infrastructure Project Manager Town of Oakville Highlights Municipal Infrastructure in Canada Scope
CHAPTER 2 PAVEMENT MANAGEMENT SYSTEM
 CHAPTER 2 PAVEMENT MANAGEMENT SYSTEM 2.1. INTRODUCTION TO PAVEMENT MANAGEMENT The ability of a pavement system to serve a society is largely a function of planning. Planning is the intersection between
Construction Specification for Sewer Bypass Flow Pumping
 Engineering and Construction Services Division Standard Specifications for Sewers and Watermains TS 4.01 April 2013 Pumping Table of Contents TS 4.01.01 SCOPE... 2 TS 4.01.02 REFERENCES... 2 TS 4.01.03
SUMMARY: LAND TRANSPORT ASSET MANAGEMENT PLAN
 SUMMARY: LAND TRANSPORT ASSET MANAGEMENT PLAN Introduction This Asset Management Plan (AMP) for Land Transport Network 2012 describes in detail how the District s land transport network will be managed
Asset Management Strategy
 Asset Management Strategy File Ref: CM.STD.6 Synergy Ref: NMP1331737 Version: 25/06/2013 City of Albany 2013 102 North Road, Yakamia WA 6330 PO Box 484, ALBANY WA 6331 Tel: (08) 9841 9333 Fax: (08) 9841
Quick Guide: Meeting ISO 55001 Requirements for Asset Management
 Supplement to the IIMM 2011 Quick Guide: Meeting ISO 55001 Requirements for Asset Management Using the International Infrastructure Management Manual (IIMM) ISO 55001: What is required IIMM: How to get
AC2011-32 Attachment 1. Furniture Purchase Audit
 AC2011-32 Attachment 1 Furniture Purchase Audit April 6, 2011 THIS PAGE INTENTIONALLY LEFT BLANK EXECUTIVE SUMMARY The objective of this audit was to assess whether office furniture was purchased with
Corporate Carbon Neutral Plan
 This Carbon Neutral Plan will guide the District of 100 Mile House decision making process in terms of reducing corporate energy consumption and greenhouse gas emissions and in achieving carbon neutrality.
Integrated Municipal Asset Management tool (IMAM)
") Integrated Municipal Asset Management tool (IMAM) Integrated Municipal Asset Management tool that makes it easy for decision makers to use and implement the developed Models. This tool is developed using
Integrated Municipal Asset Management tool (IMAM) Integrated Municipal Asset Management tool that makes it easy for decision makers to use and implement the developed Models. This tool is developed using
Date: 10/10/2014 Initiated by: AAS-100
 U.S. Department of Transportation Federal Aviation Administration Advisory Circular Subject: Airport Pavement Management Program (PMP) Date: 10/10/2014 Initiated by: AAS-100 AC No: 150/5380-7B Change:
Managing Capital Assets
 Managing Capital Assets A New Emphasis on a Traditional Role By Public Sector Digest Research and Shayne Kavanagh Capital asset management has become a topic of increasing interest for local governments,
Pavement Asset Management Guidance Section 5.3: Condition Surveying and Rating - Drainage
 Pavement Asset Management Guidance Section 5.3: Condition Surveying and Rating - Drainage December 2014 Document Information Title Author Description Pavement Asset Management Guidance, Section 5.3: Condition
The Town of Fort Frances
 The Town of Fort Frances Long-Term Capital Financial Plan POLICY Resolution Number: 391 (Consent) 12/09 SECTION ADMINISTRATION AND FINANCE NEW: December 2009 REVISED: Supercedes Resolution No. Policy Number:
Asset Management: A Best Practice
 Asset Management: A Best Practice Purpose Introduction This guide will help you understand: The definition of Asset Management. Why asset management is important to your utility. The best practices in
Transportation Asset Management Best Practices for Canada
 Primer Transportation Asset Management Best Practices for Canada Introduction Canada ranks seventh in the world in terms of road network size, with a two-lane equivalent length of 1.04 million kilometres,
Asset Management Plan
 Wandering Shire Council Roads Asset Management Plan TABLE OF CONTENTS 1 Executive Summary... 2 Context... 2 Questions you may have... 4 2. INTRODUCTION... 5 2.1 Background... 5 2.2 Goals and objectives
County of Peterborough Capital Asset Management Plan - Review
 2013 County of Peterborough Capital Asset Management Plan December 18, 2013 Capital Asset Management Plan Preface The County of Peterborough owns, operates, and maintains a wide ranging inventory of tangible
Water Security Agency. Plan for 2015-16. saskatchewan.ca
 Water Security Agency Plan for 2015-16 saskatchewan.ca Statement from the Minister I am pleased to present the Water Security Agency s Plan for 2015-16. The Honourable Scott Moe Minister Responsible for