For more information, visit Tyler Pulse. Administration Manual Version 221
|
|
|
- Clare Jackson
- 10 years ago
- Views:
Transcription
1 For more information, visit Tyler Pulse Administration Manual Version 221
2 Tyler Pulse - Introduction Tyler Pulse is an information/data warehouse that is uniquely specialized for the delivery of highly processed information to the managers of a school district or local government (decision support). In any local government or school district, accurate and timely information is the key to improved management. Yet, most of these organizations spend more time gathering information than managing with it. Tyler Pulse is designed to address information needs at all levels of public sector management, from the superintendent/government manager to department heads to principals to teachers. Tyler Pulse employs unique and new technology to establish a low cost and easily managed tool to deliver information to all stakeholders in a public sector organization. Government is awash in data generated by various application systems. Tyler Pulse is designed as a tool to translate all of these data sources into highly processed management information. Designed specifically for government and education as a data warehouse and decision support system, Tyler Pulse will simply change the way an organization does business. Pulse is designed to access the most in-depth and complex data that generates the most meaningful management information. As such, it delivers immediate and comprehensive management information to users and managers that are starved for information on the organization, their schools, their departments and other areas of responsibility. In summary, Tyler Pulse employs innovation and radical new design processes to generate a management system that is far faster, that is far easier to manage, that uses far fewer resources, which is more comprehensive, and is far less expensive than any other data management tool available in the marketplace today. The local government or school district's data is literally transformed into "information" and constantly available for management use. Tyler Pulse is delivered to its clients as two key components. The Pulse Engine provides the basis to develop and support comprehensive Information Warehouses and Pulse Models. Pulse Models are developed using the Pulse Engine. They read specific raw data from various application software pages (Financial Systems, Student Systems, Transportation Systems, Assessment Results, etc.) and transform that data into highly processed management information. This information is then delivered to end users in the form of data tables, graphs and other data representing objects. This manual is primarily developed for the administrator of Pulse existing models and to support the development of new Pulse models. It is not designed for end users. End user documentation is embedded into each model as interactive help. As such, it addresses how to maintain and support existing Pulse models. It also provides extensive support and reference documentation related to the development of new Pulse Models. 2
3 Table of Contents Tyler Pulse Pulse Tyler Pulse - Introduction...2 Table of Contents Tyler Pulse...3 High Level Design and Content Development Process...6 Pulse Administration Module Incoming Data Setup New File Definition XML Formatted Files Importing Importing Fixed Width Files Loading Files Directly From External Systems PulseParser - Automated Incoming File Loading Pulse Data and Information History Management Importing Data Manual Tables Summary Queries Maintaining Summary Query Groups Maintaining Summary Queries Summary Query Examples Data Project Definition and Management Defining a New Data Project Data Project Run Order Page Content and Setup Page Content Indicators Advanced Editor Page Content Filters Pivot Grid Definition Real-Time Filters User Defined Filters Link Filters Page Content Dynamically Run a Query/Query Group/External Process Page Content External Web Pages and Tableau Page Definition Page Filters Page Layout Management Managing Multiple Page Columns Page Categories Data Entry Pages & Page Content Other Administrative Functions Link Manager Announcements System Setup
4 Pulse Remote Logging Menus Pulse Left Menu Pulse Top Menu Favorites Menu Data Transfers External Processes Export Pulse Data Table Indexes Direct Page Access Pulse User Activity Tracking Pulse Customer Registration Security Management Defining Districts / Organizations Role Setup User Filters User Setup Page Roles Mass Updates Using Filter By Security and Functions Importing Users and Passwords Backup & Security Menu Managing Global (Root) Access and Passwords LDAP Integration User Synchronization zm_test_pulsesecurity_settings Pulse Alert Definition and Management Defining Alert Groups Defining Alerts with Incorporated Pulse Filtering Adding Alerts to Projects Alert Logs Pulse End User Operation Pulse General Page Content Navigation Left Menu Top Menu Hyper-Link Navigation Menu and Page Links Hyper- Links Browser Navigation Pulse Table Filters Data Table Functions Ordering / Sorting Data Security Settings User Login Appendix I Server Management New Releases Overview and Loading Instructions Loading the Pulse Alert Service
5 Pulse Model Update Releases Summary Query Duration Tracking Pulse Event Log Changing Pulse Parser Default Settings Managing the Pulse Alerts Configuration File Non-Flash Bar and Line Charts Management Alternate web.config settings Web Config Update for Microsoft Changes ASP/Cloud web.config Settings Monthly Maintenance Pulse Settings File Pulse Useful Information Changing IIS Timeout Missouri MAP (NCLB) File Loading Locations Transferring a File and its Data Contents in SQL Studio Loading.NET Framework to a Pulse Server Loading.NET Framework to a Pulse Server Setting Web Services Extensions when Setting up IIS for Pulse Operations Appendix II SQL Examples Pulse Usage Appendix III - Other Assessments Other Assessments Conceptual design Loading and Managing Assessment Data Running the Other Assessments Model Using / Defining Tier Scores Main Menu Warnings and Start Buttons Override Test Display Order Benchmark Assessments Setup Teacher Value Added Analysis Teacher Value Added Setup and Usage The Other Assessments Main Menu Appendix IV Tableau with Pulse Outline Appendix V Risk Analysis Setup Instructions Appendix VI Single Login Synchronization with SIS Systems Single Login with SISk12 Setup Instructions Zangle SIS User Account Auto Login Appendix VII Manual Table / Customer Responsibilities Pulse User Managed Tables Appendix VIII Setup Processes for the Tyler Munis Financial Models Appendix IX Pulse System Recommendations and Guidelines Tyler Pulse System Recommendations Appendix X Security and Management Setup Guide Security Setup Examples

6 High Level Design and Content Development Process Generally, there are four steps to the setup and management of Pulse content. These steps include: 1. Load and Establish Data Pulse is designed to support the loading, organization and reporting of data from external sources. Incoming data is loaded from flat files extracted from other application systems, or, loaded directly via external queries from Pulse into external databases. The loading process may be user initiated or be processed on a user defined schedule. For example, data may be imported each night at midnight. The Pulse loading process is controlled via user defined rules. As the data is loaded, Pulse dynamically creates or updates database tables, creates associated data fields within those tables, and establishes the business rules that have been previously defined to manage the import process. Generally, the loading of data is a fully automated process. Incoming data may be loaded in several forms, including comma, tab and pipe delimited files, fixed width files, XML files or via direct query access into external systems. In summary, Pulse loads data from files created from other application systems or from external queries managed within Pulse. If the originating application system supports a data 6
7 export process that can export data to flat files in an efficient manner, it is most often appropriate to use that export process since they are native to the source application and likely to be the best option for exporting. In the case that the source application does not support these types of export tools, utilities in Pulse or other external processes may be used to access data from virtually any type of external system. 2. Process Data into Information After the initial loading of external data into Pulse, administrative users define Summary Queries to further refine the data into information. At the time of data loading, Pulse creates a data file containing all of the raw imported data. A Summary Query is a SQL statement that instructs Pulse to create a separate data table containing computed information from that imported data. Virtually any type of calculation may be performed using summary queries to refine data, including but not limited to calculating totals, percentages, trends, combining data from multiple raw import tables, summarizing data and much more. Based on this process, multiple data sets are calculated, stored and available for the creation of screens/page content. 3. Define Content The next step in the process is the definition of page content. Generally, page content is a set of parameters that define how end users will view and use the data generated by summary queries. The result is an object (page content) that can be placed on a page for end user viewing. Pulse supports several types of objects that are categorized as data tables, summary tables, graphs, web or fixed objects. These are further described below: Data Tables. Data tables are data/information lists in multiple formats. For example, listing student data by grade level, alphabetical order, by school or by any other pattern supported by that data. The data in a data table may be basic data lists or highly processed information such as averages, percentages, trend lines or any type of summarized data format. Graphs. Graphs may be dynamically computed from any data available, both from raw and computed data. Graphs may be generated various forms of bar charts, pie charts, meters and line charts. Fixed Objects. Fixed objects are lines, arrows or other fixed image objects used to better separate and display data. Linked Objects. Linked Objects are automatically created by Pulse. A Linked Object is a dynamic link to a defined end user page. Incorporating Linked Objects into a page supports drilling from one page to another or the establishment of traditional user menus. Web Objects are screen windows that contain web pages from other applications or from the Internet. 7
8 Text Objects may be a simple text notation or may be highly processed text. For example, text may include embedded images and videos. It may also include traditional text editing found in most word processing systems. Menu Objects are table oriented menus that contain formatted links to pages throughout the Pulse model. Once defined, a Page Content may be incorporated into any number of user pages. For example, the same graph may be used as a part of any number of page displays. Page Content also supports the incorporation of viewing rules for better data communication. For example, business rules support definition and use of colors to highlight alerts, data formatting, the addition of additional characters such as percent signs, relabeling data fields, the ordering of data fields, calculated statistics and totals and much more. In general, page content is the generation of the business rules defining how end users view information. 4. Page Definition The last step in the setup process is to define end user pages. This process supports the combination of any number of Page Content objects into a single page for end user viewing. Pages may be defined as Menus so that they are displayed on the primary Pulse Menu, or, they may be displayed as linked pages. Linked pages are accessed either in a traditional menu format or as drilling components on a viewed page. Pages may be designed in any format desired. For example, a page may contain an unlimited number of different tables, summaries, and charts from various application sources. A page may display various types of student data such as attendance, testing and discipline, and then also display human resource and transportation data as a part of the same page. Another approach is to construct each page to display information about a discrete subject, such as student attendance data or human resource data. The approach or approaches used for page design is completely in the control of the administrative developer. In all cases, one or more startup or home pages are defined. These pages are often referred to as Information-Boards because they are similar to dash boards but contain far more information that traditional dash boards. All other pages are accessed from these home menu pages or via drilling functionality that may be imbedded into all pages. 8

9 To graphically view this process, evaluate the following diagram: 9

10 Pulse Administration Module Pulse is designed into two separate sub-sections, one for Administration and a second for end user access. The Administration module may only be accessed by users with administrative rights as defined in the Pulse security dialogs. The Administration module is used to define and manage all of the administrative areas of Pulse including the entry and management of incoming data, summary statistics, alerts, dashboard features, security, graphics/charts and end user viewable pages. See the example to the right. End users will access the Administrative Menu by clicking on its link from the Pulse logon page. At login, all users will see the Pulse Main Menu at the upper left of the displayed startup page. For users with administrative access, the Administration menu will contain a link to the Administrative Menu. On the left is an example of the Administrative main menu. Several functions are managed in the administrative section of Pulse. Included is the ability to define new Pulse content (Incoming Data, Summary Queries, Page Content and Pages), manage end user security, define and manage interactive alerts and to perform all general management functions supported by Pulse. 10

11 Incoming Data Setup The Incoming Data Setup process allows an administrator to define the data that will be loaded into Pulse from external systems. Two methods are supported to acquire external data, loading that data from files exports from those systems and/or directly accessing the external data via Pulse managed SQL statements or scripts. Loading Data By clicking on the Incoming Data Setup menu item, the Incoming Data Setup process is initiated. As shown in the example on the right, Pulse will display all incoming data definitions that have been previously defined to load data. The administrative user may then select an existing import file definition to make changes to the loading process, or, may click on the Add New button to define a new file to be loaded. Searching by name and user directed display sorting is provide to locate a specific Import Definition in large implementations. 11

12 New File Definition When the Add New option is selected, the user is presented with the following dialog to define the file that is to be loaded. Note that this example is for importing files in a delimited format. Importing instructions for fixed width and XML files are shown in the following sections of this chapter Destination Table Name Enter the name of the table to be used after it is loaded into Pulse. The file name may not contain spaces or most special characters. 2. File Starting Path Enter the folder where the incoming flat file is located. For example, D:/incoming_folder/. This directory location must be present for loading to be initiated. This folder may be in any location that is accessible from the server managing the Pulse application; however, it will normally be located on the Pulse server. TIP: Since all data being processed by Pulse is read from these folder locations, establish a master folder with sub-folders for each type of data to be loaded. For example, establish a master folder such as D:/Pulse_Processing and then within that folder define additional folders such as D:/Pulse_Processing/Discipline/, D:/Pulse_Processing/Finance/ as shown in the following example: 12
13 When incoming files are loaded, whether on a scheduled or user initiated basis, Pulse will load all of the data that is located in the incoming folders into the defined Pulse data table. If no file/data is present in the designated folder, the loading process is skipped and no data is loaded. The name of the file in the incoming folder is not significant to Pulse. Pulse simply discovers any file(s) located in that folder and processes/loads that data. This is a useful approach when multiple files are being loaded from multiple locations or applications. Each incoming file, with various file names, may be placed in the incoming folder and simultaneously loaded by Pulse using a single Incoming File definition. 3. File Processed Path Enter the folder to which the processed flat file will be moved after it is loaded. Once Pulse loads data from a file, it date stamps and moves the file from the file s loading location to another folder. This approach results in a historical trail of data that has been loaded into Pulse. These historical files may be deleted at any time. 4. Parsing Style Select the parsing style from the Parsing Style list box. Incoming files may be in either comma, tab, or pipe delimited formats or may also be in either XML or fixed width formats. XML and Fixed width instructions are provided in the following section of this chapter. In this section we are addressing only delimited files which are the most common type of file that is imported. Additional incoming file types are planned for upcoming releases. Use the checkbox and type the text qualifier if necessary. For example, in many cases a comma delimited file will contain quote signs around the data. If this is the case, the click box notifies the incoming process that this condition is present and then enter the quote/ in the text qualifier box to designate the character separating the data. 5. History Pulse supports the automated management of history for all data that is loaded and or computed by Pulse. In most cases, history will be maintained only on computed information and not on the raw imported data. However, there are cases where history will also be tracked on imported data. When this is the case, these fields are used. When history is not tracked, do not use these data fields. The use of these fields is described in detail in a following section of this manual. 6. Empty File as Error The import process determines if there is an error when importing data. An error may be detected by Pulse when there is an improperly formed incoming file, or, an error may be recognized when there is no file to be imported. Business rules are used to establish (see below) alternative processes to use when there is an error during importing. When missing data should be considered an error, this checkbox should be selected. Any errors will be noted in the Pulse logs which will be described later in this document. 7. First Row is Headers In some cases, the first line of the incoming data file is a header line that contains the names of the fields in the incoming file. Pulse does not 13

14 use this line since is it not a dependable source of data names. When this line is checked, Pulse will skip the first line during the import process so that inappropriate data is not loaded. 8. Allow Newline Chars - Check this option when the data being loaded contains or main contain characters that indicate multiple lines of data. For example, when a carriage return is present in a text field. It is not often that a single data field will contain multiple lines of data, however, when that is the case Pulse will filter out the new line entries and treat the field as a single line/field for internal Pulse processes. 9. Button Selections: Save: Save the current query Drop Table: This process deletes the table and data in the Pulse database; it does not delete the Incoming Data Setup definition. This is not usually necessary, but can be done if load errors are suspected. Cancel: Exits the group without saving changes and returns to the previously viewed menu Line Delete The left column contains a icon. A line may be deleted by clicking on the checkbox in this column, and clicking the Save Button. At the time the box is clicked, the line will be highlighted with a light red background. The re-entry of a deleted line may optionally be made at the end of the entry list. It is not necessary that all data fields be entered in order. Pulse uses the Index number, not the entry sequence, to accurately load the fields correctly. 14
15 11. Field Definitions The next step is to define each data field in the delimited file that is being loaded. To enter each data field: a. Field Name: This will be used to create the new column name in the database; it may not contain spaces or most special characters b. Field Description: The description is informational only for future reference. It MAY contain spaces and special characters. c. Index: Enter the Index Number for the field beginning with 0 and progressing to 1, 2, 3, etc. until all of the data fields have been defined. '0' can be thought of as column A in an Excel display, index '1' is column B, etc. It is not necessary to load all of the data from a file. If a data field is to be skipped, skip its relative number in the data entry. For example, you may enter field 0,1,2,3,5 to skip the fifth (labeled 4) field in the incoming file. Likewise, fields can be listed out of order as long as the Index number is in the correct order: 0,1,3,5,4,2. d. Field Type: i. Varchar: Alpha or mixed (numeric and alpha) fields ii. Integer: Numeric fields iii. Date Time: Date and time fields iv. Decimal: Decimal or other numeric fields NOTE: Be sure that the data being loaded complies with the definitions entered. For example, if Pulse finds text in a field defined as numeric, that data record (row) will be rejected during the loading process. Field Length (Varchar only): A maximum length may be specified for any Varchar field. The default length is set to MAX and has no practical limit. If a limit is entered, check the box adjacent to the Field Length to truncate incoming data. Leave the click box unchecked if the row is to be skipped if the data exceeds the length specified. After the initial definition, any modifications to further limit a field length will display a warning of Decreasing this size value could cause data to be truncated. e. Key: The key is rarely. Keys are used to manage accessing multiple sets of data loaded at different dates, not for tradition key purposes. The use of this field will be described in more detail in following chapters. The vast majority of the time that a key field will be defined is when history is being maintained (see above) on the imported data. The key field is then used to resolve between various ages of the imported data containing the same key. See the following sections and the Summary Query section of this manual for additional information on both history and key fields 15
16 12. Sample File Structure - After the data setup is saved, a sample file structure will be displayed below the entry dialog. The entered field names will be listed in the order as entered in the Index column. Index numbers not entered will be displayed as *SKIP*. In this example, the fourth field in the incoming flat file is to be skipped during the loading process. 13. Line Delete The left column contains a icon. A line may be deleted by clicking on the checkbox in this column, and selecting Save. At the time the box is clicked, the line will be highlighted with a light red background. The re-entry of a line may be made at the end of the entry list. It is not necessary that all data fields be entered in order because Pulse uses the Index number to control the order of fields in the incoming file. 16

17 Import rules support the definition of rules to control the data being imported. Based on these defined rules, some data may be systematically skipped during the loading process. This is helpful when the incoming file is large and portions of the data are not needed to support the Pulse project being developed. Clicking on the New Rule button will display the following dialog: Give the rule a name and then click on the Add button to add a field selector, the following dialog is then displayed: In the above example, only data records where the f1 field = 1 will be imported. F1 is the field name. The rule option set has two settings: Include: Only import records that match the entry. Exclude: Do not import records that match the entry. Tests on more than one field may be added to the list or multiple tests on the sam field may be added. You can chose: All Match (AND): all fields much match to trigger the rule. Any Match (OR): only one of the listed fields needs to match to trigger the rule. 17

18 In the following example, the record will be imported if the field f1 is equal to 1 or 2 or 3: In addition to creating multiple fields per rule, you may create multiple rules to evaluate. In the following example, Rule1 matches any line that starts with AA ; Rule 2 excludes any of the initially matched records by removing fields that start with AA1. Rules accept a wildcard (%) character only at the beginning of a text string or at the end of a text string: AA% - matches a field starting with AA, and 0 or more characters beyond. %AA matches a field ending in AA, and zero or more characters before. 18
 or XML files to be imported. This section provides additional information on how to import these file types.")
19 XML Formatted Files Importing The previous section addresses the importing of delimited data files into Pulse. These files may be comma, tab or pipe delimited. Additionally, Pulse supports either fixed width (following section) or XML files to be imported. This section provides additional information on how to import these file types. Importing XML Files Importing XML files can be a very technical process because of the design and flexibility of XML files. Pulse can import XML files in two formats. The first format contains unique tags for each field name. The second format contains XML tags where each data column is not unique, but appears multiple times for each column. The following example shows how to parse an XML file where the field names are uniquely tagged. This explanation builds on the more detailed examples for importing delimited files outlined in the previous sections of this chapter. Since XML files are not delimited, their definition in Pulse is quite different from that of a delimited file. See the XML example file below. In this example there are four data fields to be imported, Field_1, Field_2, First Name and Middle Name. All of the XML Elements that surround the data fields must be described in the Pulse Incoming Data Setup; in this example, those elements (and their corresponding End Tags) are <A>, <B>, <ROW>: Sample XML file: 19

20 To define this import in Pulse, see the following example. This data entry dialog is displayed by Pulse when the Parsing Style selected is <XML> File. Each element start and end indicator is defined in the entry table. Additionally: 1. The start and stop indicator for each element is defined using the specific Tag name from the imported file. 2. The element indicating the start of a new row is marked in a click box. 3. The elements that contain data are marked with a click box. 4. The Name for the field to be used in the imported Pulse table is entered. 5. If desired (this is rarely used) the field to be used as file key in Pulse is marked with a click box. 6. Elements that do not contain data must have a corresponding End Element type specified; in the following example these tags all require End Element records: <A>, <B>, <ROW>, and <NAME>. 7. The tags that are linked to actual Pulse Fields do not require an End Element record: <FIELD_1>, <FIELD_2>, <FIRST> and <MIDDLE> Pulse Setup Example: Once imported, the data is stored in Pulse as shown in the following example: Imported Results: 20

21 The next example demonstrates how to parse an XML file where the data columns are not uniquely identified. The following XML data was obtained from an Excel spreadsheet. Key sections used by the Pulse import section have been highlighted in yellow: There are several key items to note: This XML file contains tags and data not needed by the Pulse import specification, so they can be ignored. (In the above example, certain sections have been hidden from the display of the file). Only tags that surround the actual data tags need to be specified. (In the above example, those tags are <Workbook>, <Worksheet>, <Table>, <Row> and <Cell>.) Each column is identified by the combination of a <Cell> and <Data > tag, for example: Each row of data contains the same number of fields; fields will be mapped to a field definition by the order in which they appear, using the Index field to specify to trigger the proper Pulse field mapping. 21

22 Below is the completed definition to import this example file: In order to specify each mapped column, you must specify an Index value for the first repeated tag (in this case the <Cell> tag) that corresponds to the order of each field. (Where an Index of 1 = the first occurrence, 2 = the second occurrence, etc.) Note that if the first row of data contains field names, you need to check First Row is Headers so that that data is ignored during the import. Except for the data elements, all other elements need to have an End Element specified in the proper order. In the above example, excel xml exports emit multiple Worksheet tags, but each worksheet is uniquely identified with an XML attribute, for example: In order to obtain the correct set of data elements in this scenario, an Attribute description may be added to the field mapping, so that Pulse recognizes the set of data to capture: 22

23 Importing Fixed Width Files This section provides an explanation and example on how to import Fixed Width data files into Pulse. Importing fixed width data files is very similar to importing delimited data files into Pulse, with one exception. The start and end character location of each data field in the file must be entered for each field imported. Note that one or more fields in the imported file may be skipped by simply not including those character locations in the import file definition. See the example below. Note that for verification purposes Pulse generates and displays the field length for each field entered. All other fields are the same as those described for delimited file importing. Fixed Field Import Example: 23
24 Loading Files Directly From External Systems Pulse incoming data may be loaded from defined files as described above, or, incoming data may be acquired directly from external systems. Note the following explanation for these approaches that are used by Pulse. 1. Pushed File Loading: Pushed files are data files that have been created by external systems and then placed in the Pulse Incoming Tables as has been previously defined. For these files, Pulse has no responsibility for data acquisition. Pulse simply loads the data that is supplied to it. This is the process that is used when the application system data source has an export tool or utility that may be used to export data. That tool/utility is used to create a delimited file, and that file is placed in the Pulse incoming folders for loading into Pulse. 2. Pulled File Loading: When the application system data source does not have an export utility/tool, it is necessary to use another source for data acquisition. It is possible that third party tools are used to access the data in the external system, and then transfer that data to Pulse in the form of flat files as is described above. This approach is sometimes used when an existing data source has a defined or tradition third party method that is commonly used to access it. Tools such as Microsoft Access or SQL/Oracle query tools are good examples of this approach. When these tools are used, the incoming data files are generated via these third party tools and placed into Pulse incoming folders. The data is then loaded in the same way as described in the previous paragraph. 3. When no export/utility tool is available or reasonably usable for data acquisition, data from the external system may be acquired from within Pulse. Pulse supports the incorporation of queries that will directly read an external database. These processes are generated primarily as SQL statements that are executed into the target database. Pulse also supports the incorporation of scripting and other external processes into its automated process. These approaches are described in following chapters and may also be used to acquire external data. During the implementation of Pulse, Pulse supporting staff will assist users in the generation of these processes as needed. 24

25 PulseParser - Automated Incoming File Loading PulseParser is a utility provided with Pulse. It is used to support the automated loading of data and is installed/loaded on the Pulse server. Once loaded, it will create a desktop shortcut so it may be either manually started or it may scheduled to run via Windows scheduler. It may also be started from the Administrative Menu within Pulse. The settings for PulseParser are maintained in the same C:/PulseSettings.txt file or web.config file that is used to manage Pulse settings. This will be described in a following section of this manual. The PulseParser program is very simple to use. It may be scheduled to run at specific times using the Windows task scheduling process. For example, it may be scheduled to run every night at 2:00 am. When initiated manually or automatically, it will review the Incoming Data Folders to determine if Incoming Data is available. When present, that data will automatically be loaded and all associated Summary Queries will be processed. A run now" button is provided in the Pulse Administration menu to facilitate immediate run requests. Note that a future release of Pulse will allow Pulse parser to be scheduled from within Pulse functionality. The PulseParser follows the basic rules established for its processing. These rules are those associated in dialogs for Incoming files and Summary Query Groups and are further defined in the definition of Pulse Projects. Generally, Pulse Projects are the control point for establishing the rules governing Parser activities. These rules are discussed in detail in the Data Project chapter of this manual. When initiated manually, the Pulse Parser will display the following Windows dialog. Once initiated, Pulse Parser will run automatically after ten seconds, or prior to that time elapsing a user may click on the Run Now button to start the parser immediately or the processes may be terminated before it is run. The parser will default to the first database in the Pulse Settings file, or an alternate database may be selected. The parser may also be processed in a Pre-Defined Loop to support multiple databases being processed in a single execution. 25
26 Pulse Data and Information History Management NOTE: This section applies to both Incoming Data and to Summary Queries. It has been referenced several times in those sections. Overview Pulse incorporates functionality to maintain historical data for both incoming data files and for summary query data. As described in the previous section, incoming data files are the raw data imported by Pulse from other application systems. If the incoming data file is a transaction based file containing all YTD transactions, then it is unlikely that history needs to be maintained on this file. It already incorporates its own history. This would also be the case in a table reference file. In this case, the data imported represents the totality of what is needed to use that data. However, if the file being imported contains daily or periodic information, or contains only records that that have changed from the prior day, it is mandatory that the data from previous imports be updated from this data rather than being replaced by it. If current Pulse projects are considered, it is not common to experience this situation, but it does occur on an exception basis. The Pulse importing process will, by default, replace the data in the incoming files with all new data that is imported. Maintaining history on that data, or, updating that data with data being imported may be defined in the incoming data or summary query dialogs. The process for both is the same. Maintaining History History is initiated in the History Store Type section of the Incoming Data and Summary Query dialogs as shown in the following example: The default setting is No History. When this setting is selected, Pulse will replace all of the data that was previously imported for this file with the new data being imported. No history will be maintained. When the Pulse history function, Always New or Straight to Archive is selected, Pulse will maintain a user defined number of instances of the raw data being imported. For example, if the number of historical instances for a specific import file is set to 100, Pulse will maintain each instance of imported data for 100 days. If these functions are selected and the Keep History field is 0, then an infinite amount of history will be maintained. If the selection is set to Always New then the data being imported will be written to the same file as a data extension. One file will maintain all historical data. If the selection is set to Straight to Archive then each import of the data will be written to a new file. That file name will designate the name and age of the file. 26
27 Key Based Data and History When the selection is set to Key Based, Pulse will use a designated field key from the data to update the file with the data being loaded. When an imported file (or summary query) is processed, Pulse compares the data in the associated Pulse data tables based on the key. When, based on this key, the existing data matches the keys of any of newly imported data, the existing data that is matched that key will be deleted and replaced with the newly imported data. When the key does not match any of the existing data records, the data is added to the file. For example, if the key being used is an employee number, then when a record already exists in the file for the targeted employee number, the data in the import or summary query file will replace that record in the file. When the employee number does not already exist in the file, the record will be added. Key based example: Assume a table with SchoolID, Date and Absence fields. This file (version 1) is initially loaded on October 1st with the following data: 100, 10/01/2011, , 10/01/2011, , 10/01/2011, 36 The resulting Pulse data table will appear as follows in the Pulse tables: SchoolID Date Absences New_Entry Insert_Time /01/ *datetime file 1 is run* /01/ *datetime file 1 is run* /01/ *datetime file 1 is run* A subsequent import is performed (version 2) on Oct 2 nd. Assume that the imported file appears as follows: 100, 10/02/2011, , 10/02/2011, , 10/02/2011, , 10/01/2011, 42 *** Because this School ID and Date Combination is the same as seen Previously, old data is replaced 27

28 The Pulse data table will update as follows: SchoolID Date Absences New_Entry Insert_Time /01/ *datetime file 1 is run* /01/ *datetime file 1 is run* /01/ *datetime file 2 is run* /02/ *datetime file 2 is run* /02/ *datetime file 2 is run* /02/ *datetime file 2 is run* Note that it is uncommon that a key will be used with Summary Query data, however, if a key is desired, it may be noted at this time by clicking on the field to be used for a key and saving the file. If no key is to be used, simply clicking on Save will transact a normal Summary Query file save. The following is an example of the use of these fields in an Incoming Data dialog: 28

29 The following is an example of the use of these fields in a Summary Query dialog: 29

30 Importing Data Data being imported into Pulse is generally imported on a scheduled and unattended basis. When this is the case, Pulse provides a utility, Pulse Parser, which is scheduled on a user defined basis to control the data importing process. Also note that this scheduled process may incorporate more than simple data importing. It may also include processing summary queries (see following sections on summary queries) to manipulate that data into refined information. The details of this scheduled process are user managed and will be discussed in more detail in upcoming sections of this manual. While performing data loads on a user defined schedule is the most common process to load data, this and other methods may be used on exception. These methods include: Scheduled Import Processes. For example, performing all imports at 12:00 AM each night or each weekday night. User Initiated Imports. User initiated import processes to import all data that is available. Selective Initiated Imports. Imports may be performed for selected data files or for selected files. User and Schedule Initiated Importing When the Pulse Parser/Importing Data process is to be scheduled, the Pulse Parser may be scheduled using Windows Task Scheduler on the Pulse Server. Upcoming releases of Pulse will also allow the Parser schedule to be maintained in Pulse Dialogs. While it is unusual that the Parser is initiated manually, this is also supported. The Parser may be manually initiated by either clicking on the Run Parser selection on the Pulse Administration Menu or by clicking the Pulse Parser icon on the desktop of the Pulse Server. Once the Pulse Parser is initiated, Pulse will interrogate all incoming file folders, import all available data and dynamically execute all associated summary queries. After the process is complete, an on-screen summary is displayed for user review and verification. If the incoming folder contained no data, a No File result is listed. When data is imported the result message is Success. If the file is imported, but some rows of the data were skipped because of inadequate data (for example alpha in a numeric field) Pulse will report the number of rows that were loaded and/or skipped. 30
31 Several other messages may also be displayed if an import or calculation process fails. Failures to import or calculate data may be due to improperly constructed SQL statements, unexpected data conditions or other unexpected occurrences. The status indicator will indicate that the processes did not complete and why those processes did not complete. Note that when the Pulse Parser is executed manually, this communication is provided interactively. When the Pulse Parser is initiated on a schedule, the communication is written to a log for subsequent review. When the result of the import process results is an import error the result column shows Error as in the following example. By using the mouse to hover over the Error message a pop-up message will be displayed showing the detail of the error message. 31

32 Manual Tables Generally, most data managed by Pulse is imported from other applications or generated from data imported from other applications. There are situations, however, where a Pulse developer may want to manually build a data table into Pulse. This would be the case when the data being manually added to Pulse is either not otherwise available in an electronic format or some type of control data is entered for management purposes. An example may be to store and use a school year. If the current school year is 2011, putting this into a manual table and reading it from there, instead of hard-coding it in Pulse logic, makes the change of the school year a one-time occurance. There are numerous other uses for manaual/parameter tables, but almost all of them are associated with management control of information generation. It is NOT EXPECTED that this process be used to generate ongoing data entry files. It is designed for parameter files only. Pulse provides a separate data entry process for ongoing data entry requirements. To view or enter new Manual Tables click on the Manual Tables menu item. Note that all manual tables will automatically be preceded with a ZM_ in the Pulse database indicating that the file is generated from a manual table. To view or edit a table, select the icon. A new manual table may be created at any time by clicking. This section will review the establishment of a new manual table Table Name: The Name for the table; this will be used to name the file in the SQL database. Replace the displayed *NEW* with the new name for the table. 32

33 2. Column Detail: Column Name: Name to be used for that field or column in the database table Data Type: i. Varchar: Alpha fields, or mixed (numeric and alpha). The size of the field defaults to 50 characters, however, it may be changed to any size desired. ii. Integer: Numeric fields. iii. Decimal: A maximum character size and number of decimal places are required. iv. True/False: This option will place a checkbox in the manual table. Add: After entering the information for a column, select to include the column in the manual table. An unlimited number of columns (fields) may be created Once completely entered, click to create the table in the Pulse database. This process has defined the manual table in the Pulse database. It may be changed at any time. Once the definition of the table is created, the following dialog is displayed. Note that this is the same dialog that is displayed if a user clicks to edit a table that has previously been defined. Edits to this manual table format can be made at any time by making changes as needed and clicking the button. To enter data into the table, enter each line and click. The Add button must be clicked for each line added. In this case, three lines have been entered. Using the check boxes under the icon a defined data field may be deleted. Changing a line or deleting a line can be initiated by clicking on. The Update Data button must be clicked to change previously entered data. When changing a data field, the field will be highlighted in a light red color. The entered data is committed when the Update Data button is pressed. 33

34 Summary Queries Summary Queries are SQL statements that read incoming data and/or data generated from other summary queries. In all cases, a Summary Query generates a new data file in the Pulse database containing the resulting data from that query. The database table is assigned the same name as that assigned to the Summary Query. As such, Summary Queries are used to manipulate imported data into processed information for end user consumption. Simple examples are to create totals, averages and other data results. More advanced uses would be to generate trend lines or future projections. They are also used to combine data from different application systems. For example, they may be used to combine financial data with student data for advanced user access. Summary Queries: are combined into groupings called Summary Query Groups are used to generate summary, statistical or simply modified information from the incoming data that is loaded into Pulse automatically process at the same time data is loaded, and, updated each time data is loaded, as part of a project (projects will be defined in an upcoming section of this manual) can be recalculated at any time from existing data, without reloading Incoming Files are time-stamped and saved by Pulse for an indefinite period of time, allowing the creation of historical data and statistics for automated reporting, trending and graphical representation. Maintaining Summary Query Groups To view summary queries click on the Summary Query Groups menu item on the Administrative Menu. Summary Queries are logically grouped so that they may be easily categorized, organized, processed and attached to projects. Once this option is selected, a dialog showing all defined Summary Query Groups is displayed. A search function is provide to search these groups by name for larger implementations. To view or edit an existing query group, select the icon. A new summary group may be created at any time by clicking. 34

35 The following example shows the Summary Query Group "User Activity". This group contains a single summary query, however a Summary Query Group may contain any number of summary queries: Name: The Name for the Query Group, no spaces or most special characters are allowed. 2. Desc: Description, Represents Documentation of the Query. 3. Query Group processing: Save: Save the current group Delete: Delete the current group (does not delete the queries) Run Now: Runs all queries in the group Cancel: Exits the process without saving changes 4. Queries in the Group section: Displays queries currently in the group To delete the query from the group, select the checkbox next to the query and click Update; remember to Save the group before exiting create new query, and automatically assign it to the current group; see next section, Maintaining Summary Queries edit the query run the selected query only The sequence number represents the order that the summary queries will be executed with the group is processed. It may be changed at any time. 5. Query Search: Used to add queries previously created Enter query name, or leave blank, and click search, to find and add new queries to the group To add, select the checkbox next to the query and click Add Selected The query will move to the Queries in the Group area A single query may be added to multiple groups, though this would not be a common action 35

36 Maintaining Summary Queries In addition to managing queries through Summary Query Groups, Summary Queries can be managed individually through the Summary Queries menu item, regardless of group. The top search box allows may be used to find specific queries. Click on the any query to edit. New queries may be added at any time by clicking. icon next to Whether editing or adding new, Pulse displays the Edit Summary Queries dialog as displayed. Summary queries are Pulse managed SQL statements. The SQL statements are most easily created and copied from SQL Server Management Studio, however, they may also be directly entered into the Edit Summary Query dialog

37 Table Name: This name will be used to create a table in the Pulse database. Spaces and most special characters are not allowed. 2. Table Indexes: Table Indexes are not used with most summary queries, but provide a valuable function. The use of indexes may significantly improve the response time when viewing data generated as a result of the summary query. See Table Indexes under Other Administrative Functions. 3. Query Description: Enter a short description of the summary query. The description is used for documentation purposes only. 4. History Management: An unlimited amount of history may be maintained on any computed information. Generally, the resulting data from the execution of a summary query will directly replace any data it has generated in the past. Maintaining history allows the selective archiving of the history of multiple processing cycles. The management of history is explained in detail in the previous section of this manual. 5. SQL Query (SQL Statement): Enter the SQL statement to generate the desired summary or statistical data. The entered SQL statement is commonly a SELECT SQL statement. The SQL statement will use the table field names defined while loading incoming data or the data names generated from preceding summary queries. 6. Button Selections: Four buttons are provided to initiate processing of this function. Test, Save, Delete, Drop Table, Run Now and Cancel Test: Execute the query and display the first 10 lines of output Save: Save the current query after Testing Delete: Delete the current query from the group (does not delete the query) Drop Table: Deletes the file and data in the database table; does not delete the query Run Now: Runs the query and updates the database table Cancel: Exits the group without saving changes 37
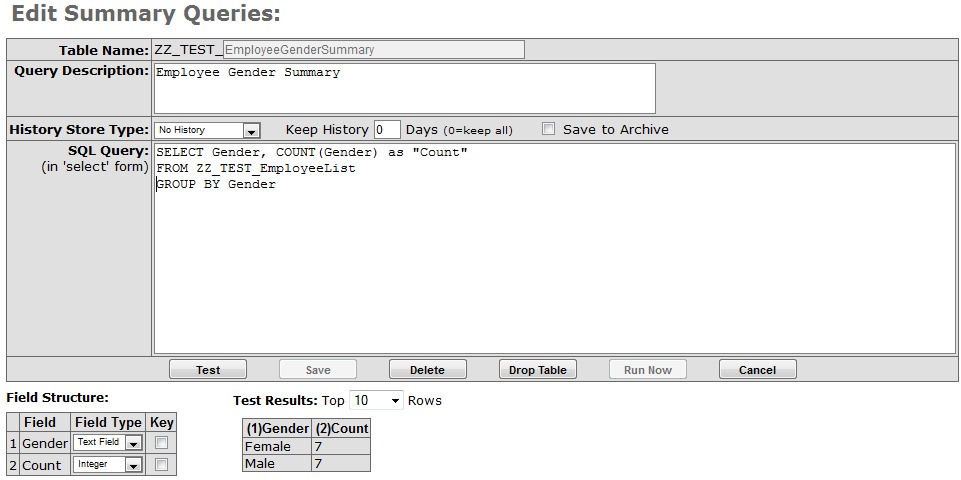
38 7. Field Structure: After the query is successfully tested using the Test button, a field structure will appear. Each field selected in the SQL Statement will be displayed: a. Order number b. Field: name used in query for the field name c. Field Type: - Varchar: Alpha fields, or mixed (numeric and alpha) - Integer: Numeric fields - Date Time: Date and time fields - Decimal: Decimal or other numeric fields d. Field Length (Varchar only): maximum length of field; defaults to MAX with no practical limit, it may be changed if desired. e. Key: Use when updating data from previous executions. The management of history/keys is explained in detail in the previous section of this manual. 8. Query Results: Displays the results of the query entered 9. Test Results Top #: Pulse will default the display to the first 10 rows of the data. A user may override this default by selecting an alternative number of displayed rows from this pull-down field. Summary Query Examples In a previous section of this document, we discussed the loading of external data with the following format: This simple incoming file will be used to show examples of how summary queries may be created. Example 1 - Calculate the number of employees for each gender In this example we have entered a SQL statement to compute a breakdown of employees by gender. When the Test button is selected, Pulse automatically executes the query and generates a sample results display. These sample results will be used to generate content for the users to view. Note that to reduce the run time and display space used by a query, only the first 10 result rows of the query result are displayed. Once the query results are reviewed, and deemed acceptable, the query may be saved for subsequent use in charts/graphs and viewing screens. The process to utilize the query results will be reviewed in the following sections of this document. 38
39 39

40 Example 2 Compute the ethnicity breakdown of all employees. Summary Query Subsequent Queries Summary Queries may access data from the results of previous summary queries. For example, one summary query may create a list of all employees that have been employed for over ten years. A second summary query may then read that data to determine the ethnicity and gender breakdown of that group. While this data could have been calculated in a single query, it is sometimes appropriate to break a complex query into several sections to facilitate ease of development. There is no limit to the number of subsequent queries that may be performed. Combined File Queries There is no limit to the number of data tables and summary query tables that may be read while creating a new summary query. Using this approach, multiple data files may be combined in any manner desired. There is also no limit to the number of queries and files that may be combined for inclusion on end user viewing pages. 40
41 Data Project Definition and Management A Pulse Data Project is a collection of Incoming Files, Summary Query Groups and all of the the page content and pages associated with those items. Additionally, a page content may also incorporate external processes, user alerts, processing scripts and data exports. These items will be described in upcoming sections of this manual. To define a Data Project, an administrative user will select and add the incoming files, summary query groups and other objects to be included. Pulse will dynamically review all of these selections and then automatically determine the page content and pages associated with the items selected. For example, an "Attendance Project" might include importing attendance data from a student information system and then a number of summary queries to compute information from that imported data. In other words, a Data Project is a group of data files, queries and associate objects that all address the same function, in this case, Attendance. The purpose of the Incoming Data Project is to create a relationship between these functions, and, to control the order and rules that govern them when they are processed. Additionally, a data project may be exported from one system and then loaded into another. Incoming Data Project Incoming File(s) Summary Query Group(s) Summary Queries All Page Content and User Pages Associated with each File and Summary Query 41

42 Defining a New Data Project The first step in managing Data Projects is its definition. By clicking on the Incoming Data Project option on the administration left menu, the Incoming Project transaction dialog is displayed as depicted in the following example. Projects may be edited by selecting the button next to the project. To define a new Incoming Data Project, Click on the Add New button. The following dialog is displayed Active: Check if this project should be considered active. 2. Run with Parser: This option determines whether or not the Pulse Parser will process this project on a schedule. Infrequently updated files, such as state testing, are usually not run with the parser. These projects will be initiated manually instead of being processed by the Pulse Parser. 3. Name: This name will be used to display the project and may contain spaces and/or special characters. 4. Description: Enter a short description of the summary query. The description is used for documentation purposes only. 42
 Run Now: Runs the project")
43 5. Button Selections: Four buttons are provided to initiate processing of this function. Save, Delete, Run Now, Cancel Save: Save the current project definition Delete: Delete the current project (does not delete the queries, groups, or incoming file setup) Run Now: Runs the project Cancel: Exits the project without saving changes Item Search: Search for items to add to the project. Enter the item name or item type to search. Available item types: Unassigned: All items not yet added to any other project. Incoming File: Most projects start with at least one incoming file. Summary Query: Single queries not otherwise being added by group. Summary Query Group: A group of defined summary queries. SQL Script: When running defined SQL Scripts, rarely used in most Projects. External Process: Used in initiate a previously defined external process. Export Data: Used when a defined export of data is defined. An example would be to send a data file as an interface to another system. Alert: Used when a defined alert (such as sending an ) is defined 7. Search Results: Once the item search has been executed, the results will display. Select the checkbox next to the item and select to include that selection in the project. Items may be included in multiple projects if desired. 8. Project Structure, Step Information: This line shows the step number as well as a checkbox to select if the item must be completed in order to continue to the next step. If selected, enter the step number to skip to if the step fails. A use example would be to skip a following step if an incoming file is not present. 43

44 9. Project Structure, Step Detail: This line provides information on the step Delete: to delete an item from the project, check this box and select from the top of the project structure area. Step: Determines the order the components of the project will be processed. Order: Determines the order the items will run in within a single step. Item: Name of the item selected. Type: Item type; typically Incoming File or SummaryQueryGroup Edit the item. Clicking this icon will drill the user to the incoming file dialog for that selection. Note in this example, the following actions will be performed when this Project is executed manually or via a scheduled process: Step Order Must Complete Skip To Action 1 1 Yes 999 If this incoming file import is successful, move to the next step. If not, skip to step 999 which is beyond the last step and will end the project. 2 2 No Load the Incoming File. 3 3 No Load the Incoming File. 5 5 No Run the Absents Summary Query Group. 6 6 No Load the ATNSpecialAdditional Incoming file. 44

45 Data Project Run Order As described previously, any number of Data Projects may be defined. Within a Data Project, any number of processing steps may be defined. The last step in managing the order that the Pulse Parser steps are processed is to define the order that data projects run. Note that not all data projects are executed on a scheduled basis. However, those that are should run in a defined order. It is common that the data generated from one project will be needed in the logic of the next project. So running projects out of order may result in inappropriate data results. From the Data Projects page, click the Run Order button as shown in the following example. The Data Project Run Order dialog will now display as depicted to the right. In this object enter the relative run order for the projects displayed (only projects previously marked as Run with Parser will be displayed). Click the save button to save the ordered entered. The numeric order is relative. It is not required that the numbers be entered sequentially as shown in this example. When multiple items have the same run order (as the items with a 99 in this example) Pulse will order the projects in the order that they were created. 45

46 Page Content and Setup Once data is imported and summary queries are calculated, the administrator may begin setting up Page Content. Generally, Page Content is an object that may be included on a user viewed page. Page content may be used in combination with other default content to create a page viewed by an end user. This is depicted in the following example. Page Content is generally defined as the business rules employed to display selected data from a Pulse table to an end user. For example: - What columns of the data are to be displayed or hidden? - What is the display order of the columns? - Are colors to be used in the display? - How is the data to be labeled? - How many rows are being displayed per page? - Are statistics to be calculated? - Are links to other pages to be employed? - Many more options are available. Examples of page content may include data tables, graphs, fixed objects, imbedded images or numerous other types of objects. 46

47 Page Content By selecting the Page Content menu item, the Page Content selection screen is displayed. Content may be edited by selecting the button next to the item. To define a new Page Content, Click on. The following screen is displayed Content Name: This name will be used on the pages to label the object for users and may have spaces and/or special characters. The checkbox next to the Content Name is left unchecked; the name will not appear when displayed on a subsequent page. 2. Content Description: This short description will be used on pages to describe the object to users. The checkbox next to the Content Description is left unchecked; the information will not appear when displayed on a subsequent page. 3. Content Type: Secondary options vary between these options and are discussed below: Table: Spreadsheet view of query results. Allows in-content sorting, filtering, and linking to other charts based on detail in the table; this is the most common type of content defined in Pulse. Flex Line Chart, Line Graph. Flex Bar Chart. Bar Graph. Flex Horizontal Bar Chart, Horizontal Bar Graph. Flex Pie Chart, Pie Graph. Simple Text: Basic text box for use on pages. May contain unlimited characters and displayed with or without borders. Advanced Editor: Extremely flexible content area that supports highly processed text, pictures, video, links and other content. 47

48 Tableau Link: Link to a website or Tableau page. The Tableau option is available only to districts with an active Tableau license. Meter: Meter Graph. Menu: A Table Based Menu with Links to other pages. 4. Button Selections: Save: Save the current content Delete: Delete the current content (does not delete the table/query) Cancel: Exits the content without saving changes 5. Content Help Content Help supports the development of interactive/real-time help for each Pulse object (Page Content). Content Help is supported in two formats: Root Help Root Help may be managed only by Root Level Users. It is maintained exclusively by Pulse staff and is updated in each release in all standard models. Any changes to Root Help will be deleted with each new Pulse release. Root Help is the official help for Pulse Page Content. Customer Created Help Customer Created Help allows each customer site to build help specific to their site. This help survives each new Pulse model release. Pulse Help is maintained and managed as shown in the following example. Clicking on the Root Help and/or Customer Created Help link displays locations for help entry. All help is entered using the Pulse Advanced Text Entry process. Please see that section of this manual for instructions on help setup and maintenance. 48

49 ***For each Content Type, see the graphic and refer to the following descriptions. 1 2 Table: Flex Line Chart

50 Flex Bar Chart Flex Horizontal Bar Chart:
51 Flex Pie Chart Simple Text 8 7 Advanced Editor

52 Tableau Link 2 Meter Menu

53 Content Type Information: 1. Content Help: When created, a help icon will be displayed below the content. The help is shown by selecting this icon. Content Help is created with a feature similar to the Advanced Editor feature. See the Advanced Editor section for a description of how to define new content in this object. Root Help: created by Pulse. Any changes will be overwritten when updates are applied. Customer Created Help: can be created by the customer. Will not be overwritten during updates. 2. Database Table: Name of the Pulse Table being used to populate this displayed object. In the rare case that history is maintained (see history management section), the checkbox next to the table drop-downis available to ensure that only the most recent data is included. 3. Table Indexes: Not for use with most Queries. See Table Indexes under Other Administrative Functions. Content Parameters: 4. Page Size: This determines the number of rows to be allowed on a single displayed page, from 1 to is the default size. This option allows for faster loading when large amounts of data are listed. 5. Hide Empty Rows: This eliminates empty rows from end user views. 6. Sortable Columns: Allows all displayed columns to be sorted in ascending or descending order. 7. Must Filter to See Data: If the data displayed is not meaningful unless filtered, this option may be used. No data will be displayed until a user submits a filter selection. Filters may be applied to a single table or to an entire page. Page filters are explained in the Page Setup section of this manual. 8. Chart Width/Height: Determines the width and height of the chart in pixels. The chart will shrink as necessary to accommodate the data. 500 by 300 will result in a small - medium chart, 1000 by 500 is very large chart. 9. Border: Will display a border around the entered text. 10. Left Margin: Indents a meter graph in relation to the page. 11. Display Values in Chart: Shows the value of the data in the chart. 12. Y-Axis Min Value/Y-Axis Max Value: Sets the minimum and maximum values of the Y- Axis. Leave blank and check the box for Auto when the data should determine these values; Pulse will look for and use the smallest and largest values. 53
54 13. Hide Axis Titles: If titles are automatically present, they may be hidden with this checkbox. 14. Tick Mark Intervals: Displays a line at the intervals entered in the chart; leave blank for automatic determination by Pulse. 15. Y Axis Title/X Axis Title/Label Font Size: A label can be used for the Y and X axis. Additionally, the title font size can be set manually. Use Auto if the values is to be calculated by Pulse. 16. Use First Row as Headers: In some cases, the header names may be determined by the first line of data. Without this option, the headers are determined by the columns names. The secondary options, to continue these headers after filtering, will ensure that those headers remain static, even if the filtered data no longer contains the header row. 17. When Using Auto Fields, show the column data if data is found in any non-header row: Columns can be set as "auto" in the show/hide option. When this checkbox is selected, Pulse will scan the entire table/column for data. Without this checkbox, Pulse will only review the first row to determine if there is data present. These options allow for dynamic inclusion of data columns. 18. Major/Minor/Micro Tic Increment: Displays tic marks at the intervals entered. This can be thought of as the same as a speedometer in a vehicle. 19. Zone 1-3 Range Low/Zone 1-3 Range High: These Zone are color coded and divided by the values listed. Content Detail: 20. Multiple Update Feature (Checkboxes in Green Bar): Tables allow the user to update multiple rows at the same time by checking the desired rows in this column and then changing any of the attributes from the green row at the bottom: Show, Align, Metrics, Indicators, etc. are supported. 21. Order: Fields are defaulted to the order of the summary query. Edit the order column to reorder these fields for viewing on the page. A button "123" at the bottom of the screen will change the order from "1, 2, 3..." to "5, 10, 15...". This allows for easier reordering when inserting columns. 22. Show: Determines if the field will appear on the user's screen; options are show, hide, and auto. For auto, Pulse will review the first row to decide if the field has data and therefore should be displayed. Use #16 above if Pulse should instead review entire table. 23. Field Name: Lists the name of the column from the Pulse database table. 24. Description: Column name to used on the page for user viewing. Spaces and special characters allowed in this field. 25. Header Col: Check if the field is to be utilized as header/column for graphics display. Only one may be selected. This is generally the topic of the graph. 54

55 26. Data Row: Check if the field is to be utilized as data/row information. Any number may be selected. Only numeric fields are allowed. 27. Field Type: Type of data to be displayed. The options are text, numeric, currency, date, and date/time. When a field type of numeric is selected, Pulse will display to additional fields. The first allows the user to select the number of decimal positions to display. The data displayed will be rounded to this decimal setting. The second is a comma selection option. All numeric fields will default to display type where a comma is used to display the field, such as 12,234,321. If it is desired that the field be displayed without the comma, click on that field to remove it. The display will become Pre: Default text to be listed before the field. It may include spaces for formatting purposes. 29. Display Value: Column name used on the page. 30. Post: Test to be inserted after the field. It may include spaces for formatting purposes. An example would be to include a % after percentage entries Width/Rows: These fields are used only when creating data entry page content. See the Data entry section of this manual for more information on these fields. 31. Wrap: Check if the data should be wrapped to a second line when the page is reduced in size due to display restrictions. Without this option set, the column/table will remain the same width regardless of the user's viewing area. Pulse will attempt to format a table for optimal display when the width of a page is not sufficient to display the entire table. This option allows an override of the Pulse display calculations Check if the displayed data is an address. The column will then contain a hyperlink to create a new addressed to the row value. 33. Header Src: Allows a user to generate custom header descriptions for columns. The summary query may be used to generate a text column to be used as the header in the data row. Then for each column to be displayed, the data that exists in a separate column may be selected as the header for that row. When selected, the data in the top row displayed is used as the column heading 34. Align: Column data may be left, right, or center aligned 35. Metrics: Calculated statistics may be dynamically created as a part of the resulting data display to the user. Click on the metrics option, then select total, average, standard deviation, median, mode, count, mix, max as needed. 36. R. Total (Right Total): Pulse will add together any numeric columns checked and display the total at the right of the displayed table. 55
56 37. Indicators: Highlights data when meeting a desired criteria; see Indicators section following this section. 38. Filters: Allows security based on school/teacher, users narrow data on page and links; see Filters chapter for more information on this function 39. Advanced Editor: Capable of creating content with different fonts, images, and video; See Advanced Editor section for more information on this function. Content Detail: 40. Menu Entry Type: from the drop-downlist, select one of the following and click : a. Link to an internal Pulse page. b. Link to an external web page. c. Plain Text text to appear in the same font/color as links. d. Header Text text to appear in different font/color as links. e. Divider Line horizontal divider lines by column. 41. Link Search Area: Use this to search and find a specific link. 42. Link Selection Area: This is a list of links to all pages. Add by checking next to the link and selecting. 43. Delete: to delete a link, check this box and select the icon. 44. : check this box to display a bullet before the menu entry. 45. Row: enter the row number the link should be displayed in. 46. Col: enter the column number the link should be displayed in. 47. Width: user-defined width of column in pixels. Any links longer than the specified width will continue on wrap to a next line. Leave blank for Pulse default calculations. 48. Type: Automatically displayed based on Menu Entry Type choice. 49. Display Name: This is the name that will show on the user's screen for the internal or external link, Header Text or Plain Text. Not applicable for Divider Lines. 50. Link To Page/URL: For links to an external web page, enter the complete URL. For links to an internal Pulse page, the page description will display. Not applicable for Divider Lines, Plain Text and Header Text. 56
57 Indicators Background and/or font Colors may be used to highlight specific data conditions for users viewing data. For each column of data displayed, up to ten separate color indicators may be created. For example, a field may be displayed in green if the result is better than expected, in red if unacceptable and in yellow if it is border line. The process to define these conditions is described in this section. In the example below, if the employee age is greater than 55 (nearing retirement) it will be displayed with a Green background color. Pulse will allow the definition of up to ten color conditions for each field displayed. The first step is to select one of these ten indicators as shown in the following example. The first indicator is selected. As a note, it is extremely important to remember that the indicators created will not be activated on the page content unless the leading checkbox is selected, Once the Indicator is selected, clicking on the Go button will display a color selection box as shown in the example below: Click on the selection Pull-down and select the condition: >, <, =,!=, >=, <=, Between or Always On. Note, alpha fields may also have indicators. 2. Enter the value required to activate the filter 3. If the activated filter should change the background color of the field, check BG Color; if the font color should change, check Font Color. The color selected will show to the left, followed by the hexadecimal color code 57

58 4. Select a color from the pallet on the right (this color will populate the BG Color or Font Color fields when they checked) 5. Pulse allows the color settings used in one column to be based on another column. If this is desired, select the alternative column in this pull-down 6. Save the selection, or cancel any changes 7. Ensure that the checkbox to include the alert in the display has been selected 8. Remember to Save the Page Content. To delete an indicator, select that indicator from the drop down, select go, change the dropdownback to "Unassigned" and save. Example of a filter for greater than Age of 55 displaying in green: 58
59 Advanced Editor The Advanced Editor content type is similar to the Simple Text in that they both can be used to create instructions or other informational notations on a page. The Advanced Editor, however, is able to incorporate different font sizes, font colors, web links, images and video. Using this feature is very similar to the use of word processing software. There are many options available for use: Source: For developers with HTML coding experience; changes may be made with the same language as a web page is built upon. Use this option to insert pictures or video. 2. Preview: Screen preview of content. 3. Templates: Use a template to manage the content format; Image and Title, etc. 4. Cut, Copy, Paste: Typical options for moving text within or between documents. Paste includes a distinction between plain text (from a text editor), or text from a Microsoft Word document. 5. Print: Print the content. 6. Spell Check: the first button will spell-check on demand, while the second gives the option to spell check as you enter text. 7. Undo, Redo: Will cancel a change or recreate the last item that was undone. 8. Find, Replace: Finds or Replaces a word or phrase in the content. 9. Select All: Highlights all content for change. 10. Remove Format: Removes all formatting from the selected text. 59
60 Bold, Italics, Underline, Strikethrough: Options for formatting text. 12. Numbered, Bullets: Will format the selected text into a numbered or bulleted list at user selection. 13. Indent: Removes or Adds an indent to the paragraph. 14. Block Quote: Formats the selected text into a block quote. 15. Create Div Container: Creates a Div for content development; usually completed with "Source" view. 16. Left/Center/Right/Justified Formatting 17. Add Link, Remove Link: Will insert and remove a web link. 18. Anchor: link to another document on the server; completed with "Source" view. 19. Image, Flash Video, Table, Horizontal Line, Smiley, Special Characters: Each of these will insert the given image into the content. 20. Page Break for Printing: This is a background formatting option that will create a break in pages when printed Text Formatting: Changes the style, paragraph format, font, size, color, and highlighting of the selected text. 22. Maximize: Expands the Advanced Editor to fit the entire screen. 23. Show Blocks: Shows the paragraph and Div boxes. 60

61 Page Content Filters Pulse incorporates a unique Filter by technology to control end user access to defined pages. This feature also alleviates the work needed to build pages that are used by various users with varying levels of security access. Generally, these filters are used to manage field level security, to support drilling from one page to another and to allow users to select variable sets of data when viewing a Pulse table. Page Content Filters are may be defined for each field in a page content. As described above, there are three separate types of filters: User Defined: Support for field level security, typically based on the school, department, location or teacher number that is defined on the user s security record. See the Security chapter in this manual for more detail on that definition. Real-Time: Allows the user to filter data as needed in the content display. Link: Creates a link that may be selected to drill to a specific page. The targeted page may be filtered based on the criteria entered with the link, such as a table showing only records matching the student name. Pivot Grid Definition Pulse supports the creation of Pivot Grids as page content. These types of objects allows end users to interact with Pulse data via a drag and drop process. Below is an example of a Pulse Pivot Grid definition. Generally, the top portion of the definition is the same as that for other types of Pulse Page content as described above
62 1. Select the Pivot Grid Page Content type. 2. Select the type of source data that will be use to provide data to the grid being defined. Pivot grids may be populated from any Pulse data table, or from an Excel Cube built outside of Pulse. In most cases a Pulse data table will be used to populate the grid. 3. Select the name of the Pulse table or external cube that will be used. 4. All field names from the data source will be listed. 5. Optionally, the data name from the data source may be overridden for end user use. For example, a field name named StudentName may be changed to Student Name. 6. Each pivot grid contains four areas for data control. These are Data Areas, Column Areas, Row Areas or Filter Areas. A field may also be hidden and not used in the grid display. See then example below showing each of these areas and how they are used. Pulse Administrator users may re-organize the starting view of a pivot grid by dragging and dropping existing columns to their liking then clicking on Save as Default (available to only Administrative users). Pulse users will subsequently see the default layout when they open up the pivot grid: 62

63 Real-Time Filters Real-time filtering allows a Pulse data table to be selectively filtered in real-time by an end user. For example, a list of all students may be filtered to list only those students in a specific grade level, or list only GL transactions in a specific fiscal year. Using this capability, a single table may be generated to simultaneously meet several different reporting requirements, significantly reducing the development time and effort. 1. For the desired field, select the checkbox in the Filters column of that row. 2. Select 'Real-Time' from the filters drop-down. 3. If desired, enter a default value for the filter for all users. Otherwise, leave blank. For user viewing, this filter is displayed at the top of page content. A user may filter by choosing '=' or 'like' in the first drop-downand typing their criteria in the selection box, or by using the 'list' option. When using the 'list' option, the selection box will provide a dynamic list of values currently available in that field. This list is truly dynamic. In the example that the column being filtered displays the student grade level, only those grades present in the data will be displayed in the pull-down selection. So, if no third graders are present in the data, it will also not be an option in the pull-down list. An additional option in the page content screen to be noted is the checkbox for "Must Filter to See Data". Check this option if no data is to be displayed until a filter selection is submitted. This option is usually used when the data being displayed is not meaningful until filtered. As shown in the example at the right, multiple real-time filters can be utilized concurrently. In this example all students in section 24 of 10 th Lit/Comp CP are listed. Therefore, each filter selection is considered an AND condition in relation to other filters. 63
64 User Defined Filters User Defined Filters are designed to limit the data that users view, usually for security reasons. They are defined by choosing User Defined in the Filters drop-down, followed by a criteria in the second dropdown. This criterion is typically a school number, department number, location number or teacher id. The criteria are defined by clicking the View Button in the transaction. The filter will restrict the data displayed to only that data which matches the filter. In the example of a school number, the users will only see data from the school(s) they have been given permission to see from their Account Setup screen (see the security section of this manual for information about setting up user security). To establish this feature there are three steps. Generally, the first step (define global filter) is a one-time process to simply define the security fields that will be used. The second step (define user security) is performed only when setting up a new user. The third step, defining the filter in a page content, is performed each time a new page content is defined. In summary: 1. Define the fields that are to be used for security as User Filters. 2. Define the fields to which a specific user is to be restricted in the user security record. 3. Define the use of the filter in the specific page content (data table) so that security is applied to that table. 64
65 Step 1 - Define the fields that are to be used for security as User Filters. User Defined filters may be defined in the User Filters selection from the Administration menu as seen in the example to the left. A B C D E 1. To define a new user filter, enter the filter selection and click the Add New button. All existing filters are displayed in the Current Filters listing. In this example filters have been defined for Department, SchoolNbr and Location. 2. User filters definitions may optionally be displayed in the Top Banner of user pages. The example definition above defines this function. In the top banner the literals School, Department and Location will be displayed followed by the user s current selections for those areas. A sample result of this entry is shown in the example below. 3. To define a new filter, following the following steps: a. Enter the desired filter name and click the Add New button. b. Click the click box to activate the new entry. c. It is assumed that prior to this process a summary query has been written that contains all of the options that are present for this new filter. In this column, select the summary query/table name that contains that data. This file will be used to populate pull-down selection boxes. Note that users will be presented only the selections that their security record allows them to access. Additionally, the file should contain both the field to be used as filters, 123 for school number, and the related name to be placed in the pull-down selection, Lincoln High School. d. Select the field from the file that contains the data to be matched for security purposes. For example, matching on school numbers. For example, school number in the data file could be a 123, 987, etc. e. Select the field that represents the name of the field, for example Lincoln High School that will be used to populate pull-down selection lists. Click the Save Button to save the entry. 65
, by Location to Organization Wide (Payroll/HR Data) and by School to Edwards HS (SIS data. 5.")
66 4. In the Pulse user interface, a user may type or select a user filter from a pull-down of all filters that have been defined. In the following example, a user is filtering by Department to 001 Main High School (Financials data), by Location to Organization Wide (Payroll/HR Data) and by School to Edwards HS (SIS data. 5. As stated above, users will only be given the option to select a filter from the pull-down if they have been given rights to see multiple options for that area (school in this example). Additionally, a user will only be provided selectable options for those defined in the security record. Please see security definitions for addition information on defining field level / User Defined security. Link Filters Link filtering provides point and click drilling from a table containing data directly to other Pages. For example, in the following example, a user may click on the number of 5 Day Disciplines and drill to another page showing a list of those students with disciplines in the last five days. On Initiating Page On Target Page Link Filtering is defined as a filter parameter in a page content definition. The steps in this process are as follows: First, either define or determine a page to which the link will be activated. For example, clicking on the link will drill the user to this new page location in Pulse. This new linked-to page should contain all of the data to be displayed for each of the selection items, in this case, all students disciplined in the last five days. It should also contain a column for interactive filtering of the selected item, in this case school number. When the new screen is displayed at a user mouse click, it is dynamically filtered by the user selected field. So, when the user clicks on the 5 in the above example, a page/table is then displayed that contains all students disciplined in the last five days for that specific school. The following example shows how to define these relationships. In this example, a table called DIS Recent Discipline Events has been defined that contains a list of all students disciplined in the last five days for all schools. It contains a column indicating the school number in which they were disciplined. The column containing the school number in this table is labeled 66

67 SchoolNumber. The column containing the school number in the originating table is also labeled SchoolNumber. The page content description process then supports the establishment of this relationship for real-time viewing. It should be noted that the field being used for the logical linking does not necessarily need to be displayed on the target page/table (may be hidden) as is the case in this example. 1. From the display page, click on the Pencil icon to display the page content for the table from which a link will be initiated. Then when the page content is displayed, the first step is to select the Link Filter option. The next step is to select the Page to which clinking on the table will display after the link is selected. Clicking on this pull-down box will display all available pages in Pulse. Target Page. This field allows the target page to be selected from a list of all available pages in Pulse. In this example, when a user clicks on the drilling field, this page will be dynamically displayed. Target Content. It is very possible that the target page contains multiple displayed tables. Because of this, it is necessary to declare/select which of these tables will be used to condition the drilling. For example, to automatically filter the data on the new page by comparing the data in the initiating page to data in which table on the new page. In the example below, the targeted page contains only one displayed table and it is selected. When the desire is to simply drill to the new page without data filtering, selecting the Nothing option will all invoke this option. Target Content Field. The next step is to select the data field in the target table that will be used to automatically filter the table/page that will be displayed via drilling. It is not necessary that this field be displayed on either the initiating or the target table. It simply must be a part of the page content of that table. As shown in the example below, in the case the SchoolNumber field is selected. The Filter Field pull-down will display each column contained in the selected table. Select the field to be used to compare to the field in the originating table for the filtered display. 67

68 Filter Value. The next step is to select the field in the initiating table that will be used to automatically filter the table/page that will be displayed via drilling. It is not necessary that this field be displayed on either the initiating or the target table. It simply must be a part of the page content of that table. As shown in the example below, in the case the SchoolNumber field is selected. Select the field from the originating table to compare to the target table. Don t Filter In some cases, there may be a desire to drill to a new page, but for specific selection in the initialing table no filtering is desired. For example, drill to a new page in the normal manner but if the entry in the originating table was a 0, then show the new page in its native form (as if selected from a menu) without filtering. Clicking on the Disable Target Filters click box will disable filtering, however, the definitions entered will be maintained. 68

69 Page Content Dynamically Run a Query/Query Group/External Process Pulse supports the definition of a page content type that allows a user to execute a preset summary query, query group, or external process. The page display to an end user when this content is used is a button to click or push to create the action. To create the button, create a new Run Query Button page content, then select the summary query or group or external process to execute: Once this content is added to a page, the user with the rights to view this page sees the button: Clicking the button, the user sees an option to start process (or cancel). The window temporarily disables all other links on the page until the action is completed or canceled as shown in the following example. 69

70 After clicking Run Now the following is displayed: After the process has completed the following is displayed: 70
.")
71 Page Content External Web Pages and Tableau Tyler Pulse provides extensive support for integration of external web pages into Pulse standard models. Additionally, this functionality provides distinct support for integration with the Tableau Data Management System provided by Tableau Software Inc. ( This manual does not address the process to create Tableau content. That process is separately addressed by Tableau training and documentation. However, the appendix of this manual provides a general outline of that function. Web Page Integration The web content type allows for the integration of external web pages as inserted windows into a Pulse Page. This capability allows external web sites and the data provided by those sites to be added to an end user Pulse page. In the following example, using the Tableau Link page content type, a web page is selected to be inserted into this Pulse display object. In this case, the web site is from the State Department of Education showing the state generated report cards for that school and district. Once this new content is incorporated in the Pulse page, it is displayed as shown in the following example. At viewing, a user may simple operate the imbedded page in the same way they would interact with the page if navigating to it in a browser. 71

72 Tableau Support Generally, Tableau allows direct access to Pulse data to generate advanced graphs, charts Tableau dashboards and data analysis. These generated data views may then be integrated into a Pulse Page Content object and incorporated into Pulse pages. When a Tableau page is generated, it is assigned a URL when saved into the Tableau repository. It will be necessary to have access to these associated URLs when creating Tableau content in Pulse. Once Tableau content is created, it is very easy to integrate into Pulse. In the following example, the Tableau Link Content Type has been selected when building the page content. The only input to complete this type of Page Content is to key in (or paste) the URL provided by Tableau. Using the Tableau Content Type The following is an example of the Tableau object generated by the previous example. This is an image of that page displayed in Pulse. 72
73 There are several functions available within the displayed object. These options are: Sorting By clicking on the sort up or sort down icon, the order of the displayed data or graph may be changed. Filtering By using the mouse to double click, or to draw a box around selected data, only that data will be displayed. Viewing Data - By using the mouse to double click, or to draw a box around selected data, clicking on the view data option will display the underlying data supporting that part of the displayed graphic. The data being viewed is supplied directly by Pulse and is included in a new browser session. In the following example, the fourth grade chart in this displayed has been highlighted and the View Data button clicked. This display shows only the data from the data source that is used to generate the chart being displayed Click on the Show All Columns button to view all data from Pulse data source. Note in this example, the data used to generate the graph is highlighted and other data from the Pulse data source is not. 73
74 Revert If the contents of the chart have been modified, clicking on the Revert icon will return the display to its original state. PDF Export Clicking on the PDF Export icon will export the displayed chart to a PDF format. View Changes Clicking on the first of these icons will allow a box to be drawn around a section of the chart, this is the default status. Clicking on the magnifying glass icon will allow for sections of the graph to be expanded or decreased in size. Clicking on the hand icon will allow panning to selected sections of the chart. Refresh Clicking on the Refresh icon will refresh Pulse data feeding the displayed graph. At the bottom of the display is an area for users to collaborate by making comments. In this example a user, Mark Rigsby, has made a comment about the data that may be viewed by all users. Other users may add comments for viewing by all users with secured access to this Pulse page and data. 74
75 Page Definition The last step in the primary development process is to define the pages that will be used by end users. End user pages are defined by selecting page content and combining it onto a displayed web Page. A browser page is the primary tool used by Pulse to deliver information to end users. To begin the Page Definition process, the administrative user will click on the Page Setup link on the administrative menu. The following screen dialog is displayed. In this example, several previously defined pages are displayed Also displayed is the ability to create new pages for display. Click on the pencil icon of an existing panel to change a page, or click on the Add New Page option to create a new page. Both of these options will be discussed in the following section. Note also that pages may be searched for by name in the searching and order by functions of the Page Content dialog. 75
76 Content may be edited by selecting the button next to the item. To define a new Page, Click on. The following screen is displayed Page Name: This name will be displayed to users at the top of the page and may include spaces and/or special characters. 2. Shortcut: This is a code used as a quick way to navigate to the page. Pulse will automatically assign a shortcut key and this is usually the option that is used. However, if desired, enter a page shortcut for the newly defined page. 3. Hide from Top Pages Lists: Check if this page should be excluded from a user's top ten list. For example, it is common that menus are excluded from the top ten calculations. 4. Public View: Check if this page should be viewable through public access. Most pages are designed for only internal (employee) use, however, some pages may be intended for public viewing. 5. Menus: Check if this page should appear on the Main Left menu of either the internal web site or the public web site. 6. Button Selections: Save: Save the current page Delete: Delete the current page (does not delete the content) Cancel: Exits the content without saving changes 76

77 7. Content Search: Use this search area to filter through the content selection area. Content may be searched by type and may be sorted into various orders. 8. Content Selection Area: This is a list of all content previously created in Pulse. Any of these objects may be added to a Pulse Page. The list includes data tables, all existing page content; various graph types, links to all existing pages and content pieces for formatting called "Horizontal Divider" and "Extra Space". Selected content may be added to the page by checking the click box next to the content and then clicking. Multiple copies of content, such as a divider, may be added in a single selection by changing the quantity field before adding. 9. Page Filtering: Page filtering is used to apply real-time filters to all content on the page at once. This is very similar to table filtering discussed in the previous section. See the section on Page Filters for more information on this feature. 10. Selected Content Area: Listing of page content that has been added to the page. a b c d e a. Delete: Check the content and Save the page to delete the content from the page b. Order of Content: Order that the content will appear on the page. Edit to reorder the content. A button "123" at the bottom will change the order from "1, 2, 3..." to "5, 10, 15...". This allows for easier reordering. c. Name of Content for reference only. d. Type: Content type: Link, Divider, Chart, etc. e. Filter: Add/edit page Filters. See section on Page Filters for more information on the use of this function. 11. Roles: Each page may be associated with one or more user roles. Click on the appropriate roles for this page. See the chapter on User Roles for more information on the use and definition of roles. 77

78 Example of Completed Page: Page Name Data Table Meter Graph Data Table Horizonal Bar Chart 78

79 Page Filters Page Filters are similar table filters (previously defined) but are designed to be applied to all or selected tables on a page instead of to a single table. In the example below, the steps to apply a Student Name filter to multiple tables on a specific page. The following is an example of a competed definition of a page filter assuming five data tables on the same page. The first step is to define the page filter. Click on the New button and enter a name and data type (usually text) as a filter name. In this case, we have defined Vendor Name as the filter name. See the example above. The next step is to assign the Vendor Name Page Filter to each of the five tables on the page. Perform this step for each of the five tables as shown in the following example (the end result is displayed in the example above). Click the Add button on the right of the line where the page filter is to be added. Two pull downs will be displayed as shown below. On the right, select the page filter to be used (multiple page filters may be used on a single page) and on the left select the field from the display table that will be matched to the page filter. Note in this case, the Vendor Name in the table is labeled Locator and the Page Filter is labeled Vendor Name. They must equal for data to be displayed on the page. 79

80 When a page is rendered in Pulse, the filter options included in the pull down calculated as a summary of those options in each of the tables on the page. For example, on this page the Vendors Names from each of the displayed tables are combined to create a distinct list of valid names and that list included in the pull down. At times, this approach may take some time when the data in the tables is large. To alleviate the time needed to create the pull down options it may be desired that only one table in the display be used to create the pull down options. When this is the case, click on the far right click box of that table as shown in the following example: You can optionally create a non-displayed set of data that can be used to generate a list box on a page. This is done by creating a new Page Content, Content Type Hidden List, and then select a database table containing the data to include in the pull down list. You ll simply see a list of columns that are contained by the table: Including this content on a page will allow you to use one of the fields as part of the data used by the Page filter to generate a list box: Note: currently, User Filters do not apply to Hidden Lists, so do not use them in cases where you need the list box data filtered by the current user filter. A future version of pulse will allow you to apply a user filter to a hidden list column. 80

81 In this example the page is designed to show several tables of information based on a selected vendor. When the page is initially rendered, all of the data tables are empty. They will be populated when a page filter is selected. A selection for a vendor is made from the Pulse generated pull-down list representing the Page Filter. See the example below: 81
82 Page Layout Management Managing Multiple Page Columns Pulse supports the definition of many separate columns when placing page content objects onto pages. This section describes that content. Note that when a single column is being used on a page (most pages) no input is needed to support that result since a single column is the default page format. The following is an example of a multiple column page. In this example the table Activity Summary is displayed in a single column while the following two rows of page content objects contain two columns each. Each individual row on the page may contain a variable number of page content objects. The following example shows the setup for this page. Note that column 1 contains a single object while columns 40 and 50 contain two objects. 82
83 The definition of these columns is as follows: Row: Row corresponds to the vertical order of a content item down the page. The row number is relative and does not have to be a sequential number. To place multiple page content objects in a single row, use the same row number for each object to be displayed vertically. Col: The column definition defines the relative position of the page content object on that row. Enter that number, in this case, 1 or 2, since there are two columns being defined. L Pad: This option places the designated number of pixals after between the objects being displayed. Width: This entry is usually optional. It defined the pixel width of the column being defined. The column will default to the minimal number of pixels for that object to be displayed. If the width exceeds that requirement, the added pixels are displayed. 83
 is also supported.")
84 Page Categories Pulse supports adding pages to Page Categories for quick look up and grouping. When saving a page, note the Category field below the page name as shown in the following example. Enter a page category in this location and save the page to invoke that category. On the Display Pages list, filter by Category (once defined) is also supported. As shown in the following example, select the appropriate category to view all pages in that category. Select ALL- (default) to view all categories: 84

85 Data Entry Pages & Page Content Pulse supports definition of additional data fields that may be associated with a page content and edited by users. This functionality provides support for direct data entry and data maintenance by end users. Captured data, for example, may be used in addition Pulse content, exported to files directed to other applications or generally used in any way that data is currently used by the Pulse engine. The first step in creating user-entered content is to select or build a page content object that contains existing Pulse generated data. This data will serve as the index to the user entered data. For example, a student id and student name field that will have added data, such as test scores, appended to it. Once that association and the new data entry fields are configured, the new fields can be selected to appear on existing table content views, and edited by users who have the rights to view those pages. The steps in the setup process are as follows: Chose an existing Pulse Table To define and associate a new set of fields for a particular Pulse database table, click on the option Data Entry Setup on the Pulse Administrative Menu. On this form find, then select the table you wish to extend by adding new data entry fields. See the example of this function below: 85

86 When the selected table is opened, the left of the dialog will show all of the existing data fields that have been defined for that table. On the right the right will be a transactional area in which new user entered data fields may be defined. See the example below. In this example, this data file has already been defined with a Student ID and a Student Name. These fields and the file were created using standard Pulse Summary Queries. Data Entry Key and Field Setup To set up new user entered fields, first identify then check one or more key fields form the Source table display on the left. This will determine which of these fields will be displayed on the resulting user data entry page. In the following example, we have clicked on the StudentID field: 86

87 Once the key data field(s) has been identified, the new data entry fields may be defined. On the data entry field section enter the new data entry fields that are desired. In the following example, we have selected Assessment 1-3. When entering these fields also manage the Data Type (Integer, decimal, Text, etc.) and the character size desired for the field being defined. Once complete, click the Save Changes button to commit the updates and changes: 87

88 Data Entry Page Content Setup The next step is to create a Pulse Page Content using this defined data definition. This is done on the standard Pulse Page Content Definition Page as shown in the following example. When a Content Type containing user enterable fields is selected, an Edit button is displayed along with a Width and Rows column. Make sure the Edit click box is checked for all fields where data entry is desired 88

89 Data Entry for End Users Once this newly defined Page Content is added to a Pulse Page, a user will see the following object displayed on that page: A user can now enter data and click Save to save the changes. Two buttons are provided in the save column. They perform the following functions: Undo any changes to all fields in this row you ve made since the last time you clicked Save. Clear all the fields in this row. Data for data entered forms is stored in a separate Pulse database, called [PulseDB]_Data (where *PulseDB+ = the customer s pulse database name). The following section defines how that data may be accessed. Note that the reason user entered data is collected in a separate database is to facilitate backups and other data management. Since all data in a primary Pulse database is the result of importing data from other systems, it is not necessary to back up that database daily or even weekly. This is because in the event of a failure of some type, the data in that database is simply regenerated from the source data. However, Pulse databases may be very large and take size appropriate time when being backed up. In most Pulse installations, the user entered database size will be minor when compared to the greater Pulse primary database. Because it this, it may be backed up in minutes or seconds. If the databases were combined, this would not be the case. 89

90 Data Entry Table Queries Data created by the Data Entry page content is stored in a separate database and table from the original pulse database and table. For example assuming that the pulse database is called DistrictPulse, and the original pulse content came from a table called ZZ_TEST_EditTableTest, the data entered table would be stored in the database DistrictPulse_DATA, in a table called ZD_TEST_EditTableTest. To create a summary query access this data, specify in the query, the full database name for the manually entered table. For example: In the above example, the data entry database and table are identified in the From clause: From DistrictPulse_DATA.dbo.ZD_TEST_EditTableTest. Note: Make sure you include the database owner --.dbo. as part of the full database name. 90

91 Other Administrative Functions Link Manager As referenced throughout this manual, Pulse automatically creates a Link Object each time a new display page is defined and saved. These Link Objects may then be incorporated into user display pages to support drilling from one page to another, and for support of menu creation. When a Link Object is created, it is automatically named with the same name as the page to which it is related. At times, it is appropriate to change the name of the Link Object, or to change the page name to which that Link is related. The Pulse Link Manager may be selected from the left menu of the administrator s menu. Once selected, the following dialog is displayed. In this dialog a link may be deleted, the display name may be changed and/or the page to which the link is related may be amended. To delete a link, click on the click box for that link associated with the column containing the trash can in this example. To change the link description (the most common use of this screen, make the change directly in the in middle (Link Description (displayed)) column and then save the changes. To change the page to which the link is associated, click on the pull-down in the right column, and select the new linked page. Multiple changes of any type may be made in a single session. Once all changes are made, click the Save Changes button. To abandon a session, click the Cancel button. In very rare situations, it may be necessary to add a link manually. As outlined previously, Pulse generates a page link automatically when a new page is created. However, in some cases a link may have been deleted or for some reason it may need be added manually. To add a new link manually, key in the link name and link description on the top blank line as displayed in the example above. Then select the page to be linked to from the pull-down on the right. Click the add button on the left and save the additions. 91

92 Announcements Pulse supports the display of announcements at the time of user login. To define user displayed announcements, click on the Announcements option as show in the example on the right. The following dialog is then displayed. Any number of Announcements may be entered. When entering an announcement, make sure the Active clickbox is clicked to on, select a priority (the priority only determines the background color of the displayed announcement), enter the announcement, enter the date range for the annuncement and then click the Save button. At login the Announcements are displayed as shown in the following example. 92
93 System Setup Selecting System Setup option on Administration Menu will open the System Settings dialog The pulse.config path is displayed for reference purposes. 93

94 2. Top Banner Title: This option supports the entry of text to be the banner at the top of all Pulse Pages. In this example, the table settings define the top banner with the following result: 3. Logo: A logo may be uploaded and incorporated into the Pulse menus. In this case, the Tyler Technologies logo has been incorporated into displayed pages. See the example at the right. 4. LDAP: LDAP functionality will authenticate a Pulse user s login credentials against the LDAP server for the organization. Enter the LDAP server name and authentication type. Once configured, a Pulse user account may be associated with an LDAP user account under Account Administration>Account Setup. If a user is configured without an LDAP Account, then Pulse will only atttempt to login through standard Pulse login authentication. 5. SMTP Settings: This option allows each Pulse site to define settings for Pulse Alerts (see that section of this manual). Use this section to define the interal server to be used for Pulse outgoing traffic. Prior to entering this informaiton, an address for Pulse should be defined in your system. It is suggested that the be defined as [email protected]. The following data is required: - The host being used by the district. - The port used by your system for outgoing s. - The username of the address established for Pulse - The password of the address established for Pulse. - Indicator if the District system uses SSL for outgoing s. 94
95 6. In a prior release, Pulse established a new data import process that greatly improved the speed of data importing processes. This new process also established defined approaches that are used for importing data. In very rare cases it may be appropriate to use the older importing methods. This click box controls that setting. DO NOT TURN OFF the new importing method unless instructed to do so by Pulse support staff. In a prior release, Pulse established a new summary query execution process that greatly improved the speed of running summary queries. This new process also established defined approaches that are used running summary queries. In very rare cases it may be appropriate to use the older summary query methods. This click box controls that setting. DO NOT TURN OFF the new summary query method unless instructed to do so by Pulse support staff. 7. Pulse can force users to reset their password at a set interval by entering the number of Days in the Force Reset Field. Note that the root user is exempt from this requirement and will not be asked to change their password. Also supported is to have users change passwords using 3 styles as shown in the example below: The options for this list box are: None (default): there is no minimum number of characters required for a password Length: a password must be at least 8 characters long Strong: a password must be at least 8 characters long, and include 3 out of the 4 kinds of characters: Uppercase Letters, Lowercase Letters, Numbers and Symbols. When users change their password (From the top right of all user pages, select My Profile -> Change Password) they will be presented with a Change Password form. This form will display the minimum requirements and indicate that the newly entered password conforms to those requirements as shown in the following example: 95

96 When setting up new users, an administrator has the option to force the user to change their password the first time they log into pulse, by checking Force New Password at Login as shown in the following example: Note that the Account Setup screen allows an administrator to define a password that does NOT conform to the rules for changing passwords. 8. Stats and Logging A Page Load Times menu is provided Root Administration menu as shown in the following example: 96

97 Once turned on, statistics about page load times will be gathered in an interactive table under that link as shown in the following example: When viewing this page, any column can be dragged to the top bar to group on and view summary totals by area: Within each page view instance is a snapshot of content for that page: For pages, the Load Time represents the time when the page starts to build to when the page has completely rendered on the user s browser. 97
98 The Render Time represents the time after the page is built on the web server to the time the page is completely rendered on the user s browser (essentially, the network and browser portion of the Load Time). For content, the Load Time represents the entire time to build that content on the web server; the Bind Time represents the amount of time it takes to get the database records and insert them into the content (always a portion of the Load Time). For root users viewing Pulse pages, a new timer icon to the right of the pencil will link to Page Load Times will at the top of each page as shown below: Pulse Remote Logging If a web server is connected to the internet, then the Pulse Parser will send a message upon completion to the Tyler FTP server, sending the following information: The name of the web server, name of the customer and the current internal IP address of the server The current disk space available on the Pulse SQL server The length of time the parser ran The current version of Pulse Pulse will also send a registration status message to the Tyler Pulse FTP server whenever the Customer record is saved. 98
99 Menus Pulse provides two distinct options that may be used to generate system wide menus, a left menu and a top menu. Either of these menus may be used exclusively or in combination. The Menu section of this manual addresses each of these approaches individually. Pulse Left Menu The Menus administration dialog is used to manage the setup and functionality of the Pulse left menus. Menu items include Pulse page links, comments, and linked pages. "My Downloads" and "My Top Pages" are automatically listed at the bottom of the menu for nonpublic users. Also, multiple menus may be simultaneously supported. For example, a menu may be defined for traditional Pulse users (an internal web site) and a second menu defined for public viewing of Pulse. Different menus may also be defined for general users, administrative users and for root users. By selecting Menu from the administration menu, the Pulse Menus dialog is displayed. Menus may be edited by clicking the button next to the item to be changed. To define a new Menu, click. The following dialog is then displayed. 99

100 The example below shows how a Pulse Left Menu may be used. Menu items may be created in this dialog at any time. In addition, links to selected pages may be incorporated into this dialog by selecting the menu checkbox in Page Setup during the creation of those pages This "Add New" button is only available before selecting the edit icon on an existing menu item. 1. Menu Name: This name may have spaces and/or special characters and is only used for reference under the Menus administration item. Do not change this name without first consulting Pulse support staff. 2. Content Description: As with the menu name, this short description may have spaces and/or special characters, and is only for reference on under the menus area 3. Active Only: Check if this is the active menu 4. Button Selections: Save: Saves changes to the current menu Cancel: Exits the menu without saving changes The display in blue on the left represents the current Menu definition that is being displayed to users. Clicking the icon any item in that display will open that line into the management area on the right. Note that changes to the Left Menu are defined and saved in real time. 100

101 Type: This is the category of menu item, the selectable types are: Header: Breaks up links and comments into sections Text: A comment or announcement Pulse Link: Links to a Page in Pulse Pulse Home Link: Used only once for navigation to the home page Pulse Admin Link: Used once for navigation to the administration menu External Link: Link to a website other than Pulse 6. Order: The relative order in which to display the menu item in relation to all other menu items. 7. Page/URL: The page or URL to which the will be directed when clicking on the menu item. 8. Display Text: The text shown on the menu for the user's view. This is usually in the form of an announcement. 9. New Window: This is primarily used for external links. When clicked, Pulse will open the page/url in a different browser window or tab. 10. Include in Export: Will prevent the item from being included in a Data Transfer. See the Data Transfer section of this manual for additional information. 11. Display for: Restricts the type of user that may see the given menu item. For example, the main menu can include items like "Administration" that general users cannot see. In addition to this level of security, main menu pages restricted for a given user role will continue to not be viewable by those accounts (ie, teachers in schools cannot see nonteacher menu items, even though they may be in the same menu as other user roles). 12. Button Selections: Update: Saves changes to the current menu item Cancel: Exits the menu item without saving changes Deactivate: Deletes the current menu item 101

102 Pulse Top Menu In addition to the left menu, Pulse also provides functionality to support a Top Menu. The Pulse Top Menu is based on pull-down, point-and-click functionality. The example below shows how a completed Top Menu appears to an end user. Groupings of pages are shown across the top of the menu. Each group expands when clicked into a list of pages on that subject. Note that the Top Menu supports the definition of various groups of pages with an unlimited number of selections for each group. Additionally, selections within a group may be defined to include further page selections in the form of a subgroup. In the example above the Term Grades subgroup provides access to pages associated with Term Grades while the Transcript Grades subgroup provides access to pages associated with Transcript Grades. There is no feasible limit to the number of groups or pages that may be defined. The left most section of the Top Menu is always defaulted to the Home Page of the user that is logged in. To define additional sections for the Top Menu, navigate to Administration. In the Page Configuration section, select Top Menu. Initially, the following dialog will be displayed. 102
![To add a new page or section the menu click [ADD NEW] to add a new item. The cursor will move into the display name, and New Item will be highlighted in green as shown in the following example.](/docs-images/27/11296862/images/103-0.png "In the form, add a name for the item to be added and then select a page to which that item will be linked in the Link To: pull down selection.")
103 To add a new page or section the menu click [ADD NEW] to add a new item. The cursor will move into the display name, and New Item will be highlighted in green as shown in the following example. In the form, add a name for the item to be added and then select a page to which that item will be linked in the Link To: pull down selection. All available pages are displayed in this section in alphabetical order. Once the entry is complete, click either the Save Item button or the Save button. The Save Item button saves the item but does not update the page working list displayed beneath the form. The Save button saves the item and simultaneously updates the page list. To edit and or delete a menu item, click on the menu item name, then edit or click delete, then click the top Save to save any changes. Clicking the Cancel button terminates the dialog that is in the process of being entered. At the right is an example of the Top Menu section, Enrollment, and several pages that have been defined to be included as page selections within that group. To add sub-items to the selectable items, click on the SUB option and follow the same instructions above. To add new items to the list, click on the ADD NEW selection and follow the instructions above. Any text may be used to describe a page to be included in the selection list. 103


104 Any number of selection options may be entered. When building a Top Menu, a Top Page and History selection is automatically added by Pulse the first time the Top Menu is saved. The Top Page selection will display the ten most common pages used by the user that is logged in. They are displayed in order from the most used to least used. This function allows a user to quickly navigate to their favorite/most used pages. The History selection group is a list of the last ten pages that a user has visited since signing on. This option allows the user to quickly navigate to a recently used page. The following is an example of the Top Pages and History dialogs: Included with Top Menu is the ability to dynamically hide or display the Left Menu. See the < icon in the diagram below. Click the icon once to hide the left menu and again to redisplay it. This option allows the left menu to be hidden, and its space reclaimed, for the display of large tables or for user preference. Control of the display of the Top Menu and Left Menu minimize icon is controlled in the Pulse web.config application settings. Make the appropriate True and False additions to the web.config to control this functionality. See the example of these settings below. <appsettings> <add key="use_top_menu" value="false" /> <add key="toggle_left_menu" value="false" /> 104

105 Favorites Menu Pulse provides users with the ability to dynamically define and manage a Favorites tab as a part of the top menu. Each user can may interactively mark pages as Favorites. To mark a page as a favorite, when on that page, on the top menu simply click Favorites -> *Add Current Page+ as shown in the following example. Once added, that page will stay on the top menu for that user for each new Pulse session. A favorite selection may be removed by going to the favorite page then selecting [Remove Current Page]. At an individual Pulse site, it may be appropriate to block certain pages from being used as Favorites (for instance pages that need to be accessed via a link filter). To prevent a particular page from being added to a user s favorites list, on the Edit Display Pages form select Hide from Top Page Lists : 105
106 Data Transfers *** Data Transfer can only be completed between the same Pulse versions. Example: A transfer created in version 112 cannot be imported to an instance running on version 113. Pulse provides support for the exporting and importing of projects, manual tables and pages via the Data Transfers dialog. This dialog is used when moving a defined Project from one Pulse instance/database to another, or, when changes have been made to a Pulse project/page in one Pulse instance, and those changes are being transferred to another Pulse instance. For example, when Pulse Standard Models are modified/enhanced by Pulse staff, the project(s) representing that model may be transferred to various users using this procedure. By selecting the Data Transfers menu item on the Administrator Menu, the Data Transfers selection dialog is displayed. To import an exported Data Transfer, select the Import button. Then browse for the file location and select the transfer, and select Import on the new display. Only transfers exported in the same release version of Pulse may be imported. This import will overwrite any existing content definitions and will add the new information contained in the transfer project as applicable. The following is an example of the selection object is displayed after the Import button is selected: Note the options to include Help and Menus (both left and top) in the import in this example. It is uncommon to load Menus during an import. Menus are the defined left menu information in the Pulse instance. Since this is normally unique at each Pulse installed site, load it only if it is know it is needed in the loading process. 106

107 Transfer definitions may be edited by selecting the button next to the project. To define a new Data Transfer, Click on. The following dialog is displayed. 1. Name: This name will be used to display the transfer. 2. Description: Enter a short description of the transfer. The description is used for documentation purposes only. 3. Auto-generate pages used in the projects: Without this option, only the incoming data setup and summary query information will be transferred. Click this option to include all pages that reference the summary query and imported data used in the associated data projects. It is uncommon not to select this option. 4. Include Manual Tables: check this option if manual tables are to be included in the transfer. When this is the case, click on the Manual table to be included in the Manual Tables object displayed in the dialog. 5. Button Selections: Save: Save the current transfer Delete: Delete the current transfer (does not delete the projects or pages) Export: Exports the current transfer for import in another instance of Pulse Cancel: Exits the transfer without saving changes 107

108 Add to Transfer Area: When creating or updating a data transfer, search for the new project or page using the Add to Transfer search box. To add the project or page, select the checkbox for the item and click select the checkbox next to the item and select.. To delete the project or page, 7. Projects: This is a list of the selected projects. These projects include all Incoming Files, Summary Query Groups and all other objects that are defined in the project(s). 8. Pages: This is a list of selected pages. Pages associated with projects are automatically included when projects are added. Additional pages ages included through the Add to Transfer Area. 9. Manual Tables: Selected Manual Tables to be included in the project export. When selecting, the transfer will automatically process and create an export file. A save file dialog window will open to save the text file. Select the desired disk location and save the file. Pulse will read through the entire project and page information and include ALL of the content and pages that use the summary queries and imported data in the project(s). It is not uncommon that a user page will use information from multiple projects (such as combining assessment data from an assessment project with student demographic data from a student project). In this case, a page may be a part of multiple projects and, therefore, exported or imported each time a project in which it is a member is processed. Top menus are also included in Pulse project transfers (PTML Files). To import or import a Top Menu click the Top Menu option in the Import Data Transfer dialog as shown in the following example. 108

109 External Processes The External Processes feature is used to run batch files or other scripts (such as.bat or.cmd files). They may be manually executed directly from the External Processes page, or they may be added to a Data Project as described in the previous section. However, to run this function from a web browser, the user must have assigned security rights to run the program and to modify data in any folder used by the program. External Processes may be edited by selecting the button next to the name. To define a new Process, click. The following dialog is displayed Name: Enter the process name. 2. Desc: Enter a process description; this is for documentation purposes only. 3. Filepath: Enter the directory location of the file. 4. Arguments: Enter additional command line program options (optional). 5. Success Value: Error reporting/checking options. Available options are displayed in the example above. When used in a project, the Success Value may be used to determine subsequent processing steps. 6. Use this option if the External Process is to start a process but to not wait for its completion. This is useful if you want to configure a button to run the parser on a particular data project in the background while continuing to work in pulse. Note: If you create an external process to run the parser, do not place this external process in a project that gets run nightly, else you may end up creating an endless 109
110 loop (the parser would call an external process which calls the parser, over and over again, until the system runs out of memory). Note: The Do not wait option simply attempts to start an external process but does not check to see whether the process completed successfully. Such processes should be tested on systems to make sure that the pulse web server has the proper security to start the program specified in the Filepath. 110

111 Export Pulse Data The Export Pulse Data feature allows data to be exported from pulse tables to a local file. Data may be optionally sent as an attached file via to one or more recipients. An export may be run manually, directly from the definition page or added to a Data Project as an automated step. External Processes may be edited by selecting the button next to the name. To define a new Process, click. The following screen is displayed Filename: Enter the name of the export file to be created. Do not use spaces or most special characters. 2. Desc: Enter the filename description; this is for documentation purposes only. 3. Table: Select the source Pulse table from the drop-downlist from which the export data will be created. 4. Export Style: Choose one of three possible formats. These are either comma, tab or pipe delimited files. 5. Text Qualifier: Optionally enter one or more characters to surround text fields in an export. 6. Row Newline: Optionally check to include a newline field at the end of each data row. 111

112 7. Row Pre-Text: Enter text to precede each row. 8. Row Post-Text: Enter text to follow each row. 9. Export: Check to export this field, leave blank to skip this field in the export. 10. Ord: Assign the numerical order in which fields are exported, starting with Type: Data from the field may be reformatted to one of the following data types: Text Field, Integer, Date/Time, Decimal and Money. 12. Pre: Enter text to precede the specific field. 13. Field Name: The name of the field from the source table. 14. Post: Enter text to end of the specific field. 15. Trim: Check to optionally remove leading and trailing spaces from the field. 16. Export File to Path: Check to export the file to a file location. Note: If the Export Data step is run via a web browser, then the web server application will need write permissions to the specified directory. 17. Export Path: Enter the location where the file is to be exported. Two click boxes allow the addition of a time stamp or database name to the file name that is created. 18. Send File as an Attachment: Check to send file as an attachment. 19. Sender: Enter the address to appear in the To: line of the Recipients (Indv): Enter one or more addresses separated by commas. 21. Recipients (Group): Select a group of addresses defined by the group setting under Administration > Alert Groups. 22. Subject: Enter text to appear in the subject line of the
113 23. Body: Enter text to appear in the body of the . A series of may also be used, they include ExportName, ExportDescription, FileName, SystemDateTime, SystemDate and SystemTime. Once added, an Export Data File may be added to a Data Project for automated scheduling. 113

114 Table Indexes The Table Indexes selection on the Administrator Menu displays a dialog to manage indexes for Pulse tables. Adding indexes to Pulse tables will only have a measurable effect on tables that employ runtime filters and most notably those with a very large number of records (hundreds of thousands of records or more). This is because to display a page, Pulse generates the pull-down data for filtering from the data populating the tables. When there are a large number of records in the table being displayed (can be in the tens of millions of records) this is an onerous activity. However, when these large tables are indexed by the fields used to populate these pull downs, this task can be completed very quickly, even for very large files. The key goal is that when the table being displayed is large, create indexes on each of the fields being used as a pull-down selection. All table indexes may be searched for and accessed from this page. Also note that Table Indexes may be accessed directly from the Pulse Summary Query and Pulse Page Content dialogs. To access Table Indexes from the Page Content dialog click on the Table Indexes button as shown in the following example. 114
. Indexes may be created when the data type for the field is not Varchar(MAX).")
115 To access Table Indexes from the Summary Query dialog click on the Table Indexes button as shown in the following example. Check the Indexed box to the right of a field, and then click Save to store an index for the desired field(s). Indexes may be created when the data type for the field is not Varchar(MAX). The field may be changed from Varchar (MAX) to another field type on the Pulse Summary Query dialog. For instructions to perform that task please see the Summary Query section of this manual. Click Build Indexes to create the index data in realtime in the Pulse database for the specific table. Indexes are then automatically updated during the parser execution for the associated summary query or incoming data file. 115
116 Direct Page Access The current Pulse release level is displayed at the bottom right of each Pulse. Also displayed is the Page Name of the page that is currently being displayed. When communicating with Pulse Support staff, the Page Name should be noted in any communication that requests support or development action on a specific page. This allows the Pulse Support Staff to directly access the page being discussed. Additionally, two added functions are provided for users with administrative or root level security only. 1. To directly access a Pulse page without following menu links, enter the name of that page in the page name field, SC0269 in this example. Then click the Go button. Pulse will navigate the user directly to the page selected. 2. When administrative and root users view Pulse content, a pencil icon is displayed beneath each object on a page. Clicking this icon will drill the user to the Page Content definition for the selected object. At that time, updates to Pulse logic can be made. In some cases, an administrative user may wish to hide the update icon. This may be the case during a training session. Since end users will not see that option/icon, hiding its display will render pages in the same format that those users will view those pages. To hide the icon, click on the highlighted Hide option. To re-display the icons, simply click on the option a second time. 116

117 Pulse User Activity Tracking Pulse incorporates a tracking process that logs the date, time and page that each user accesses as Pulse Page. This log is helpful when tracking where a user was at time a problem was reported, or more likely, simply management tracking of user activity. This data is being logged to the files PULSE_OUTBOUND_CONTROL_ACCESS_LOG and PULSE_OUTBOUND_CONTROL in the Pulse database. These are quite detailed files, when accessing these logs, please first contact Pulse support staff. To assist key administrative users in accessing and using this data, Pulse incorporates a Pulse Page that is designed to analyze and report on this data on a day to day basis. This project may be accessed in only one way, by entering SC9999 into the page field and then clicking the Go button. End users may not directly access pages using this method, so this access is provided only to administrative users. When selected, the example below shows the information that is displayed to detail end user activity. This data shows the total pages (life to date) accessed by a user and each page accessed by date. When the same page is accessed multiple times on the same date, the count of those accesses is displayed in the Access Count column. So, using this function, administrators can review end user usage statistics on an as-needed basis. 117
118 Three filters are provided to assist in reviewing end user usage data. Access Date This option shows page usage for only a selected date. Page Name This option shows end user usage for only a selected Pulse page. User name This option shows page usage for a selected user. 118

119 Pulse Customer Registration Pulse may be configured so that each customer must be provided with a Tyler-provided customer key. Customer Keys are be provided by Tyler Pulse support. To enter a customer key, go to Administration -> Customer Setup, then select an existing customer, then press Go as shown in the following example: You will see the following form, with a place to enter the new customer key: If you enter in a random or invalid key, then press save, an error message will be displayed. Entering the correct key provides the following message: 119

120 Import Note: the customer key is directly configured from the Customer Name and the expiration date of the license. If the Customer Name is changed, then a previously valid Customer Key will become invalid, and a new Customer Key will be required, through Tyler Pulse Support. Within 30 days of an expiring key, all users going to the Pulse login page will see a message: After the expiration date, users will see the following message: A root user will still be able to log in and will be brought directly to the customer registration page: 120
121 This version of software does not enforce that a correct customer key be entered, but you can test how a future version of Pulse will behave once we turn on the enforcement, by adding the following web.config application key customer_key_on with a value of true : If this web.config value is defined, then when a root user logs in to a customer with a missing or invalid customer key, they will be immediately brought to the Customer Setup form and will not be able to go anywhere else inside Pulse until a correct key is entered. If a user attempts to log into Pulse where an invalid or missing customer key has been defined, they will see the following message: 121
122 Security Management Pulse provides several options to support the control of data distributed to and viewed by end users. Generally, the levels of security that are provided include: Traditional Role Based Security. Users may be associated with one or more user roles (for example a user may be both Principal and Teacher). Additionally, each Pulse data page may be assigned to one or more user roles. For Inclusive Roles, users will only be allowed to view Pages that share at least one role with the roles assigned to that user. For Exclusive Roles, all pages will be viewable except those marked. Multiple Level Securities. Each user is assigned to be either a root, administrative or general user. Root users are developers that have no security restrictions. Administrative users are given extended functions, such as the ability to manage security settings, but are not provided all development options. End users are allowed only to view pages and data to which they have been given access. Field Level Security. Pulse makes extensive use of field level security (data filtering). Any number of fields may be used to control user access to data, such as school or department number. Data displayed on pages is filtered to allow an end user to view only the data that they are allowed to view. Prior to setting up end user security, it is first necessary to define the organizations that will be using the instance of Pulse that is being used. An organization may be a school district, a city, a county or any other type of Pulse client. Note that any number of organizations may simultaneously use a single instance of Pulse in either an ASP (cloud) or shared server environment. Therefore, in some instances, multiple organizations are defined, however, in the vast majority of implementations, there is a single organization. Note that in almost all cases, Pulse support staff will have already defined all organizations for each Pulse customer. Once the organization is defined, various user roles are defined, fields for field level security are defined and end users are defined and then associated with those roles and filters. This manual will address each of the steps to define security in Pulse. 122
123 Defining Districts / Organizations The first step in setting up security is to define the school district or customer using Pulse. From the Administrative Home page (see example at left), click on the Customer Setup option under Root Administration. The Customer Setup selection is displayed as in the following example. If a new customer is to be defined, click on NEW CUSTOMER. If an existing Customer is to be changed, click on the name of that customer. Then click the Go button. The Customer Setup dialog is now displayed. Enter the Customer Number, Customer Name and the Database Abbreviation for that Customer. This abbreviation will be used as a database prefix for all data tables created for that customer. For example, if a city and a school district are sharing a single Pulse Instance/Server, the City may use City while the school district uses SD as their abbreviation. Note that only developers will view these abbreviations. End users will not need to be aware of the abbreviations selected. An option to allowing end users to view and utilize the ALL option when filtering for data on Pulse Pages is also provided. All Pulse Models designed and provided by Tyler are designed to restrict the use of this option for end users. Based on this, it is recommended that the ALL option not be activated for end users. However, for Pulse implementations not using the Tyler provided standard models, it may be appropriate to allow users access to this option. 123

124 Role Setup From the Administrative Menu, Select Role Setup from the Account Administration section. The Role Setup Launch dialog is now displayed as shown in the following example. To define a new role, select NEW ROLE. To maintain an existing role, select that role from the displayed list. On the Role Setup dialog, define the Role Name and Description and Save the entry. There is no detail or controls to define with roles, simply the role itself. The actual use of the role will be defined as a part of the User and Page security records as discussed in the following sections. Any number of roles may be defined. Inclusive roles will restrict a user's access to only pages that have the role checked, while exclusive roles will allow access to all pages except those checked. User Filters User Filters are essentially field level security settings. A user filter is defined for each data field that will be used to secure data delivery to end users. There are two steps to define User Filters, the first is mandatory to use the filter and the second is optional. 1. Define the Filter Name. Enter a name for the filter and click the Add New button. An example of a filter could be either a department or school. If an end user is to be restricted to viewing financial information for only one department, or viewing student data for only one school, this is the first step to defining that restriction. In this example we have named these field restrictions Department and SchoolNbr. When defining an end user s security record, it is then possible to note the various schools or departments to which they have access. 124

125 2. Optionally, a data table containing descriptions for the filters may also be defined. For example, if a user is restricted to specific schools based on school numbers, and the end user is allowed to view multiple schools, it is convenient to allow that user to select the school to view from a pull-down list box instead of keying in the school number or name. In this case a set of possible school names with the related school number is the result of a Pulse Query (see previous sections of this manual for instructions on developing Pulse Queries). By designating that query, Pulse will dynamically populate the selection pull-down list box with the schools available to each user rather than forcing the user to manually enter a school number. The query selected must contain both the data associated with the data to be secured (school number) and the text data to be included in the list box (school name). In this way the user may select ABC High School from the list box, but Pulse will then perform the filter on the underlying field (school number 1234 ). a. Select the query name in the pull-down selection box; in this case the name of the query is ZZ_TEST_FilterList. b. Select the field from the query that contains the data in the field used as the filter (field for field level security). c. Select the field from the query that contains the name to be displayed. The query used in this example is displayed following the User Filter example below: Make sure to click the button to the right of the filter name to activate online selection option for the filter. If not clicked, security will still be performed but the user will not have the opportunity to change their selection. 125

126 In the following example, a query shows how to relate school numbers to school names for use as a user filter. This example assumes the data is filtered by school number, and the user will select the school name from a pull-down to select that school s data. Users are automatically restricted to the data (schools) that they can view by Pulse security. Because of this, the complete list of schools is generated by the query and the user sees only their approved list at run time. User Setup To define a new user, select the Account Setup option from the Administration Menu. Once selected, the Account Setup Launch dialog will be displayed as shown in the example on the right. Using this access page, a new user may be defined or an existing user can be located and updated. Importing user records from other systems is also supported. This option will be explained in a following section of this chapter. Initially, we will explain setting up new users. To perform this function, click on the Add New button. 126

127 The Account Setup dialog is now displayed as shown in the example below. This panel is used to define a user and that user s security. User Definition Instructions Enter the username, First Name, Last Name and Password for this user. If site uses Active Directory or LDAP, enter the Active Directory Username or the LDAP Account in the appropriate space. This will allow Pulse to synchronize logins with those systems to support a single logon approach. Start Page Select the start page for this user. The start page is the first page that will be displayed after user login, generally this user s home page. The pull-down provided for this entry lists all pages that are displayed on the Main Menu of Pulse. An end user may change their start page (Home Page) at any time after initially logging in to Pulse. User Type Most users will be defined as traditional users, however some users may be Admin or root users. An Admin or root user has access to all Pulse pages, regardless of role assignments so security settings generally do not apply to either of these user types. A root may also interactively switch between customers/districts when using Pulse. All security definitions are applied to end users. Generally, as a rule of thumb, root users are developers, Administration users are users with ability to update and enter security for other users as well as to control general administrative functions. All other users are users. User Declarations If the user being defined is allowed to select multiple areas that are protected by field level security or filtering, click the Allow Custom Filtering click box. This will display a pull-down at run time showing the options they have available. As in the example in the previous section of this manual, if a user has access to multiple schools, this will allow them to select that school via a pull-down menu. DO NOT click this selection if the user has access to only one selection (in this example school). Pulse, for some SIS Systems such as SISk12 and Zangle, supports a process that imports the user s password and login information from that external system. The password in the SIS Application is automatically synchronized with Pulse. If this user is NOT to be synchronized in this manner, then click the Do Not Sync Account click box. 127
128 User Roles All previously defined user roles will be displayed. Select the appropriate user roles for the user being entered. Any number of roles may be selected for a single user. Pulse Display Pages contain the same role selection process. At runtime, any user designated as a User User Type may view only Pages appropriate for their user role(s). Since a user as well as a page may have several roles, the user may only view a Page if one of their roles matches a valid role for the Page being displayed. See User Roles section for more detail. User Filters Pulse incorporates an advanced filtering capability that will display to users only the data that they have been cleared (via security settings) to view. For example, assuming a user may view a specific screen, the data for that screen may be actively filtered based on their clearance. For example, a principal may be limited to viewing only students in their school and a teacher limited to viewing only students that they teach. See the previous section of this manual for a more detailed explanation of filtering and field level security. The security page will display each of the filtering options that have been previously defined. If a filter is to be applied to a user in any of these categories, enter the filtering data in the appropriate field. For example, if the user will only be able to view data for school number 0201, then enter 0201 in that field. If a user has access to ALL schools, then leave the user filter field blank. Multiple filters may be entered for a single user (as in the example where a user may access detail data at two or three different schools) by entering each of the school numbers separated by a colon. In some advanced cases, if it is desired that data be displayed from multiple schools at the same time, rather than one school at a time, enter the schools separated by a semi-colon. This feature is not used in standard models provided by Tyler so it should be used only when specifically designed into the Pulse models being utilized. Default User Filters As in the case above, when a user has access to multiple schools, enter the school that is be defaulted at login. The user will see that data after first logging in and may subsequently choose other schools after viewing that school. Force New Password at Login Pulse can force users to reset their password at a set interval by entering the number of Days in the Force Reset Field. Note that the root user is exempt from this requirement and will not be asked to change their password. Note that the Account Setup screen allows an administrator to define a password that does NOT conform to the rules for changing passwords. 128

129 Page Level Roles - Once roles have been defined and applied to end user security records, they may then be associated with specific display pages that are used by those users. Each time that a new page is created, as well as when updating existing pages, all of the roles are displayed as a part of the page definition transaction. The following example shows how the roles are displayed. The roles are displayed immediately after the page content (objects) that are selected for that page: For each page that is defined, select (by clicking) the user roles that will be allowed to use this page. In the example above, there are two roles that may be selected; however, there is no limit to the number of roles that may be defined. All end users will be blocked from using this page except for those with at least one of the roles selected on the page also selected on their security record. Users that log in with root or administrative access levels are not restricted by role based security. They may view and use all pages regardless of role based restrictions. Only those users with user levels of security are restricted via role definitions. Special Note - If a user is defined with no role definitions, then they are able to access any page, regardless of the role restrictions on that page. If a user is defined with specific roles, then they are able to access only pages that specifically allow that role. If a page is defined with role restrictions, then a user with role restrictions will not be able to access that page. Generally, Pulse Models that are provided by Tyler are designed to use only one role, teachers. So, when defining a new user, assign the role Teacher to teachers and no roles at all to other users. All security in these models is generated based on field level security, not role security. 129

130 Page Roles Mass Updates Pulse allows Page Roles to be established directly on the page definition dialog (previous section) or in mass using the Page Roles option on the Administrative Main Menu. Using this function, a user may assign page roles from a list of defined pages. When the Page Roles dialog is displayed, a user may first search for and locate the selected pages that are to be changed. In this example, all pages containing the literal MAP. Once the pages are displayed, click the appropriate rolls for each page, or click the click box at the top of each column to assign all pages to that roll. Click the clear button on the left of each line to unclick all rolls for a selected page. Click the Save button to save the role setup. Click the Cancel button to leave the page without committing changes. Roles ending in (I) are inclusive roles; roles ending in (E) are exclusive roles. (A user assigned an inclusive role can only see pages also assigned to that inclusive role; a user assigned to an exclusive role can see all pages except those assigned to that exclusive role). 130
131 Using Filter By Security and Functions As discussed in previous sections of this chapter, Pulse provides a unique Filter by technology (field level security) to control end user access to data. In addition to providing a security function, this functionality may also be used to significantly reduce development work. This is because a single page may be defined for use by users with variable sets of access security. For example, a page showing detailed school information can dynamically display that information for only the school or schools to which a user has access. Therefore, instead of developing multiple pages for multiple user sets, a single page may be designed to support any number of user types. As further clarification, using the Filter by function, a page and page content (tables and graphs) may be developed to be used by any number of users with the same role definitions. For example, a page that is simultaneously used by multiple principals or teachers may be defined. The data tables that are displayed on a page for these users may then be developed to show all of the students in a school district with little or no thought to the user that will be using that page. The output of data to that page, however, may then be filtered based on the user that is logged-in and viewing the data. For example, even though a table being displayed may include all of the students in a school, a teacher will be able to see only those students that they teach and a principal viewing the same page sees only the students enrolled in their school. Filtering may be performed on any data field in the data table that is being displayed. The specific field being used for the filtering may or may not be displayed to the user on the page; however, it must be a part of the underlying table populating the display. For example, the data from a table may be filtered on the teacher number; however, it is not necessary that the teacher number be displayed in the table when presented to the end user. In the following examples we provide a simple example to show how to set up a single screen that will be used by multiple teachers. In this example, we want each teacher to view only the students that they teach. To perform this task, some type of teacher identification must be a part of the table being displayed. In this case, it will be the TeacherID number. Remember, the TeacherID number field containing the teacher s ID Number must be entered on the security record for that teacher. 131
132 Step 1 Building the Display Table In the following example, the data output from a summary query that been designed to display all of the students in a school district is displayed. In this example, we have hidden the names of the teachers and students. Note specifically the first two rows on the left. In these rows we list the school number and teacher number. Using these fields, we will now see how we can filter this table to determine the appropriate display data for teachers and/or principals. Filter by definitions are defined on the Page Content definition page. The page content allows a developer to define how a user will view data from a data table. In this example, this is the page content definition for the data table displayed above. Note that some portions of the page content table that are not significant to this subject are not displayed for simplicity. Note on line 2, Teacher Number, the click box for Filtering is clicked. Further, the filtering is being set as a user defined type and the TeacherID is being used for the filter process. 132
 it may then be assigned to a user.")
133 Setup Performed Prior to this Process The TeacherID user filter was previously defined as in the example below. This function is described in a previous section of this chapter. Once a filter is defined (see above) it may then be assigned to a user. In the example below, the user Marie Gonzalez has been defined as a teacher and assigned access to only teacher id

134 The final result is displayed below. When this page is accessed by a teacher, this teacher will only see his/her students. In other words, the teacher will see only those rows from the data table that contains their teacher id number as indicated by the red arrow. In this example, the teacher identification number is displayed as a part of the table data. This is not necessary. The filter by used to control access to the data must be a part of the table being displayed; however, it is not necessary that it be a displayed column. 134
135 Importing Users and Passwords *** It is extremely important that blank fields be incorporated for ALL optional filters as well as the defaults. For example, if there are 4 types of user filters, 8 fields for filters should be in the import (4 filters + 4 defaults). Failing to do so will add an "End Line" entry to the last filter line. In many implementations, it is appropriate to import user records from external systems. This is usually the case when the number of users is large, such as for thousands of teachers in a large school district. To support this function, Pulse provides an option to import user records from a comma delimited file generated from an external system. The file containing user credentials to be imported must be a comma delimited file with the following format: Username, lastname, firstname, password (not encrypted), [optional filter1], [filter1 default], [optional filter2], [filter2default]... The user name is the logon username that will be entered by the user at login. The lastname and firstname fields are maintaining the user s actual name in Pulse. The password is the password that will be used by the user at login and the optional filters are those defined filters to control field level security within Pulse. Usually these are defined as school numbers, teacher id numbers, departments or other types of data viewing qualifications. The optional filters should be in the same order as they are defined in the Pulse security system as shown in the following example: See the user filter definitions at the right as defined in Pulse. The incoming data should be in this same order. username, lastname, firstname, password (not encrypted), [SchoolID Value],[SchoolID Default],[TeacherID Value],[TeacherID Default],[Tier Value],[Tier Default] If no filters are being loaded, such as for the Tier filter in the example above, blank columns must be submitted so that Pulse is aware that those entries are blank. This is the case for fields imbedded in the data stream as well as for fields at the end of the data stream. As an example, the import file could look like this: bsmith,smith,bob,321pulse,12345,12345,,,tier1,tier1 jjohnson,johnson,joe,654pulse,1234,1234,123456,123456,tier1,tier1 135
136 To run the import, go to the "Account Setup" option on the Administrator s Menu and select the Account Setup option. The following is displayed. Click on the Import button. The following dialog will be displayed: This page is used to define additional default options for the import process as well as to initiate that process. The username, First Name, Last Name Account Password and Verify Password fields are displayed; however, they are disabled and should be left blank. 1. Make any necessary group selections such as Start page or User Type Note that this process is designed to import large groups of similar users in a single loading process. If multiple user groups, teachers and administrators, are to be imported, separate import runs should be processed for each group. 2. Select the Import button and open the file to be imported The User Filters section is shown in this example, but not used for the import definition. User Filtering is imported from the incoming file as described above. Pulse will automatically encrypt the password at the time of loading; therefore it must be unencrypted in the incoming file. Pulse does support the encrypting of passwords for some specific student systems. See the appendix of this manual for an explanation of this support. 136
137 Backup & Security Menu Pulse allows the security and left menu settings to be exported to an external file. Once exported, this file may also be imported. It is a common practice to export the current security settings to a file prior to importing new users. This provides a backup in the event that inappropriate data is imported. To use this option, key in the path and file name to place or load the file and click on the appropriate function. For example, C:/backup files/pulse security backup.txt. 137
138 Managing Global (Root) Access and Passwords Pulse allows the system Root administrator user to change the default password by clicking on the My Profile link in the upper right corner of each Pulse page. This is the same procedure used to change any password. It is recommended that the root password be changed immediately after each new installation. This is especially the case for Pulse servers that are available on the internet outside a school district s firewall. Be sure to make note of the password change. All passwords stored in Pulse are encrypted and cannot be determined manually after they have been set. There are times when a changed password is not available or has been forgotten. In these situations, Pulse supports, at the SQL Server Manager Studio interface, a procedure to reset the root password back to the original installed password. To reset the password, at the SQL server, open up Manager Studio, expand the Pulse database. Then expand the Programmability folder and then the Stored Procedures folder as shown in this example: Then right mouse click on dbo.resetrootpassword, and then select Execute Stored Procedure : 138


139 A pop-up window will be displayed, click OK to run the script. After clicking OK, a new script appears, with the message Query executed successfully as in the following example: 139

140 LDAP Integration As noted previously in this section, Pulse supports the LDAP (Lightweight Directory Access Protocol) user account in conjunction with a pulse user. Previous content in this chapter shows the end user aspect of this function, this section explains its setup and provides more detail on its use. When LDAP is in use, as defined on the user s security setup, at login Pulse will attempt to authenticate a user s password on the configured LDAP server. If this authentication fails, Pulse will render the Pulse login page and use integrated Pulse user authentication. To configure LDAP authentication, enter the LDAP server information in the System Setup dialog on the Pulse Admin menu. Note below the section on LDAP from that dialog: On a given user s account, enter the LDAP account: On the login page, if a user with an LDAP Account logs in, Pulse will pass the associated LDAP account and user-entered password to the LDAP server. If the LDAP server successfully authenticates this user, then the pulse home page will open. If LDAP authentication fails Pulse will attempt to use the standard pulse account for authentication. If that also fails, the user will be given a standard login failure message. If a user is defined in Pulse without an LDAP Account, then Pulse will only attempt to login through the standard Pulse login authentication. 140
141 To help diagnose LDAP account logins, additional level 2 logging messages will be written to the pulse log file and pulse log database. On LDAP failures, log messages will appear as shown in this example: On LDAP successfully authenticated logins, log messages will appear as follows: 141
142 User Synchronization Pulse supports standard user account synchronization. New customers wanting to synchronize data will have a specification for standard file imports that can be read by the pulse parser to automatically add and maintain users in the Pulse database Summary In order to standardize and simplify requirements for synchronizing users from other systems into Pulse, Tyler has designed a specification for a standard set of Pulse tables that, if populated either directly via a file import, or indirectly through Pulse Summary Queries, can be used to automatically maintain Pulse user security access rights. This specification contains simplified data layouts designed to support all of Pulse s security capabilities. Setup Requirements To setup up Pulse security synchronization, you should be familiar with how to create a Pulse import, Pulse summary queries, and Pulse data projects. Pulse security synchronization requires Pulse version or greater. Data requirements This section describes a series of pulse standard name table layouts (see the Synchronization Tables section) required for synchronizing user names and user attributes into Pulse from other sources. Customers can chose one of two methods to integrate security records into Pulse: Method 1: Direct Imports Customers can design comma or tab delimited files containing all of the data specified in the synchronization tables below, and directly import that data to the specified table names. This import can then be added to a regularly scheduled Pulse project and synchronization can be included in nightly or weekly Parser runs. Method 2: Indirect Imports with Pulse Summary Queries Customers can design comma or tab delimited files or use Remote SQL queries to obtain all the necessary data, though not in the precisely required format. This data, once imported into Pulse, can be further reformed using Pulse Summary Queries into the final specified layouts. 142
143 Synchronization Tables This section described the required table layouts and names to be used for either file imports or pulse summary queries. Table names use standard pulse naming requirements. In the examples below, we show a file name in the format of zz_test_*tablename+. Pulse automatically supplies the prefix zz + the prefix of the customer abbreviation (in our example belows, we re using a site with a customer abbreviation called test ). zz_test_pulsesecurity_users (required) This table contains 1 record per user to be synchronized into Pulse. UserID,FirstName,LastName,Encyrpted Password,ActiveDirectoryName,LDAPName,UserType, ,StartPage,AllowCustomFilte ring,defaultmenu 123,Ed,Weston,emweston,password,emwestonAD,emwestonLdap,U,[email protected],SC 018,N,Default Field Name UserID FirstName LastName Password ActiveDirectoryName LDAPName Notes Pulse User ID unique Required Required Leave blank if Active Directory or LDAP. If Pulse login, this needs to be encrypted via SQL encryption function supplied by Pulse Active Directory User Name (do not include auth server as part of the name) Full LDAP user name required if LDAP is used, otherwise blank UserType If blank, will default to U (user). Other choices: A = Admin, R = Root. Any other Letter will reset back to User. StartPage AllowCustomFiltering DefaultMenu The shortcut code to the startpage. If the page does not exist, then no start page will be initially specified. If blank default to N. Valid values Y, Yes, N, No If blank use Pulse default menu. If a menu name is specified that has not been pre-defined in Pulse, then that user will be assigned the Default menu instead. zz_test_pulsesecurity_filters (optional) This table contains one record per User ID / Filter Name / Filter Value. UserID,FilterName,FilterValue 123,SchoolID, ,SchoolID, ,SchoolID, ,SchoolID,ASD Field Name Notes UserID FilterName FilterValue Table Notes: FilterNames must be defined in Pulse, or they will be ignored when loading. zz_test_pulsesecurity_roles (optional) This table contains one record per User ID / Role (a user can be assigned to multiple roles). UserID,Role 143
144 123,Teacher Field Name Notes UserID Role Table Notes: Roles must be defined in Pulse, or they will be ignored when loading. zz_test_pulsesecurity_additional_top_menus (optional) This table contains one record per User ID / Additional TopMenu (a user can have access to multiple top menus; the default top menu needs to be assigned in the zz_test_pulsesecurity_users table. UserID,AdditionalTopMenu 123, New Menu 1 123, New Menu 2 Field Name Notes UserID AdditionalTopMenu Name of the additional non-default menu Table Notes: Top Menus need to be-pre-defined in Pulse, or they will be ignored when loading zz_test_pulsesecurity_filterdefaults (optional) UserId,FilterName,FilterDefault 123,SchoolID,100 Field Name UserID FilterName FilterDefault Notes Name of filter Default value to be used every time a user logs into Pulse Configuration manual table This manual table should be configured on sites using synchronization. If this table is not found (or specific values are not present) default settings will be used. zm_test_pulsesecurity_settings SettingName,SettingValue1, SettingValue2 Field Name Notes SettingName Name of a setting used by the synchronization process SettingValue1 Valid value associated with the Setting Name SettingValue2 Optional second value associated with the Setting Name Notes: This table contains valid settings and associated values that will be used by the synchronization process. In the first version of the synchronization process we ve defined 2 valid settings: SettingName Setting notes SettingValue1 valid values SettingValue1 value notes Settin values 144
145 DefaultFilterSeparator FilterNone PasswordEncryptionType If this setting name is not specified, then Pulse will use a colon ( : ) as the default separator between multiple filters when synchronizing users. Can occur multiple times (with different SettingValue1 values). Used to specify a filter: filter value combination that gives a user access to all records for that filter. Default is No, password is assumed to be unencrypted. : Each filter value should be separated by a colon, which is treated as an OR when building the user filter lists. ; Each filter value should be separated by a semi-colon, which is treated as an AND when building user [Name of a valid User Filter] N or No or None PulseExternalEncryption filter lists. Password is not encyrpted Password is encrypted via SQL function supplied by Pulse. Leave [Filte if fou off fi access record General notes: all fields in all tables need to be defined as a varchar(max), and all table fields should be present (whether or not data is blank or null). If any field is missing, or is not defined, then the synchronization process will stop and log and error without loading any records. Synchronization process notes: For new users, all fields will be added; for existing users, all fields will on the main security record will be updated; all roles, top menus and user filters will be dropped, and then re-created based on new synchronization values, unless Do not Sync is checked. If Do not Sync is checked, then only the password, if not blank, will be updated. 145
: ${p_load_pulse_users} Add this SQL Script to a project so that it gets executed after the necessary tables are")
146 Synchronizing Users To load users, run all the imports and/or summary queries to create the required Pulse tables as noted above. Then create a SQL Script called Load Pulse Users, with one line (case sensitive): ${p_load_pulse_users} Add this SQL Script to a project so that it gets executed after the necessary tables are created. When this script runs, it will read the required tables and manual tables and synchronize the users in those tables. 146

147 Pulse Alert Definition and Management In general, Pulses allows any user or designated individual to be alerted via an any time when any data managed by Pulse changes in any prescribed way. This is a very strong function that can assure that all individuals are aware of any data derived situation without the need to log into Pulse. For example, a principal may be notified each morning with a list of students that were absent on the prior day that also had twenty or more YTD absences. Any type of management data may be communicated in this way. Alerts may be generated once per day, as a part of the nightly parser process, once per week, on selected days or many times per day based on the needs of each specific alert. Alerts are managed from the Administration Menu. There are three components of Alert Management. These are: 1. Defining Alert Groups. An alert group is a collection of individuals and their s to which a single Alert will be directed. This could be Principals, all Management Staff at a school, all District Management Staff or any other group of related individuals. 2. Alert Setup The definition of an Alert, the data to be sent, to whom it is to be sent and the conditions of the Alert generation. 3. Alert Logs Pulse maintains a log of each alert generated. Defining Alert Groups An Alert Group is a collection of individuals and their s to which a single Alert will be directed. This could be Principals, all Management Staff at a school, all District Management Staff or any other group of related individuals. Any number of recipients may be included in an Alert Group. Alert Groups may be set up in one of two different procedures. The addresses may be manually keyed in or the addresses may be acquired from the user s Pulse security record. In the example to the right, we have selected the Custom Receipt Type from that pull-down selection. This approach allows the addresses to be manually keyed into the that alert group. Each group must have a name, a group type and a Recip Type. Enter the appropriate data in click the save button. Alert groups may also be deleted by their selection and the clicking of the Delete button. 147
148 When the Pulse User Group Receipt Type is selected Pulse will provide a pull-down selection. This selection is being generated from previously entered user data in the Pulse Security System. Each time a user is selected, a new pull-down option is provided. As many users as desired may be selected. The address used for these users will be the address stored in their security user record. 148

149 Defining Alerts An Alert is composed a query to obtain the data to be sent, how the data is to be sent, to whom it is to be sent, the details of the message to be sent, the time and day it is to be sent and the number of times it is to be sent. The following dialog shows a defined and working alert for clarification purposes Once an Alert has been named, there are nine key steps to complete the definition. These steps are defined as follows: 1. Alert Type: Currently, all alerts are alerts; however, in future releases will expand this list. Once selecting the alert type, either: a. Enter an Individual to receive the alert. Multiple addresses may be separated by commas. b. Select a previously defined group to receive the alert. c. The alert recipients may be determined from the data acquired in step 2 below. The address to be used may be a part of the data itself. If this is the case, select the field in containing the address. 2. Alert Query Generation: As outlined throughout this manual, Pulse is built to use the Microsoft SQL language for data selection and manipulation. The first step in the Alert Definition process is to write a SQL query to acquire the data that will be used in the alert. Using this query ANY type of data and/or data condition may be tested to generate the data for the Alert. Note that complex queries may be written outside of 149
150 the alert process and the results of those queries included in the alert as a very simple SQL statement. 3. Alert Message Information: The next step is to define the message controls for the alert. a. First, enter the address from which the alert message will originate. This address must have been previously defined in the organization system for Pulse use. b. Insert the Subject Line that will be used in the resulting Define the Message: Using this process the data resulting from the query defined in item 1 above may be integrated with surrounding text supplied in this step. For Example, if the query contains a student name and the number of times a student has been absent in the fields StudentName and AbsentCount, they may be integrated with text in the following way. Dear Parent, your child, [StudentName], has been absent [AbsentCount] times this year. Dear Parent, your child, John Doe, has been absent 22 times this year. Additionally, this process allows the definition of how many s will be sent from the source data. For example, if the source data generates a list of ten students, should ten separate s be generated or a single containing a list of the ten students? If ten s are desired, no special notations in the definition are necessary, if one with all ten students detailed is desired, a Command Function is provided for this process. For example, if the query contains ten rows of data and ten s are desired, the following may be entered: [StudentName] has a total of [AbsentCount] absences. If one is desired, the query generated data may be inserted inside of a start and end function as shown below: The following is a list of students with their absence counts: #RECORD_START Student Name [StudentName], [AbsentCount] absences. #RECORD_END# Note that the functions must be entered in capital letters. 150
151 Several inserted variables may also be inserted into the message. These variables are as follows: *SystemDateTime* will insert the date and time the is sent into the . *SystemDate* will insert the date that the is sent into the . *SystemTime* will insert the time that the is sent into the Define the Alert Run Rules: The next step is to define when the Alert is to be processed. Note these steps as follows: a. Define the Run Interval. How often is the query that generates data to be run. To decide on the interval consider how often the data being read by the query is updated. If it is updated daily, it makes little sense to acquire new data more often that daily since it would be the same data each time it was acquired on each day. If the data is acquired hourly, then hourly may be the best option. b. Determine what days of the week and the time on those days that the query is to be run. For example, click each day for each day of the week, but if the data is desired only on Friday, then only select Friday. c. Select the date and time for the alert process to begin. Use the date format 3/12/2010 and the time format 8:00 AM. 6. Define the Sending Rules: This step is to determine how many times a day the alert will be sent. Selecting no limits means that the Alert will be sent each time new data is acquired as detailed in the previous paragraph. When further limits are to be used, enter the number of alerts limit and then select the duration from the pull-down box. 151
152 Defining Alerts with Incorporated Pulse Filtering As an added feature of sending alerts, alerts sent to Pulse users may be filtered to apply the same security settings to distributions as that used in online Pulse pages. For example, a single Pulse Alert may be defined that contains information about students in several schools. Assuming the user s security record incorporated school restrictions as filters (the user may only view one or more schools, but not all schools) then the data may be filtered based on that definition. The result is that the received by each user will contain only the data for students enrolled in schools that they can view. So, generating one physical alert is parsed into several alerts to various recipients. This approach greatly reduced the amount of time needed to define customized alerts. Defining an alert with security filters is the same process as described in the section above, with two variations. When selecting Recipients, the recipient type MUST be a Pulse User Group as shown in the following example: To apply one or more filters to the data being ed a unique Where statement is added to the Alert Query. As shown in the following example, the where statement must test one or more of the Available User Filters (shown in the previous example) and include the data field enclosed in asterisks. In the following example, the field being tested in this where statement must be present in the source data file. In the above example, when the alert is processed, the SchoolNbr filter from the security record for each member of the Principals group will automatically be applied to the data they receive. 152

153 Adding Alerts to Projects Pulse supports two methods to send alerts. The method is described in the preceding section discusses how Alerts may be generated based on Time (Days, hours, minutes, etc.). Pulse also allows alerts to be generated as a part of the nightly Pulse process. This is actually the more common way to generate Pulse Alerts. To add an alert to an existing project, on the Project Definition/Maintenance page select Item Type Alerts, and then click Search, then select the alert or alerts to add to your project: Note that nightly Alerts will be run by the Pulse Parser during the nightly process. It is not necessary to install the Pulse Alert Service to run an alert in this manner. The Pulse Alert services will need to be installed only if Time based alerts are being used. You can also add an Alert, but disable its use temporarily, by unchecking the Active checkbox on the Alert definition: When an alert is included in a Pulse Project the resulting display will appear as follows: 153

154 Alert Logs Pulse maintains a log of all alerts generated for management control. Alert logs may be viewed between any two dates, for specific recipients or for the Alert type. The page size selection determines how many log entries are listed on each page. To view the Message, Recipients or Notes on the Alert, hover your mouse over those descriptions and the entirety of that section will be displayed in a popup as in the following example: 154

155 Pulse End User Operation End user operation of Pulse is designed around a Home Page. Generally, the Home Page will be unique to each end user or operational group of users. It is designed to communicate the pulse of that user s operational and management responsibilities. Access to additional information is provided via two primary approaches. First, incorporated into the Home Page are links to other supporting pages that provide more detail on the subject matter associated with that link. In addition, Pulse provides users with access to subject matter specific Projects. These are sometimes referred to as Models. A Project/Model is a collection of web pages, charts, graphs and other displayed objects that provide detail on a particular subject. For example, a Project may be designed for Attendance. An Attendance Project will have its own Home Page summarizing Attendance information. Additional detail is provided via links to other pages. For example, other pages may include Attendance activity by school, by gender, by ethnicity and so on. So, in summary, Pulse delivers general management information to end users via a Home Page and its associated links. Subject specific management information, for example Attendance, is delivered to end users via Projects and those project s Home Pages and associated linked pages. The following example shows a diagram of an Annual Yearly Progress (AYP) Project for Attendance. 155

156 Pulse General Page Content This section provides a general overview of Pulse content. Following sections build on these summary descriptions with much more detail. Pulse pages are made up of several different types of objects. Some of these objects are displayed in the same way on each Pulse page. These objects are generally provided for overall navigation and control purposes. Other objects change on each page. These objects, generally referred to as Page Content are designed to communicate information about the district, school, student or other focus point of the page being viewed. The following example shows a Pulse Home Page (defined below) that contains each of the object types used by Pulse. The sections of this page are described as follows: 1. Header. The header of all pages will be the same. It contains indications of the filter (secured) areas of the data that the user is viewing. In this case, the user is viewing student data from Edwards Middle School, financial data from Department Main High School and human resource data from Organization Wide. At the far right of the header are buttons to change the filter views, to change the user profile and to log out of Pulse. Usage of filtering will be described in a following section. The My Profile button is used primarily to change your password. Click on the button and the following dialog displays. Use this dialog to change your password at any time. 156

157 Left Menu. The left menu is provided as a method of navigation (Navigation is described in detail in a following section) and a dashboard/communications area. Several links will be available that will drill the user to specific Pulse menus on the specified subjects, such as for Attendance or Grade data. In addition to links to specific data areas the left menu may also include Announcements, links to other systems or other types of site determined information. Also on the left menu are two pull down areas, Most Visited Pages and My Downloads. These will be described in a following section. 2. Top Menu. The Top Menu is provided as a navigation method. Hovering over a section of the menu will show individual Pulse pages that, when clicked, will navigate a user to the selected page. The Top Menu is described in detail in a following section. 3. Page Content. Each Pulse page is made up of various types of objects referred to as Page Content. The types of contents provided are: i. Links. Most pages incorporate hyper-links to other Pulse Pages that are commonly accessed from the page being viewed. ii. Table Objects. Table Objects contain data organized for viewing iii. Graphs. Several types of graphs are provided. iv. Text Objects. On many pages different types of text objects will be used to provide instructions or describe the data being displayed v. Data Entry Objects. In some cases, data may be entered directly into Pulse. vi. Data Grids. Data grids allow interactive generation of data views via drag and drop processes. Usage of these objects is described in a following section. 157
158 Navigation Pulse provides several different ways to navigate between data pages. A summary of these methods include: 1. Left Menu. The Left Menu provides click and drill access to various Pulse Menus as well as to high value pages. 2. Top Menu. The Top Menu provides the same access as the Left Menu, but does so with a pull down type of technology. Added features are provided in the top menu such as a crumb trail and managing each user s favorite pages. 3. Hyper-link. This allows a user to click on a Text Entry or an element of the data being displayed to move to another page. In Pulse, hyper-links are used to: a. Create Menus of similar pages (such as all Attendance Data Pages). b. To drill to a page that is commonly used in conjunction to the page being viewed. c. To drill to more detail on the data item that is clicked. For example, to drill to attendance detail by clicking on a student name. 4. Browser Navigation. This method uses standard features in most browsers to navigate between pages. Each of these methods is described in more detail in the following section. 158

159 Left Menu The Left Menu primarily provides quick links to menus throughout Pulse. A shown in the example on the right, clicking on the Discipline link will drill the user to the main menu for Discipline. Pulse also uses a Home Page concept. Usually, at the top of the left menu will be a group of home pages. Each user will have a primary home page assigned to them by the site Security Administrator. That will be the landing page for that user at the time of login. In the examples in this document, the home page is the Student Menu. However, the user may navigate to other home pages by clicking on that displayed page link at the top of the Left Menu. A home page will show a summary of the data associated with its subject. A user may change their home page at any time. When not on their active home page, a button will appear in the top left banner of the page labeled Set Home. Clicking on this button will change the user s home page to the CURRENT page being viewed by that user. Hiding the Left Menu When the monitor being used is does not seem to be wide enough to display of the data that Pulse provides, it is sometimes desired to hide the left menu. When this is the case, click the icon at the upper right of that menu, the menu will then be hidden. Redisplay the menu is the same manner. 159

160 Top Menu The Top Menu (we spent many hours coming up with this description for this menu) provides a similar function as the left menu (this menu was also very hard to name). Hovering over each selection will display the optional selections for that selection. Clicking on the page displayed will drill the user to that page. NOTE clicking on the menu item, such as Enrollment, will drill the user to the main menu for that area. Be sure to hover over the item to open the pull down and click on it to select it. There may be several Top Menus available to a specific user. For example, a user may have access to both student and financial data. There will be a top menu for both of these areas. The Top Menu displayed at log in is determined by the site security administrator. However, a user may switch to any other Top Menu assigned to them at any time. As shown in the following example, hover over the Home selection of the menu. Pulse will provide a pull down showing all of the Top Menus that the user is authorized to use. Then clicking on the selected menu will change the display to that menu. Top Menu Functions. The top menu provides two key functions that assist in navigating pages. These are the History and Favorites tabs. The favorites tab allows a user to build a list of favorite pages that they wish to go to regularly. By adding them to this area, the user may navigate to that page directly and skip the various menus and supporting pages that may have been necessary to access that page in the standard Pulse Design. To add a page to your favorites, click on the Add Current Page button in the Favorites tab when on the page you wish to add. That page will immediately be added to the list. To remove a page, when on that page, this pull down will display a Remove Current Page option. 160
161 The History tab displays a list of the last ten pages (in order) that a user has visited in their current Pulse session. If you would like to navigate back to the last page used, or the page used five pages before that, simply click on that page and Pulse will navigate to that page. Hyper-Link Navigation Pulse provides extensive Hyper-linking throughout most pages. These hyper-links generally fall into two categories. Those provided to directly move the initial state of another Pulse page (generally used in menus) and those used to drill to additional data on the selected link. Each of these is described below: Menu and Page Links The following is an example of the top section of a Pulse Menu. Note that clicking on any entry will drill the user to a page for that entry. Note that on the page at the right, the user may then click on the Enrollment Analysis link at the top of the page to drill back to the Main Menu for that area, in this case Enrollment. 161

162 Hyper- Links Hyper-links may also be used as drilling links. On some Pulse pages, data will be highlighted in blue indicating that that data display is hyper-linked. Clicking on that data will drill the user to more information on that selection. The following is an example from the Student Home Page. Note that the entry indicating that there are two discipline events in this school in the last five days is highlighted in blue indicating that it is hyper-linked. Clicking on that entry drills the user to more information on that subject, in this case, a list of those two students. Note above on the second page several of the data items on that page are also hyper-linked. A user may move throughout Pulse by clicking on the various hyper-links. Browser Navigation Pulse is designed as a stateless web application. As such, the forward and backward browser buttons may be used to navigate. If you wish to return to the previous page, click the back button. If you wish to go back three pages, click it three times. To return forward one page, click the forward button. Note that some browsers, such as Windows Internet Explorer, may restrict this usage via browser settings. 162

163 Pulse Table Filters Pulse provides the ability for users to filter the data that is being viewed. This function suppports data evaluation on an interactive basis. For example, when viewing a list of students, a user may decide that they only want to view 8 th grade students, or only 8 th Grade Female students. This function provides that capabilty. The following example shows a Pulse table content including associated filters. This example is for a page designed for extensive filtering. Not all pages provide this number of filters. 163

164 So, as described in the example above, filtering for 8 th Grade Females would appear as follows: There are several types of filtering supported. These include List, Like, Equal and None and each may have several sub-options. Note the following examples. List Filter - NOTE IN 99% plus of all filtering the List Filter should be the filter selection used. If in doubt, use the List Filter. Select the list filter from the pull-down for the area to be filtered. In this case, grade level. The select the grade level to the right of that selection as shown in this example. When this is done, Pulse will dynamically read the data and place ONLY the options present in the data into the filter selection pull-down. So, in this case, the middle school sees only their grade levels. Select the grade level desired and then CLICK the filter button to evoke the display. Optionally click the Clear button to clear all filters to make new selections. Filters may also be cleared manually. 164

165 Equal Filter At times a user may want to use the = filter. Once selecting the = filter, enter the exact data to be filtered, in this case, grade 08. When using = filters note that there must be an exact match in the entry. Entering an 8 instead of an 08 would render no matches in the resulting search. Like Filter At times a user may want to use the Like filter. Once selecting the Like filter, enter a part of the data to be searched for. For example, if searching for students with a drop out end status, one may want to enter the word drop into the data area. Pulse will search that column and locate all End Statuses with the word drop in the description. Another use might be to find all of the students named Mark. Note that this is not a sounds like function. The letters d-r-o-p must be present in the data in that sequence to be located. Note that any number of filters may be entered in combination when filtering. However, if no data is present with the combination of filters entered, a blank page will be displayed. Numeric Searches Note that the examples above are for text based filtering. When the data column being searched is numeric, several other options are provided. As shown in this example, searches may be performed on various algebraic functions. In this example, we are asking to see all discipline events that have more than 3 Action Days associated with them. 165

166 Data Table Functions Below each data table and m any graphs is a series of clickable functions. See the example below. Clicking on each of these functions generates a specific type of dialog which is further described below this example: This icon allows the data in the table to be exported to Excel. When it is clicked, an Excel dialog is displayed as shown in the following example: A user may convert the data directly into Excel by clicking the Convert button. Note that Pulse does not directly generate a native Excel spreadsheet. Most organizational networks will block these types of files as a security risk, however, a comma or tab delimited file is normally allowed. The file defaults to a comma delimited file, but a tab delimited file may be selected. The Include Headers option is set by default. If only data without field headers is desired, click this option. 166

167 Pulse does not immediately open the excel file. The file is saved to a Pulse staging area (see more detail on this below). However, a message is displayed indicating this action. If the file is to be immediately used, click the click here hyper-link in the message. The file will be opened in Excel. Note that there may be various network or site generated messages during the download. These are not related to Pulse. If there are problems with the download, it is likely a site security issue. Please consult with your site Pulse support staff if this occurs. Once the file is downloaded to Excel, it is displayed in the exact format of the table from which it was generated: NOTE that if a Pulse table has been filtered prior to the download, the downloaded file will respect the filters. Only the displayed data, after the filtering, will be downloaded. 167

168 Additionally, Pulse will save the files that are downloaded for approximately two weeks. Once downloaded, a user may view the files that they have downloaded to Excel in the My Downloads dialog at the bottom of the left menu. Using this method, a user may open a file that was downloaded on a previous date. These saved files are in the exact format as at the time of the download. They are not updated with more current data that may be available since that date. So, this is a convenient way to acquire data from a prior date. PDF Generation. A PDF file may be directly generated from the Pulse object display. Click on this icon to open the PDF generation dialog shown below. This dialog provides many options for the generation of the PDF, however, in almost all cases it is best to use the default selections. Clicking the Convert button will generate the PDF file as shown in the following example: 168
 As shown in the following example, use the Print function in your browser to print the resulting display. Pulse User Help. On many pages, a user help icon will be present.")
169 Print Preview. Clicking this icon will generate a Browser based print preview for printing. (Note that a PDF is also considered a printable file.) As shown in the following example, use the Print function in your browser to print the resulting display. Pulse User Help. On many pages, a user help icon will be present. Click this icon to see any help that has been provided with that displayed object. An example of help is shown in the following example: 169

170 Ordering / Sorting Data When viewing Pulse data in a table, the data will be initially displayed in a Pulse determined order. If desired, that order may be interactively changed by the user. In the left example below, employee data is displayed in alphabetical order. As indicated in the circled area, each column is displayed with an up and down pointer. Clicking on the heading will change the order of the displayed data. Clicking on the heading once will sort the column in ascending order, clicking on it a second time will change the order to a descending order. In this example, the data is initially displayed in alphabetical order and is then changed to age order by clicking on the Employee Age heading. 170

171 Security Settings Most users will be assigned to view only data from a specific school or department. However, district staff and other users may have access to multiple schools or departments. When this is the case, a default department is assigned to the user when their access rights were established by the site security administrator. When these users initially log into Pulse, that school, department, etc. will be initially displayed, However, the user may easily change that setting to view other schools or departments. Note again, most users will not have this capability. This section is for those users with this privilege. To change the area being viewed, either click on that area in the heading, for example click on the Edwards MS in the heading in the example below, or click on the Filters button at the top right of the heading. The following dialog is displayed. To change to another area (for example a different school), use the pull-down to find and click on that school and then click the Save button at the bottom of the dialog. The screen will be immediately changed to that school. Note that Pulse pages (in the case of schools but all areas are similar) are designed to display data for a specific school or for the district as a whole. The page formats may vary slightly when displaying school or district data. Some pages are designed only for school viewing. In this case, do not be surprised to get a blank page when this is the case. The security approach used by Pulse is to show all statistical data to all users. In other words, if a principal sees that they have 95.5% average attendance, this statistic means more if they can allow see the average attendance for all of the other schools. However, when viewing individual student data, only students in that principal s school are available for viewing. 171
. The following example on the left is the login dialog.")
172 User Login While most users using this manual will already be experts at logging in, there are some login issues to be aware of. A login, a user will be asked for their usercode and password (see below if the site is an Active Directory or LDAP site). The following example on the left is the login dialog. Enter your username and password, and click the Login button to login to Pulse. In some cases, a user may have access to multiple Pulse databases, usually delineated by school year. See the example on the right below. The most used (or most recent) database will always appear at the top of the list, however, if desired another option may be selected at the time of login. Only one Pulse database may be viewed at a time. Once the login is successful, the user will be presented with his/her appropriate Pulse Home page. Pulse security optionally supports both LDAP and Active Directory. If these security options are being used and the user has logged into active directory or LDAP via a network login prior to starting Pulse, the login page will be bypassed. Pulse will use the active directory or LDAP login that has previously been established. 172
173 Appendix I Server Management Once implemented, Pulse requires very little maintenance for daily operation, however, some basic support is appropriate to make sure all of the Pulse components are working properly and that the server is properly functioning. Generally, maintenance activities are broken down into monthly, weekly and those sets appropriate to load new releases. As an overview, this process entails: Loading Pulse Engine Releases - Back up the Pulse Database - Loading the Pulse Executables - Loading the Pulse Parser - Optionally Loading Pulse Alerts Loading Pulse Model Releases - Loading Projects Via Data Project Transfer The steps to perform each of these processes are detailed below. New Releases Overview and Loading Instructions Pulse is made up of two distinct executables. These Pulse components are the Pulse Engine made up of all Pulse executables and Pulse Models that are developed for end users. Pulse Models are developed using the Pulse Engine. In most Pulse implementations, Tyler also provides standard models for the management of student, assessment, finance or other types of data. Based on this, when a new release of Pulse is made available, both the Pulse Engine and the Pulse Models are updated. New Pulse releases are distributed on a periodic basis. These releases are sent directly to each Pulse user site via or FTP distribution or a combination of these methods. It is a customer responsibility to load new releases after the training to perform this activity has been provided by Tyler staff. Pulse support staff will assist any customer with the loading of new releases when requested to do so. Please note that the instructions in this section are targeted for the Pulse technical user that has been trained in this process. They may or may not be helpful to a user not previously trained to load new releases. This section will review the loading of both of the Pulse Engine and new Model releases. Releases are reasonably simple to load and implement. 173

174 Pulse Engine Releases and Loading Each new Pulse release is distributed in the form of an update executable file. The process for implementing these updates is simple and fast. Note that new releases may be loaded at any time; it is not necessarily that all users be logged out. However, at the beginning of the load all users will be logged out automatically by the load process. Based on this, it is appropriate that users be notified or the loading be accomplished during off-hours. Step 1 Backup the Pulse Database Standard practices are that the Pulse database should be backed up prior to loading a new release. The Pulse database contains both the Pulse system tables as well as all data files supporting developed models. There is any number of ways to create a Pulse backup. In general, a Pulse backup is simply backing up the Pulse database. Many sites will have automatic backups scheduled so a manual backup or secondary backup before loading the new release is not needed. This section will provide a brief step by step process for performing a manual backup using Microsoft SQL Server Management Studio. Once opening Microsoft SQL Server Management Studio, locate the database that is to be backed up. In this case, the database name is StandardModelPulse. See the example below: 174

175 Once the database has been located, right click on the database name and select >Tasks then select >Backup. See the example below: The following dialog box is then displayed. Note that a backup location will usually be initially displayed in the destination box near the bottom. If this location and backup name are correct, simply click on the OK button to perform the backup. If not, or a new backup name and/or location is desired, click on Remove to remove the name displayed and then on the ADD button to add a new backup location or name. 175

176 A Select Backup Destination dialog box will then be displayed as in the example below. To select a new location, click on the button on the center right of the display. Navigate to the folder to be used for the backup, in this case C:\dbs\backups\ and then enter the name desired for the backup file, in this case, EnterBackupName.bak. Be sure to use the bak file type. Then click >OK, >OK and >OK again to begin the backup. During the backup the following dialog will be displayed. When the backup is complete, you will be notified. 176

177 The next step is to load the new Pulse Engine release. Copy the release files provided to the Pulse web server for your organization. On that server, unzip the release file that has been distributed. You will find the following files in that file: Loading the Online Pulse System - The first file to load is the Pulse Engine release, in this example, the bottom file, release Double click on the file to begin the load process. Step 1. The following operational process is displayed. After reviewing the release information, click on the Next button. Step 2. The following screen is displayed. Specify the location of the Pulse executable files and click on the Next button. Most Pulse implementations use the C drive for the storage of the Pulse programs. The location may be easily determined by the location of the Pulse directory on that server. Step 3. Pulse will now load the new release. Normally, new releases will load in only a couple of minutes. Users that were logged in at the time of the new release load will be required to re-log in to Pulse after the release is loaded. 177

178 Loading the Pulse Parser - The Pulse Parser is the application that runs each night to update the Pulse database. It is loaded in a similar way as Pulse. Click on the Pulse Parser file, in this case, the release for the Pulse Parser is The only difference in the installation of the Pulse Parser and the Pulse Executable is that the installer for the pulse parser allows you to specify the disk drive to install the parser on. When you first run the parser installer, you ll be prompted for a disk location. The default location is the C drive of the server. Only specify a disk drive when entering the Destination folder. In the above example, the destination folder c:\ will place the parser in c:\pulseparser (and the command line version in c:\pulseparsercl), which is the typical installation scenario. Do not specify a destination folder of c:\pulseparser; if you do, then the parser will be created in c:\pulseparser\pulseparser\ To install the pulse parser on a different disk drive, only enter in the drive letter, for example Destination folder: e:\. 178
179 Loading the Pulse Alert Service The Pulse Alert service may or may not need to be loaded at your site. If automated and scheduled alerts are being distributed by Pulse to end users, then this executable WILL need to be loaded. If alerts are not being used, then skip this section. The Pulse Alert functionality runs as a Windows service on the Pulse Server. Because of this, the first step in loading the new release is to stop that service so that the new service may be loaded. Use standard Windows functionality (Task Manager) to stop the Pulse Alert Service as shown in the example below: As with loading the Pulse Engine and the Pulse Parser, the next step is to double click on the file Pulse Alert Service_XXXX. In this case the release level is The following warning will be displayed, click the NEXT button to continue. 179

180 The Select Installation Folder dialog will then be displayed as shown in the example below. The default installation location is the C drive of the Pulse web server. While this is the cast in the vast number of Pulse implementations, if it is not, navigate to the location that the service is to be installed. Then Click the NEXT button to continue. The process will complete and a dialog notification will be displayed when the load is finished. The loading of the new Pulse release is now complete; however, the next section reviews the Pulse Alerts Configuration File and should be reviewed the first time Pulse Alerts is activated. 180
181 Pulse Model Update Releases As outlined above, Pulse Models are provided by Tyler to load and analyze data from various application areas such as student, financial, assessments, etc. Model updates may contain multiple models in a single update file, or multiple update files for multiple models. The process for loading each file is the same. A model update file is always a.ptml file type and will be labeled in a format such as Student_Model_update_ ptml. The load process of new model updates may be performed from any workstation that can log into the Pulse System, including the Pulse web server. Before beginning the load process, place the update.ptml file in any desired folder on the PC being used to perform the update. NOTE, once a new release is loaded many some components may not be activated until the night parser process is completed. So, we suggest a load be performed late in the day or in the evening so users are not impacted by the load process. Loading New Model Updates Log into Pulse and navigate to the Pulse Administration page. As shown in the example below, click on the Data Transfers menu item: 181
182 The Data Transfers Dialog will now be displayed as shown in the example below. Note that in the initial display, two options are provided. First, the option to export models ( A Plus, Adds and Updates, All Grades are displayed in this example) to a file to be sent to other locations for subsequent loading of those models into that system. In this case, we will be importing files so click on the Import button. The Import Data Transfer Dialog will be displayed as shown in the example below. Click on the BROWSE button and navigate to the folder where the update file was previously saved. Click on the ptml file to be loaded and then click the OK button. The file to be loaded will be displayed in the File Location field. In the case below we will be loading the file All_Standard_Models _1104.ptml. Click on the Import button and the file will be imported. The speed of the import will depend on the speed of the computer being used and the speed of the network connections between that computer and the DB server housing Pulse. For small loads it may be as short as 10 seconds, for large loads it could take as long as minutes. NOTE, to load a new model release the Pulse engine MUST be at the same release level as the ptml file being loaded. If this is not the case, a notification will display explaining the error. You will be notified when the load is complete. NOTE, once a new release is loaded portions of it may not be activated until a night parser process is completed. So, we suggest a load be performed late in the day or in the evening so users are not impacted by the load process. The day after the load, spot check Pulse pages and notify Pulse support if any issues are apparent or if you have questions. 182

183 Summary Query Duration Tracking Pulse creates and stores log messages that contain the total runtime in seconds for each summary query. To obtain this information, you may create a summary query for the pulse log that filters these values, looking for EL_CATEGORY fields that start with Summary Query Runtime, for example: 183
184 Pulse Event Log Pulse logs key processing events to an event log. This event log is written to a disk file and may be viewed there as a test file, or that log may be viewed from within Pulse. This Pulse database table can be used to write queries, exports and alerts. To access the data from the log table, you ll first need to set up a new summary query that queries the table as shown in the following example. This summary query makes a copy of the internal pulse event log (which is not directly accessible by page content or by the new data export feature). From this new summary query table, additional queries, views, exports and alerts may optionally be developed. The table has 4 fields: EL_ROW_ID: A sequential count of log records; the highest number represents the latest log message. EL_LOGTIME: The date/time of the event EL_CATEGORY: The type of message EL_MSG: The actual message Logging is enabled for the web server via two settings in the <appsettings> </appsettings> section of the web server web.config file: 184

185 Logging is enabled for the parser via one setting in the <configuration> </configuration> section of the file c:\pulseparser\pulse.config : The key pulse_dblog_level can be set to the following levels: 1: Log only errors or critical events 2: Log errors, critical events, and project details (we recommend you set the value to level 2) 3: Verbose logging (not recommended except for support purposes). Changing Pulse Parser Default Settings Pulse defaults to the use of the server C: drive when determining the location of incoming files. In some implementations, it is appropriate to use another disk drive to store the incoming files and their folders. This may be the case for either security or disk availability reasons. When this is the case, the Pulse Parser.exe.config file and the Pulse web.config file must be modified to note this new file location. To configure pulse to use a different disk drive for importing data, you will first need to update the web.config file. Open/edit the web.config file and then add the highlighted entries in the following example into the appsettings section of that file. In this case, the new location for the incoming files will be the D: drive. Make the appropriate updates if another disk drive is to be used. Cut and Paste: <add key="filepathtranslateoriginal" value="c:\development" /> <add key="filepathtranslatenew" value="e:\development" /> <add key="filepathtranslateappendtofront" value="" /> 185

186 Additionally, the Pulse Parser pulseparser.exe.config will need to be modified. Open those file and then add the following highlighted values in the PulseParser.Properties.Settings section. Additionally, in the same section, configure pulse logging using the pulse_dblog_level and pulse_dblog_path. Cut and Paste: </value> </setting> <setting name="filepathtranslateoriginal" serializeas="string"> <value>c:\development</value> </setting> <setting name="filepathtranslatenew" serializeas="string"> <value>e:\development</value> </setting> <setting name="filepathtranslateappendtofront" serializeas="string"> <value /> </setting> <setting name="truncatemode" serializeas="string"> <value>on</value> </setting> <setting name="pulse_dblog_level" serializeas="string"> <value>2</value> </setting> <setting name="pulse_dblog_path" serializeas="string"> <value>e:\pulselogs</value> </setting> If the pulseparser.exe.config file does not exist, a sample file called PulseParser.exe.config.sample.txt may be modified and saved as the PulseParser.exe.config file. 186

187 Managing the Pulse Alerts Configuration File When the installation is complete it may be appropriate to review the Pulse Alerts Configuration file. This file is located in the folder c:\program Files\Pulse\PulseAlerts\. In this folder, determine if the file PulseAlertService.exe.config.txt is present. If so, open that file for exiting. If not, open/edit the supplied sample file, PulseAlertService.exe.config.sample.txt. Once updated, this file will be saved as PulseAlertService.exe.config.txt. In this file, add the connection string to connect to the Pulse database. This is the same data required for the pulsesettings.txt file. Update the highlighted portion of the file as highlighted in the following example: After editing the connection string, for example: <string>connection_string=data SOURCE=PULSE_SERVER;INITIAL CATALOG=PulseDB;uid=pulse;pwd=ab39skfd</string> Save this file as PulseAlertService.exe.config. Non-Flash Bar and Line Charts Management Pulse supports graphic displays using Adobe Flash or an ipad-compatible non-flash graphical plug in. Horizontal, vertical and line charts are supported using both methods. By default, flashbased charts are displayed. The ipad compatible charts may be enabled by adding the following web.config setting in the <appsettings> section: <add key="flashcharts" value="off" /> 187

188 Alternate web.config settings As an alternate to the pulse configuration file (c:\pulsesettings.txt), database connections can be stored in the web.config file for a server. This function provides the ability to connect to simultaneously manage up to 10 pulse databases. The connection string for the default startup database is named PulseDB. The names PulseDB2 through PulseDB10 can be used for alternate connections; these will show up in the Databases drop down list box on the login page just as they show when these connection strings are defined in pulsesettings.txt. This approach provides a more secure method of maintaining connection strings. See the following example: Web Config Update for Microsoft Changes Microsoft released an automated patch in late December/2011 that may cause errors when a user attempts to save page content. (This will not affect normal pulse usage; it only causes an error when saving changes to page content on a system). Typically, the error you ll see say after attempting to save page content appears like this: Operation is not valid due to the current state of the object. To work around the error, add a new key in the web.config: Add a new key in the appsettings: <add key="aspnet:maxhttpcollectionkeys" value="10000"> For example: 188
189 ASP/Cloud web.config Settings When a processing center is supporting multiple school districts from a single server, the web config is set up to specifically support multiple URLs and databases. The IIS settings should be defined to support an application path for each customer supported on a specific server. This way, each customer will use a different URL to access Pulse, and will not see the other customers that are also supported from that server. The following is an example of a web config that is inserted into the C:\inetpub\wwwrootAYP directory. Note that the Pulse_dblog_level and Pulse_dblog_path key lines should be deleted from the web.config file in C:\pulse\pulseapp\pulseapp. The location path should match the IIS application path. <?xml version="1.0" encoding="utf-8"?> <configuration> <location path="detroitpulse" inheritinchildapplications="true"> <connectionstrings> <add name="pulsedb" connectionstring="data Source=(local);Initial Catalog=DetroitPulse;user id=pulse;password = 321pulse;" /> Catalog=DetroitPulse1112;user id=pulse;password = 321pulse;" /> </connectionstrings> <appsettings> <add key="pulse_dblog_level" value="2" /> <add key="pulse_dblog_path" value="c:\pulselogs\detroit" /> </appsettings> </location> <location path="detroittest" inheritinchildapplications="true"> <connectionstrings> <add name="pulsedb" connectionstring="data Source=(local);Initial Catalog=DetroitTestPulse;user id=pulse;password = 321pulse;" /> </connectionstrings> <appsettings> <add key="pulse_dblog_level" value="2" /> <add key="pulse_dblog_path" value="c:\pulselogs\detroittest" /> </appsettings> </location> </configuration> This example shows two districts, Detroit and DetroitTest, any number of sites may be defined. 189

190 Monthly Maintenance Generally, the only recurring maintenance required for Pulse is to make sure that all imported data has been loaded and to manage disk space availability. This is done by monitoring the folders used for incoming data files. Alternately, a utility is provided by Pulse to manage these files monthly. Use these instructions only if that utility is not in use. Most Pulse implementations use the same folders for the management of incoming data, however, any folder accessible to the server on which Pulse is implemented may be used for defining incoming data. Determine the folders used by your specific site, and view those folders using Windows Explorer as in the following example. In this example, we are displaying the default folders for most Pulse implementations. Those folders are located in,drive-:/development/pulse/testdata/ foldernames. The following example is displaying student enrollment data. For each data file imported by Pulse, two folders are used. One for reading incoming data from other systems, and a second for storing data files after they have been loaded. After a new file is imported by Pulse, that file is date stamped and then moved to an outgoing folder. The following example is displaying the outgoing folder for student enrollment data. In this example, all of the data files that have been loaded between 8/18/2008 and the current date are displayed. If an output file exists for a specific date, the user may be assured that that data was processed by Pulse. Over time, the outgoing folder will become larger and larger as more data is loaded into Pulse. After determining that the data has been processed, older files may be deleted to make more space available. We recommend deleting all of the older files, those older than two days, on a regular basis. 190
191 Pulse Settings File Pulse uses a file located on the C drive of the Pulse server or in its web.config file to control the database access credentials of how each customer pulse database is opened. This file contains the data needed to open and manage each customer database. Once established, it is highly unlikely that any changes will be needed to this file. However, Pulse customers that in turn support various other Pulse users from a single server will need to manage this file as new customers are added to the system. The format and contents of this file is as follows. For additional information, please contact Pulse support staff. For a standard implementation, the string should be set up as follows. In the examples below the database name is GABESERVER\SQLEXPRESS. (Your database will be named according to how your SQL database was configured). CONNECTION_STRING=Data Source=GABESERVER\SQLEXPRESS;Initial Catalog=Pulse;User ID=PulseUser1;Password=321pulse This file is quite different when multiple customers are sharing one server. The string will control multiple databases, multiple file definitions and which database is the ADMIN system. Example: incoming file "From Location" = C:\Development\Pulse\testdata\Test\new\ incoming file "To Location" = C:\Development\Pulse\testdata\Test\old\ PARSE_LOOP=true CONNECTION_STRING=Data Source=GABESERVER\SQLEXPRESS;Initial Catalog=Pulse;User ID=PulseUser1; Password=321pulse; CONNECTION_STRING=Data Source=GABESERVER\SQLEXPRESS;Initial Catalog= BayPulse; User ID= PulseUser1; Password=321pulse; CONNECTION_STRING=Data Source= GABESERVER\SQLEXPRESS;Initial Catalog=ThomasPulse;User ID=PulseUser1;Password=321pulse; PARSE_LOOP=false CONNECTION_STRING=Data Source= GABESERVER\SQLEXPRESS;Initial Catalog=PulseDemo; User ID=PulseUser1; Password=321pulse; CONNECTION_STRING=Data Source=GABESERVER\SQLEXPRESS;Initial Catalog=Pulse;User ID=PulseUser1;Password=321pulse PulseControl=Admin CONNECTION_STRING=Data Source=GABESERVER\SQLEXPRESS;Initial Catalog=PulseDemo;User ID=PulseUser1;Password=321pulse PulseControl=Client CONNECTION_STRING=Data Source=GABESERVER\SQLEXPRESS;Initial Catalog=BayPulse;User ID=PulseUser1;Password=321pulse PulseControl=Client when this is added the parser will search for incoming files in the following locations: C:\Development\Pulse\testdata\Test\new\Pulse\ C:\Development\Pulse\testdata\Test\new\PulseDemo\ C:\Development\Pulse\testdata\Test\new\BayPulse\ then move finished files to C:\Development\Pulse\testdata\Test\old\Pulse\ C:\Development\Pulse\testdata\Test\old\PulseDemo\ C:\Development\Pulse\testdata\Test\old\BayPulse\ If the PulseControl=[Admin/Client] indicator is not found files will be search for and handled the traditional way. 191
192 Pulse Useful Information Changing IIS Timeout The session timeout setting for Pulse users is managed in the IIS definition on the Pulse Web Server(s). It is normally defaulted to 20 minutes. To raise the timeout, the user must have administrative rights on that server. Open the IIS management dialog from the Administrators Menu. Then locate the Pulse web site as shown in this example. Then in the ASP.NET section click on Session State. The following dialog will be displayed. Change the Time-Out setting at the bottom of the display to the desired number of minutes, 999 in this example, and save the entry. Also it may be necessary to confirm that the system.web section of the Pulse web.config file reads as follows: <system.web> <httpruntime maxrequestlength=" " executiontimeout="9999" /> <sessioinstate mode="inproc" sqlcommandtimeout="6000" /> <compilation batch Timeout="1800" maxbatchgeneratedfilesize="2000" MaxBatchSize="2000" /> <customerrors mode="off" /> </system.web> 192
193 Missouri MAP (NCLB) File Loading Locations 1. SIS MAP Student Summary File i. File Name - Student_test_ ii. Folder Name MapSummaryIn 2. SIS MAP Student Standard File i. File Name Content Standard Report ii. Folder Name MapStandardsIn 3. SIS MAP Totals File i. File Name Achievement_Level_4levels_ ii. Folder Name MapTotalsIn 4. SIS MAP Test Item File i. File Name Student_test_item_ ii. Folder Name MapTestItemsIn 5. SIS MAP Test Items Expanded i. File Name Special file downloaded from state web site ii. Folder Name - MapTestItemsExpanded Transferring a File and its Data Contents in SQL Studio These steps are used to transfer a file in an SQL Database to an export file that may be transferred and loaded in a different database. This is a very useful process for moving manual files from one Pulse System to another. In Microsoft SQL Studio: 1. Right click on the database name 2. Select Tasks > Generate Scripts 3. Click Next 4. Click Radio Button for Select Specific Database Objects 5. Expand tables 6. Check the box by the table you want to generate a script for to export 7. Click Next 8. File name ~ normally change this to the name of the table.txt 9. Click Advanced 10. Scroll down to Script Drop and Create. It will indicate Script Create in the right column. Click here and change to Script Drop and Create 11. Scroll down to where it indicates the Type of data to script. It will show Schema Only in the right column. Click here and change to Schema and Data. 12. Click OK 13. Click Next 14. Click Next ~ File will be created 15. Open file and run as query in the database. 193
194 Loading.NET Framework to a Pulse Server To load.net framework to a Pulse server open the Windows Command Prompt and follow the steps indicated in the example: Setting Web Services Extensions when Setting up IIS for Pulse Operations When setting up Pulse on a new server, it is often required that the Web Services Extensions of IIS be modified. The appropriate services should be set to Allowed as shown in the following example: 194
195 Appendix II SQL Examples Pulse Usage This section provides several examples of SQL Statements and approaches that are commonly used to generate Pulse content. ANY SQL function is supported by Pulse, however, since the use of SQL is in Pulse is commonly for the purpose of preparing data for end user consumption (display), several SQL techniques become common. This section simply provides example of their use. Note that these examples are provided for basic SQL experienced developers. They may be obvious to more experienced developers. Example 1 This example shows how to perform several key functions that are useful for preparing data within Pulse This example shows the use of a Case statement. Any number of when actions may be defined based on data variables. For example, case when x then a when y then b when z then c else d end. Each Case statement always ends with an End to inform SQL when the statement is completed. It is also advisable that an else option be included to account for any data contents that are not accounted for with the When conditions. 195

196 2 This example shows how multiple text fields may be combined into a resulting field. When using this command, all of the contents being combined MUST be text fields. A numeric field may not be joined to a text field. When this is the intent, use the cast command discussed in number 4 below to change the numeric field to a text field. 3 This example shows how specific parts of a field may be selected and used. For this example, the EnrollDate field is in a text format similar to This example shows how the type of a field may be changed using the Cast or Convert commands. In this example, assume that the StudentID field is a text field containing only numbers. If this field contained alphabetic text content in any of its records, an error will result when attempting to convert the text field to a numeric result. Note that casting a field as money changes that field to a two digit decimal. 5 This example combines the Case and Cast commands into a single statement. It also shows an example method to compute a percent. Note that changing/casting a field to a Money type changes that field to a two digit decimal. Multiplying the result by 100 changes the display of 14.1% from.141 to This example shows how to use conditions such as testing if a field is blank (null) or is numeric (if numeric the result of the test is 1, if not numeric the result of the test is 0). A text field may also be tested using greater than and less than conditions. 7 This is another example of a Case command testing text based fields. 8 The use of the Order By condition at the end of a query allows for user directed sorting. 196

197 Example 2 This example shows how to use a query to accumulate data that is used by another query. In other words, a query into a query. This approach is highly useful when a number of different types of summations and counts are being performed. Example 3 This example shows how to combine multiple source files into a single query. Note that it is very common to link to the ENSchoolTable file for various Pulse queries. The ENSchoolTable contains information and variables about schools that may be acquired in a number of different queries. It is therefore mainly a cross-reference table so that this information is available when it is needed. For example, data contained in the ENSchoolTable includes but is not limited to the school number, school name, school initials, school index (a counter used within some standard Pulse queries), key date references, number of periods and other specifics about a school. 197
 will be conditioned.")
198 Example 4 This example shows how to use the Group By command to produce various types of totals Result 1 Result 3 Result 2 Generally, the Group By command defines how the resulting function (total, average, count, etc.) will be conditioned. In summary, only the unique set of fields in the result (rows) will be totaled. Including an additional data field in the row will likely change the result. When this is desired consider using the query within a query option discussed in Example 2 above. When developing queries, pay very close attention to the grouping when using functions. A small change may make a very large difference in the results. 198
 to control the order of the resulting display.")
199 Example 5 This example shows how to write two queries and then combine the results (with a union statement) into a single display. Also shown is how to use a user generated field (labeled sortcode in this example) to control the order of the resulting display. Combining the result of multiple queries is useful when using user based Pulse filtering (in this case by school number) to control the field level security of the display. Filtering could be used to show the user only those rows containing a specific data entry, such as the school number. The second example shows how a page in Pulse filtered for School Number 194 would appear. Unions may be used for attaching headings to data (this example) to combine two queries for two schools (all SpecEd students in one school unioned to all SpecEd students in another) or for a variety of other purposes. 199
200 Example 6 This example shows how to write a query to list data from a data file and to insert a counter into the resulting list. In this example, a counter is being generated with dates from the school calendar. The result is a counter starting on the first day of school and ending on the last day of school. Example 7 This example shows how to write a query to and test on date. In this example, enrollments for the last thirty days are being selected. The Getdate command retrieves today s date so the portion of this query using the Getdate command is calculating a date that is 31 days before today s date. It is then using that calculated data in a formula comparing it to each student s enrollment date. 200
, @PercentforHalfDay as dec(10,4 select @StateofDistrict = State FROM ZZ_TEST_ENDistrictTable Select @PercentforHalfDay")
201 Example 8 This example shows the use of declare and set statements combined with imbedded tests on those statements. Copy Example: as dec(10,4 = State FROM ZZ_TEST_ENDistrictTable = PercentForHalfDay from zz_test_endistricttable 201
202 Example 9 The following query may be used to break a combined student name field into individual name fields. For example, Doe, John C to Doe as LastName, John as FirstName and C as Middle Name. Minor changes may be needed to various name formats. SELECT studentname, left(studentname, CHARINDEX(',', studentname)-1) as LastName, Case when right(studentname, ((len(studentname) - CHARINDEX(',', studentname) - charindex(' ', right(studentname, len(studentname) - CHARINDEX(',', studentname)-1))) -1)) = '' then left((right(studentname, len(studentname) - CHARINDEX(',', studentname)-0)), charindex(' ', right(studentname, len(studentname) - CHARINDEX(',', studentname)-1))) else left((right(studentname, len(studentname) - CHARINDEX(',', studentname)-1)), charindex(' ', right(studentname, len(studentname) - CHARINDEX(',', studentname)-2))) end as FirstName, right(studentname, ((len(studentname) - CHARINDEX(',', studentname) - charindex(' ', right(studentname, len(studentname) - CHARINDEX(',', studentname)-1))) -1)) as MiddleName FROM ZZ_TEST_enenrolldataconsolodated For space delimited names: Select left(studentname, CHARINDEX(' ', studentname)-1) as LastName, case when CHARINDEX(' ', rtrim(ltrim(right(studentname,len(studentname) - len(left(studentname, CHARINDEX(' ', studentname))) ))) ) = 0 then ltrim(right(studentname,len(studentname) - len(left(studentname, CHARINDEX(' ', studentname))) )) else left((right(studentname, len(studentname) - CHARINDEX(' ', studentname)-0)), charindex(' ', right(studentname, len(studentname) - CHARINDEX(' ', studentname)-1)))end FirstName from ZZ_TEST_enenrolldataconsolodated Example 10 The following is an example of adding images/jpeg to a displayed Pulse page. This is done by inserting HTML code into an object generated by the Pulse Advanced Test Editor. The following is an example of the HTML generated and the resulting page content. Note that the inserted HTML code is highlighted in yellow. All other HTML code was generated by the Pulse content. See the Pulse Page Content section of this manual for instructions on the use of the Pulse Advanced Editor. 202
203 <div style="width: 862px;"> <table> <tbody> <tr> <td valign="top"> <a href=" target="_blank"><img border="0" src="objects/test/cow_header.jpg" style="width: 642px; height: 142px;" /></a> <p style="text-align: center;"> </p> <p style="text-align: center;"> <em><span style="font-family: times new roman,times,serif;"><span style="color: rgb(0, 0, 128);"><span style="font-size: 36px;">Pulse of the City & School District </span></span></span></em></p> <p> <span style="font-family: verdana,geneva,sans-serif;"><span style="font-size: 14px;"><strong><span style="color: rgb(0, 0, 128);">Welcome to the City of Tyler and Tyler School District Informational Web Site. </span></strong> This web site is provided to deliver extensive operational information about the Tyler School District ( a division of the City of Tyler) to the parents of all enrolled students as well as to the citizens of the City that directly fund our school district operations. </span></span></p> <p> <span style="font-family: verdana,geneva,sans-serif;"><span style="font-size: 14px;">The Tyler School District has experienced outstanding success in improving student learning as well as managing our financial and human resources. </span></span></p> <p> <span style="font-family: verdana,geneva,sans-serif;"><span style="font-size: 14px;">This web site will outline these key operational areas. This success is due directly to our use of the <a href=" target="_blank">tyler Education System (TEMS)</a> the <a href=" target="_blank">tyler Munis Financial System</a>, the Tyler <a href=" target="_blank">versatrans Transportation Sys</a><a href=" target="_blank">tem</a> and most importantly, the <a href=" target="_blank">tyler Pulse Information Warehouse</a>. We thank Tyler for its great contributions to our success. </span></span></p> <p> <span style="font-family: verdana,geneva,sans-serif;"><span style="font-size: 14px;">This site is organized into three key operational areas, Financial Management, Employee Resources and Student Achievement and Information. These areas may be accessed directly by clicking on the following Links:</span></span></p> </td> <td valign="top"> 203
204 </div> </table> </tbody> </tr> <img border="0" src="objects/test/mayor Hepburn2.jpg" /></td> The following is a very simple example of adding images to a Pulse Advanced Text Content: <table> <tr> <td>here is an image: </td> <td><img boarder= 0 src= myphotos/gov_and_flag.jpg width= 172 height= 267 ></td> </tr> </table> 204
205 Appendix III - Other Assessments The Tyler Pulse Other Assessments Model is designed to import and manage student assessments that are not NCLB Scores and/or are not otherwise mandated for a specific state. Generally, Tyler Pulse provides extensive models to support the NCLB testing in each state. The Other Assessments model is used for all other assessments. It is designed to import any type of assessment score from a flat/text file containing assessment data. These scores may include standardized assessments, district unique assessments and benchmark/longitudinal assessments which are administered to students multiple times per year. The operation of the Other Assessment Model requires maintenance of parameter tables that define the assessments used by a District and the user initiated periodic loading of new assessments as they are available. There are three specific Pulse Manual Tables (Parameter Tables) that control the loading and display of data and several online Pulse input pages that further control the assessment loading and defining process. These tables must be established and maintained so that data is loaded and displayed in the manner desired by the District. A unique feature of this model is its ability to dynamically create test and score names from imported data. This functionality is designed to support the importing of test information from virtually any assessment source. While virtually any test result may be imported into Other Assessments, the files containing the data to be imported must be updated to a format mandated by the Model s importing process. This is usually done by first loading the data into Excel and modifying it to the prescribed format. Any tool may be used to update the data format, however, Excel is an excellent tool for this task. For tests that are used nationally by many school districts, such as the NWEA and Galileo Assessments, the Other Assessments model allows those files to be directly loaded using that test s native data format. This section of the Other Assessment Manual will address how to format and load most assessment files. In summary, the Other Assessment Model supports the loading of test scores from virtually any assessment with the following clarifications: - Standardized Tests such as ACT, PSAT, SAT, etc. - Benchmark/Longitudinal Tests given to students multiple times per year. These tests are usually aligned with state standards to assess a student s progress throughout a school year. Pulse will compare each student s scores on these tests throughout the year to compute instance to instance improvements. - Unique tests developed by or for a specific school district. Any type of test can be supported as long as the results of the test can be reduced to a digital format containing the test name, test date, student id number and score(s). - Standardized loading formats are provided for Galileo and NWEA assessments. These tests may be loaded in the standard format provided by the vendor. 205
206 In summary, up to 25 test names and up to 25 scores per test name may be imported into the Other Assessments Model. An unlimited number of student results and test dates may be loaded for each test name. 206
207 Other Assessments Conceptual design The Tyler Pulse Other Assessments Model is designed to import and manage virtually any assessment administered to a student. Testing results may be imported directly from a student information system, from modified score files provided by testing vendors or in some cases directly from a testing vendor's score files. Usually, NCLB Scores and/or other state mandated assessments are not imported into this model because they are addressed in other Pulse models. Up to 25 test names and up to 25 scores per test name may be imported into the Other Assessments Model. The home page for the Other Assessments model incorporates a table showing all of the tests and scores that have been loaded for easy reference. An unlimited number of student testings and test dates may be loaded for each test name. So, in summary, the other assessments model maintains an infinite number of student test scores made up of up to 25 tests, up to 25 scores per test and any number of testings. It then organizes these results to support a very detailed evaluation of student and teacher performance, as well as to provide a robust basis for planning curriculum and other actions at the district, school, teacher, classroom and student levels. To provide this support, the pages in other assessments model are broken down into the following categories: All Scores The All Scores section evaluates all scores that are on file for a student. In this section a user may evaluate the student s most recent performance for all scores, their best performance for all scores or evaluate a master page showing all scores in a single listing. Teacher access to evaluations of all scores is also provided. The Other Assessments home page also provides a listing of all scores that have been loaded. The following diagram shows a grid assuming the data loaded for a single student. The grid is made up of up to 25 assessment names (ACT, Acuity, MAP, AIMS Web, etc), up to 25 scores per assessment and an infinite number of test dates. All testing results are merged with student demographic, operational and master schedule data from the student information system database. 207
208 Tier Scores (Virtual Tests) A Tier is defined as a group of ten scores from any test that are viewed together for a student or group of students. So, in essence a Tier is a virtual test made up of user designated scores from a variety of tests. A common use of a tier is that it may be defined to include similar Scores from multiple tests. For example, all math results from the ACT, Aims Web, NWEA, etc. tests may be combined into a single Tier. In this case, all of those scores can be viewed as a group to evaluate a student's OVERALL math performance. Up to ten tiers of ten scores each may be defined. Tiers are defined in a Pulse parameter table by your Pulse District Administrator. The following example shows how scores from various tests and dates may be combined into a new tier/virtual test for viewing student performance Benchmark Scores A Benchmark Score is defined as a test that a student takes multiple times a year. For example, a test aligned with state standards that is taken by all students each quarter, month, etc. Pulse provides very specialized pages to evaluate student performance over time for these scores. Up to 25 benchmark scores may be defined. Benchmark scores are selected from the palette of up to 625 different scores that are loaded into the Other Assessments model. As shown in the following example, up to ten test dates, in one or multiple school years, for up to 25 test/score combinations may be combined into a benchmark analysis 208
209 Teacher Value Add This section of Other Assessments provides a detailed analysis of the value a teacher is adding to a classroom. It evaluates and scores teachers based on the performance of their students on the Benchmark scores defined above. Teacher performance is calculated on a point basis based on student improvement, classroom demographic statistics, student multiple year progress comparisons and class size. This section addresses virtually all of the key directives of the Race to the Top program and other state mandated teacher evaluation methodologies. The Teacher Value Added calculations are based on combining benchmark scores (see previous section) with the SIS master schedule to determine student to teacher relationships. Additionally the teacher results may be combined with data from a human resource statistical/demographic data for teachers to plan hiring policies. This approach supports the review not only of teacher performance, but more importantly, teacher talents and weaknesses. Using this information teacher assignment may be made to maximize student learning and class schedules may be planned with better results. For example, if one teacher excels at teaching math but lags in reading, and another teacher the opposite, specialized classes for math and reading with the appropriate assignment may be a natural decision. So, in summary, access to information simply supports better decision making. Additionally, this model supports the evaluation of how demographics and education of teachers affect student learning. This information may be used to make better hiring and recruiting decisions. In summary, the Pulse Other Assessment model is designed to provide a very detail analysis of how students are performing based on various assessments. It provides this information specifically at the District, School, Teacher, Classroom, Student Group and Student levels. 209

210 Loading and Managing Assessment Data General Assessment Scores Data may be imported into the Other Assessments model in one of three different methods: 1. Assessments may first be imported into the SISk12, TEMS or Schoolmaster student information systems. Once loaded, they are automatically exported to a file by those systems for use in Pulse. 2. If SISk12/TEMS/Schoolmaster are not in use, the Assessments files provided by the various Assessment companies (for example ACT, SAT, PSAT, Aims Web etc.) must be organized for importing into Pulse. This reorganization of data may be performed by loading the entire file into Pulse and using Pulse features to reorganize the file, or, the file may be reorganized using offline processes such as the use of Excel. The offline process is a simple restructure of the test score data file and is almost always the easiest approach for importing other assessment data. The data format for importing data into the Other Assessments Model is a tab delimited file in the following format. Bottom Two Rows are Example Data A sample import file would appear as follows: 3. Some tests, such as tests from NWEA and Galileo may be loaded from those vendors standard score distribution files. This process is described in the next section. 210
211 Process for Importing Other Assessment Files Other Assessment files are imported into the Other Assessment model from various flat files that are maintained on the Pulse Server. Three distinct types of files are loaded into the model. These are NWEA/MAP assessment Files, Galileo assessment files and all other types of assessment files. NWEA and Galileo files are loaded in their native formats and translated by Pulse. This approach is used because the formats of those files do not easily lend themselves to reformatting using the methods described above. The incoming folders from which Pulse imports test scores are in the folder locations shown below. These folders may be located on any designated disk drive on the Pulse Server. When the Other Assessments model is processed, it will locate all files in the Galileo, NWEA and Other Assessments Incoming folders and load those scores for processing. Note the following steps to populating those folders: 1. If the SIS being used supports the exporting of test scores then those scores will always be located in the OtherAssessmentsIn folder and will always be available for processing. 2. Note that each of the test types (Other, NWEA and Galileo) have a recurring folder located in the Out folder for those tests. When a file is manually created, it should be placed in these Recurring Folders. When the Other Assessments model is processed, as a first step it will copy all recurring files into the incoming locations for processing. This way, once a file is created it will be automatically processed each time the Other Assessments model is run. 211
212 Note that periodically each District should review the files in their incoming folders. Any test files that are no longer used should be deleted. For example, it may be that 2006 files for tests contain only scores for graduated students. It is therefore not appropriate to continue loading those scores. It simply adds unneeded data to displayed pages and increases the run time of the Other Assessment model. So, in summary, the steps for processing Other Assessment Test files are as follows: Test Files Coming from the SIS Application These files will be placed in the /development/pulse/testdata/sis/otherassessments/in/ folder by the SIS Application. They will be automatically processed when the Other Assessments Model is processed. No intervention is needed for these files. Test Files Coming Originating from Manually Prepared Files Once the data is prepared in this manner described above it should be placed in the Other Assessments Out Recurring data folder: (/development/pulse/testdata/sis/otherassessmentsout/recurring/) All files in that folder will be automatically copied into the OtherAssessmentsIn folder for processing by the Model. Importing NWEA Scores Unlike general other assessments that must be formatted for loading, NWEA Assessments may be imported directly into Pulse from their native formats. When imported, Pulse logic will evaluate the data being loaded and assign both test names and score names that are appropriate for the data. Note, when using NWEA Scores, turn on this feature by updating the Pulse NWEA Parameter table as shown in the following example : Enter "Yes" into the "Use in District / Yes or No" column. No entry is needed if the NWEA MAP test is not used by the District. 212
213 In the "State or Local ID" column enter an "L" if the test scores being loaded contain the District's Local Student ID number. Enter a "S" if the data being loaded contains the student State ID numbers. NWEA scores are imported from a different Pulse Incoming folder than general other assessments. The NWEA recurring folder is: C:\development\pulse\testdata\sis\NWEA\Out\Recurring. In Kentucky, the NWEA file format varies from that used in other states. So, for Kentucky the recurring NWEA folder is: C:\development\pulse\testdata\sis\NWEA\OutKy\Recurring. Importing Galileo Scores Unlike general other assessments that must be formatted for loading, Galileo Assessments may be imported directly into Pulse from their native formats. When imported, Pulse logic will evaluate the data being loaded and assign both test names and score names that are appropriate for the data. Galileo scores are imported from a different Pulse Incoming folder than general other assessments. The Galileo recurring folder is: C:\development\pulse\testdata\sis\Galileo\out\recurring. 213

214 Running the Other Assessments Model The Other Assessment model is designed differently from most other Pulse models and it is important that this uniqueness be acknowledged. Each time test scores are imported, all prior scores and tests imported will be deleted, and only the newly imported data loaded and displayed. This is necessary because there are no fixed field names or data definitions within this model. All test names, score names and field names are computed via logic in the model. So, it is important to note that each time Other Assessments is processed; all files to be loaded (including those that may have been reloaded) are present in the incoming folders for both general other assessments and for NWEA and Galileo files. Once a file is loaded, Pulse timestamps the file and places it in the Out folder for the appropriate file type. This allows for access to historical files that have been loaded. The following diagram is a quick reference guide showing the steps involved in loading student test results into the Other Assessments model. Note that the folder locations indicated are the default locations. The disk drive on which they are located may change for a specific implementation. Also note that not all school districts will have each of these conditions in use. For example, a district not using the MAP/NEWA or Galileo assessments should ignore the third column. 214

215 Using / Defining Tier Scores All (up to 100) tier based test scores as well as the twenty five Benchmark test scores must be numeric. This is because extensive calculations such as averages, best performances, annual comparisons etc. will be automatically performed on theses scores. The Other Assessment Model provides assistance to determine that ALL of the scores imported for a particular score are numeric. Once initially imported, all of the imported scores are displayed, as shown in the following example, on the home page of the Other Assessments Model. This table indicates if the imported score has all numeric entries in the Score Types row for each test. If even one score for a score type is alpha, then the entire score type is considered alphanumeric. As will be detailed in following instructions, specific test scores may be forced to be numeric during the data load. When a test score is designated to be numeric only, and Pulse locates an alpha entry for this score in the incoming data, that alpha score will be discarded. Also note that the display on the Other Assessments home page (example below) also indicates the number of student/score combinations on file with that test score. This table is simply a summary of all of the scores that have been loaded into the model. As reviewed above, Tiers are simply groups of scores for various student groupings. See the following example for an overview of Tier logical setup. While up to ten Tiers are supported, the example shows how four Tiers may be defined. 215

216 Parameter/Manual Table Setup Instructions To use the Other Assessments model several parameter tables must be defined to indicate how your school district wants the model to work, and to defined the scores and tests that are being loaded. Once initial scores are loaded, these tables may be set up, and, changed over time to meet your ongoing needs. Defining Tiers From the Other Assessments Data Loading Parameter page view the OA Tier Test and Score Assignments table as shown in the following example: This table will contain 100 rows labeled Tier1 through Tier10. Each tier is color coded. In these rows enter the test name and score name that will represent tiers for your school district. A Tier is defined as a group of up to ten scores from any test that are viewed together for a student or group of students. So, in essence a Tier is a virtual test made up of user designated scores from a variety of other tests. For example, a tier may be defined to include all Math Scores from multiple tests. For example, all math results from the ACT, Aims Web, Acuity, etc. tests. In this case, all of those scores can be viewed as a group to evaluate a student's OVERALL math performance. Up to ten tiers of ten scores each may be defined. 216

217 Up to 10 Tiers of 10 scores each may be defined for a total of 100 selections. The first 10 selections are assumed to be Tier1, the next 10 as Tier2, etc. This is indicated by the Tier and Test # Columns that are pre-filled. Enter the Test Name and Score Name fields appropriately. Note that these entries will not take effect until the Other Assessments project is run. See example below. In this case, the "AG" score from the "ACT" test will be used as the first score in Tier 1. Note that the test and score names entered must match EXACTLY with the test and score names that have been loaded into Other Assessments. At the bottom of the entry page is a reference table, an example is shown below. This table shows a summary of all scores that that has been loaded into the Other Assessments model. This table is provided to show what scores are available to use in a Tier. ALSO, note that is it quite helpful to cut and paste the test and score names from this table so that typos do not cause problems. The test and score names in the table must EXACTLY match the entries in this table. Make sure that all entries are correct. 217

218 Defining Do Not Load Rows In many cases it is not appropriate to load all of the test scores in the incoming test file. An example of this is in Missouri. In this case, Missouri NCLB MAP and EOC scores are usually included the incoming test score file because they have been imported into the SIS application. Since there is already an extensive model addressing these Scores, and, because there are many of these scores in the file, avoiding processing those scores is appropriate. This also significantly reduces the time required to update Other Assessment data. The Other Assessments Model supports the entry of up to ten tests that will not be loaded from incoming test file. To define the tests and scores that will not be loaded, use the OA Do Not Load Definition Table on the Other Assessments Data Loading Parameter page. An example is shown below: Pulse allows the right or left characters of the test name to be evaluated to determine if it should be loaded. This evaluation is based on locating a set number of characters at the beginning or end of the test name. Up to ten entries are supported. Enter either "Left" or "Right" into the first column to indicate if the left or right digits of the test name is to be evaluated. Enter the number of digits to test for into the "Number of Digits" column. Enter the phrase to test for (must be same number of digits as that entered in the previous field) into the "Characters to Test For" Column. In the first line of the example the user has entered "Left", 3, "MAP" into the first iine of the table. Pulse will evaluate each test name being loaded and if it begins with "MAP" it will NOT be loaded. For example, the tests "MAP2010", "MAP2012" and "MAPTEST" will not be loaded. If the entry is Right, 2,10 then no test ending in "10" will be loaded. 218

219 Defining Tier Names To better communicate with end users it may be appropriate that the Tiers be assigned names. (See the previous definition of Tiers). For example, the four tiers could be named HS, MS, Grades 4-6 and Grades 1-3 or any other name that describes the scores included in that tier. Up to Ten Tiers of ten scores may be defined. Simply enter the name desired into the Tier Name Column for each Tier. The names will take effect the next time the Other Assessments Project is run. Once processed, end users will see these names in the online Pulse System. For example, "ACT" will be displayed instead of "Tier1" when selecting tiers from Pull Down Selection boxes. See the example below. To define the Tier Names use the OA Tier Names Definition Table on the Other Assessments Data Loading Parameter page as shown above. For each Tier, simply enter the tier name that will be used. 219

220 NWEA Score Definition Unlike general other assessments that must be formatted for loading, NWEA Assessments may be imported directly into Pulse from their native formats. When imported, Pulse logic will evaluate the data being loaded and assign both test names and score names that are appropriate for the data. Note, when using NWEA Scores, turn on this feature by updating the Pulse NWEA Parameter table as shown in the following example : Enter "Yes" into the "Use in District / Yes or No" column. No entry is needed if the NWEA MAP test is not used by the District. In the "State or Local ID" column enter an "L" if the test scores being loaded contain the District's Local Student ID number. Enter a "S" if the data being loaded contains the student State ID numbers. AYP Score Definition Sometimes Pulse will send specific test scores to non-other Assessment pages. To support this, it is necessary to define a tier of scores for this purpose, and then tell Pulse via a parameter table which tier will be used for this purpose. This is done on the OA AYP Declaration Table as shown below. Access this table on the Pulse NWEA Parameter page. Enter "Yes" into the "Use AYP Yes or No" column. Then enter the default Tier into the second column. Enter the Tier as "Tier" plus the tier number (1-10) with no spaces in the entry. 220

221 Once these entries have been made and the OA Project executed, the selections that are entered are displayed on the Home Page for the Other Assessments Project. This is shown in the following example. This table is provided simply as a review of all the selections that have been made and processed. 221

222 Main Menu Warnings and Start Buttons As outlined earlier in this section, all entries into Other Assessment manual tables must EXACTLY match the loaded test names, test scores and entered categories. Usually, the table listing of these names on the main menu is used to cut and paste those names to the manual table to avoid the tedious task of typing them. However, it is still easy to make errors. To assist the process of locating those errors, Pulse places a list of manual table warnings and errors neat the bottom of the Other Assessments Main Menu. See the example below. This listing will provide the error description, the table in which the error is located and details about the type of error found. Once the errors are corrected, click the button Refresh Error Display to recalculate errors. Once this is done, the page will need to be refreshed to show the recalculated information. The button Run Other Assessments Project is also provided. Clicking this button will run the entire Other Assessments project. Once clicked, the user may use general Pulse functions while the project is running. The Other Assessments project performs extensive work and calculation. Even in small sites it is not uncommon for this model to run for up to 30 minutes and may run for up to 2 hours in large sites. 222
. - General Scores.")
223 Override Test Display Order When tests and test scores are imported into Pulse, the display order is determined in the following manner: - Tier Scores. The display order is managed by the ordering of the test scores in the Other Assessments set up table (1-100). - General Scores. The default display order for general loaded scores is based on the order that the scores are loaded into Pulse. Because of the complicated nature of the loading process, this ordering may result in somewhat random displays. The OA Override Test Display Order page allows users to override the Pulse calculated display orders so that scores are displayed in any order desired. For scores to be displayed on the working portion of this page, they first must be loaded. Once loaded, new ordering may be applied. The new ordering is not immediate; it is initiated when the Other Assessments Pulse Model is subsequently processed. The following is an example of the OA Override Test Display Order page: This page also allows the selection of scores that are not to be loaded. For example, if there were 30 scores to be loaded for a single test, Pulse, since it is limited to 25 scores per test, will simply load the first twenty five scores that are present in the incoming file and discard the 223
224 others. To control which of the twenty five scores are to be loaded, mark the scores (five in this example) with a No in the Load Score? column. Pulse will then load the twenty five scores that have not been marked not to be loaded. 224
225 Benchmark Assessments Setup The Benchmark Assessments pages in the Other Assessments Model provide the ability to view how students and groups of students perform on selected tests over time. For example, if a test is administered each 9 weeks during a school year, each of those scores could be viewed in sequence to determine if the student or student group are progressing or regressing based on those scores. Note that these comparisons may also be performed across calendar and school years. For example, a student s or group s performance in May/2011 and October/2011 can be compared to May/2012 and October/2012 To use this functionality, a Parameter table, OA Benchmark Score Definition Table, must be defined to select the tests, scores and test date ranges to be monitored. Up to 25 sets of tests and scores may be defined with up to ten comparative dates per selection. For example, a student s progress could be measured from Spring/2010 Fall/2010 Spring/2011 Fall/2011 Spring/2012. Any sequencing of administrations of the same test may be tracked up to a maximum of ten. This table pre-sets the test order and sequences and provides color coding for each. An example of OA Benchmark Score Definition Table is displayed below. 1. Up to 25 Benchmark Scores may be defined. For each Benchmark Score defined, up to 10 score date ranges may be defined as a testing period. For example, all scores for the Acuity test that were administered between 12/1/2012 and 12/31/2012 may be labeled as "Winter/12". Up to ten of these ranges and names are defined so that a student's testing progress over time (even multiple school years) may be tracked and evaluated. To do this, the tests, scores, date ranges, range names and other basic data must be defined for your District. 2. Enter or paste the test name. It must match exactly to the name loaded into Other Assessments. Only sequence 1 Test Names are used. Other may be left blank. 225
226 3. Enter or past the score name. It must match exactly to the name loaded into Other Assessments. Only sequence 1 Score Names are used. Others may be left blank. 4. Enter a Benchmark Score (numeric up to 2 decimals). This is the Cut Off Score that determines proficiency for this test. If there is a single cut off score for all grade levels, enter that score here. If the score varies by grade level, enter that score into the "Competency Level Definitions" table. All entries on that table will override a "stray" entry on this table. Only sequence 1 Benchmark Entries are used. Others may be left blank. 5. Enter the beginning date for the testing date range in MM/DD/YYYY format. The date must be a real date so be careful of typos. 6. Enter the ending date for the testing date range. 7. Pulse provides a comprehensive Teacher Value Added model to track the value that teachers are contributing to their classroom. This evaluation partially uses the progress that students make on these benchmark tests. If this model is being used, it is necessary to define which date ranges and scores are used in their evaluation. NOTE, the short answer would be the scores for students in the CURRENT SCHOOL YEAR. Also, this evaluation determines student s performance in prior years so that a teacher may be fairly reviewed. So the short answer here is to determine the last score a student got prior to entering a teacher's classroom. 8. Type Yes into the "Include in CY TVA" column if the date range is in the current school year. 9. Type Yes into the "Include in PR TVA" column for the date range of the last score in the previous school year. 10. Entering a No is not necessary but will not hurt anything. Do not enter a Y, enter a full "Yes" in the two previous fields. 11. NOTE, each test / score name combination may have UP TO ten entries. If there are not ten historical scores for a particular score/test, enter only what is available and leave the other columns empty. 12. UP TO 25 TEST/Scores may be defined and up to ten ranges per Test/Score. As further explanation, if the test given in the 2012/Spring testing period was administered to students between 3/10/2012 and 4/5/2012, enter those dates in this range. The model will then use the test results from the test file that is in that range. If multiple scores are found in the range entered, the highest scores in the range will be used. 226

227 Note that all test names and scores must match exactly to those that are loaded into the Pulse Other Assessment Model. To assist in this, at the bottom of the page is a table listing each test and score that has been loaded. It also contains statistics about the data loaded for each test. It is quite helpful to use this table as a Cut and paste source to define the tests and scores that will be used. 227

228 Teacher Value Added Analysis Once Benchmark Scores are loaded and active in Pulse, an extensive Teacher Value Added functionality is provided. This sub-model will analyze the value that a teacher has added to a classroom by analyzing the progress that students in that classroom make on various benchmark tests. In general, teachers are rated on an earned points basis, the higher the points, the more effective the teacher. Teachers are assigned points based on the overall (average) progress that the students make on a series of assessments. These accumulated points are then adjusted based on the demographics of the students in the class and the class size compared to average class sizes. For example, a teacher with a high percent of special education students or a large class size will most likely see their score adjusted to reflect those conditions. The following section outlines the general functionality and purpose of the Teacher Value Added Model. The example object below is from one page of a large model provided for the calculation of the value that teachers are contributing to their classroom. Teachers are ranked based on the calculated added learning value that they are adding to the students that they teach. An average row is calculated and included to show those teachers above and below the average scores for this school. The chart shows the total calculated score on the left and the detail making up that score to the right. The calculations making up this evaluation are quite comprehensive. In reviewing this example, note that Pulse provides this level of calculation on twenty five different assessment The Teacher Value Added calculations are based on a number of different areas resulting in a comprehensive evaluation for each teacher. Each of the thirty evaluations performed on a teacher is based on the following formulas. Pulse provides site based weights in each area so that each school district may weight the scores to be consistent with their priorities and mandates. 228
229 Formula Components 1. Pulse calculates the average improvement for a teacher s classroom or teaching load on any specified test. Each test is assumed to have a baseline exam and up to nine additional scores taken over a school year. The baseline exam may be in the same school year or can be an exit exam from the prior school year. Pulse calculates the average percentile improvement for each student being taught by a teacher. For example, a teacher with a classroom improving the average score for students by 25% will receive a higher score than a teacher with a classroom improving by 20%. The resulting calculation is adjusted by the District s weighting to calculate a score for average percentile improvement. Students in a teacher s class or group that have not taken the test a sufficient number of times or who entered the teacher s classroom during the school year are automatically excluded from the calculation. This is the case for each evaluation area except for class size and demographic adjustments that are described below. 2. Based on the same criteria described above, Pulse calculates the average number of points improvement on the test for each student in the classroom. The average point and percentile improvement can vary due to the percentile at which each student tests. For example, students in low testing percentiles improving 5 points will improve by higher percentages than students improving 5 points in higher percentiles. The approach of using both percentage and points gains in the formulas level this abnormality. The same exclusions and weights are applied as outlined above. 3. Pulse calculates the average proficiency of the classroom based on proficiency cutoffs unique to each grade level. A point value based on the same criteria described above is calculated based on the testing proficiency level of the classroom. For example, a classroom with students averaging 75% proficient will score higher than a classroom with 50% if the students scoring proficient. 4. Pulse determines the percentage of students taught by each teacher that have improved their scores over the course of the year or testing period. This value is used in the same manner as described above to calculate a weighted score. For example, a teacher with 80% of their students improving on test scores will be weighted higher than a teacher with 70% of their students improving. 5. One of the more advanced parts of the Teacher Value Add ratings is the ability to compare student advances over multiple years. In this evaluation area Pulse calculates the average improvement of all of the students taught by a teacher in the current year with that same group of student s performance in the prior school year. In this case, those students may have been taught last year by a variety of teachers. The improvement in that year is then compared to the current year. A score is calculated based on the current year rate (owned by the current teacher) and the prior year rate (owned by a variety of teachers on the same students). This approach normalizes the scoring based on the expected improvement levels for this specific group of students and results in a much more fair and comprehensive evaluation. The same weighting and student inclusion formulas are used as are described above. 229
230 6. Once each of these steps is completed, Pulse further provides for adjustments to the scores based on classroom size and demographic considerations. For example, two teachers being compared may have different numbers of students. One teacher may teach 25 students while the other is teaching 21. So, the net effect is that the first teacher is spread thinner over more students. To be fair, an adjustment should be made to account for this inconsistency. Also, in one teacher s class there may be 60% ELL students while in another teacher s class there are 7.5% ELL students. Again, a direct comparison is difficult and unfair without an adjustment accounting for the more difficult student group in the teacher with the most ELL students. So, Pulse allows for automatic adjustments to be made in these areas. Each adjustment is made based on the Pulse calculation of these comparatives from the school master schedule. Also, the weights managed by each school district are also applied to the calculation. The following calculations are made: - Class Size. Pulse calculates the average class size for each school. Then, Pulse calculates the percentage of the average class size for each teacher in relation to the school average class size. The variance in the percent is used for this calculation. - ELL Count. The percentage of ELL students taught by each teacher is calculated and then used as an adjustment on this factor. - Special Ed Count. The percentage of Special Ed students taught by each teacher is calculated and then used as an adjustment on this factor. - Aid Count. The percentage of students qualified for free and reduced lunch taught by each teacher is calculated and then used as an adjustment on this factor. - Title1 Count. The percentage of Title1 students taught by each teacher is calculated and then used as an adjustment on this factor. - Gifted Count. The percentage of gifted students taught by each teacher is calculated and then used as an adjustment on this factor. So, in summary Pulse is performing hundreds of thousands of individual calculations across dozens of evaluation areas to generate a highly specialized value add ranking for each teacher. This is then performed 30 separate times across multiple scores and subject areas to produce a composite ranking for each teacher. The 30 areas of evaluation are made up of: - One Evaluation Score for Each of the 25 Benchmark Test/Scores that are defined. - A blended score for each of the benchmark scores associated with Math, Reading, Science and Social Studies - A total or blended score based on the averages of all of the 25 scores. 230
231 Teacher Group Comparisons Overview Once each teacher is evaluated, that data may be combined with demographic information on each teacher to generate a profile of teachers at are over-performing as well as for those teachers that are struggling. This data can be very valuable in formulating Human Resource hiring and recruiting policies. The following example shows the breakdown of teachers from across a school district. In this example we are comparing the college major of those teachers to the aggregate performance of their students in Reading and Mathematics. This study may be performed in all study areas and across multiple types of evaluations. For example, Pulse currently supports this evaluation by the following categories. Additional categories may be added on request. University Attended Major of Study Degree Obtained Years of Experience Years of District Experience 231
232 Employee Age Employee Gender and Ethnicity Years of Schooling Bargaining Unit These are two of many example incorporated into the Pulse Teacher Value Added calculation model. They add to the extensive support we also provide to track individual student performance using very similar techniques, our student risk evaluation model that tracks not only student risk of dropout, but student risk of underperformance and many other key statistics. Each of these areas are provided for a single reason, to provide the decision makers in a school district (teachers, principals, district staff, others) with the information they need to make highly informed decisions to improve student performance. Tyler Pulse changes the way a school district does business. 232

233 Teacher Value Added Setup and Usage The Teacher Value Added sub-model requires three main set up actions (beyond the use and setup of Benchmark Scores covered in the previous section). These steps are to manage the Value Added Manual/Parameter table, associating course offerings with evaluation areas (reading, math, etc.) and loading and managing teacher statistical data (similar to HR Data). Each of these steps is outlined below: Teacher Value Added Parameters The Teacher Value Add model allows each school district to define the relative weights of each area used to calculate a teacher s performance. A point multiplier is used for each area evaluated. Pulse provides a parameter table to define these weights of each evaluation area. This function is described below. To manage these weights, view the OA Teacher Value Added Weighting table from the Other Assessments Data Loading Parameter page. An example of that table is displayed below. There are thirteen settings managed in this table as shown above in the Category column. A maximum setting may be set for point calculations from a row subject. When this is set, it will represent the maximum points for that area, regardless of other factors defined. Also, if the IncludeYorN setting is not set to Yes, that category will not be used in the calculations. Make note that the number of points calculated on a teacher is not in itself significant. It is the number of points in comparison between teachers that is considered. So, when setting these weights, do not attempt to target a specific score level. The goal is to evaluate how many points each category will generate in comparison to the others. It may be necessary to adjust 233

234 these scores several times before achieving the proper balance between the categories. Note that when establishing multipliers the range of factors that are multiplied may vary by subject. The categories are defined as follows: 1. Proficient Score This is the average proficiency level of students in the classroom based on a scale of 4 = Advanced, 3 = Proficient, 2 = Below Proficient and 1 = Significantly Below Proficient. So, if the AVERAGE of the classroom is a 3.1, just above proficient, the teacher would be award 620 points in this example. 2. Student Position The Student Position is a calculation made by Pulse. For a student, it represents the percent that a student s assessment score represents of the average score for all other students in the school district in his/her grade level. So, if the average score for a test is 100 for all students in a given grade level, and a student scores a 90 on that test, their position will be 90%. This category represents the AVERAGE of all students position scores in a specific classroom. The average position of the classroom, for example 99%, will be multiplied by the Multiplier to produce a position point total which is added to a teacher s score. So, in this example a teacher at 99% will receive 2,475 points and a teacher with their students scoring at 105% will receive 2,625 points. 3. Improvement Percent This category when combined with Improvement Points (detailed below) is the main calculation used by this model. The multiplier entered in this column is multiplied by the average percentage progress made by all students in a teacher s classroom. So, in this example, if the students in a teacher s classroom improved their scores by an average of 10%, that teacher would be awarded 200 points. 4. Improvement Points - The multiplier entered in this category is multiplied by the average number of points of progress made by all students in a teacher s classroom. So, in this example, if the students in a teacher s classroom improved its scores by an average of 5.5 points, that teacher would be awarded 275 points. The use of both percentage gains and point gains in a classroom normalizes the situation where students improving from very low scores show higher percentage gains for the same point gains. 5. Prior Year Improvement The Prior Year Improvement is the percentage improvement that a current teacher s students made in the prior year. The teacher s student s prior year improvement is subtracted from the current year improvements to determine if 234
235 that group of students made more or less progress in the current year than with prior year teachers. This is a very good leveling consideration. It allows for the determination that the group of students taught by a teacher traditionally lags or exceeds learning averages across multiple years. Once determined, an adjustment may be made in the teacher value added rankings. The multiplier in this column is multiplied by the difference in the prior year and current year average for the students taught by the teacher. 6. ELL, Aid, Title1, SpecEd, Gifted Each of these categories are calculated in the same manner. Pulse calculates the percentage of students taught by each teacher in each of these categories. For example, if 10% of the students taught by a teacher were special education students, the Multiplier of 10 times the 10% would increase that teacher s score by 100 points. In this example, it is assumed that students in these categories are expected to improve their scores at a slower pace than students not in these categories. Note in the example above Gifted Students are given a negative value. This will result in gifted students taught by a teacher reducing the points since gifted students are expected to improve test scores at a faster rate from a higher starting point. 7. Class Size The class size setting will increase or decrease a teacher s calculated points based on their average class size. Pulse calculates the average class size for each school in which a teacher teachers. The average class size for each teacher is also calculated. By comparing these calculations each teacher is determined to be a percentage above or below the school average. This category will multiply the multiplier by the percentage that the teacher is above or below the average. This adjustment is made because is it expected that teacher s with large classrooms will spend less time with each individual student compared to teachers with smaller rooms. When calculating the average class size in a school, Pulse ignores all classes with fewer than ten students. This allows special classes to be excluded from the calculation to achieve a better overall class size average. 8. Enrollment Cutoff The Enrollment Cutoff is a date that is used to determine if a student that enrolled in a teacher s classroom after the start of a school year should be considered in the teacher s TVA calculations. If a teacher has generally not taught a student for a full school year, it may not be fair to include that student s results in the teachers scoring. Any student that enrolled after this date will not be included in the calculation, however, they will be included in class count and demographic calculations. 235

236 Defining Test Instances to Use in the Evaluation In the Other Assessments model, each test score may have up to ten historical periods defined for tracking student performance. These testing periods are defined in the ConsolodatedReporting manual table. These periods may span over multiple school years. However, for teacher value added calculations only the scores associated with the current teacher, and the score prior to being assigned to that teacher, should be considered. So, for each of the ten tracking periods, note the periods that SHOULD NOT be considered in the TVA calculation. Generally, the last score from the previous year and all current year scores should be considered. To define this functionality use the previously discussed parameter table, OA Benchmark Score Definition Table. The two right most columns define the test sequences to use for TVA evaluations. An example of OA Benchmark Score Definition Table is displayed below. In the Include in CY TVA column, enter a Yes if that score is to be used to calculate student progress for the current evaluation. Generally, the correct approach is to enter a Yes for all scores for students in the CURRENT SCHOOL YEAR. Also, this evaluation determines student s performance in prior years so that a teacher may be fairly reviewed. So the short answer here is to determine the last score a student got prior to entering a teacher's classroom. 1. Type Yes into the "Include in CY TVA" column if the date range is in the current school year. 2. Type Yes into the "Include in PR TVA" column for the date range of the last score in the previous school year. 236
237 Entering a No is not necessary but will not hurt anything. Do not enter a Y, enter a full "Yes" in the two previous fields. NOTE, each test / score name combination may have UP TO ten entries. If there are not ten historical scores for a particular score/test, enter only what is available and leave the other columns empty. 237

238 Teacher Value Added Course & Test Area Definition To support the formula calculations in this model, it is necessary to define the testing area relationships for both test scores and for all courses. A page, Teacher Value Add Course and Test Area Entry is provided for this purpose. When displayed, this page will display all test/test scores defined as benchmark scores in the first table (up to 25) and all courses in the school district in the second table. In each case, enter the department associated with the test or course into the department column. See the example below: Enter the department number in the EXACT format of Math, Reading, Science and Social Studies. Leave the column blank for courses such as Munis, PE, etc. that do not match these categories. This table is necessary because it is inappropriate to score a teacher teaching English on a student s Math performance. Without making distinctions between the subject of each test and the subject of each class it would be impossible to associate the proper test with the proper class subjects. Pulse will use these tables t match like subjects taught by teachers to the test scores that are appropriate for those subjects. 238

239 Teacher Value Added Teachers Statistics Definition This page supports the entry or override of teacher statistics. Teacher statistics are generally teacher demographics and historical information. For example, Date of Birth, Degree and Experience. Pulse takes a very flexible approach to acquiring teacher statistics: 1. If the Pulse implementation incorporates the loading of Human Resource data from a System such as MUNIS, then in some cases this data may be imported directly from that system. If this is the case, the imported data is displayed in the green area in the page example below. 2. If desired, the teacher data may be directly imported into Pulse from an external file created from an HR application or from a spreadsheet where the data is maintained. If this approach is used, the teacher id must be a part of the data imported. 3. The third option is to enter the data directly into Pulse as shown in the second part of the example below. 4. A combination of these approaches may also be used. Once data is imported from a HR Application or an external file, online user entry will OVERRIDE the data that is loaded. See the example below:. When entering data, be sure to use a consistent method for entering into each column. For example, always spell each category exactly the same for each line entered. For example, do not use Masters on one line of the Degree entry and Masters Degree on another line. This will result in Pulse viewing each of these entries as a different type of degree. Use standard date formats, as displayed, for dates. Decimals are supported in fields anticipating years to be entered. Once all of the setup data is defined, Pulse will automatically calculate teacher ratings and value added positions each day or each time the calculation process is initiated. The table settings may be changed at any time to support updates in the formulas. 239

240 The Other Assessments Main Menu 1-Pulse Page Sections and Selections. Continued on next page.. 2-Summary of Loaded Tests and Scores. 240
241 3-Summary of Defined Tiers. 4-Graphical Views of Loaded Tests & Scores. 5-Summary of Manual Table Errors & Warnings. 6-Execution Buttons. 1. Other Assessment Page Sections. The Other Assessments Main Menu breaks down its page links into five Sections. These sections group pages into logical segments for easier page selection and use. In each section pages are included for listing scores, detailed evaluation of scores and for evaluating scores by teacher. These teacher pages allow 241
242 the analysis of all students being taught by a specific teacher to better plan curriculum and service delivery to those students. These sections are: All Student Test Scores. As described in the introduction to this Appendix section, the Other Assessments Model supports the import of up to twenty five assessments, up to twenty five scores per assessment and an unlimited number of individual assessment sittings. This is an extensive set of data on each student. These pages address access to ALL scores that are on file for an individual student. Virtual Tests Student Tier Scores Student Tier Scores are collections of scores from various tests defined by each school district using Pulse. Up to ten sets of scores containing ten scores each may be defined. Tiers are used to evaluate student performance in detail on user defined collections of similar score types. For example, all Math scores from various tests. Student Benchmark Scores Benchmark Scores are defined as scores from a test that students take more than one time per school year. These pages use those scores to evaluate student and student group performance over time. Up to 25 test/score combinations may be defined for use by the Benchmark Score process. 242
243 Teacher Value Add Analysis These pages use the benchmark scores defied in the previous section and the master schedule from the student information system to determine and report the value that a teacher is adding to their classroom. Also evaluated are teacher instructional talents and weaknesses. This data can be used to better make teacher assignments and scheduling decisions. In some student information systems a Response to Intervention section is also provided. This section uses Benchmark Scores to evaluate student s responses to various response to intervention programs. These pages are targeted to evaluate the effectiveness of each program and the effectiveness on students groups in the programs. These groups include ethnicity, gender and several other student categories. This data can be used to evaluate each program and to target the most effective programs toward the most appropriate student group. 2. Summary of Loaded Tests and Scores. This table is provided for two specific purposes. First, to indicate the tests, scores and details that have been loaded into the Other Assessment Model. It is also used as a worksheet to build the manual/parameter tables that are used to generate Other Assessments pages and statistics. As detail, this worksheet data includes: - A list of the names of each test and score. It is recommended that this list be used to cut and paste that data into the set up tables. Some names and scores are lengthy making it difficult to type. By pasting those names fewer table entry errors are made. - The table shows the number of scores and the alpha/numeric nature of the score. If there are any alpha scores loaded for a specific score name, the scores are considered alpha. If all scores are numeric, that is also indicated. Since only numeric scores may be included in tiers, this indicates the tier scores available, and, shows those scores that should be numeric that have user entered alpha instead. We often see n/a or other non-appropriate data in numeric scores. 243
244 3. Summary of Defined Tiers. This table simply lists the tier scores that have been defined. It is intended as a reference/worksheet to review tier setup. 4. Graphical Views of Loaded Tests & Scores. These charts show a graphical overview of the tests and scores that have been loaded. 5. Summary of Manual Table Errors & Warnings. This table shows errors and warnings associated with user entry into the manual/parameter tables that manage Other Assessments displays and statistics. This table will show the table, the line from that table and a description of the warning or error that has been discovered. 6 Execution Buttons. At the bottom of the page, two buttons are provided that, when pressed, will initiate Pulse processing. These buttons are only available to administrative users of Pulse. - Refresh Error Display. If errors are present in the previous table, once corrected manually that table may be recalculated by pressing this button. Once processed, the browser page will need to be refreshed to view the results. - Run Other Assessments Project. We the entire Other Assessments project is ready to be run, clicking this button will run that project. Once started, this project will run for 15 minutes (small districts) up to two hours (large districts). While running, the user may perform other Pulse functions since it runs in the background. No indication of completion is provided, the entries from the process are being written into the Pulse Log. 244

245 Appendix IV Tableau with Pulse Outline *** This appendix will outline how to establish the relationshop between Tableau and Pulse prepared data. Note that this section is not intended as a manual for the use of Tableau. Please use the Tableau help and documentation for this type of support. The intent of this section is to outline how to access Pulse data from Tableau and perform basic data evaluation functions. Many Pulse users have also licensed the Tableau data management system. Tableau allows users to literally interact with Pulse data. As outlined in the Chapter Data Project Definition and Management of this manual and subsection "Page Content Tableau and External Web Pages, Tableau content may be directly mapped to Pulse pages. As background, the Pulse engine (described in detail in this manual) allows a developer to define and manage various information data tables that are generated by Pulse. These tables are used to support data displayed on Pulse User Pages. These displays may be in the form of data tables or graphical representations. Additionally, these calculated data sets may also be used to populated Tableau data views and models. New Pulse data tables may also be generated specifically to populate Tableau models. For this example, a Pulse table that evaluates NCLB Assessment Results will be used. We will assume that Tableau is currently installed and running on the user workstation. If this is not the case, please refer to Tableau documentation for information on installing Tableau. Once started, the following Tableau page is displayed: 245

246 1. The first step in the setup process is to link the Tableau model to the appropriate data source in Pulse. Any table in Pulse may be used to generate an interface to Tableau, or, new Pulse tables may be developed as Tableau interfaces. This example will address using the SISMAPStudentDataforInteractiveEvaluation table as a data source for Tableau. To start, click on the data option and select the Connect to Data option as shown in the example at the right. 2. After the Connect to Data option is selected, the popup displayed at the right is displayed. All Pulse tables are maintained in a Microsoft SQL Server database. Select that option from the provided list. Note at this time that Tableau may also be used to access data from several other data sources, Tableau is not limited to displaying simply Pulse data. 3. Once the Microsoft SQL Server option is selected, the popup at the right will be displayed. Use Step 1 in this display to select the Pulse DB Server and Database in use at your site as displayed in this example. Once the server/database is selected, assure that the password is properly set (this should normally be the system administrator s login to the SQL Server Database) and then click on the Test Connection button. A successful test is necessary to continue the process. 246

247 4. It is likely that there will be multiple databases loaded on the MS SQL Database Server. On step 4 of the process, and as indicated in the example at the right, select the appropriate database in which to access the Pulse data. It is likely to be named based on the District name followed by Pulse. For example, for XYZ School District the name will likely be XYZPulse. In this case, SISDemonstration was selected. 5. Once the database is selected, each of the tables contained in that database will be displayed in the table under Step 5. Initially select the SISMAPStudentDataforInteractiveEvaluation table for the initial review. Additional tables may be selected later. Once selected, in Step 6 an option is provided to rename the selected table for display in Tableau. Click the OK button to return to Tableau. Tableau will now load and display the selected table on the Tableau Main Screen as shown in the example to the right. Each field of the display will be evaluated. All alpha fields will be displayed in the Dimensions window at the top of the display and the numeric fields will be displayed in the Measures window at the bottom of the display. The data prepared by Pulse is now ready to be used interactively in Tableau. 247

248 Prior to using the model is may be appropriate to either Hide columns that will not be used, to rename some elements or to set default aggregation for some fields to make the interactive process work smoothly. To do this, right click on the field to be modified, select the appropriate function and follow Tableau prompts and instructions. See the displays to the right for examples. 248
 for the Math2009MapScale and CA2009MAPScale are set to Average.")
249 It is now time to use Tableau. While there are infinite ways to evaluate data using Tableau, start with the following simple review. First, make sure the default data aggregation (see previous section) for the Math2009MapScale and CA2009MAPScale are set to Average. Then drag and drop these two Measures to the Rows section as shown in the example below. Once this is done, drag and drop the Ethnicity Dimension from the Dimension window to the Columns area. The following breakdown of Math and CA Map Scores by ethnicity is immediately displayed. 249

250 Next, drag and drop the Gender dimension from the Dimension window onto the displayed graph. Immediately the breakdown between Male and Female scores will also be displayed. 250

251 Next, evaluate the raw data supplied by Pulse to the Tableau model. Click on Analysis as shown in the following example and then select View Underlying Data. The raw data from Pulse that created the view being evaluated is displayed in a popup window. These are simple examples of Tableau use and are not intended to be anything more than a quick starter kit to get started. Please reference the Tableau documentation for other ways to use Pulse data with Tableau. Also reference other sections of this manual for how to integrate Tableau generated content with Pulse content. 251

252 Appendix V Risk Analysis Setup Instructions The Tyler Pulse Risk Analysis sub-model provides a broad view of student risk. In general, this module samples data from throughout Pulse to create a very broad and detailed view of a student s risk to succeed. The approach used is to calculate risk points from each data area (such as grades, attendance, etc.) and then to summarize those points as an overall risk rating. Note that this model will vary somewhat from SIS to SIS that is supported by Pulse. So, note that it is not uncommon to see a field/column described in this documentation missing when the specific SIS in use does not support the data to generate that column/field. When Pulse is implemented, Pulse staff will set up risk category weightings to default levels. Each district using this model should then amend these risk weightings to be consistent with that District s priorities and needs. This is done using Pulse Manual Tables, essentially a parameter table. For example, one district may feel that low grades are a greater risk factor than poor attendance, and another district may take the opposite approach. Each risk category may be separately rated and scored in the overall calculation. It is also important to note that the risk score calculated is not significant until compared to that of other students. The risk scores are used to determine the students most to least at risk in a school. Since all of the score ranges are user managed, no specific score is deemed a threshold to a student being at risk. The following table shows an example of the Risk Analysis main page in Pulse. Note that there are several columns calculating a student s risk score in specific areas. Each of these individual scores is combined into an overall Risk Factor score. In some cases a calculated point total may be displayed as a negative number. In these cases, that sub-score is reducing the student s overall risk rating. For example, a gifted student is scored less at risk than other students. A student with a high GPA or high test scores will see their risk reduced while students with low GPA or test scores will receive a higher risk rating. 252

253 The Risk Analysis sub-model risk weights are defined in the ATRiskAnalysis table on the Pulse Manual Tables page. As shown in the example below, access that page from the Pulse Admin menu by clicking on the Manual Tables selection and then click on the pencil icon beside the AtRiskAnalysis manual table. The Manual table set up page will then be displayed as shown in the following example. Each weight is defined by Category. Note that when entering categories the spelling of the Category description must be exactly as indicated. Enter each category, the Multiplier (equivalent of weight) and other indicated data. Please refer to the manual table entry instructions in the Pulse Reference Manual for operations instructions. Note that the Multipliers (weights) are unique to each Category entered. Refer to the following overview of each category before changing or entering weights. NOTE THAT THE TOTAL RISK SCORE CALCULATED WILL BE THE TOTAL OF THE CALCULATED POINTS FOR EACH CATEGORY. IT IS CRITICAL TO CONSIDER THE SCORE THAT WILL RESULT FROM THE MULTIPLIER (WEIGHT) ON EACH CATEGORY. ATNAbsentPercent This category is based on the percentage of minutes enrolled that the student has been absent YTD. The ATNAbsentPercent may range from For planning, this factor will normally range from
254 ATNMissingMarks This category is the total number of absence marks on file for the student where there is no contact from the parent about why the student was absent. Note that for daily attendance schools these marks are taken once per day and for period attendance schools they are taken once per period. The ATNMissingMarks in a 180 day attendance schools can range from 0 to 180 in daily attendance schools and from 0 to 1,260 in a 180 day attendance period attendance school with seven periods in a day. For planning, this factor will normally range from 0 to 80 for period attendance schools. ATNConsecutive This category is based on the number of days that a student has been consecutively absent at the time of the calculation. The ATNConsecutive factor ranges from 0 to 10 for Multiplier 1 as well as for Multiplier 2. If the student has been consecutively absent for 10 or fewer days, Multiplier 1 is used, if greater than 10 days, Multiplier 2 is used. Tardies This category is based on the total number of tardies on file for each student. This category adds the number of points designated for each tardy. It can range from 0 to an unlimited number based on the student s activities. DISTotalEvents This category is based on the total number of discipline events on file for each student. The event type is not considered. The DISTotalEvents will range from 0 to the maximum number of events on a given student. Usually the maximum is around 40 but could be higher. DISActionDays This category is based on the total number of days that a student has been suspended. Both in school and out of school suspensions are combined. The DISActionDays can range from 0 to as high as 100 in some schools. DisEventType This category is based on the total number of discipline events that match the user entered discipline types entered on the ATRiskAnalysis Manual table. The range for this category may be from 0 to a high number based on the number of these types of events on a student s file. NCLBScore This category is based on the results for each student on the NCLB testing. The process used is if the student result is Below Basic, the value in Multiplier is used to add to that student s risk. If the student result is Basic then the value in Multiplier2 is used to add to that student s risk. If the result is Proficient then the values in Multiplier3 is used to add to that student s risk. It is normally assumed that a Proficient score has a value of 0 and does not add or subtract from the risk value. If the student result is Advanced then the value in Multiplier4 is used to REDUCE that student s risk. The NCLB Score range is based on the user s entries. NCLBImprovement This category is based on the improvement or loss in the total score a student receives on the NCLB test (both Math and Communication Arts are combined) from the current and past year. If a student has an improvement, this category reduces their risk score. If a student has a lower score in the current year by 5.1%, then the Multiplier is multiplied by 5.1 and the result added to their risk calculation. The NCLBImprovement will normally range from - 30% to 30%. 254
255 GradesGPA This option first calculates the average GPA for ALL students. Then, for each student above the average, the GPA difference above the average is multiplied by the Multiplier (in this case 15) and that number is subtracted from the Risk Analysis total since these students are above the average. For students below the average, the same calculation is made but the total is added to the Risk Analysis total. GRCurrentYearFs This option calculates the difference in GPA for the two most recent terms. It this multiplies that difference (may be negative or positive) by the Multiplier (in this case 50) and applies the result to the Risk Analysis total. FsCurrentYear This option determines how many Fs a student has been awarded in the current year. All term Fs are included, so for a 6 term school with 6 periods up to 36 Fs are possible. The total Fs are multiplied by the multiplier defined in the ATRiskAnalysis Manual Table. TranscriptFs This option determines how many Fs the student has in his/her transcript historical record. The total Fs found are multiplied by the multiplier defined in the ATRiskAnalysis Manual Table. NinthGradeFs This option determines the number of Fs the student was awarded in the ninth grade. The student transcript record is used for this calculation. The total Fs are multiplied by the multiplier defined in the ATRiskAnalysis Manual Table. Studies have shown that students failing classes in ninth grade are at HIGH risk of becoming dropouts. It is suggested that a relatively high number be applied to the multiplier for this category. The total Fs found are multiplied by the multiplier defined in the ATRiskAnalysis Manual Table. DISEventType This option counts the total number of discipline event types for each student that match the types entered in the Risk Analysis manual table. In this case, all events starting with either ISS, OSS or X are selected. The total is then multiplied by the Multiplier (in this case 15) and then added to the Risk Analysis total. Various Demographic Types Included are demographic analysis for LEP/ELL, Aid (Free & Reduced Lunch, Gifted, Title 1, Immigrant, Homeless and 504 Participation. Each of these options assigns (or reduces in the case of Gifted) if that flag is present on the student record. The number of points indicated for each option will be added. In the event the student is not assigned to that particular demographic area, no points will be added. Male This option allows males to be assigned a higher (or potentially lower via a negative entry) rating than females. This would be the case in a situation where a district believes that males have a higher possibility of dropout, even after other considerations are factored. This entry differs from those previously defined above. For this option, enter a decimal to indicate the percent to raise or lower the overall risk factor for Males. For example, entering a.01 will raise the overall Male risk totals by 1% after all other areas have been considered. Ethnicity In most risk studies, African-American (Black) and Hispanic students have shown to have higher dropout rates. In most cases, these tendencies will show up in the detailed ratings that have been discussed above. However, if a district believes that an added weight for students in these ethnic categories should be calculated, it is supported in this category. If an 255
256 added weight for Black students is desired, enter a line and the percent (for example.01) to raise the scores for Black students. If an added weight is desired for Hispanic students, do the same using Hispanic as the descriptor. This entry differs from those previously defined above. For this option, enter a decimal to indicate the percent to raise or lower the overall risk factor for ethnic areas. For example, entering a.01 will raise the overall ethnic risk totals by 1% after all other areas have been considered. Excluded Actions This option allows up to three specific types of discipline actions to be excluded when computing Action Days. For example, an action type may contain an action day for eating lunch alone. It may be desired to exclude this type of action from raising the student s risk ranking. 256

257 Appendix VI Single Login Synchronization with SIS Systems As detailed in the security section of this manual, Pulse provides full support for Active Directory and LDAP single login methodologies. Using these approaches, a user may log into a network and then dynamically bypass the Pulse login page. Beyond these systems, we have also developed specific login synchronization with specific SIS Systems where that approach is appropriate. To date, we support both Tyler SISk12 and the Zangle/Q Systems in this manner. The instructions for this support are as follows: Single Login with SISk12 Setup Instructions Tyler Pulse supports a single login process in conjunction with the SISk12 Student Information System provided by Tyler. This process allows a user that is logged into SISk12 to seamlessly click on a link in SISk12 and open their Pulse homepage without the need to log in a second time. There are two classes of users supported in this process, teachers and all other users. In the case of teachers, Pulse will automatically set up a teacher security definition when the teacher first requests Pulse access via the SISk12 link. Therefore, there is no reason to manually set up teacher passwords. For all other users, the security definition must already exist in SISk12 and the usercode for that user in SISk12 must match the usercode in Pulse for the link to be successful. If any error occurs in the transfer, the user is presented with the Pulse login page. The setup instructions for this process to be implemented is as follows: 1. A specific project, Adds and Updates SISK12 Teacher Accounts must be loaded into Pulse and set to run each night with the Parser. The loading process is as follows: From the Administrative menu select Data Transfers and then select Import. Using standard Pulse operations procedures import this project. The data project, once imported, should appear as follows: 257

258 2. The following entries must be made to the Web.Config file for Pulse: 3. These are the only steps required in Pulse. The second step involves setting up SISk12. To setup the process in SISk12, go to Management > District Level > District / Site / Year Setup > District Settings On the Main tab, enter the Pulse URL (the URL used at your district to logon to Pulse). Each user will then need to take the following steps On the Home Page, select Actions > Favorites. From Available Favorites on the right, select Pulse, then click Add. Click Done. Pulse will then display both on the Home Page Favorites panel as well as in the Favorites drop-downlist at the top of the screen. When the Pulse Favorite is selected, auto login to pulse will be initiated with the user s SIS username. The user must be already setup in Pulse. This uses a secure method that only passes user identity info through a secure web service. 258

259 Zangle SIS User Account Auto Login Pulse supports Zangle SIS user account auto. To enable the auto login functionality, add a new connection string called ZangleAuthDB to the Pulse web.config file that points to the Zangle database that contains the Zangle loginparms table. An example and the syntax of that string is as follows: On a Pulse Zangle site, to update user accounts into Pulse, first import the standard Zangle data files into the Zangle Pulse model. This is the same process as the normal Pulse setup. After this load, all records from the imported Zangle table ZZ SISTeachersAllData can then be loaded into pulse as teachers by creating then running the following Pulse SQL Script: The script requires only 1 line, but it must be entered precisely: ${p_loadzangleusers} This script may be added to the Pulse nightly process so that Zangle user accounts are regularly updated. Running this script will read all records in ZZ SISTeachersAllData and create Pulse teacher login accounts. If, after importing records for the first time, you want to change an imported user type from Teacher to some other kind of pulse user, make those account changes, and then check the Do Not Sync Account on that user s Account Setup form: Subsequently, only that user s password will be updated from Zangle during the Load Zangle Users process; all other changed settings will not be touched. 259
260 Zangle automatically logs users into Pulse based on the following detail: Zangle creates a record in its own loginparms table that contains a unique key, and a field called funiq. This field identifies the user requesting a login to Pulse. Zangle then opens the Pulse login page with a URL that contains the unique string as follows, where the ID originates from their loginparms table: When pulse processes this URL format, it connects to the Zangle Database (as specified by the ZangleAuthDB connection string) and attempts to find the matching record based on the ID value. If Pulse finds a matching record, it then attempts to locate the proper user in the ZZ SISTeachersAllData table where loginparms.funiq = ZZ SISTeachersAllData.InternalStaffID. If this record is found, then Pulse attempts to locate the data from the ZZ SISTeachersAllData.InternalStaffID.UserCode field in the Pulse Accounts table. If that matching account is found, then pulse automatically logs that user in. After a login attempt, pulse deletes the Zangle loginparms record. Pulse will write notification messages to the PULSE_EVENTS_LOG database if any unexpected issues occur during this process. To diagnose problems, make sure that pulse logging is configured. A successful Zangle login will be logged by an initial login record with no error records immediately following it: If the ID specified in the URL does not exist in the Zangle loginparms table, you ll see the following error: Note, whenever the autologin fails, a user is simply brought to the Pulse login page so that the user may login manually. If the ID exists in the Zangle loginparms table, but no matching user is found in the ZZ SISTeachersAllData table, then the following error is logged: If the ID exists in Zangle loginparams, and a matching SISTeachersAllData record is found, but the Load Zangle Users script has not been run during nightly processing to properly set up the Pulse user accounts, then the following error is logged: 260
261 If the ZangleAuthDB connection string is incorrectly or not yet configured, the following message is logged: 261
262 Appendix VII Manual Table / Customer Responsibilities The models that have been created and provided to customers to support various US states and various application systems use Pulse Manual Tables (Parameter Tables) for managing and storing various parameters that control Pulse processing. In all cases, Pulse technical staff will initially populate these tables using data/information provided by each customer when Pulse is first implemented. After the initial implementation, it is each customer s responsibility to keep these tables populated with current information. There are two triggers that should be noted to know when a manual table needs to be updated. 1. When key information changes. For example, a school is closed or opened; when processing rules change or other key actions need to be taken the tables need to be updated to reflect these changes. 2. Several tables are school year based. At the beginning of each school year several data fields need to be updated. For example, the date ranges for each term of the school year. When reviewing changes that need to be maintained for your Pulse implementation, please contact Pulse Support if you have any questions. Please reference the Manual Tables section of this manual under the Other Administrative Functions chapter for instructions on how to use Pulse Manual Tables. 262
263 Pulse User Managed Tables There are several tables that may need to be maintained. These include: 1. AtRiskAnalysis This table contains default settings for computing student at risk rankings. 2. OAOtherAssessementAYPSelection This table contains default settings for managing other assessments tests and scores. 3. ConsolodatedReporting This table allows assessments from Other Assessments to be identified as Benchmark Assessments. 4. ExcludeResidenceCodes This table allows a district to exclude certain residence codes when calculating enrollment. 5. EnSchoolTable Contains information about each active school in the District. 6. EnDistrictTable Contains information and defaults settings for the District. 7. Terms This table contains terms settings and term date ranges. 8. SISMapScoreLevelCutoffs - This table contains current year cutoffs for below basic, basic, proficient and advanced rankings for MAP. This table is used in Missouri only. 9. GradRequirements This table contains the graduation requirements for the District. 10. GRCourseAnalysis This table allows the definition of specific courses and course orders for evaluation of student success taking those courses. The detail instructions for maintaining these tables are as follows: 1. AtRiskAnalysis This table is described in detail in Risk Analysis Appendix of this manual. 2. OAOtherAssessmentAYPSelection - This table is described in detail in the Other Assessments Appendix of this manual 3. ConsolodatedReporting - This table is described in detail in the Other Assessments Appendix of this manual. 4. ExcludeResidenceCodes This table allows a district to exclude certain residence codes when calculating enrollment. This table is used only by users of the SISk12 Student Information System. Enter up to five residence codes that are to be excluded in calculations. 263

264 5. ENSchoolTable The Pulse ENSchoolTable defines each school in the school district. As a part of this definition, several parameters are available to define how Pulse will treat each particular school during its calculations. Because the ENSchoolTable is quite wide (large) its contents will be defined in sections. SchoolNumber This is the school number of the school used in the student information system. SchoolName This is the name of each school that will be used in Pulse. Note that this name is usually entered in somewhat of an abbreviated form so that columns showing school data will not be excessively wide in Pulse. This should be a key consideration when entering names. SchoolIndex The school index is used in Pulse in several locations to control ordering. It is suggested that the ordering be assigned as follows, however, no specific ordering is mandated: 1. Enter all elementary schools in alphabetical order beginning with Enter all middle schools in alphabetical order beginning after the elementary schools. 3. Enter all high schools in alphabetical order beginning after the middle schools. 4. Enter all other schools in alphabetical order beginning after the high schools. Note that when new schools are entered they should be entered with a school index indicating the above ordering logic. The entry order in the file is NOT significant. Only the school index code is significant. SchoolCode The School Code should be the same as the School number. StateSchoolCode StateSchoolCode is used only when the state assigned school number (used in assessment distributions) is not the same as the student information school number. If this is not the case, leave this column blank. TestingSchoolName Enter only when the Testing School Name varies from the locally used school name. It is highly unusual that this column is used. SchoolType Enter any school type desired, however, make sure and stay consistent since this type will be used by Pulse for calculating statistics by school type. For example, use ES for elementary schools, MS for middle schools, HS for other schools and AS for alternative schools and OT for other types of schools. SchoolGroup While the name may be misleading, enter the attendance percentage goal for this school. Enter.95 if the attendance goal is 95%. Site This field is used when there are multiple sites that make up a single school. This is very unusual except for SISk12 users. When sites are not used, enter the school number into this field. This is a MANDATORY field. 264

265 ENSchoolTable Part 2 Site This field is used when there are multiple sites that make up a single school. This is very unusual except for SISk12 users. When sites are not used, enter the school number into this field. This is a MANDATORY field. Site2 Pulse supports up to 10 total sites in each school. Enter the second site for the school, if appropriate. Otherwise, leave this column blank. Site3 Pulse supports up to 10 total sites in each school. Enter the second site for the school, if appropriate. Otherwise, leave this column blank. Site4 Pulse supports up to 10 total sites in each school. Enter the second site for the school, if appropriate. Otherwise, leave this column blank. Site5 Pulse supports up to 10 total sites in each school. Enter the second site for the school, if appropriate. Otherwise, leave this column blank. Site6 Pulse supports up to 10 total sites in each school. Enter the second site for the school, if appropriate. Otherwise, leave this column blank. Site7 Pulse supports up to 10 total sites in each school. Enter the second site for the school, if appropriate. Otherwise, leave this column blank. Site8 Pulse supports up to 10 total sites in each school. Enter the second site for the school, if appropriate. Otherwise, leave this column blank. Site9 Pulse supports up to 10 total sites in each school. Enter the second site for the school, if appropriate. Otherwise, leave this column blank. AlternativeAttendance This field is used only by users of the SISk12 student information system. If not using this SIS, then please leave this column blank. If the school is using the SISk12 Alternate Attendance method, enter a Y or a Yes into this field. 265

266 ENSchoolTable Part 3 SchoolType2 In part I of the ENSchoolTable the primary SchoolType was defined. It is possible, however, that a school is reported simultaneously in multiple school types. For example, a school may be an elementary school ES but also categorized as a XX school because a new type of curriculum is being used in that school. The district may want to report dynamic groups of schools based on this or any other desired reason. Up to five school types may be supported for each school. While unusual, enter school types 2-5 into these fields. SchoolType3 See explanation above. SchoolType4 See explanation above. SchoolType5 See explanation above. IncludeInADA Enter a Yes or No depending on if this school is to be included in district wide ADA calculations. TermSchedule Enter the term schedule used in this school from the GRTerms table. AlternativeSchedule Enter a second term schedule from the GRTerms table if appropriate. GLCode Used only for Financial Implementations and defined in that section of this manual. If not using Financial Pulse models, leave this column blank. HRLocationCode - Used only for Payroll/HR Implementations and defined in that section of this manual. If not using Payroll/HR Pulse models, leave this column blank. AlternativeSchool Not used at this time. AlternativeAttendance Not used at this time. Title1100Percent If this school is coded as Title I 100% participation, enter a Y or Yes into this column. 266
267 6. ENDistrictTable The Pulse ENDistictTable defines specific parameters for the district. These parameters are used by Pulse in detailed model calculations. Because the ENDistrictTable is quite wide (large) its contents will be defined in sections. DistrictName Enter the district name. DistrictDoNotUseMOSISID This field is used ONLY by users of the SISk12 student information system. If the MOSIS ID is not being used as the Student ID, enter a N, otherwise enter a Y. DoNotUseTheSISk12AttMinutes - This field is used ONLY by users of the SISk12 student information system. If the attendance minutes method of attendance are not used, enter a N, otherwise, enter a Y. PercentforFullDay - This field is used ONLY by users of the SISk12 student information system. Enter the percentage of the day required to be considered for full time attendance. PercentforHalfDay - This field is used ONLY by users of the SISk12 student information system. Enter the percentage of the day required to be considered for half day attendance. SISID This field is not currently in use. State Enter the initials of the state in which the school district is located. DefaultMinutesforFullDay - This field is used ONLY by users of the SISk12 student information system. Enter the number of minutes of attendance needed to be considered in attendance for a full day. UseDefaultMinutes - This field is used ONLY by users of the SISk12 student information system. Enter a Y if minutes are used to calculate attendance. DistrictADAGoal Enter the percentage ADA goal of the district. Enter 95% as.95. SchoolStartDateYYYYMMDD Enter the school start date in YYYYMMDD format. For example enter September 22, 2010 as ENFamilyMemberThreshold Enter the threshold of the number of family members (students in a family) to use for exception reporting. LtrGrades Enter a Y if letter grades are used by the district and a N if numeric grades are used. LoadTeachersASAdminYN - This field is used ONLY by users of the SISk12 student information system. Enter a Y if teachers are to be loaded as Administrators. This would be a HIGHLY unusual request. SIS Enter the name of the SIS being used. ExcludePK Enter a Y or Yes if Grade PK students are not counted as a part of ADA. 267

268 7. Terms An example of the Terms Manual Table is displayed below. For each school district, up to sixteen terms may be defined for each term schedule. Term Name Term Names are used within Pulse, they must be S1, S2, T1, T2, T3, T4. StartDate This is the start date of the term. It must be entered in mm/dd/yyyy format. EndDate This is the end date of the term. It must also be entered in mm/dd/yyyy format. TermOrder. This is the order that you wish the terms to be displayed on Pulse User pages. SISTermIndentifier - This is the term name used in the student system to define the term, it must match the student application definition of a term. TermSchedule This is the schedule for the term as defined in the student system. Some school districts have term schedules that vary by school, by school type (MS, ES, and HS) or even within a school. Any number of Term Schedules may be defined. Note that the order of the entries is not significant. 268

269 8. SISMapScoreLevelCutoffs These are the cutoffs for current year MAP Scores for to determine student levels. This table is used only in Missouri. Note that Pulse will build this table using the state supplied cutoffs automatically if this table is empty. Fill in entries on this table on if you wish to override the cutoff scores provided as defaults in Pulse. TestYear Enter the most recent test year. Test Category Enter exactly either CA or Math BasicBottom Enter the lowest score to be considered Basic. Basic Enter the highest score to be considered Basic. Proficient Enter the lowest score to be considered Proficient. Advanced Enter the lowest score to be considered Advanced. AdvancedTop Enter the highest score to be considered Advanced. GradeLevel Enter the grade level including the leading 0 for each grade level being tested. 269

270 9. GradRequirements The Graduation Requirements table defined the graduation requirement for the district. The field definitions for this table are as follows: DptCode This is the department code used in the student system and must match exactly. Department This is the department name that you want to use for displays within Pulse. MinCredit Enter the minimum number of credits required for graduation for this department. GradPlan Multiple GradPlans may be entered. Enter the grade plan from the student system associated with the department and credits entered. Note that the order of entry is not significant. 270

271 10. GRCourseAnalysis - This table allows the definition of specific courses and course orders for evaluation of student success taking those courses. Course Analysis will allow a school district to analyze how students perform on selected assessments based on various combinations of courses. For example, do students who take geometry and then algebra do better in pre-calculus vs. students who take algebra first and then geometry. Course analysis allows for sequential comparisons such as the example above or comparison of any grouping of courses regardless of order. Manual Table: GRCourseAnalysis o Analysis Number: A number representing that particular analysis grouping. o Analysis Label: Corresponds to analysis number. A label for the displayed tables identifying the analysis purpose. o Group Letter: A, B, C, etc. Identifying the different comparison groups. o Course1, Course2, Course3, Course4: The course number. These are the courses the student has taken that make him/her part of the subgroup. For sequential analysis the courses must be listed in the order in which the student took the courses. o Comparison Course: Course Analysis allows for comparison to either another course such as Pre-Calculus in the above example. The course number of the course being used for comparison is entered here. o Assessment Strand and Assessment Score Type: Course Analysis allows for comparison to tests that are part of other assessments. o AnalysisType: Two choices: ANY or SEQ. Any- students can take the courses in any order. SEQ - students took the courses in the order listed in the table. GRCourseAnalysis table: o Provides the list of courses compared to the final course or assessment. o Provides the average score or letter grade for the comparison course or assessment. o Link lists all students and their individual score or letter grades that make up that individual analysis. Limits o Unlimited as to number of analysis. o Unlimited as to number of subgroups within an analysis o Courses are limited to a max of four per comparison subgroup o Each analysis can be either seq or any. Not both. The same type must be listed for all rows for that analysis. o Analysis can be for against another course or assessment. Not both. 271

272 Appendix VIII Setup Processes for the Tyler Munis Financial Models Tyler provides an extensive Information Model to support the Munis Financial and Human Capital applications. Generally, this model acquires its source data directly from the Munis database. This collected data includes numerous parameter and setup files that are maintained by Munis. While each of these acquired files are used to determine the Pulse setup parameters, there are several other parameter tables, managed as Pulse Manual Tables, that must be established prior to running the Pulse Munis Models. This section outlines each of these tables and how they are used in the Munis Model. Please refer to the Pulse Manual Tables section of this manual for the operating instructions used to enter and maintain data in manual tables. Note also that these are onetime setup tables. 1. ENSchoolTable The ENSchoolTable is normally used by school districts when a Pulse SIS Model, such as TEMS, SISk12 or PowerSchool, is in use. When these models are used in conjunction with the Munis Models, it is necessary to define the school numbers used in Munis and relate them to the school numbers used in the SIS. In many cases they are the same, but this cannot be assumed. On the ENSchoolTable in the Pulse Manual Tables enter the following for each school that is defined: a. The Internal School Number of the school used in the SIS System. b. The code for that school used in the general ledger account code. As an example, most schools are also departments. Enter the department number of the school in the financial system. c. The code for that school used in the Munis HR Module as the work location. Usually, this code is the same as the department number entered in b. above, however that is not always the case. 272

273 2. HRLeaveHotDates In the Munis HR Model, there is an employee leave tracking function that tracks when employees take leave. This function evaluates when an employee takes a single day of leave and when that leave was taken. A concept called Hot Days is used to determine when employees may be abusing their leave privileges. A Monday and a Friday is ALWAYS a hot date. However, each organization (school district, city, county, etc.) may also designate other key dates to be tracked. For example, a day before and after a holiday. Any number of dates may be defined, there are two defined in the following example. a. FiscalYear - Enter the Fiscal/Calendar year for the date. Pulse will interrogate the fiscal year being used by Munis and use this entry only when the fiscal year entered equals the current fiscal year defined in Munis. b. DateYYYYMMDD - Enter the date to be tracked in the YYYY-MM-DD format. c. Description - Enter a description for the date entered. 273

274 3. MunisDepartmentSelection The Pulse Munis models perform extensive evaluations on the departments in the financial system. Note that in this example, department is being used as a generic term. In the models, a department could be a location, area or some other defined name. Pulse makes the adjustment to these defined names interactively. For Pulse to do the proper designation of departments it is necessary for it to know the segment of the account number that is used to designate the department and/or the school. This table defines that information. ON THIS TABLE ENTER ONLY A SINGLE ROW OF DATA. a. EnterDepartmentSegment Enter the segment in the general ledger account number that contains the department number. This will always be in the format Segment#. b. EnterSchoolSegment If the organization is a school district, also enter the school segment number. Leave this blank in local government implementations. Most often, the department and school segment numbers are the same, but this is not always the case. c. EnterUndistibutedCode Enter the actual department number that is used in Munis when a transaction is not directly associated with a department. 274

275 4. MunisLocationtoDepartmentExtension In Munis, a Location Number is maintained by the HR Module and a Department Number is maintained in the financial applications. Normally, these numbers are the same. When this is the case, the Pulse Munis Models accurately associate Locations to Departments. However, these numbers may be different, or, there may be a limited number of variances. Also, there may be location codes that are not associated with Departments in the Munis setup tables. In this table, define the relationship between the Work Location and Departments when a direct correlation does not exist. In the example below, there are four Locations that, in Munis, are not associated with Departments. They have each been manually associated with the non-departmental codes (see #3 above). a. Location Code Enter the Location Code used by the Munis HR Model. b. Department Code Enter the Department code to be used in association with the entered Location code. 275

276 5. Organization Defaults To support various model functions in the Pulse Munis Model, there are a number of organization defaults that are used to delineate data. Enter these defaults into this table. Make sure to spell the descriptions in the exact way displayed. a. City Enter the city in which the school district, county or city is located. b. State Enter the state in which the school district, county or city is located. c. ZipCode Enter the zip code of the central office. d. CodeLocation When displaying the Job Class, Bargaining Unit and Work Location on Human Resource pages, we combine the code for these areas with the description for display purposes. Some organizations will prefer the code to be listed before the name, 1234 Transportation Department and others will prefer the code to be listed after the description, Transportation Department The code will default to being listed AFTER the description. If it is desired that the code be before the description, enter the CodeLocation line and enter Before into the Entry column. 276

277 6. TrackingAccounts In the Munis Financial Model, we provide a function that allows a manager to track the GL activity into a GL Account or GL Object code in great detail. For example, a manager may want to get a handle on expenditures for consulting activities. If so, the object(s) or account code(s) representing consulting activities could be entering into the TrackingAccounts Manual Table. Pages in the Pulse models then provide extended information in these areas. a. Category Enter a category for the tracking to be performed. This is a key field that usually indicates then individual manager or group of managers tracking the entered information. b. AccountCode Enter a specific Account Code to be tracked. The entry must match exactly the account codes being used in Munis. c. ObjectCode Enter an object code to be tracked. When an object code is entered all account codes containing that object code are tracked in summary. DO NOT ENTER AN ACCOUNT CODE AND OBJECT CODE ON THE SAME LINE. 277
278 7. DeptSecurityFinancials This table is used to define up to ten Budgeting Rollup Codes associated with each department. This relationship is established so that Departmental Users may be restricted to view only those GL accounts defined within the Rollup code(s). The departmental user will then be given access to a selected group of pages who s, while appearing similar to other Financial pages, content has been limited. A Departmental User role will also have to be defined in Role Setup. a. Department Number Enter a Munis Department Number. This entry must match exactly the department numbers used in Munis. b. Rollup Code 1-10 Enter up to ten unique Munis Rollup codes for each department. After defining the DeptSecurityFinancials table, define an Inclusive Role for Departmental Users. 278


279 Next, enter Page Setup and select the new role for any pages that the Departmental Users should be granted access to. The image below is the Page Setup of Departmental Financial Home. Most likely, any page linked from Departmental Financial Home would be included. Furthermore, all Payroll and HR pages have department security built in. Access may be given to any and all Payroll/HR pages at each client s discretion. The following is a list of the pages on the Departmental Financial Home Page that, at a minimum, need to be associated with the Departmental Users Inclusive Role. 279
280 Appendix IX Pulse System Recommendations and Guidelines This section outlines the System Recommendations to install and operate Pulse Version and higher. Please keep in mind that these are our recommendations and to be used as guidelines for purchasing new hardware or aligning existing system resources to host our product. In most cases, clients are likely to utilize existing hardware, such as their student system, to host our product as it generally requires a small foot print for hardware requirements. The following diagram outlines possible deployment scenarios for deploying our product within your organizations current infrastructure. Tyler Pulse Hardware Deployment Options Tyler Technologies staff is available to review any hardware quote prior to purchase to ensure the configuration will meet the needs of the specific Tyler products being purchased. Tyler Pulse resources are also available to review options for deploying our product on top of your existing server infrastructure. Trusted Network Existing Web & SQL Server Intranet Users Deployment Option #1 Standalone - Shared ` Pulse ONLY Web & SQL Server DMZ Deployment Option #2 Standalone - Dedicated External Web Site Firewall Deployment Option #3 Multi-Tier - Shared Shared Web Server (Multiple Web Sites) Shared SQL Server (Multiple App Databases) Deployment Option #4 Multi-Tier - Dedicated Dedicated Web Server (Pulse Web Sites Only) Dedicated SQL Server (Dedicated to Pulse databases) 280
281 Tyler Pulse System Recommendations In general, Tyler Technologies will support Tyler Pulse running on versions of Operating Systems and Databases that are supported by their manufacturer. If a specific OS or Database version has been discontinued, installation services and support on the particular platform will be limited. The following Operating Systems and Databases are supported for the Tyler Pulse product. If there are any questions regarding your current OS version, please contact your onsite I.T. staff for further review of your server s system specifications. Tyler Technologies currently recommends Windows Server 2008 R2 and SQL 2008 R2. Supported Operating Systems 64 bit - Microsoft Windows Server 2008 R2 Standard & Enterprise 32 and 64 bit - Microsoft Windows Server 2008 Standard & Enterprise 32 bit - Microsoft Windows Server 2003 & 2005 R2 Standard & Enterprise 32 bit - Microsoft Windows Server 2003 & 2005 Standard & Enterprise Supported Databases 32 and 64 bit Microsoft SQL Server 2008 R2 Standard & Enterprise 32 and 64 bit - Microsoft SQL Server 2008 Standard & Enterprise 32 and 64 bit - Microsoft SQL Server 2005 Standard & Enterprise Supported PC Web Browsers Generally, any marketplace browser may be used with Pulse. Currently, the supported browsers for the Pulse product are listed below: Microsoft Internet Explorer Mozilla Firefox Chrome Safari & Safari for the ipod or ipad 281
282 Sample Server Recommendations Pulse Server Sample Software: Pulse, IIS, SQL Server Example Server Model: DELL PowerEdge R710 Hardware Specifications 1-2 Quad Core Intel 2.0+ Ghz 8-16 GB RAM GB 2.5" SAS SCSI 10k RPM 64-bit Windows Server 2008 R2 Standard 64-bit Microsoft SQL Server 2008 Standard 120+ GB available disk space (Pulse Databases, logs, and data file storage ONLY) Disk Space Recommendations These disk space recommendations are for the management of Pulse data files and databases only. They do not include the disk to support operating system, server requirements or for other application system software residing on the same server. Categ ory # of Students Disk Space SIS Only A up to 5, GB 5,000 to B 25, GB Disk Space SIS & Finance up to 100GB up to 200GB C 25, GB+ 200GB+ Virtualization & Tiered Deployment Tyler Technologies supports a multi-tiered or virtual environment for hosting the Tyler Pulse product. Most virtualized installations will require customized hardware configurations. A supported multi-tiered setup would include Tyler Pulse executables on a Web Server and the database residing on a separate Database Server. Along with a distributed Web and Database server configuration, the web component of Pulse may be hosted in a load balanced web server type configuration. Please contact a Tyler Pulse support representative for further discussion and assistance with your hardware configuration. * Tyler Technologies currently does not offer any training or installation services for the VMWare Infrastructure product or the Microsoft Hyper-V virtualization product. 282
283 Deployment Considerations Key considerations to be aware of when planning Tyler Pulses hardware implementations include: 1. Public Access: If the District plans to include making Tyler Pulses content available to users outside of the District s network (via https Internet access), the security of the student data managed by Tyler Pulses should be considered. While running Tyler Pulse and its database on one server is supported, configuring Tyler Pulses on a web server accessing the data on a second server behind a firewall should be considered. This is also a consideration for non-internet implementations. 2. Server Support: To provide adequate support levels, Tyler Staff requires remote desktop access to all Pulse servers at each customer site. The hardware requirements for the Tyler Pulse product are quite flexible and are significantly less than what would normally be expected by traditional data/information warehouse systems. This is predominately based on the following: - Tyler Pulses generally acquires raw data from supporting systems (Student Information and State NCLB Testing at a minimum) during non-working hours. - Virtually all information (user statistics and displayed data) calculated by Tyler Pulses is generated at the time of data acquisition for subsequent customer use during the following day. - During daily processing, most of the significant processing work has already performed during off hours. During online processing, processor and memory loads are significantly minimized. Shared Servers with Other Applications Many Tyler Pulse sites will choose to implement Pulse on servers that are in existing use with other application systems. Assuming that sufficient resources are available on those shared web and/or database servers, this is often a good option. Because Pulse is designed to organize and prepare data during off-business hours, it uses significant resources during those off hours when those resources are readily available. During business hours, when resource availability is at a premium, Pulse uses significantly less computer resources because its data has been organized the previous evening. Users of Tyler Student Information Systems and Tyler Financial Systems usually find sharing severs a good option. Users of other systems may also find sharing servers an option, however, in both cases the availability of resources must be closely evaluated prior to this decision. If this is an option being considered, please contact Tyler Pulse support staff. We will work with your technical staff to assure that the planned configuration is appropriate for implementing Pulse at your facilities. 283

284 Appendix X Security and Management Setup Guide Tyler Pulse provides data security via two primary methodologies. These are field level security and via traditional user roles. These capabilities are defined in detail in the Pulse Reference Manual. Please refer to that manual for a full review of all Pulse features. This document addresses only the general setup of end user security in the standard Pulse Student and Munis models. It does not address all of the security functions that may be optionally applied. Access the Pulse Administration Menu by clicking on Administration on the Pulse Left Menu. See example at right. Access the Pulse Account Setup page by clicking on that link on the Administration Left Menu. See example at right. Once on the Account Setup Page the option to add a new user, search for existing users and Importing security logins from an external file. See the Pulse Reference Manual for instructions on importing Pulse logins. Searching for Existing Users. 1. To see a list of ALL users, click the search button. 2. To search for a specific user, type in a part of their name or usercode in the name field and click the search button. All users matching that partial entry will be displayed. 3. To search by user type, select the user type from the pulldown provided and click search. The user type search may be used in conjunction with partial name or login searches. 284
285 Security Setup The primary purpose of this document is to review the direct setup of user security in standard Pulse models. The following instructions will be the same for both the entry of new users as well as updating security on current users. The following is an example of the Pulse User Setup Dialog. User Information: 1. Username. Enter the username that the user will use at login. The username is the internal key to the security definition and may not be changed after entered. To set a user up with a new user code, delete the existing record and enter a new one. User Type. Pulse users may be set up as root users, administrator or as user. In most implementations, the administrator option is not needed so we will not address it in this discussion. If the user being entered will have responsibility for managing user logins or performing Pulse Development, use the root user type. For ALL other users, use the User user type. 2. Active Directory and LDAP. If Active Directory or LDAP are in use, enter this information, otherwise, skip these fields. 3. Enter the user s First and Last Name. 4. Enter the user s initial password. Once the user uses this password to login, they may change their password at any time. 5. Click this button if this user is to be forced to change their password when they initially login in. 6. Enter the user s address. This is an optional field. It is needed only when data alerts are being distributed to users. 7. Enter the users start page. In this pull-down, Pulse will list all of the Pages that are included on the Pulse Left Menu for your organization. However, all Pulse modes provide a primary home page for use with that model. Select the appropriate home page (landing page) for this user. For example, this 285
286 user may have access to three models, Student, Munis and Versatrans. However, if they are PRIMARILY a user of the student system, select the student system home page. Make sure to select the home page for the Pulse model most used by this user. 8. Allow Custom Filtering. Some users will have access to more than one school, department or location. For example, a superintendent will have access to all schools; other users may have access to only two or three schools. If the user being defined has access to more than one school, click the Allow Custom Filtering click box. If not, do not click this box. 9. Do Not Sync Account. This box is used only for users of specific Student Information Systems. If these systems are used, teacher logins are synchronized every night with the student information system logins. Any user designated as a teacher is synchronized automatically. If a specific user should NOT be synchronized, click this box. 10. Top Menu. Each Pulse Top Menu that has been defined for your organization is listed. The square click box is used to designate the top Menus that this user may access. For example, if this user may access only the student system, click only that option. Select the appropriate options. Do not click any options if the user is a teacher. The circle click area is used to designate the Top Menu that will be displayed at login for this user. As with the start page, make sure to select the Top Menu that this user uses most often. 11. User Roles. Pulse standard models use a single role, Teachers. So if the user being defined is a teacher, click the teacher role, if not, do not click roles. Please see the Pulse Reference Manual for information about the setup and use of addition roles if they are used. 286
287 12. User Filters. User filters are used to control what data that an end user may view. The approach used by Pulse to support viewing is that all users are able to view general statistical data. For example, if a principal sees that their average attendance is 95%, it is far more meaningful to see how that performance compares to other schools. However, when viewing student specific data, that principal may only be allowed to view students enrolled in their school. School, Department and Location User Filters. Each of these filters work in the same way and will be discussed in a single dialog. As definition, Department and Location are used only in the Pulse Munis model. Department may be used to restrict a user s view of financial data by department. Location is used to restrict the user s view of Payroll and Human Resource data by Pay Location. The School filter is used to determine what school data that a user may view. Enter the value field as follows: 1. If the user may view a single school, enter the school number for that school. 2. If the user may view two or more schools, but not all schools, enter the schools that viewing is allowed separated by a colon. 3. If the user may view all schools, leave the value column blank. 287
288 The Default column is used to define the school, department or location displayed to the user at login. If the user may see a single school, this is an easy decision. If they can view more than one school, enter the primary school they view in this entry. If the user s default view is to be an organization wide view (for example the totals for the district as a whole) enter the following: a. For School enter This designates district wide data. b. For Department and Location, enter OW. This designates organization side data. Enter the Default field as follows: 4. If the user may view a single school, enter the school number for that school. 5. If the user may view two or more schools, but not all schools, enter the primary school for viewing. 6. If the user may view organization wide data, enter 9999 or OW in the default column as described above TEACHERS For Teachers, the only entry required is to enter the Teacher ID number from the Student Information System into the Value field. 288

289 Examples: In summary, see the following three examples: 1. End user able to view a single school, for example a Principal: 2. End user able to view multiple, but not all schools: 3. District Wide user with access to all schools, for example district staff: 4. A Teacher: 289
DiskPulse DISK CHANGE MONITOR
 DiskPulse DISK CHANGE MONITOR User Manual Version 7.9 Oct 2015 www.diskpulse.com [email protected] 1 1 DiskPulse Overview...3 2 DiskPulse Product Versions...5 3 Using Desktop Product Version...6 3.1 Product
Finance Reporting. Millennium FAST. User Guide Version 4.0. Memorial University of Newfoundland. September 2013
 Millennium FAST Finance Reporting Memorial University of Newfoundland September 2013 User Guide Version 4.0 FAST Finance User Guide Page i Contents Introducing FAST Finance Reporting 4.0... 2 What is FAST
MAS 500 Intelligence Tips and Tricks Booklet Vol. 1
 MAS 500 Intelligence Tips and Tricks Booklet Vol. 1 1 Contents Accessing the Sage MAS Intelligence Reports... 3 Copying, Pasting and Renaming Reports... 4 To create a new report from an existing report...
Results CRM 2012 User Manual
 Results CRM 2012 User Manual A Guide to Using Results CRM Standard, Results CRM Plus, & Results CRM Business Suite Table of Contents Installation Instructions... 1 Single User & Evaluation Installation
Microsoft Office. Mail Merge in Microsoft Word
 Microsoft Office Mail Merge in Microsoft Word TABLE OF CONTENTS Microsoft Office... 1 Mail Merge in Microsoft Word... 1 CREATE THE SMS DATAFILE FOR EXPORT... 3 Add A Label Row To The Excel File... 3 Backup
How To Create A Powerpoint Intelligence Report In A Pivot Table In A Powerpoints.Com
 Sage 500 ERP Intelligence Reporting Getting Started Guide 27.11.2012 Table of Contents 1.0 Getting started 3 2.0 Managing your reports 10 3.0 Defining report properties 18 4.0 Creating a simple PivotTable
Import and Export User Guide. PowerSchool 7.x Student Information System
 PowerSchool 7.x Student Information System Released June 2012 Document Owner: Documentation Services This edition applies to Release 7.2.1 of the PowerSchool software and to all subsequent releases and
Advanced Excel 10/20/2011 1
 Advanced Excel Data Validation Excel has a feature called Data Validation, which will allow you to control what kind of information is typed into cells. 1. Select the cell(s) you wish to control. 2. Click
Avaya Network Configuration Manager User Guide
 Avaya Network Configuration Manager User Guide May 2004 Avaya Network Configuration Manager User Guide Copyright Avaya Inc. 2004 ALL RIGHTS RESERVED The products, specifications, and other technical information
ithenticate User Manual
 ithenticate User Manual Updated November 20, 2009 Contents Introduction 4 New Users 4 Logging In 4 Resetting Your Password 5 Changing Your Password or Username 6 The ithenticate Account Homepage 7 Main
2/24/2010 ClassApps.com
 SelectSurvey.NET Training Manual This document is intended to be a simple visual guide for non technical users to help with basic survey creation, management and deployment. 2/24/2010 ClassApps.com Getting
Unleash the Power of e-learning
 Unleash the Power of e-learning Version 1.5 November 2011 Edition 2002-2011 Page2 Table of Contents ADMINISTRATOR MENU... 3 USER ACCOUNTS... 4 CREATING USER ACCOUNTS... 4 MODIFYING USER ACCOUNTS... 7 DELETING
Tips and Tricks SAGE ACCPAC INTELLIGENCE
 Tips and Tricks SAGE ACCPAC INTELLIGENCE 1 Table of Contents Auto e-mailing reports... 4 Automatically Running Macros... 7 Creating new Macros from Excel... 8 Compact Metadata Functionality... 9 Copying,
ithenticate User Manual
 ithenticate User Manual Version: 2.0.2 Updated March 16, 2012 Contents Introduction 4 New Users 4 Logging In 4 Resetting Your Password 5 Changing Your Password or Username 6 The ithenticate Account Homepage
EzyScript User Manual
 Version 1.4 Z Option 417 Oakbend Suite 200 Lewisville, Texas 75067 www.zoption.com (877) 653-7215 (972) 315-8800 fax: (972) 315-8804 EzyScript User Manual SAP Transaction Scripting & Table Querying Tool
Aras Corporation. 2005 Aras Corporation. All rights reserved. Notice of Rights. Notice of Liability
 Aras Corporation 2005 Aras Corporation. All rights reserved Notice of Rights All rights reserved. Aras Corporation (Aras) owns this document. No part of this document may be reproduced or transmitted in
Creating and Managing Online Surveys LEVEL 2
 Creating and Managing Online Surveys LEVEL 2 Accessing your online survey account 1. If you are logged into UNF s network, go to https://survey. You will automatically be logged in. 2. If you are not logged
Scheduling Software User s Guide
 Scheduling Software User s Guide Revision 1.12 Copyright notice VisualTime is a trademark of Visualtime Corporation. Microsoft Outlook, Active Directory, SQL Server and Exchange are trademarks of Microsoft
Simply Accounting Intelligence Tips and Tricks Booklet Vol. 1
 Simply Accounting Intelligence Tips and Tricks Booklet Vol. 1 1 Contents Accessing the SAI reports... 3 Running, Copying and Pasting reports... 4 Creating and linking a report... 5 Auto e-mailing reports...
SAP BusinessObjects Financial Consolidation Web User Guide
 SAP BusinessObjects Financial Consolidation Document Version: 10.0 Support Package 18 2016-02-19 SAP BusinessObjects Financial Consolidation Web User Guide Content 1 General user functions....12 1.1 To
Abstract. For notes detailing the changes in each release, see the MySQL for Excel Release Notes. For legal information, see the Legal Notices.
 MySQL for Excel Abstract This is the MySQL for Excel Reference Manual. It documents MySQL for Excel 1.3 through 1.3.6. Much of the documentation also applies to the previous 1.2 series. For notes detailing
Decision Support AITS University Administration. Web Intelligence Rich Client 4.1 User Guide
 Decision Support AITS University Administration Web Intelligence Rich Client 4.1 User Guide 2 P age Web Intelligence 4.1 User Guide Web Intelligence 4.1 User Guide Contents Getting Started in Web Intelligence
Chapter 15: Forms. User Guide. 1 P a g e
 User Guide Chapter 15 Forms Engine 1 P a g e Table of Contents Introduction... 3 Form Building Basics... 4 1) About Form Templates... 4 2) About Form Instances... 4 Key Information... 4 Accessing the Form
Expat Tracker. User Manual. 2010 HR Systems Limited
 Expat Tracker User Manual Expat Tracker Assignee Management Software HR Systems Limited Expat Tracker All rights reserved. No parts of this work may be reproduced in any form or by any means - graphic,
ACHieve Access 4.3 User Guide for Corporate Customers
 ACHieve Access 4.3 User Guide for Corporate Customers January 2015 Citizens Bank 1 February 2015 Table of Contents SECTION 1: OVERVIEW... 4 Chapter 1: Introduction... 5 How to Use This Manual... 5 Overview
Time & Expense Entry WalkThrough
 PRACTICE CS Time & Expense Entry WalkThrough Version 2014.x.x TL 27573a (01/16/2015) Copyright Information Text copyright 2004-2015 by Thomson Reuters. All rights reserved. Video display images copyright
Bank Account 1 September 2015
 Chapter 8 Training Notes Bank Account 1 September 2015 BANK ACCOUNTS Bank Accounts, or Bank Records, are typically setup in PrintBoss after the application is installed and provide options to work with
ENTERPRISE DATA WAREHOUSE PRODUCT PERFORMANCE REPORTS USER GUIDE EXTERNAL. Version: 1.0
 ENTERPRISE DATA WAREHOUSE PRODUCT PERFORMANCE REPORTS USER GUIDE EXTERNAL Version: 1.0 September 2004 Table of Contents 1.0 OVERVIEW...1 1.1 Product Performance Overview... 1 1.2 Enterprise Data Warehouse
Microsoft Access Basics
 Microsoft Access Basics 2006 ipic Development Group, LLC Authored by James D Ballotti Microsoft, Access, Excel, Word, and Office are registered trademarks of the Microsoft Corporation Version 1 - Revision
DataPA OpenAnalytics End User Training
 DataPA OpenAnalytics End User Training DataPA End User Training Lesson 1 Course Overview DataPA Chapter 1 Course Overview Introduction This course covers the skills required to use DataPA OpenAnalytics
Custom Reporting System User Guide
 Citibank Custom Reporting System User Guide April 2012 Version 8.1.1 Transaction Services Citibank Custom Reporting System User Guide Table of Contents Table of Contents User Guide Overview...2 Subscribe
GP REPORTS VIEWER USER GUIDE
 GP Reports Viewer Dynamics GP Reporting Made Easy GP REPORTS VIEWER USER GUIDE For Dynamics GP Version 2015 (Build 5) Dynamics GP Version 2013 (Build 14) Dynamics GP Version 2010 (Build 65) Last updated
ICP Data Entry Module Training document. HHC Data Entry Module Training Document
 HHC Data Entry Module Training Document Contents 1. Introduction... 4 1.1 About this Guide... 4 1.2 Scope... 4 2. Step for testing HHC Data Entry Module.. Error! Bookmark not defined. STEP 1 : ICP HHC
Fleet Management System FMS. User Manual
 Fleet Management System FMS User Manual Page 1 of 21 Disclaimer No part of this publication may be reproduced, or transmitted in any form or by any means without the written permission of Control Module,
SAS BI Dashboard 4.3. User's Guide. SAS Documentation
 SAS BI Dashboard 4.3 User's Guide SAS Documentation The correct bibliographic citation for this manual is as follows: SAS Institute Inc. 2010. SAS BI Dashboard 4.3: User s Guide. Cary, NC: SAS Institute
Logi Ad Hoc Reporting Report Design Guide
 Logi Ad Hoc Reporting Report Design Guide Version 10.2 Last Updated: May 2012 Page 2 Table of Contents INTRODUCTION... 4 What is Logi Ad Hoc Reporting?... 5 CHAPTER 1 Getting Started... 6 Learning the
Information Server Documentation SIMATIC. Information Server V8.0 Update 1 Information Server Documentation. Introduction 1. Web application basics 2
 Introduction 1 Web application basics 2 SIMATIC Information Server V8.0 Update 1 System Manual Office add-ins basics 3 Time specifications 4 Report templates 5 Working with the Web application 6 Working
F9 Integration Manager
 F9 Integration Manager User Guide for use with QuickBooks This guide outlines the integration steps and processes supported for the purposes of financial reporting with F9 Professional and F9 Integration
Basics Series-4006 Email Basics Version 9.0
 Basics Series-4006 Email Basics Version 9.0 Information in this document is subject to change without notice and does not represent a commitment on the part of Technical Difference, Inc. The software product
BID2WIN Workshop. Advanced Report Writing
 BID2WIN Workshop Advanced Report Writing Please Note: Please feel free to take this workbook home with you! Electronic copies of all lab documentation are available for download at http://www.bid2win.com/userconf/2011/labs/
There are numerous ways to access monitors:
 Remote Monitors REMOTE MONITORS... 1 Overview... 1 Accessing Monitors... 1 Creating Monitors... 2 Monitor Wizard Options... 11 Editing the Monitor Configuration... 14 Status... 15 Location... 17 Alerting...
Fixes for CrossTec ResQDesk
 Fixes for CrossTec ResQDesk Fixes in CrossTec ResQDesk 5.00.0006 December 2, 2014 Resolved issue where the list of Operators on Category was not saving correctly when adding multiple Operators. Fixed issue
Vector HelpDesk - Administrator s Guide
 Vector HelpDesk - Administrator s Guide Vector HelpDesk - Administrator s Guide Configuring and Maintaining Vector HelpDesk version 5.6 Vector HelpDesk - Administrator s Guide Copyright Vector Networks
Sage 300 ERP Intelligence Reporting Getting Started Guide. Debra Holder March 2014
 Sage 300 ERP Intelligence Reporting Getting Started Guide Debra Holder March 2014 Table of Contents Introduction... 1 Who Should Read This Guide... 1 About Sage Intelligence Reporting... 1 Benefits of
WebSphere Business Monitor V6.2 KPI history and prediction lab
 Copyright IBM Corporation 2009 All rights reserved IBM WEBSPHERE BUSINESS MONITOR 6.2 LAB EXERCISE WebSphere Business Monitor V6.2 KPI history and prediction lab What this exercise is about... 1 Lab requirements...
PowerSchool Parent Portal User Guide. PowerSchool 7.x Student Information System
 PowerSchool 7.x Student Information System Released December 2011 Document Owner: Documentation Services This edition applies to Release 7.1 of the [product name] software and to all subsequent releases
Business Portal for Microsoft Dynamics GP 2010. User s Guide Release 5.1
 Business Portal for Microsoft Dynamics GP 2010 User s Guide Release 5.1 Copyright Copyright 2011 Microsoft. All rights reserved. Limitation of liability This document is provided as-is. Information and
TOPS v3.2.1 Calendar/Scheduler User Guide. By TOPS Software, LLC Clearwater, Florida
 TOPS v3.2.1 Calendar/Scheduler User Guide By TOPS Software, LLC Clearwater, Florida Document History Version Edition Date Document Software Trademark Copyright First Edition Second Edition 02 2007 09-2007
TimeValue Software Due Date Tracking and Task Management Software
 User s Guide TM TimeValue Software Due Date Tracking and Task Management Software File In Time Software User s Guide Copyright TimeValue Software, Inc. (a California Corporation) 1992-2010. All rights
Microsoft Outlook 2010. Reference Guide for Lotus Notes Users
 Microsoft Outlook 2010 Reference Guide for Lotus Notes Users ContentsWelcome to Office Outlook 2010... 2 Mail... 3 Viewing Messages... 4 Working with Messages... 7 Responding to Messages... 11 Organizing
Logi Ad Hoc Reporting Report Design Guide
 Logi Ad Hoc Reporting Report Design Guide Version 11.2 Last Updated: March, 2014 Page 2 Table of Contents INTRODUCTION... 4 What is Logi Ad Hoc Reporting?... 5 CHAPTER 1 Getting Started... 6 Learning the
Intellect Platform - The Workflow Engine Basic HelpDesk Troubleticket System - A102
 Intellect Platform - The Workflow Engine Basic HelpDesk Troubleticket System - A102 Interneer, Inc. Updated on 2/22/2012 Created by Erika Keresztyen Fahey 2 Workflow - A102 - Basic HelpDesk Ticketing System
email-lead Grabber Business 2010 User Guide
 email-lead Grabber Business 2010 User Guide Copyright and Trademark Information in this documentation is subject to change without notice. The software described in this manual is furnished under a license
User Guide. Chapter 1. SitePublish: Content Management System
 User Guide Chapter 1 SitePublish: Content Management System Table of Contents About SharpSchool... 4 About this Guide... 4 Who Should Use this Guide... 4 About SitePublish... 5 Accessing your Website...
ORACLE USER PRODUCTIVITY KIT USAGE TRACKING ADMINISTRATION & REPORTING RELEASE 3.6 PART NO. E17087-01
 ORACLE USER PRODUCTIVITY KIT USAGE TRACKING ADMINISTRATION & REPORTING RELEASE 3.6 PART NO. E17087-01 FEBRUARY 2010 COPYRIGHT Copyright 1998, 2009, Oracle and/or its affiliates. All rights reserved. Part
SonicWALL GMS Custom Reports
 SonicWALL GMS Custom Reports Document Scope This document describes how to configure and use the SonicWALL GMS 6.0 Custom Reports feature. This document contains the following sections: Feature Overview
STATGRAPHICS Online. Statistical Analysis and Data Visualization System. Revised 6/21/2012. Copyright 2012 by StatPoint Technologies, Inc.
 STATGRAPHICS Online Statistical Analysis and Data Visualization System Revised 6/21/2012 Copyright 2012 by StatPoint Technologies, Inc. All rights reserved. Table of Contents Introduction... 1 Chapter
User Manual for Web. Help Desk Authority 9.0
 User Manual for Web Help Desk Authority 9.0 2011ScriptLogic Corporation ALL RIGHTS RESERVED. ScriptLogic, the ScriptLogic logo and Point,Click,Done! are trademarks and registered trademarks of ScriptLogic
Kaldeera Workflow Designer 2010 User's Guide
 Kaldeera Workflow Designer 2010 User's Guide Version 1.0 Generated May 18, 2011 Index 1 Chapter 1: Using Kaldeera Workflow Designer 2010... 3 1.1 Getting Started with Kaldeera... 3 1.2 Importing and exporting
Scheduling Data Import from Avaya Communication Manager into Avaya Softconsole MasterDirectory
 Scheduling Data Import from Avaya Communication Manager into Avaya Softconsole MasterDirectory ABSTRACT This Application Note details step-by-step instructions on how to configure the scheduling feature
Microsoft Project Server 2010 Project Manager s Guide for Project Web App
 Microsoft Project Server 2010 Project Manager s Guide for Project Web App Copyright This document is provided as-is. Information and views expressed in this document, including URL and other Internet Web
Participant Guide RP301: Ad Hoc Business Intelligence Reporting
 RP301: Ad Hoc Business Intelligence Reporting State of Kansas As of April 28, 2010 Final TABLE OF CONTENTS Course Overview... 4 Course Objectives... 4 Agenda... 4 Lesson 1: Reviewing the Data Warehouse...
System Administrator Training Guide. Reliance Communications, Inc. 603 Mission Street Santa Cruz, CA 95060 888-527-5225 www.schoolmessenger.
 System Administrator Training Guide Reliance Communications, Inc. 603 Mission Street Santa Cruz, CA 95060 888-527-5225 www.schoolmessenger.com Contents Contents... 2 Before You Begin... 4 Overview... 4
Xcalibur. Foundation. Administrator Guide. Software Version 3.0
 Xcalibur Foundation Administrator Guide Software Version 3.0 XCALI-97520 Revision A May 2013 2013 Thermo Fisher Scientific Inc. All rights reserved. LCquan, Watson LIMS, and Web Access are trademarks,
MicroStrategy Desktop
 MicroStrategy Desktop Quick Start Guide MicroStrategy Desktop is designed to enable business professionals like you to explore data, simply and without needing direct support from IT. 1 Import data from
3 What s New in Excel 2007
 3 What s New in Excel 2007 3.1 Overview of Excel 2007 Microsoft Office Excel 2007 is a spreadsheet program that enables you to enter, manipulate, calculate, and chart data. An Excel file is referred to
A Quick Tour of F9 1
 A Quick Tour of F9 1 Table of Contents I. A Quick Tour of F9... 3 1. Getting Started... 3 2. Quick Trial Balance... 7 3. A More Dynamic Table Report... 10 II. The Fundamental F9 Formula... 14 The GL Formula...
GUIDE. Web Client Application. Model: ER 4.0. Release 4.0.00 / Version No.: 1.01
 8e6R Enterprise Reporter USER GUIDE Web Client Application Model: ER 4.0 Release 4.0.00 / Version No.: 1.01 ii 8E6 TECHNOLOGIES, ENTERPRISE REPORTER WEB CLIENT USER GUIDE 8E6 ENTERPRISE REPORTER WEB CLIENT
Appendix A How to create a data-sharing lab
 Appendix A How to create a data-sharing lab Creating a lab involves completing five major steps: creating lists, then graphs, then the page for lab instructions, then adding forms to the lab instructions,
Getting Started with IntelleView POS Administrator Software
 Getting Started with IntelleView POS Administrator Software Administrator s Guide for Software Version 1.2 About this Guide This administrator s guide explains how to start using your IntelleView POS (IntelleView)
ORACLE BUSINESS INTELLIGENCE WORKSHOP
 ORACLE BUSINESS INTELLIGENCE WORKSHOP Creating Interactive Dashboards and Using Oracle Business Intelligence Answers Purpose This tutorial shows you how to build, format, and customize Oracle Business
Strategic Asset Tracking System User Guide
 Strategic Asset Tracking System User Guide Contents 1 Overview 2 Web Application 2.1 Logging In 2.2 Navigation 2.3 Assets 2.3.1 Favorites 2.3.3 Purchasing 2.3.4 User Fields 2.3.5 History 2.3.6 Import Data
Penn State University (PSU)
") Penn State University (PSU) FAMS Maximo Basics Start Center, Querying, Navigation, Reporting, and Desktop Requisitions Prepared By Revision History Revision Date: February 4, 2014 Revision Number: 1 Revision
Penn State University (PSU) FAMS Maximo Basics Start Center, Querying, Navigation, Reporting, and Desktop Requisitions Prepared By Revision History Revision Date: February 4, 2014 Revision Number: 1 Revision
Sophos Mobile Control Administrator guide. Product version: 3
 Sophos Mobile Control Administrator guide Product version: 3 Document date: January 2013 Contents 1 About Sophos Mobile Control...4 2 About the Sophos Mobile Control web console...7 3 Key steps for managing
Real Time Monitor. A Real-Time Windows Operator Interface. DDE Compliant. (for remote data display)
") Real Time Monitor A Real-Time Windows Operator Interface DDE Compliant (for remote data display) TABLE OF CONTENTS 1. INTRODUCTION...1 1.1 INSTALLATION...2 1.2 FIRST START UP - DDE CONFIGURE...2 1.3 AUTO-STARTUP...2
Real Time Monitor A Real-Time Windows Operator Interface DDE Compliant (for remote data display) TABLE OF CONTENTS 1. INTRODUCTION...1 1.1 INSTALLATION...2 1.2 FIRST START UP - DDE CONFIGURE...2 1.3 AUTO-STARTUP...2
MyOra 3.0. User Guide. SQL Tool for Oracle. Jayam Systems, LLC
 MyOra 3.0 SQL Tool for Oracle User Guide Jayam Systems, LLC Contents Features... 4 Connecting to the Database... 5 Login... 5 Login History... 6 Connection Indicator... 6 Closing the Connection... 7 SQL
Kaseya 2. User Guide. Version 7.0. English
 Kaseya 2 Time Tracking User Guide Version 7.0 English September 3, 2014 Agreement The purchase and use of all Software and Services is subject to the Agreement as defined in Kaseya s Click-Accept EULATOS
Nintex Workflow 2010 Help Last updated: Friday, 26 November 2010
 Nintex Workflow 2010 Help Last updated: Friday, 26 November 2010 1 Workflow Interaction with SharePoint 1.1 About LazyApproval 1.2 Approving, Rejecting and Reviewing Items 1.3 Configuring the Graph Viewer
EXCEL 2007. Using Excel for Data Query & Management. Information Technology. MS Office Excel 2007 Users Guide. IT Training & Development
 Information Technology MS Office Excel 2007 Users Guide EXCEL 2007 Using Excel for Data Query & Management IT Training & Development (818) 677-1700 [email protected] http://www.csun.edu/training TABLE
Elisabetta Zodeiko 2/25/2012
 PRINCETON UNIVERSITY Report Studio Introduction Elisabetta Zodeiko 2/25/2012 Report Studio Introduction pg. 1 Table of Contents 1. Report Studio Overview... 6 Course Overview... 7 Princeton Information
State of Michigan Data Exchange Gateway. Web-Interface Users Guide 12-07-2009
 State of Michigan Data Exchange Gateway Web-Interface Users Guide 12-07-2009 Page 1 of 21 Revision History: Revision # Date Author Change: 1 8-14-2009 Mattingly Original Release 1.1 8-31-2009 MM Pgs 4,
ithenticate User Manual
 ithenticate User Manual Version: 2.0.8 Updated February 4, 2014 Contents Introduction 4 New Users 4 Logging In 4 Resetting Your Password 5 Changing Your Password or Username 6 The ithenticate Account Homepage
EXCEL PIVOT TABLE David Geffen School of Medicine, UCLA Dean s Office Oct 2002
 EXCEL PIVOT TABLE David Geffen School of Medicine, UCLA Dean s Office Oct 2002 Table of Contents Part I Creating a Pivot Table Excel Database......3 What is a Pivot Table...... 3 Creating Pivot Tables
Monnit Wi-Fi Sensors. Quick Start Guide
 Monnit Wi-Fi Sensors Quick Start Guide Inside the Box You should find the following items in the box: Monnit Wi-Fi (MoWi ) Sensors 2 x AA Batteries for Each MoWi Sensor Quick Start Guide Note: A MoWi USB
ACCESS 2007. Importing and Exporting Data Files. Information Technology. MS Access 2007 Users Guide. IT Training & Development (818) 677-1700
 677-1700") Information Technology MS Access 2007 Users Guide ACCESS 2007 Importing and Exporting Data Files IT Training & Development (818) 677-1700 [email protected] TABLE OF CONTENTS Introduction... 1 Import Excel
Information Technology MS Access 2007 Users Guide ACCESS 2007 Importing and Exporting Data Files IT Training & Development (818) 677-1700 [email protected] TABLE OF CONTENTS Introduction... 1 Import Excel
EmpCenter Employee Training for Harvey Mudd College. TR-01: Time and Attendance Employee Functions
 ` EmpCenter Employee Training for Harvey Mudd College TR-01: Time and Attendance Employee Functions LEGAL NOTICES Copyright 2012 WorkForce Software All Rights Reserved. WorkForce Software 38705 Seven Mile
Last Updated on 11/06/2008. www.jobprotech.com
 Last Updated on 11/06/2008 www.jobprotech.com Copyright JobPro Technology, 2008 How to Use this Guide This manual is designed as a reference for JobPro customers. It is not intended to be a replacement
EMC Documentum Webtop
 EMC Documentum Webtop Version 6.5 User Guide P/N 300 007 239 A01 EMC Corporation Corporate Headquarters: Hopkinton, MA 01748 9103 1 508 435 1000 www.emc.com Copyright 1994 2008 EMC Corporation. All rights
Editor Manual for SharePoint Version 1. 21 December 2005
 Editor Manual for SharePoint Version 1 21 December 2005 ii Table of Contents PREFACE... 1 WORKFLOW... 2 USER ROLES... 3 MANAGING DOCUMENT... 4 UPLOADING DOCUMENTS... 4 NEW DOCUMENT... 6 EDIT IN DATASHEET...
JOOMLA 2.5 MANUAL WEBSITEDESIGN.CO.ZA
 JOOMLA 2.5 MANUAL WEBSITEDESIGN.CO.ZA All information presented in the document has been acquired from http://docs.joomla.org to assist you with your website 1 JOOMLA 2.5 MANUAL WEBSITEDESIGN.CO.ZA BACK
User Guide. Analytics Desktop Document Number: 09619414
 User Guide Analytics Desktop Document Number: 09619414 CONTENTS Guide Overview Description of this guide... ix What s new in this guide...x 1. Getting Started with Analytics Desktop Introduction... 1
Infoview XIR3. User Guide. 1 of 20
 Infoview XIR3 User Guide 1 of 20 1. WHAT IS INFOVIEW?...3 2. LOGGING IN TO INFOVIEW...4 3. NAVIGATING THE INFOVIEW ENVIRONMENT...5 3.1. Home Page... 5 3.2. The Header Panel... 5 3.3. Workspace Panel...
MUNIS Instructions for Logging into SaaS (ASP) Dashboard
 Dashboard") MUNIS Instructions for Logging into SaaS (ASP) Dashboard Effective January 14, 2013 Step 1: Accessing MUNIS To access your Munis programs through Tyler Technologies cloud based servers (known as Software
MUNIS Instructions for Logging into SaaS (ASP) Dashboard Effective January 14, 2013 Step 1: Accessing MUNIS To access your Munis programs through Tyler Technologies cloud based servers (known as Software
Microsoft Access 2007
 How to Use: Microsoft Access 2007 Microsoft Office Access is a powerful tool used to create and format databases. Databases allow information to be organized in rows and tables, where queries can be formed
Oracle Sales Offline. 1 Introduction. User Guide
 Oracle Sales Offline User Guide Release 11i (11.5.9) June 2003 Part No. B10632-01 This document describes functionality to be delivered in the Oracle E-Business Suite 11.5.9 release. If you are implementing
Server Manual. For Administrators of Cameleon Version 4
 Server Manual For Administrators of Cameleon Version 4 Cameleon Version 4 Server Manual For Administrators of Cameleon Version 4 R4-07OCT04 Copyright 2004 360 Surveillance Inc. Camera Cameleon is a trademark
Basics Series-4004 Database Manager and Import Version 9.0
 Basics Series-4004 Database Manager and Import Version 9.0 Information in this document is subject to change without notice and does not represent a commitment on the part of Technical Difference, Inc.
User Guide to the Content Analysis Tool
 User Guide to the Content Analysis Tool User Guide To The Content Analysis Tool 1 Contents Introduction... 3 Setting Up a New Job... 3 The Dashboard... 7 Job Queue... 8 Completed Jobs List... 8 Job Details
How to Configure the Workflow Service and Design the Workflow Process Templates
 How-To Guide SAP Business One 9.0 Document Version: 1.0 2012-11-15 How to Configure the Workflow Service and Design the Workflow Process Templates Typographic Conventions Type Style Example Description
Novell ZENworks Asset Management 7.5
 Novell ZENworks Asset Management 7.5 w w w. n o v e l l. c o m October 2006 USING THE WEB CONSOLE Table Of Contents Getting Started with ZENworks Asset Management Web Console... 1 How to Get Started...