New Tools for Spatial Data Analysis in the Social Sciences
|
|
|
- Jasper Mills
- 10 years ago
- Views:
Transcription
1 New Tools for Spatial Data Analysis in the Social Sciences Luc Anselin University of Illinois, Urbana-Champaign edu

2 Outline! Background! Visualizing Spatial and Space-Time Association! DynESDA2! What s Next - Future Directions

3 Background

4 CSISS Tools Program! Software Tools Clearing House! The OpenSpace Project! Dynamic ESDA with GIS

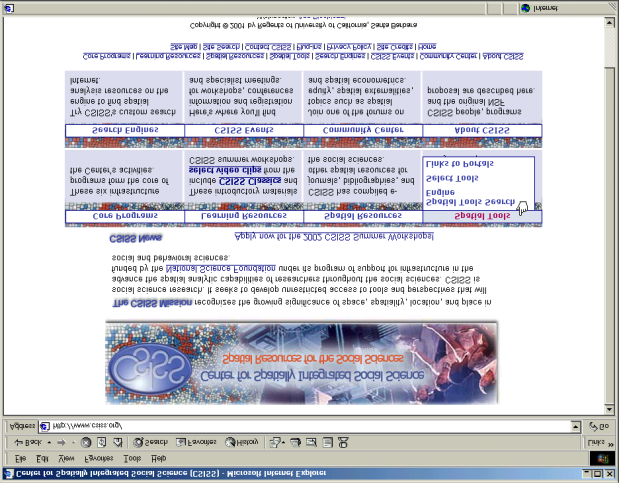
5 Software Tools Clearing House! Search Engine " specialized searches focused on spatial data analysis methods and software! Links to Portals " portals with links to spatial data analysis sites! Links to Tools Links to Tools " selected software sites, academic, commercial, public sector, individuals

6


7 Spatial Tools Search Engine


8 Links to Spatial Tools Portals


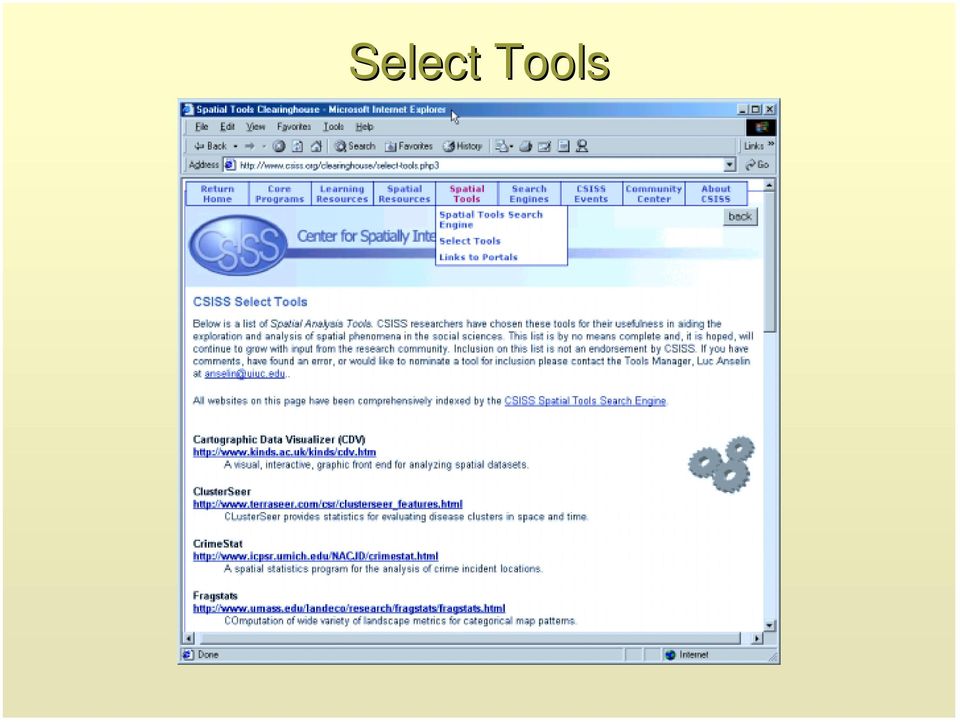
9 Select Tools
10 OpenSpace Project! Goal " develop collection of open source spatial data analysis modules that incorporate state of the art methods» moving target requires open environment! Organization " core development team at UIUC " facilitating a community of collaborators

11 OpenSpace Development! Cross Platform Tools " open source software development» Python + Numpy, Jython, Java» to run on linux, windows, mac " open source toolboxes» Xlispstat, R,

12 OpenSpace Functionality! Modular " common kernel of basic classes " develop collection of modular components» library, modules, packages» all the basic techniques (estimation, diagnostics)» open design allows for high end users/programmers


13

14 Visualizing Spatial and Space-Time Association

15 Space-Time ESDA! Extensions " Space-time linking and brushing " Space-time Moran Scatterplot " Space-time LISA

16 Combining Space and Time! Perspectives " Lattice data = discrete objects (not surface) " Pooled analysis = combining all time periods " Comparative statics = cross-sectional slices at different points in time " True Space-Time dynamics = dependence of x at i and t on neighbors at t-h! Metric " What are neighbors in space-time " Importance of dynamics of the processes studied = scale

17 Moran Scatterplot Extensions! Generalized Moran Scatterplot " Regression slope of Wz 2 on z 1» Both variables standardized» = visualization of Wartenberg multivariate Moran statistic " Significance testing» Permutation» Permutation envelope (2.5% and 97.5% from permutation reference distribution)! Four Types of Association Four Types of Association " High-high, Low-low; High-low, Low-high
!")
18 LISA Extensions! Generalization of Local Moran " z 1i x Σ j w ij z 2j»z 1 and z 2 different variables, or same variable at different times! Inference " Null hypothesis» random assignment between value of z 1 at i, t and neighboring values of z 2

19 LISA Extensions (2)! Space-Time Cluster = Diffusion/Contagion " High (above avg) values at a location surrounded by High values at different time» Compare to high-high same time " Similar for Low-Low! Space-Time Outlier = Change " High (above avg) surrounded by Low (below avg) at different time " Similar for Low-High! Significance based on permutation

20 DynESDA2
21 Antecedents! Link ArcInfo-SpaceStat! Link ArcView-SpaceStat " SpaceStat Extension for ArcView» visualize ESDA results from SpaceStat» construct spatial weights " DynESDA Extension for ArcView» dynamic linking of View and statistical graphs» link map, histogram, box plot, scatterplot» Moran Scatterplot
22 DynESDA2 Design! Map as One of the Views " no longer ArcView driven " MapObjects Lite for mapping functionality " multiple maps linked " transparent selection identifier! Modular Design Modular Design " modules for statistical graphics " modules for mapping function " linked through common bitmap
23 User Interfaces < Explore Menu < Selection Tools Mapping Menu
24 New Features! Data Structure " both polygon and point shape files " Thiessen polygons centroids! Brushing " brushing of multiple maps " linking to table! Visualizing Spatial Autocorrelation " generalized Moran scatterplot " linking and brushing LISA maps

25 Linking Point and Polygon Maps
26 Box Map and Box Plot

27 LISA Maps Linked to Table and Moran Scatterplot
28 Weights Construction Distance Weights Contiguity Weights
29 Randomization in Moran Scatterplot
30 Significance Envelope
31 Generalized Moran Scatterplot Matrix
32 Linked LISA Map Suite
33 Future
34 What s Next! Tool Developers Specialist Meeting " compendium/showcase of tools " white paper on standards, interoperability! DynESDA2 Beta Release " late spring! Template for Linear Regression " libraries in Xlispstat, Python, Java " links to related work (R project)» diagnostics for spatial effects» ML estimation of spatial regression» IV/GMM estimation of spatial regression
35 Future Directions! Performance Issues " extend DynESDA functionality to large data sets! New Methods " space-time regression models " spatial probit! New Platforms " web-based spatial data analysis
Spatial Analysis with GeoDa Spatial Autocorrelation
 Spatial Analysis with GeoDa Spatial Autocorrelation 1. Background GeoDa is a trademark of Luc Anselin. GeoDa is a collection of software tools designed for exploratory spatial data analysis (ESDA) based
NetSurv & Data Viewer
 NetSurv & Data Viewer Prototype space-time analysis and visualization software from TerraSeer Dunrie Greiling, TerraSeer Inc. TerraSeer Software sales BoundarySeer for boundary detection and analysis ClusterSeer
GeoDa 0.9 User s Guide
 GeoDa 0.9 User s Guide Luc Anselin Spatial Analysis Laboratory Department of Agricultural and Consumer Economics University of Illinois, Urbana-Champaign Urbana, IL 61801 http://sal.agecon.uiuc.edu/ and
Introduction to Exploratory Data Analysis
 Introduction to Exploratory Data Analysis A SpaceStat Software Tutorial Copyright 2013, BioMedware, Inc. (www.biomedware.com). All rights reserved. SpaceStat and BioMedware are trademarks of BioMedware,
Spatial Data Analysis Using GeoDa. Workshop Goals
 Spatial Data Analysis Using GeoDa 9 Jan 2014 Frank Witmer Computing and Research Services Institute of Behavioral Science Workshop Goals Enable participants to find and retrieve geographic data pertinent
Exploring Spatial Data with GeoDa TM : A Workbook
 Exploring Spatial Data with GeoDa TM : A Workbook Luc Anselin Spatial Analysis Laboratory Department of Geography University of Illinois, Urbana-Champaign Urbana, IL 61801 http://sal.uiuc.edu/ Center for
Clustering Components of PySAL
 Clustering Components of PySAL Sergio Rey 1,2 Juan Carlos Duque 1 Luc Anselin 2,3 1 Regional Analysis Laboratory (REGAL) Department of Geography San Diego State University 2 Regional Economics Application
GeoDa: An Introduction to Spatial Data Analysis
 Geographical Analysis ISSN 0016-7363 GeoDa: An Introduction to Spatial Data Analysis Luc Anselin 1, Ibnu Syabri 2, Youngihn Kho 1 1 Spatial Analysis Laboratory, Department of Geography, University of Illinois,
EXPLORING SPATIAL PATTERNS IN YOUR DATA
 EXPLORING SPATIAL PATTERNS IN YOUR DATA OBJECTIVES Learn how to examine your data using the Geostatistical Analysis tools in ArcMap. Learn how to use descriptive statistics in ArcMap and Geoda to analyze
Lab 7. Exploratory Data Analysis
 Lab 7. Exploratory Data Analysis SOC 261, Spring 2005 Spatial Thinking in Social Science 1. Background GeoDa is a trademark of Luc Anselin. GeoDa is a collection of software tools designed for exploratory
Exploring Spatial Data with GeoDa TM : A Workbook
 Exploring Spatial Data with GeoDa TM : A Workbook Luc Anselin Spatial Analysis Laboratory Department of Geography University of Illinois, Urbana-Champaign Urbana, IL 61801 http://sal.agecon.uiuc.edu/ Center
Geostatistics Exploratory Analysis
 Instituto Superior de Estatística e Gestão de Informação Universidade Nova de Lisboa Master of Science in Geospatial Technologies Geostatistics Exploratory Analysis Carlos Alberto Felgueiras [email protected]
GeoDa: An Introduction to Spatial Data Analysis
 GeoDa: An Introduction to Spatial Data Analysis Luc Anselin, Ibnu Syabri and Youngihn Kho Spatial Analysis Laboratory Department of Agricultural and Consumer Economics University of Illinois, Urbana-Champaign
Creating and Manipulating Spatial Weights
 Creating and Manipulating Spatial Weights Spatial weights are essential for the computation of spatial autocorrelation statistics. In GeoDa, they are also used to implement Spatial Rate smoothing. Weights
MTH 140 Statistics Videos
 MTH 140 Statistics Videos Chapter 1 Picturing Distributions with Graphs Individuals and Variables Categorical Variables: Pie Charts and Bar Graphs Categorical Variables: Pie Charts and Bar Graphs Quantitative
CONTENTS PREFACE 1 INTRODUCTION 1 2 DATA VISUALIZATION 19
 PREFACE xi 1 INTRODUCTION 1 1.1 Overview 1 1.2 Definition 1 1.3 Preparation 2 1.3.1 Overview 2 1.3.2 Accessing Tabular Data 3 1.3.3 Accessing Unstructured Data 3 1.3.4 Understanding the Variables and Observations
The Forgotten JMP Visualizations (Plus Some New Views in JMP 9) Sam Gardner, SAS Institute, Lafayette, IN, USA
 Sam Gardner, SAS Institute, Lafayette, IN, USA") Paper 156-2010 The Forgotten JMP Visualizations (Plus Some New Views in JMP 9) Sam Gardner, SAS Institute, Lafayette, IN, USA Abstract JMP has a rich set of visual displays that can help you see the information
Paper 156-2010 The Forgotten JMP Visualizations (Plus Some New Views in JMP 9) Sam Gardner, SAS Institute, Lafayette, IN, USA Abstract JMP has a rich set of visual displays that can help you see the information
An Exploratory Spatial Data Analysis of Income and Education Inequality in Pakistan
 An Exploratory Spatial Data Analysis of Income and Education Inequality in Pakistan Sofia Ahmed Joint Doctoral Program in International Economics SIS/CIFREM October 2009 This draft is preliminary and incomplete,
Exploratory Data Analysis with MATLAB
 Computer Science and Data Analysis Series Exploratory Data Analysis with MATLAB Second Edition Wendy L Martinez Angel R. Martinez Jeffrey L. Solka ( r ec) CRC Press VV J Taylor & Francis Group Boca Raton
Spatial Data Analysis
 14 Spatial Data Analysis OVERVIEW This chapter is the first in a set of three dealing with geographic analysis and modeling methods. The chapter begins with a review of the relevant terms, and an outlines
Why Taking This Course? Course Introduction, Descriptive Statistics and Data Visualization. Learning Goals. GENOME 560, Spring 2012
 Why Taking This Course? Course Introduction, Descriptive Statistics and Data Visualization GENOME 560, Spring 2012 Data are interesting because they help us understand the world Genomics: Massive Amounts
Shuming Bao. Spatial Explorer of Religions and Society - Data, Methodology and Technology. China Data Center University of Michigan
 March 17, 2012 AAS 2012, Toronto Spatial Explorer of Religions and Society - Data, Methodology and Technology Shuming Bao China Data Center University of Michigan New Development of Religions in China
Fairfield Public Schools
 Mathematics Fairfield Public Schools AP Statistics AP Statistics BOE Approved 04/08/2014 1 AP STATISTICS Critical Areas of Focus AP Statistics is a rigorous course that offers advanced students an opportunity
An Introduction to Point Pattern Analysis using CrimeStat
 Introduction An Introduction to Point Pattern Analysis using CrimeStat Luc Anselin Spatial Analysis Laboratory Department of Agricultural and Consumer Economics University of Illinois, Urbana-Champaign
Diagrams and Graphs of Statistical Data
 Diagrams and Graphs of Statistical Data One of the most effective and interesting alternative way in which a statistical data may be presented is through diagrams and graphs. There are several ways in
Issues related to handling of spatial data
 In: J. McKenzie (ed) Proceedings of the epidemiology and state veterinary programmes. New Zealand Veterinary Association / Australian Veterinary Association Second Pan Pacific Veterinary Conference, Christchurch,
Spatial Analysis of Five Crime Statistics in Turkey
 Spatial Analysis of Five Crime Statistics in Turkey Saffet ERDOĞAN, M. Ali DERELİ, Mustafa YALÇIN, Turkey Key words: Crime rates, geographical information systems, spatial analysis. SUMMARY In this study,
How To Teach A Spatial Analysis Course
 Course Outline SO 8243 Spatial Analysis of Social Data Semester: TBA Dr. Frank M. Howell Office: 324-A Etheredge Hall Phone: 662.325.7872 Office Hours: TBA E-mail: [email protected] (other times by appointment
Today's Topics. COMP 388/441: Human-Computer Interaction. simple 2D plotting. 1D techniques. Ancient plotting techniques. Data Visualization:
 COMP 388/441: Human-Computer Interaction Today's Topics Overview of visualization techniques 1D charts, 2D plots, 3D+ techniques, maps A few guidelines for scientific visualization methods, guidelines,
Big Ideas in Mathematics
 Big Ideas in Mathematics which are important to all mathematics learning. (Adapted from the NCTM Curriculum Focal Points, 2006) The Mathematics Big Ideas are organized using the PA Mathematics Standards
Institute of Actuaries of India Subject CT3 Probability and Mathematical Statistics
 Institute of Actuaries of India Subject CT3 Probability and Mathematical Statistics For 2015 Examinations Aim The aim of the Probability and Mathematical Statistics subject is to provide a grounding in
Current Standard: Mathematical Concepts and Applications Shape, Space, and Measurement- Primary
 Shape, Space, and Measurement- Primary A student shall apply concepts of shape, space, and measurement to solve problems involving two- and three-dimensional shapes by demonstrating an understanding of:
17 Interactive techniques and exploratory spatial data analysis
 17 Interactive techniques and exploratory spatial data analysis L ANSELIN This chapter reviews the ideas behind interactive and exploratory spatial data analysis and their relation to GIS. Three important
LAGUARDIA COMMUNITY COLLEGE CITY UNIVERSITY OF NEW YORK DEPARTMENT OF MATHEMATICS, ENGINEERING, AND COMPUTER SCIENCE
 LAGUARDIA COMMUNITY COLLEGE CITY UNIVERSITY OF NEW YORK DEPARTMENT OF MATHEMATICS, ENGINEERING, AND COMPUTER SCIENCE MAT 119 STATISTICS AND ELEMENTARY ALGEBRA 5 Lecture Hours, 2 Lab Hours, 3 Credits Pre-
COMMON CORE STATE STANDARDS FOR
 COMMON CORE STATE STANDARDS FOR Mathematics (CCSSM) High School Statistics and Probability Mathematics High School Statistics and Probability Decisions or predictions are often based on data numbers in
The Comparisons. Grade Levels Comparisons. Focal PSSM K-8. Points PSSM CCSS 9-12 PSSM CCSS. Color Coding Legend. Not Identified in the Grade Band
 Comparison of NCTM to Dr. Jim Bohan, Ed.D Intelligent Education, LLC [email protected] The Comparisons Grade Levels Comparisons Focal K-8 Points 9-12 pre-k through 12 Instructional programs from prekindergarten
MULTIPLE REGRESSION EXAMPLE
 MULTIPLE REGRESSION EXAMPLE For a sample of n = 166 college students, the following variables were measured: Y = height X 1 = mother s height ( momheight ) X 2 = father s height ( dadheight ) X 3 = 1 if
South Carolina College- and Career-Ready (SCCCR) Probability and Statistics
 Probability and Statistics") South Carolina College- and Career-Ready (SCCCR) Probability and Statistics South Carolina College- and Career-Ready Mathematical Process Standards The South Carolina College- and Career-Ready (SCCCR)
South Carolina College- and Career-Ready (SCCCR) Probability and Statistics South Carolina College- and Career-Ready Mathematical Process Standards The South Carolina College- and Career-Ready (SCCCR)
2013 MBA Jump Start Program. Statistics Module Part 3
 2013 MBA Jump Start Program Module 1: Statistics Thomas Gilbert Part 3 Statistics Module Part 3 Hypothesis Testing (Inference) Regressions 2 1 Making an Investment Decision A researcher in your firm just
The Value of Visualization 2
 The Value of Visualization 2 G Janacek -0.69 1.11-3.1 4.0 GJJ () Visualization 1 / 21 Parallel coordinates Parallel coordinates is a common way of visualising high-dimensional geometry and analysing multivariate
Data Visualization Techniques and Practices Introduction to GIS Technology
 Data Visualization Techniques and Practices Introduction to GIS Technology Michael Greene Advanced Analytics & Modeling, Deloitte Consulting LLP March 16 th, 2010 Antitrust Notice The Casualty Actuarial
Institute of Natural Resources Departament of General Geology and Land use planning Work with a MAPS
 Institute of Natural Resources Departament of General Geology and Land use planning Work with a MAPS Lecturers: Berchuk V.Y. Gutareva N.Y. Contents: 1. Qgis; 2. General information; 3. Qgis desktop; 4.
Regression and Correlation
 Regression and Correlation Topics Covered: Dependent and independent variables. Scatter diagram. Correlation coefficient. Linear Regression line. by Dr.I.Namestnikova 1 Introduction Regression analysis
Summarizing and Displaying Categorical Data
 Summarizing and Displaying Categorical Data Categorical data can be summarized in a frequency distribution which counts the number of cases, or frequency, that fall into each category, or a relative frequency
Spatial Statistics Chapter 3 Basics of areal data and areal data modeling
 Spatial Statistics Chapter 3 Basics of areal data and areal data modeling Recall areal data also known as lattice data are data Y (s), s D where D is a discrete index set. This usually corresponds to data
NC Public Health and Cancer - Trends for 2014
 Research Brief April 2015 Measuring community health outcomes: New approaches for public health services research P ublic Health agencies are increasingly asked to do more with less. Tough economic times
Cluster Analysis: Advanced Concepts
 Cluster Analysis: Advanced Concepts and dalgorithms Dr. Hui Xiong Rutgers University Introduction to Data Mining 08/06/2006 1 Introduction to Data Mining 08/06/2006 1 Outline Prototype-based Fuzzy c-means
Structural Health Monitoring Tools (SHMTools)
") Structural Health Monitoring Tools (SHMTools) Getting Started LANL/UCSD Engineering Institute LA-CC-14-046 c Copyright 2014, Los Alamos National Security, LLC All rights reserved. May 30, 2014 Contents
Structural Health Monitoring Tools (SHMTools) Getting Started LANL/UCSD Engineering Institute LA-CC-14-046 c Copyright 2014, Los Alamos National Security, LLC All rights reserved. May 30, 2014 Contents
WebFOCUS RStat. RStat. Predict the Future and Make Effective Decisions Today. WebFOCUS RStat
 Information Builders enables agile information solutions with business intelligence (BI) and integration technologies. WebFOCUS the most widely utilized business intelligence platform connects to any enterprise
How To Use Statgraphics Centurion Xvii (Version 17) On A Computer Or A Computer (For Free)
 On A Computer Or A Computer (For Free)") Statgraphics Centurion XVII (currently in beta test) is a major upgrade to Statpoint's flagship data analysis and visualization product. It contains 32 new statistical procedures and significant upgrades
Statgraphics Centurion XVII (currently in beta test) is a major upgrade to Statpoint's flagship data analysis and visualization product. It contains 32 new statistical procedures and significant upgrades
GRADES 7, 8, AND 9 BIG IDEAS
 Table 1: Strand A: BIG IDEAS: MATH: NUMBER Introduce perfect squares, square roots, and all applications Introduce rational numbers (positive and negative) Introduce the meaning of negative exponents for
Benefits of Upgrading to Phoenix WinNonlin 6.2
 Benefits of Upgrading to Phoenix WinNonlin 6.2 Pharsight, a Certara Company 5625 Dillard Drive; Suite 205 Cary, NC 27518; USA www.pharsight.com March, 2011 Benefits of Upgrading to Phoenix WinNonlin 6.2
Data Mining Cluster Analysis: Basic Concepts and Algorithms. Lecture Notes for Chapter 8. Introduction to Data Mining
 Data Mining Cluster Analysis: Basic Concepts and Algorithms Lecture Notes for Chapter 8 by Tan, Steinbach, Kumar 1 What is Cluster Analysis? Finding groups of objects such that the objects in a group will
Pearson's Correlation Tests
 Chapter 800 Pearson's Correlation Tests Introduction The correlation coefficient, ρ (rho), is a popular statistic for describing the strength of the relationship between two variables. The correlation
An Interactive Tool for Residual Diagnostics for Fitting Spatial Dependencies (with Implementation in R)
") DSC 2003 Working Papers (Draft Versions) http://www.ci.tuwien.ac.at/conferences/dsc-2003/ An Interactive Tool for Residual Diagnostics for Fitting Spatial Dependencies (with Implementation in R) Ernst
DSC 2003 Working Papers (Draft Versions) http://www.ci.tuwien.ac.at/conferences/dsc-2003/ An Interactive Tool for Residual Diagnostics for Fitting Spatial Dependencies (with Implementation in R) Ernst
The Visual Statistics System. ViSta
 Visual Statistical Analysis using ViSta The Visual Statistics System Forrest W. Young & Carla M. Bann L.L. Thurstone Psychometric Laboratory University of North Carolina, Chapel Hill, NC USA 1 of 21 Outline
39 TerraFly GeoCloud: An Online Spatial Data Analysis and Visualization System
 39 TerraFly GeoCloud: An Online Spatial Data Analysis and Visualization System Mingjin Zhang, Florida International University Huibo Wang, Florida International University Yun Lu, Florida International
Network Analysis I & II
 Network Analysis I & II Dani S. Bassett Department of Physics University of California Santa Barbara Outline Lecture One: 1. Complexity in the Human Brain from processes to patterns 2. Graph Theory and
Common Core Unit Summary Grades 6 to 8
 Common Core Unit Summary Grades 6 to 8 Grade 8: Unit 1: Congruence and Similarity- 8G1-8G5 rotations reflections and translations,( RRT=congruence) understand congruence of 2 d figures after RRT Dilations
Algebra 1 2008. Academic Content Standards Grade Eight and Grade Nine Ohio. Grade Eight. Number, Number Sense and Operations Standard
 Academic Content Standards Grade Eight and Grade Nine Ohio Algebra 1 2008 Grade Eight STANDARDS Number, Number Sense and Operations Standard Number and Number Systems 1. Use scientific notation to express
Curriculum Map Statistics and Probability Honors (348) Saugus High School Saugus Public Schools 2009-2010
 Saugus High School Saugus Public Schools 2009-2010") Curriculum Map Statistics and Probability Honors (348) Saugus High School Saugus Public Schools 2009-2010 Week 1 Week 2 14.0 Students organize and describe distributions of data by using a number of different
Curriculum Map Statistics and Probability Honors (348) Saugus High School Saugus Public Schools 2009-2010 Week 1 Week 2 14.0 Students organize and describe distributions of data by using a number of different
Lecture 2: Descriptive Statistics and Exploratory Data Analysis
 Lecture 2: Descriptive Statistics and Exploratory Data Analysis Further Thoughts on Experimental Design 16 Individuals (8 each from two populations) with replicates Pop 1 Pop 2 Randomly sample 4 individuals
Advances in the Application of Geographic Information Systems (GIS) Carmelle J. Terborgh, Ph.D. ESRI Federal/Global Affairs
 Carmelle J. Terborgh, Ph.D. ESRI Federal/Global Affairs") Advances in the Application of Geographic Information Systems (GIS) Carmelle J. Terborgh, Ph.D. ESRI Federal/Global Affairs Highlights GIS in our World Advancements in GIS Visualization and Analysis Geographic
Advances in the Application of Geographic Information Systems (GIS) Carmelle J. Terborgh, Ph.D. ESRI Federal/Global Affairs Highlights GIS in our World Advancements in GIS Visualization and Analysis Geographic
International College of Economics and Finance Syllabus Probability Theory and Introductory Statistics
 International College of Economics and Finance Syllabus Probability Theory and Introductory Statistics Lecturer: Mikhail Zhitlukhin. 1. Course description Probability Theory and Introductory Statistics
Business Statistics. Successful completion of Introductory and/or Intermediate Algebra courses is recommended before taking Business Statistics.
 Business Course Text Bowerman, Bruce L., Richard T. O'Connell, J. B. Orris, and Dawn C. Porter. Essentials of Business, 2nd edition, McGraw-Hill/Irwin, 2008, ISBN: 978-0-07-331988-9. Required Computing
Glencoe. correlated to SOUTH CAROLINA MATH CURRICULUM STANDARDS GRADE 6 3-3, 5-8 8-4, 8-7 1-6, 4-9
 Glencoe correlated to SOUTH CAROLINA MATH CURRICULUM STANDARDS GRADE 6 STANDARDS 6-8 Number and Operations (NO) Standard I. Understand numbers, ways of representing numbers, relationships among numbers,
Chapter 23. Inferences for Regression
 Chapter 23. Inferences for Regression Topics covered in this chapter: Simple Linear Regression Simple Linear Regression Example 23.1: Crying and IQ The Problem: Infants who cry easily may be more easily
Data analysis and regression in Stata
 Data analysis and regression in Stata This handout shows how the weekly beer sales series might be analyzed with Stata (the software package now used for teaching stats at Kellogg), for purposes of comparing
Role Description. Position of a Data Scientist Machine Learning at Fractal Analytics
 Opportunity to work with leading analytics firm that creates Insights, Impact and Innovation. Role Description Position of a Data Scientist Machine Learning at Fractal Analytics March 2014 About the Company
Audit Analytics. --An innovative course at Rutgers. Qi Liu. Roman Chinchila
 Audit Analytics --An innovative course at Rutgers Qi Liu Roman Chinchila A new certificate in Analytic Auditing Tentative courses: Audit Analytics Special Topics in Audit Analytics Forensic Accounting
Using Spatial Statistics In GIS
 Using Spatial Statistics In GIS K. Krivoruchko a and C.A. Gotway b a Environmental Systems Research Institute, 380 New York Street, Redlands, CA 92373-8100, USA b Centers for Disease Control and Prevention;
Information visualization examples
 Information visualization examples 350102: GenICT II 37 Information visualization examples 350102: GenICT II 38 Information visualization examples 350102: GenICT II 39 Information visualization examples
An Introduction to Data Mining
 An Introduction to Intel Beijing [email protected] January 17, 2014 Outline 1 DW Overview What is Notable Application of Conference, Software and Applications Major Process in 2 Major Tasks in Detail
ArcGIS Geostatistical Analyst: Statistical Tools for Data Exploration, Modeling, and Advanced Surface Generation
 ArcGIS Geostatistical Analyst: Statistical Tools for Data Exploration, Modeling, and Advanced Surface Generation An ESRI White Paper August 2001 ESRI 380 New York St., Redlands, CA 92373-8100, USA TEL
FEAWEB ASP Issue: 1.0 Stakeholder Needs Issue Date: 03/29/2000. 04/07/2000 1.0 Initial Description Marco Bittencourt
 )($:(%$63 6WDNHKROGHU1HHGV,VVXH 5HYLVLRQ+LVWRU\ 'DWH,VVXH 'HVFULSWLRQ $XWKRU 04/07/2000 1.0 Initial Description Marco Bittencourt &RQILGHQWLDO DPM-FEM-UNICAMP, 2000 Page 2 7DEOHRI&RQWHQWV 1. Objectives
Mathematics (MAT) MAT 061 Basic Euclidean Geometry 3 Hours. MAT 051 Pre-Algebra 4 Hours
 MAT 061 Basic Euclidean Geometry 3 Hours. MAT 051 Pre-Algebra 4 Hours") MAT 051 Pre-Algebra Mathematics (MAT) MAT 051 is designed as a review of the basic operations of arithmetic and an introduction to algebra. The student must earn a grade of C or in order to enroll in MAT
MAT 051 Pre-Algebra Mathematics (MAT) MAT 051 is designed as a review of the basic operations of arithmetic and an introduction to algebra. The student must earn a grade of C or in order to enroll in MAT
An Introduction to Spatial Regression Analysis in R. Luc Anselin University of Illinois, Urbana-Champaign http://sal.agecon.uiuc.
 An Introduction to Spatial Regression Analysis in R Luc Anselin University of Illinois, Urbana-Champaign http://sal.agecon.uiuc.edu May 23, 2003 Introduction This note contains a brief introduction and
Location matters. 3 techniques to incorporate geo-spatial effects in one's predictive model
 Location matters. 3 techniques to incorporate geo-spatial effects in one's predictive model Xavier Conort [email protected] Motivation Location matters! Observed value at one location is
AP Statistics: Syllabus 1
 AP Statistics: Syllabus 1 Scoring Components SC1 The course provides instruction in exploring data. 4 SC2 The course provides instruction in sampling. 5 SC3 The course provides instruction in experimentation.
A Correlation of. to the. South Carolina Data Analysis and Probability Standards
 A Correlation of to the South Carolina Data Analysis and Probability Standards INTRODUCTION This document demonstrates how Stats in Your World 2012 meets the indicators of the South Carolina Academic Standards
Data Visualization. Scientific Principles, Design Choices and Implementation in LabKey. Cory Nathe Software Engineer, LabKey cnathe@labkey.
 Data Visualization Scientific Principles, Design Choices and Implementation in LabKey Catherine Richards, PhD, MPH Staff Scientist, HICOR [email protected] Cory Nathe Software Engineer, LabKey [email protected]
Course Text. Required Computing Software. Course Description. Course Objectives. StraighterLine. Business Statistics
 Course Text Business Statistics Lind, Douglas A., Marchal, William A. and Samuel A. Wathen. Basic Statistics for Business and Economics, 7th edition, McGraw-Hill/Irwin, 2010, ISBN: 9780077384470 [This
What is Data Analysis. Kerala School of MathematicsCourse in Statistics for Scientis. Introduction to Data Analysis. Steps in a Statistical Study
 Kerala School of Mathematics Course in Statistics for Scientists Introduction to Data Analysis T.Krishnan Strand Life Sciences, Bangalore What is Data Analysis Statistics is a body of methods how to use