The Visual Statistics System. ViSta
|
|
|
- Margaret Cooper
- 8 years ago
- Views:
Transcription
1 Visual Statistical Analysis using ViSta The Visual Statistics System Forrest W. Young & Carla M. Bann L.L. Thurstone Psychometric Laboratory University of North Carolina, Chapel Hill, NC USA 1 of 21

2 Outline 1. ViSta's audience ranges from novices to experts. It is best suited to teaching multivariate, computational and graphical statistics. 2. ViSta runs on MS-Windows, Macs, and under Unix. It is free, open and extensible. The code, documentation and references are available on line at 3. ViSta features a Structured Graphical Interface including: A) WorkMaps that visually summarize your data analysis session B) GuideMaps that visually guide your data analysis 4. ViSta features Statistical Visualization and Analysis, including A) Univariate - T-tests (etc.), ANOVA, Regression (OLS, robust) B) Multivariate - Regression, Principal Components Analysis, Multidimensional Scaling, Correspondence Analysis 5. ViSta has a Language Interface including: A) ViDAL, ViSta's Data Analysis Language (keyboard or scripts) B) XLispStat: object-oriented statistical computing language 2 of 21
 Univariate - T-tests (etc.")
3 1: ViSta s Audience ViSta is best for teaching. It is being used in: multivariate data analysis classes. computational and graphical statistics classes. introductory statistics (as a supplemental system since ViSta does not yet have a complete selection of basic statistical capabilities). ViSta is also useful for research and development in computational statistics and statistical graphics. ViSta is designed for a wide ranges of users: ViSta provides seamlessly integrated data analysis environments specifically tailored to the user's level of expertise. Guidance is available for students and novices. A structured graphical user interface is available for all users. A menu interface is available for users who don't need guidance. A command line interface is available for sophisticated users and those who don't like graphical interfaces. GuideTools are available for teachers and other experts to create guidance for students and novices. The complete Lisp-Stat (Tierney, 1990) programming environment is available to researchers, graduate students and programmers who wish to extend ViSta's capabilities. 3 of 21

4 2: ViSta runs on MS-Windows, Macs & Unix. It is Free, Open & Extensible ViSta runs under MS-Windows (3.1 & 95) MacOS (68040, PowerPC) Unix with X11 ViSta is free from Code may be freely copied and redistributed, with certain restrictions. Documentation is also available for free from the above site. ViSta is Open: All of the code is available to the programmer. This includes both the Lisp code for ViSta and the C and Lisp code for XLisp-Stat. This code can be used as the basis for developing new code that extends the system's capabilities. ViSta is Extensible: Programs written in Lisp, FORTRAN or C are accessible from within ViSta. New ViSta model-objects can be written to extend the range of desired prepackaged statistical computations. New graphical-objects can be written to implement new statistical visualization ideas. 4 of 21

5 3: ViSta's Structured Graphical Interface WorkMaps WorkMaps visualize the structure of an on-going data analysis WorkMaps help you remember the steps of your analysis WorkMaps let you return to earlier steps in the analysis WorkMaps help you communicate the analysis to others GuideMaps GuideMaps visually guide users with no knowledge about statistical analysis through the analysis process. GuideMaps provide structured context-sensitive help, as well as guidance. SpreadPlots: Dynamic visualizations that reveal data and model structure. ViSta also has: DataSheets to display & edit data. Text windows that show statistics, variable and observation names, help, etc. 5 of 21

6 ViSta s Desktop: WorkMap, GuideMap, Datasheet, Text Windows

7 3.1 WorkMaps ViSta s WorkMaps: visualize the structure of an on-going data analysis session. are created by ViSta as the data analysis session progresses. help you remember the data analysis steps you ve taken. let you return to earlier steps for new analyses help you communicate your analysis to others 7 of 21

8 3.1 WorkMaps In this example the analyst 1. Loaded in data named Car-Prefs 2. Did a principal component analysis (PrmCmp) of these data, producing the model named PCA-Car-Prefs. 3. Created an output dataset of the component scores named Scores-PCA-Car-Prefs 4. Loaded in the CarRatings data. 5. Normalized these data. 6. Merged the normalized data with the component scores, creating the Scores&Ratings data. 8 of 21

9 3.2 GuideMaps ViSta s GuideMaps: visually guide you through the steps of your data analysis session. buttons show analysis steps: Dark buttons show suggested steps. change after a step is taken. The button highlighting changes to show you which actions can be taken next. show the step sequence by arrows connecting buttons. let you make choices by clicking on highlighted buttons. buttons have a!! side which makes a data analysis step happen, or links to another guidemap. buttons have a?? side which gives you help about the step. 9 of 21

10 3.2 The Data Analysis GuideMap This guidemap, titled Data Analysis, is the first guidemap shown to you. It presents the basic data analysis cycle. It guides you to 1. Explore the data 2. Transform the data (this step may be skipped) 3. Analyze the data 4. Look at the model created by the analysis. These four steps may be cycled many times. Some buttons are links to other guidemaps. Some are data analysis actions. In the Data Analysis guidemap all buttons are links to other guidemaps. After clicking Link:Explore you see a new guidemap: 10 of 21

11 3.2 The Data Exploration GuideMap After you click on the "Link:Explore" button in the Data Analysis guidemap, you see the Explore Your Data guidemap. The button highlighting in the new guidemap shows you are to use the Show Datasheet button (or return to the Data Analysis guidemap). When you do this you will see the datasheet. After closing the datasheet, the Show Datasheet button turns gray and the next two buttons highlight. Both of these buttons must be used before the next two. In this way you are guided to take data analysis steps in a specific order. 11 of 21

12 4 SpreadPlots for Statistical Visualization ViSta features SpreadPlots, state-of-the art visualization techniques that help you see and explore the structure of data and models: SpreadPlots are multi-window, linked, dynamic statistical graphics. Linkage: A SpreadPlot's individual plots can be linked by the data's observations or variables. Dynamic Graphics: The spinplot spins to communicate 3D structure. All plots can be brushed. 12 of 21

13 4.1 Statistical Visualization and Analysis: Exploratory & Descriptive Exploratory and Descriptive Data Analysis & Visualization Dynamic Exploratory SpreadPlots include linked Histograms, Boxplots, Diamond Plots, Dotplots, Scatterplots, Biplots, Spinplots, Scatterplot Matrices. These plots support brushing and labeling, and are dynamically linked. In the example on the next slide, labels in the Observations window have been selected. These observations also appear in the spinplot, scatterplot and histogram. Points in these three plots may be brushed, labeled, colored, and given distinct symbols. These plots are linked with the other plots. Variable Linkage: Cells of the scatterplot-matrix can be clicked on to select variables for display in the other plots. Descriptive Statistics including Means, Standard Deviations, Variances, Ranges, Quartiles, Medians, Correlations, Covariances, Distances. 13 of 21

14 A SpreadPlot for Exploring Multivariate Data

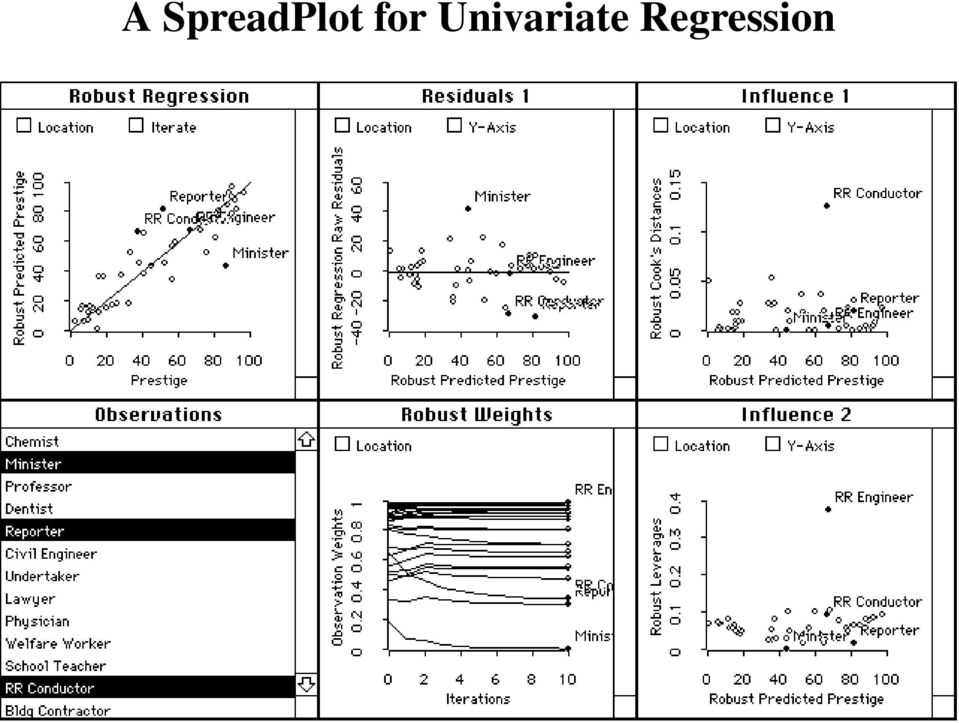
15 4.2 Statistical Visualization and Analysis: Univariate Univariate Analyses and Visualizations Univariate Tests including T- and Z-tests (and confidence intervals) for single sample, paired samples and two independent samples data, with Wilcoxon Signed-Rank and Mann-Whitney tests in appropriate situations. Univariate SpreadPlot - ANOVA - Univariate Analysis of Variance for orthogonal one- or multi-way data. Model may or may not include two-way (but not higher-way) interactions. ANOVA SpreadPlot - The ANOVA visualization is a spreadplot composed of a boxplot, diamond plot, quantile plot, quantilequantile plot and effects plot. Multiple Regression (univariate) - Univariate regression includes simple, multiple, robust, and monotonic regression. Regression SpreadPlot - The regression spreadplot is comprised of a regression plot, influence plots, and residuals plots. Weight plots are also included for robust and monotonic regression. 15 of 21

16 A SpreadPlot for Analysis of Variance

17 A SpreadPlot for Univariate Regression
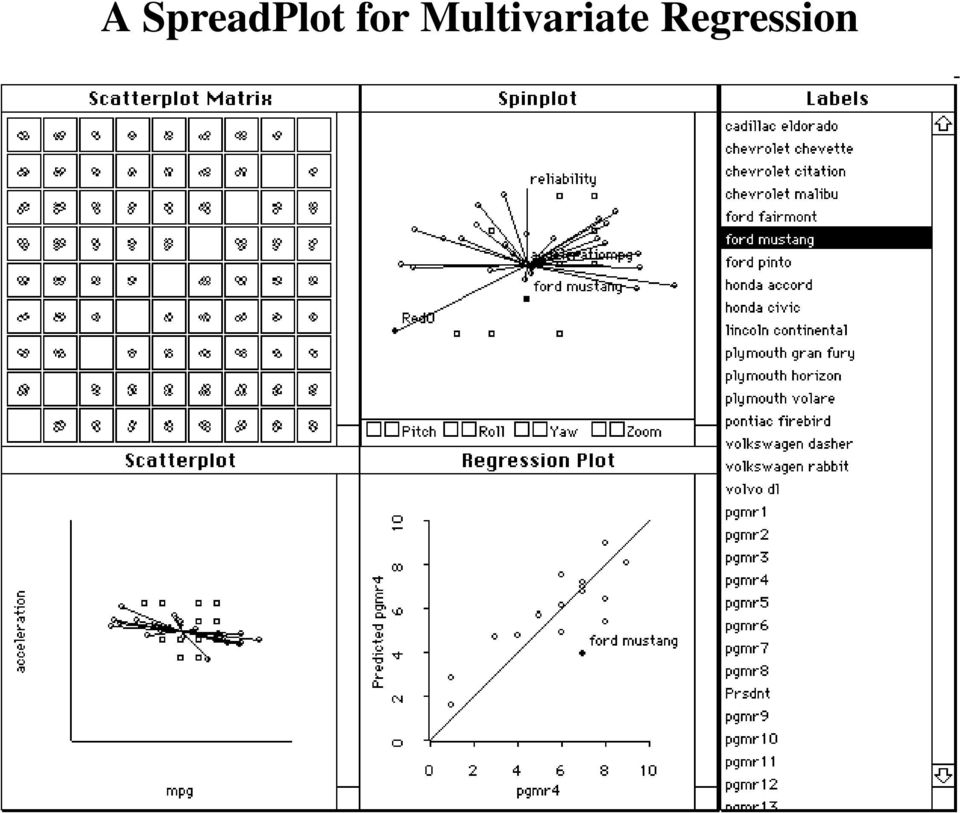
18 4.3 Statistical Visualization and Analysis: Multivariate Multivariate Analyses and Visualizations Multiple Regression (multivariate) - Multivariate Multiple Regression Analysis. The spreadplot consists of a biplot, spinplot, histogram and scatterplot-matrix. Principal Component Analysis of correlations or covariances. The model visualization is a spreadplot composed of a biplot, spin-plot, scree-plot and scatterplot-matrix. Multidimensional Scaling of one or more symmetric or asymmetric matrices. The model visualization is a spreadplot composed of a scatterplot, spin-plot, scree-plot and scatterplotmatrix. The spreadplot supports graphical re-estimation of model parameters. Correspondence Analysis (simple) of two-way contingency tables. The model visualization is a spreadplot composed of a biplot, spinplot, residuals plot and scree-plot. The spreadplot supports graphical re-estimation of model parameters. 18 of 21

19 A SpreadPlot for Multivariate Regression
20 5: ViSta s Languages ViDAL: ViSta s Data Analysis Language ViDAL consists of functions which correspond directly to menu items. Every menu item is paralleled by an identically-named function (except spaces are replaced by dashes). The Show Datasheet menu item is paralleled by the (show-datasheet) function. ViDAL lets you type at the keyboard rather than use the pointand-click graphical interface. ViDAL also lets you define script files so that you can run analyses automatically without requiring user interaction. XLispStat: The Lisp language underlying ViSta XLisp-Stat is an object-oriented environment for statistical computing and dynamic graphics that is open, extensible and freely available. XLisp-Stat is meant for high-level statistical programming and data analysis by sophisticated statistical data analysts. XLisp-Stat is based on XLisp, a freely available version of Common Lisp, a functional object-oriented computing language. ViSta is written in XLisp, using the XLisp-Stat system. ViSta is also an open and extensible system which provides all of the power of XLisp and XLisp-Stat for the programmer who wishes to extend ViSta's capabilities. 20 of 21

21 6: Conclusions ViSta is designed for data analysts ranging from novice to expert, presenting a structured graphical interface consisting of GuideMaps, WorkMaps and SpreadPlots, but including traditional Menus, Command Lines and Scripts. The audience for complex data analysis software continues to become wider and more naive as the price and availability of software and hardware improves. Thus, ViSta addresses an important data analysis problem. Our guiding principal and our main hypothesis is that data analyses performed in an environment that visually guides and structures analyses will be more accurate more accessible more satisfying than analyses performed in a unstructured environment, especially for inexperienced data analysts. But even more importantly, it is our hypothesis that the most powerful data analysis environment will combine the visually guided and structured environment with traditional data analysis techniques proven useful over the years We are planning on performing usability studies to test this hypothesis. 21 of 21
COMPUTING AND VISUALIZING LOG-LINEAR ANALYSIS INTERACTIVELY
 COMPUTING AND VISUALIZING LOG-LINEAR ANALYSIS INTERACTIVELY Pedro Valero-Mora Forrest W. Young INTRODUCTION Log-linear models provide a method for analyzing associations between two or more categorical
CONTENTS PREFACE 1 INTRODUCTION 1 2 DATA VISUALIZATION 19
 PREFACE xi 1 INTRODUCTION 1 1.1 Overview 1 1.2 Definition 1 1.3 Preparation 2 1.3.1 Overview 2 1.3.2 Accessing Tabular Data 3 1.3.3 Accessing Unstructured Data 3 1.3.4 Understanding the Variables and Observations
SPSS Tests for Versions 9 to 13
 SPSS Tests for Versions 9 to 13 Chapter 2 Descriptive Statistic (including median) Choose Analyze Descriptive statistics Frequencies... Click on variable(s) then press to move to into Variable(s): list
Bill Burton Albert Einstein College of Medicine william.burton@einstein.yu.edu April 28, 2014 EERS: Managing the Tension Between Rigor and Resources 1
 Bill Burton Albert Einstein College of Medicine william.burton@einstein.yu.edu April 28, 2014 EERS: Managing the Tension Between Rigor and Resources 1 Calculate counts, means, and standard deviations Produce
Visualizing Categorical Data in ViSta
 Visualizing Categorical Data in ViSta Pedro M. Valero-Mora Universitat de València-EG Email: valerop@uv.es Forrest W. Young University of North Carolina Email: forrest@unc.edu Michael Friendly York University
Scatter Plots with Error Bars
 Chapter 165 Scatter Plots with Error Bars Introduction The procedure extends the capability of the basic scatter plot by allowing you to plot the variability in Y and X corresponding to each point. Each
Introduction to Exploratory Data Analysis
 Introduction to Exploratory Data Analysis A SpaceStat Software Tutorial Copyright 2013, BioMedware, Inc. (www.biomedware.com). All rights reserved. SpaceStat and BioMedware are trademarks of BioMedware,
Exploratory Data Analysis with MATLAB
 Computer Science and Data Analysis Series Exploratory Data Analysis with MATLAB Second Edition Wendy L Martinez Angel R. Martinez Jeffrey L. Solka ( r ec) CRC Press VV J Taylor & Francis Group Boca Raton
SPSS Explore procedure
 SPSS Explore procedure One useful function in SPSS is the Explore procedure, which will produce histograms, boxplots, stem-and-leaf plots and extensive descriptive statistics. To run the Explore procedure,
Bowerman, O'Connell, Aitken Schermer, & Adcock, Business Statistics in Practice, Canadian edition
 Bowerman, O'Connell, Aitken Schermer, & Adcock, Business Statistics in Practice, Canadian edition Online Learning Centre Technology Step-by-Step - Excel Microsoft Excel is a spreadsheet software application
Getting started manual
 Getting started manual XLSTAT Getting started manual Addinsoft 1 Table of Contents Install XLSTAT and register a license key... 4 Install XLSTAT on Windows... 4 Verify that your Microsoft Excel is up-to-date...
R with Rcmdr: BASIC INSTRUCTIONS
 R with Rcmdr: BASIC INSTRUCTIONS Contents 1 RUNNING & INSTALLATION R UNDER WINDOWS 2 1.1 Running R and Rcmdr from CD........................................ 2 1.2 Installing from CD...............................................
SPSS Manual for Introductory Applied Statistics: A Variable Approach
 SPSS Manual for Introductory Applied Statistics: A Variable Approach John Gabrosek Department of Statistics Grand Valley State University Allendale, MI USA August 2013 2 Copyright 2013 John Gabrosek. All
Data Analysis Tools. Tools for Summarizing Data
 Data Analysis Tools This section of the notes is meant to introduce you to many of the tools that are provided by Excel under the Tools/Data Analysis menu item. If your computer does not have that tool
ADD-INS: ENHANCING EXCEL
 CHAPTER 9 ADD-INS: ENHANCING EXCEL This chapter discusses the following topics: WHAT CAN AN ADD-IN DO? WHY USE AN ADD-IN (AND NOT JUST EXCEL MACROS/PROGRAMS)? ADD INS INSTALLED WITH EXCEL OTHER ADD-INS
Descriptive Statistics and Exploratory Data Analysis
 Descriptive Statistics and Exploratory Data Analysis Dean s s Faculty and Resident Development Series UT College of Medicine Chattanooga Probasco Auditorium at Erlanger January 14, 2008 Marc Loizeaux,
Lecture 2: Descriptive Statistics and Exploratory Data Analysis
 Lecture 2: Descriptive Statistics and Exploratory Data Analysis Further Thoughts on Experimental Design 16 Individuals (8 each from two populations) with replicates Pop 1 Pop 2 Randomly sample 4 individuals
Lecture 2. Summarizing the Sample
 Lecture 2 Summarizing the Sample WARNING: Today s lecture may bore some of you It s (sort of) not my fault I m required to teach you about what we re going to cover today. I ll try to make it as exciting
Additional sources Compilation of sources: http://lrs.ed.uiuc.edu/tseportal/datacollectionmethodologies/jin-tselink/tselink.htm
 Mgt 540 Research Methods Data Analysis 1 Additional sources Compilation of sources: http://lrs.ed.uiuc.edu/tseportal/datacollectionmethodologies/jin-tselink/tselink.htm http://web.utk.edu/~dap/random/order/start.htm
Getting started in Excel
 Getting started in Excel Disclaimer: This guide is not complete. It is rather a chronicle of my attempts to start using Excel for data analysis. As I use a Mac with OS X, these directions may need to be
Data analysis process
 Data analysis process Data collection and preparation Collect data Prepare codebook Set up structure of data Enter data Screen data for errors Exploration of data Descriptive Statistics Graphs Analysis
Directions for using SPSS
 Directions for using SPSS Table of Contents Connecting and Working with Files 1. Accessing SPSS... 2 2. Transferring Files to N:\drive or your computer... 3 3. Importing Data from Another File Format...
Tutorial for proteome data analysis using the Perseus software platform
 Tutorial for proteome data analysis using the Perseus software platform Laboratory of Mass Spectrometry, LNBio, CNPEM Tutorial version 1.0, January 2014. Note: This tutorial was written based on the information
C:\Users\<your_user_name>\AppData\Roaming\IEA\IDBAnalyzerV3
 Installing the IDB Analyzer (Version 3.1) Installing the IDB Analyzer (Version 3.1) A current version of the IDB Analyzer is available free of charge from the IEA website (http://www.iea.nl/data.html,
business statistics using Excel OXFORD UNIVERSITY PRESS Glyn Davis & Branko Pecar
 business statistics using Excel Glyn Davis & Branko Pecar OXFORD UNIVERSITY PRESS Detailed contents Introduction to Microsoft Excel 2003 Overview Learning Objectives 1.1 Introduction to Microsoft Excel
Data Analysis in SPSS. February 21, 2004. If you wish to cite the contents of this document, the APA reference for them would be
 Data Analysis in SPSS Jamie DeCoster Department of Psychology University of Alabama 348 Gordon Palmer Hall Box 870348 Tuscaloosa, AL 35487-0348 Heather Claypool Department of Psychology Miami University
Getting Started with Minitab 17
 2014 by Minitab Inc. All rights reserved. Minitab, Quality. Analysis. Results. and the Minitab logo are registered trademarks of Minitab, Inc., in the United States and other countries. Additional trademarks
MTH 140 Statistics Videos
 MTH 140 Statistics Videos Chapter 1 Picturing Distributions with Graphs Individuals and Variables Categorical Variables: Pie Charts and Bar Graphs Categorical Variables: Pie Charts and Bar Graphs Quantitative
AMS 7L LAB #2 Spring, 2009. Exploratory Data Analysis
 AMS 7L LAB #2 Spring, 2009 Exploratory Data Analysis Name: Lab Section: Instructions: The TAs/lab assistants are available to help you if you have any questions about this lab exercise. If you have any
 T O P I C 1 2 Techniques and tools for data analysis Preview Introduction In chapter 3 of Statistics In A Day different combinations of numbers and types of variables are presented. We go through these
Introduction Course in SPSS - Evening 1
 ETH Zürich Seminar für Statistik Introduction Course in SPSS - Evening 1 Seminar für Statistik, ETH Zürich All data used during the course can be downloaded from the following ftp server: ftp://stat.ethz.ch/u/sfs/spsskurs/
Silvermine House Steenberg Office Park, Tokai 7945 Cape Town, South Africa Telephone: +27 21 702 4666 www.spss-sa.com
 SPSS-SA Silvermine House Steenberg Office Park, Tokai 7945 Cape Town, South Africa Telephone: +27 21 702 4666 www.spss-sa.com SPSS-SA Training Brochure 2009 TABLE OF CONTENTS 1 SPSS TRAINING COURSES FOCUSING
KSTAT MINI-MANUAL. Decision Sciences 434 Kellogg Graduate School of Management
 KSTAT MINI-MANUAL Decision Sciences 434 Kellogg Graduate School of Management Kstat is a set of macros added to Excel and it will enable you to do the statistics required for this course very easily. To
STATISTICAL ANALYSIS WITH EXCEL COURSE OUTLINE
 STATISTICAL ANALYSIS WITH EXCEL COURSE OUTLINE Perhaps Microsoft has taken pains to hide some of the most powerful tools in Excel. These add-ins tools work on top of Excel, extending its power and abilities
Introduction to Regression and Data Analysis
 Statlab Workshop Introduction to Regression and Data Analysis with Dan Campbell and Sherlock Campbell October 28, 2008 I. The basics A. Types of variables Your variables may take several forms, and it
DESCRIPTIVE STATISTICS AND EXPLORATORY DATA ANALYSIS
 DESCRIPTIVE STATISTICS AND EXPLORATORY DATA ANALYSIS SEEMA JAGGI Indian Agricultural Statistics Research Institute Library Avenue, New Delhi - 110 012 seema@iasri.res.in 1. Descriptive Statistics Statistics
Geostatistics Exploratory Analysis
 Instituto Superior de Estatística e Gestão de Informação Universidade Nova de Lisboa Master of Science in Geospatial Technologies Geostatistics Exploratory Analysis Carlos Alberto Felgueiras cfelgueiras@isegi.unl.pt
BNG 202 Biomechanics Lab. Descriptive statistics and probability distributions I
 BNG 202 Biomechanics Lab Descriptive statistics and probability distributions I Overview The overall goal of this short course in statistics is to provide an introduction to descriptive and inferential
GeoGebra. 10 lessons. Gerrit Stols
 GeoGebra in 10 lessons Gerrit Stols Acknowledgements GeoGebra is dynamic mathematics open source (free) software for learning and teaching mathematics in schools. It was developed by Markus Hohenwarter
An introduction to using Microsoft Excel for quantitative data analysis
 Contents An introduction to using Microsoft Excel for quantitative data analysis 1 Introduction... 1 2 Why use Excel?... 2 3 Quantitative data analysis tools in Excel... 3 4 Entering your data... 6 5 Preparing
IBM SPSS Statistics 20 Part 4: Chi-Square and ANOVA
 CALIFORNIA STATE UNIVERSITY, LOS ANGELES INFORMATION TECHNOLOGY SERVICES IBM SPSS Statistics 20 Part 4: Chi-Square and ANOVA Summer 2013, Version 2.0 Table of Contents Introduction...2 Downloading the
Institute of Actuaries of India Subject CT3 Probability and Mathematical Statistics
 Institute of Actuaries of India Subject CT3 Probability and Mathematical Statistics For 2015 Examinations Aim The aim of the Probability and Mathematical Statistics subject is to provide a grounding in
Spreadsheet software for linear regression analysis
 Spreadsheet software for linear regression analysis Robert Nau Fuqua School of Business, Duke University Copies of these slides together with individual Excel files that demonstrate each program are available
MEASURES OF LOCATION AND SPREAD
 Paper TU04 An Overview of Non-parametric Tests in SAS : When, Why, and How Paul A. Pappas and Venita DePuy Durham, North Carolina, USA ABSTRACT Most commonly used statistical procedures are based on the
Why Taking This Course? Course Introduction, Descriptive Statistics and Data Visualization. Learning Goals. GENOME 560, Spring 2012
 Why Taking This Course? Course Introduction, Descriptive Statistics and Data Visualization GENOME 560, Spring 2012 Data are interesting because they help us understand the world Genomics: Massive Amounts
One-Way ANOVA using SPSS 11.0. SPSS ANOVA procedures found in the Compare Means analyses. Specifically, we demonstrate
 1 One-Way ANOVA using SPSS 11.0 This section covers steps for testing the difference between three or more group means using the SPSS ANOVA procedures found in the Compare Means analyses. Specifically,
An introduction to IBM SPSS Statistics
 An introduction to IBM SPSS Statistics Contents 1 Introduction... 1 2 Entering your data... 2 3 Preparing your data for analysis... 10 4 Exploring your data: univariate analysis... 14 5 Generating descriptive
Using SPSS, Chapter 2: Descriptive Statistics
 1 Using SPSS, Chapter 2: Descriptive Statistics Chapters 2.1 & 2.2 Descriptive Statistics 2 Mean, Standard Deviation, Variance, Range, Minimum, Maximum 2 Mean, Median, Mode, Standard Deviation, Variance,
Testing Group Differences using T-tests, ANOVA, and Nonparametric Measures
 Testing Group Differences using T-tests, ANOVA, and Nonparametric Measures Jamie DeCoster Department of Psychology University of Alabama 348 Gordon Palmer Hall Box 870348 Tuscaloosa, AL 35487-0348 Phone:
IBM SPSS Statistics 20 Part 1: Descriptive Statistics
 CALIFORNIA STATE UNIVERSITY, LOS ANGELES INFORMATION TECHNOLOGY SERVICES IBM SPSS Statistics 20 Part 1: Descriptive Statistics Summer 2013, Version 2.0 Table of Contents Introduction...2 Downloading the
Simple Predictive Analytics Curtis Seare
 Using Excel to Solve Business Problems: Simple Predictive Analytics Curtis Seare Copyright: Vault Analytics July 2010 Contents Section I: Background Information Why use Predictive Analytics? How to use
Why Is EngineRoom the Right Choice? 1. Cuts the Cost of Calculation
 What is EngineRoom? - A Web based data analysis application with an intuitive, drag-and-drop graphical interface. - A suite of powerful, simple-to-use Lean and Six Sigma data analysis tools that you can
Chapter 5 Analysis of variance SPSS Analysis of variance
 Chapter 5 Analysis of variance SPSS Analysis of variance Data file used: gss.sav How to get there: Analyze Compare Means One-way ANOVA To test the null hypothesis that several population means are equal,
IBM SPSS Statistics for Beginners for Windows
 ISS, NEWCASTLE UNIVERSITY IBM SPSS Statistics for Beginners for Windows A Training Manual for Beginners Dr. S. T. Kometa A Training Manual for Beginners Contents 1 Aims and Objectives... 3 1.1 Learning
Curriculum Map Statistics and Probability Honors (348) Saugus High School Saugus Public Schools 2009-2010
 Saugus High School Saugus Public Schools 2009-2010") Curriculum Map Statistics and Probability Honors (348) Saugus High School Saugus Public Schools 2009-2010 Week 1 Week 2 14.0 Students organize and describe distributions of data by using a number of different
Curriculum Map Statistics and Probability Honors (348) Saugus High School Saugus Public Schools 2009-2010 Week 1 Week 2 14.0 Students organize and describe distributions of data by using a number of different
4.1 Exploratory Analysis: Once the data is collected and entered, the first question is: "What do the data look like?"
 Data Analysis Plan The appropriate methods of data analysis are determined by your data types and variables of interest, the actual distribution of the variables, and the number of cases. Different analyses
4 Other useful features on the course web page. 5 Accessing SAS
 1 Using SAS outside of ITCs Statistical Methods and Computing, 22S:30/105 Instructor: Cowles Lab 1 Jan 31, 2014 You can access SAS from off campus by using the ITC Virtual Desktop Go to https://virtualdesktopuiowaedu
5 Correlation and Data Exploration
 5 Correlation and Data Exploration Correlation In Unit 3, we did some correlation analyses of data from studies related to the acquisition order and acquisition difficulty of English morphemes by both
There are six different windows that can be opened when using SPSS. The following will give a description of each of them.
 SPSS Basics Tutorial 1: SPSS Windows There are six different windows that can be opened when using SPSS. The following will give a description of each of them. The Data Editor The Data Editor is a spreadsheet
Simple Linear Regression, Scatterplots, and Bivariate Correlation
 1 Simple Linear Regression, Scatterplots, and Bivariate Correlation This section covers procedures for testing the association between two continuous variables using the SPSS Regression and Correlate analyses.
R Commander Tutorial
 R Commander Tutorial Introduction R is a powerful, freely available software package that allows analyzing and graphing data. However, for somebody who does not frequently use statistical software packages,
Service courses for graduate students in degree programs other than the MS or PhD programs in Biostatistics.
 Course Catalog In order to be assured that all prerequisites are met, students must acquire a permission number from the education coordinator prior to enrolling in any Biostatistics course. Courses are
TIPS FOR DOING STATISTICS IN EXCEL
 TIPS FOR DOING STATISTICS IN EXCEL Before you begin, make sure that you have the DATA ANALYSIS pack running on your machine. It comes with Excel. Here s how to check if you have it, and what to do if you
Data exploration with Microsoft Excel: analysing more than one variable
 Data exploration with Microsoft Excel: analysing more than one variable Contents 1 Introduction... 1 2 Comparing different groups or different variables... 2 3 Exploring the association between categorical
Using Excel in Research. Hui Bian Office for Faculty Excellence
 Using Excel in Research Hui Bian Office for Faculty Excellence Data entry in Excel Directly type information into the cells Enter data using Form Command: File > Options 2 Data entry in Excel Tool bar:
Comparing Means in Two Populations
 Comparing Means in Two Populations Overview The previous section discussed hypothesis testing when sampling from a single population (either a single mean or two means from the same population). Now we
StatTools. Statistics Add-In for Microsoft Excel. Version 5.7 September, 2010. Guide to Using
 Guide to Using StatTools Statistics Add-In for Microsoft Excel Version 5.7 September, 2010 Palisade Corporation 798 Cascadilla St Ithaca, NY 14850 (607) 277-8000 http://www.palisade.com Copyright Notice
GENEGOBI : VISUAL DATA ANALYSIS AID TOOLS FOR MICROARRAY DATA
 COMPSTAT 2004 Symposium c Physica-Verlag/Springer 2004 GENEGOBI : VISUAL DATA ANALYSIS AID TOOLS FOR MICROARRAY DATA Eun-kyung Lee, Dianne Cook, Eve Wurtele, Dongshin Kim, Jihong Kim, and Hogeun An Key
AP Statistics: Syllabus 1
 AP Statistics: Syllabus 1 Scoring Components SC1 The course provides instruction in exploring data. 4 SC2 The course provides instruction in sampling. 5 SC3 The course provides instruction in experimentation.
HYPOTHESIS TESTING: CONFIDENCE INTERVALS, T-TESTS, ANOVAS, AND REGRESSION
 HYPOTHESIS TESTING: CONFIDENCE INTERVALS, T-TESTS, ANOVAS, AND REGRESSION HOD 2990 10 November 2010 Lecture Background This is a lightning speed summary of introductory statistical methods for senior undergraduate
Comparison of EngineRoom (6.0) with Minitab (16) and Quality Companion (3)
 with Minitab (16) and Quality Companion (3)") Comparison of EngineRoom (6.0) with Minitab (16) and Quality Companion (3) What is EngineRoom? A Microsoft Excel add in A suite of powerful, simple to use Lean and Six Sigma data analysis tools Built for
Comparison of EngineRoom (6.0) with Minitab (16) and Quality Companion (3) What is EngineRoom? A Microsoft Excel add in A suite of powerful, simple to use Lean and Six Sigma data analysis tools Built for
An analysis method for a quantitative outcome and two categorical explanatory variables.
 Chapter 11 Two-Way ANOVA An analysis method for a quantitative outcome and two categorical explanatory variables. If an experiment has a quantitative outcome and two categorical explanatory variables that
DATA ANALYSIS. QEM Network HBCU-UP Fundamentals of Education Research Workshop Gerunda B. Hughes, Ph.D. Howard University
 DATA ANALYSIS QEM Network HBCU-UP Fundamentals of Education Research Workshop Gerunda B. Hughes, Ph.D. Howard University Quantitative Research What is Statistics? Statistics (as a subject) is the science
Good luck! BUSINESS STATISTICS FINAL EXAM INSTRUCTIONS. Name:
 Glo bal Leadership M BA BUSINESS STATISTICS FINAL EXAM Name: INSTRUCTIONS 1. Do not open this exam until instructed to do so. 2. Be sure to fill in your name before starting the exam. 3. You have two hours
9.2 User s Guide SAS/STAT. Introduction. (Book Excerpt) SAS Documentation
 SAS Documentation") SAS/STAT Introduction (Book Excerpt) 9.2 User s Guide SAS Documentation This document is an individual chapter from SAS/STAT 9.2 User s Guide. The correct bibliographic citation for the complete manual
SAS/STAT Introduction (Book Excerpt) 9.2 User s Guide SAS Documentation This document is an individual chapter from SAS/STAT 9.2 User s Guide. The correct bibliographic citation for the complete manual
EXPLORING SPATIAL PATTERNS IN YOUR DATA
 EXPLORING SPATIAL PATTERNS IN YOUR DATA OBJECTIVES Learn how to examine your data using the Geostatistical Analysis tools in ArcMap. Learn how to use descriptive statistics in ArcMap and Geoda to analyze
Factors affecting online sales
 Factors affecting online sales Table of contents Summary... 1 Research questions... 1 The dataset... 2 Descriptive statistics: The exploratory stage... 3 Confidence intervals... 4 Hypothesis tests... 4
Tutorial 5: Hypothesis Testing
 Tutorial 5: Hypothesis Testing Rob Nicholls nicholls@mrc-lmb.cam.ac.uk MRC LMB Statistics Course 2014 Contents 1 Introduction................................ 1 2 Testing distributional assumptions....................
How To Use Statgraphics Centurion Xvii (Version 17) On A Computer Or A Computer (For Free)
 On A Computer Or A Computer (For Free)") Statgraphics Centurion XVII (currently in beta test) is a major upgrade to Statpoint's flagship data analysis and visualization product. It contains 32 new statistical procedures and significant upgrades
Statgraphics Centurion XVII (currently in beta test) is a major upgrade to Statpoint's flagship data analysis and visualization product. It contains 32 new statistical procedures and significant upgrades
BASIC STATISTICAL METHODS FOR GENOMIC DATA ANALYSIS
 BASIC STATISTICAL METHODS FOR GENOMIC DATA ANALYSIS SEEMA JAGGI Indian Agricultural Statistics Research Institute Library Avenue, New Delhi-110 012 seema@iasri.res.in Genomics A genome is an organism s
Assumptions. Assumptions of linear models. Boxplot. Data exploration. Apply to response variable. Apply to error terms from linear model
 Assumptions Assumptions of linear models Apply to response variable within each group if predictor categorical Apply to error terms from linear model check by analysing residuals Normality Homogeneity
A fast, powerful data mining workbench designed for small to midsize organizations
 FACT SHEET SAS Desktop Data Mining for Midsize Business A fast, powerful data mining workbench designed for small to midsize organizations What does SAS Desktop Data Mining for Midsize Business do? Business
CHARTS AND GRAPHS INTRODUCTION USING SPSS TO DRAW GRAPHS SPSS GRAPH OPTIONS CAG08
 CHARTS AND GRAPHS INTRODUCTION SPSS and Excel each contain a number of options for producing what are sometimes known as business graphics - i.e. statistical charts and diagrams. This handout explores
Factor Analysis. Chapter 420. Introduction
 Chapter 420 Introduction (FA) is an exploratory technique applied to a set of observed variables that seeks to find underlying factors (subsets of variables) from which the observed variables were generated.
Using Excel for Data Manipulation and Statistical Analysis: How-to s and Cautions
 2010 Using Excel for Data Manipulation and Statistical Analysis: How-to s and Cautions This document describes how to perform some basic statistical procedures in Microsoft Excel. Microsoft Excel is spreadsheet
January 26, 2009 The Faculty Center for Teaching and Learning
 THE BASICS OF DATA MANAGEMENT AND ANALYSIS A USER GUIDE January 26, 2009 The Faculty Center for Teaching and Learning THE BASICS OF DATA MANAGEMENT AND ANALYSIS Table of Contents Table of Contents... i
When to use Excel. When NOT to use Excel 9/24/2014
 Analyzing Quantitative Assessment Data with Excel October 2, 2014 Jeremy Penn, Ph.D. Director When to use Excel You want to quickly summarize or analyze your assessment data You want to create basic visual
7. Comparing Means Using t-tests.
 7. Comparing Means Using t-tests. Objectives Calculate one sample t-tests Calculate paired samples t-tests Calculate independent samples t-tests Graphically represent mean differences In this chapter,
Introduction to StatsDirect, 11/05/2012 1
 INTRODUCTION TO STATSDIRECT PART 1... 2 INTRODUCTION... 2 Why Use StatsDirect... 2 ACCESSING STATSDIRECT FOR WINDOWS XP... 4 DATA ENTRY... 5 Missing Data... 6 Opening an Excel Workbook... 6 Moving around
Moderation. Moderation
 Stats - Moderation Moderation A moderator is a variable that specifies conditions under which a given predictor is related to an outcome. The moderator explains when a DV and IV are related. Moderation
SPSS: Getting Started. For Windows
 For Windows Updated: August 2012 Table of Contents Section 1: Overview... 3 1.1 Introduction to SPSS Tutorials... 3 1.2 Introduction to SPSS... 3 1.3 Overview of SPSS for Windows... 3 Section 2: Entering
Data Analysis. Using Excel. Jeffrey L. Rummel. BBA Seminar. Data in Excel. Excel Calculations of Descriptive Statistics. Single Variable Graphs
 Using Excel Jeffrey L. Rummel Emory University Goizueta Business School BBA Seminar Jeffrey L. Rummel BBA Seminar 1 / 54 Excel Calculations of Descriptive Statistics Single Variable Graphs Relationships
The Dummy s Guide to Data Analysis Using SPSS
 The Dummy s Guide to Data Analysis Using SPSS Mathematics 57 Scripps College Amy Gamble April, 2001 Amy Gamble 4/30/01 All Rights Rerserved TABLE OF CONTENTS PAGE Helpful Hints for All Tests...1 Tests
Using Excel for Statistical Analysis
 2010 Using Excel for Statistical Analysis Microsoft Excel is spreadsheet software that is used to store information in columns and rows, which can then be organized and/or processed. Excel is a powerful
The Excel 2007 Data & Statistics Cookbook A Point-and-Click! Guide
 The Excel 2007 Data & Statistics Cookbook A Point-and-Click! Guide Larry A. Pace Anderson University TwoPaces LLC Anderson SC Pace, Larry A. The Excel 2007 Data & Statistics Cookbook: A Point-and-Click!
Teaching Biostatistics to Postgraduate Students in Public Health
 Teaching Biostatistics to Postgraduate Students in Public Health Peter A Lachenbruch - h s hgeles, California, USA 1. Introduction This paper describes how biostatistics is taught in US Schools of Public
A DATA ANALYSIS TOOL THAT ORGANIZES ANALYSIS BY VARIABLE TYPES. Rodney Carr Deakin University Australia
 A DATA ANALYSIS TOOL THAT ORGANIZES ANALYSIS BY VARIABLE TYPES Rodney Carr Deakin University Australia XLStatistics is a set of Excel workbooks for analysis of data that has the various analysis tools
WebFOCUS RStat. RStat. Predict the Future and Make Effective Decisions Today. WebFOCUS RStat
 Information Builders enables agile information solutions with business intelligence (BI) and integration technologies. WebFOCUS the most widely utilized business intelligence platform connects to any enterprise