Generation 2030 AFRICA. AUGUST 2014 Division of DATA, Research, and Policy
|
|
|
- Collin Quinn
- 10 years ago
- Views:
Transcription
1 Generation 23 AFRICA AUGUST 214 Division of DATA, Research, and Policy

2 Disclaimer The designations in this publication do not imply an opinion on legal status of any country or territory, or of its authorities, or the delimitation of frontiers. For more information on this report, please contact or Comments are welcome. For corrigenda subsequent to printing, please see UNICEF August 214 Division of Data, Research, and Policy ISBN:

3 Generation 23 AFRICA Child demographics in
4 Report team This report was prepared by Danzhen You, Lucia Hug and David Anthony, Division of Data, Research, and Policy at UNICEF Headquarters. The report was completed with the guidance and support of Tessa Wardlaw, Associate Director (Data and Analytics), Division of Data, Research, and Policy; Holly Newby, Chief, Data Analysis Unit, Data and Analytics, Division of Data, Research, and Policy; George Laryea-Adjei, Deputy Director, Division of Data, Research, and Policy; and Jeffrey O'Malley, Director, Division of Data, Research, and Policy. Danzhen You is a Statistics and Monitoring Specialist in the Data and Analytics Section of UNICEF s Division of Data, Research, and Policy. Lucia Hug is a Statistics Specialist consulting with the Data and Analytics Section. David Anthony is Chief of UNICEF s Policy Advocacy and Coordination Unit in the same division. Design and layout Upasana Young French edition Gwen Baillet, Marc Chalamet, Angeline Hadman, Maria Janum, Laure Journaud, Florence Lesur Acknowledgements Special thanks to Jingxian Wu for her assistance in preparing the data analysis and to Yao Chen, Colleen Murray and Khin Wityee Oo for their assistance in fact checking and proof reading this report, and to Anita Palathingal for copy editing. This publication has been a collaboration between staff at UNICEF Headquarters and its two main offices in Eastern and Southern and West and Central respectively. From the Eastern and Southern office, thanks go to Leila Pakkala, Regional Director, Eastern and Southern ; Edward Addai; James Elder; Mark Hereward; Kun Li. From the West and Central office, thanks go to Manuel Fontaine, Regional Director, West and Central ; Christine Muhigana, Deputy Regional Director, West and Central ; Thierry Delvigne-Jean; Thi Minh Phuong Ngo. From country offices: thanks go to Suzanne Mary Beukes; Angela Travis. From UNICEF headquarters in New York, thanks go to Yoka Brandt, Deputy Executive Director; Geeta Rao Gupta, Deputy Executive Director; Cynthia McCaffrey, Director and Chief of Staff; Jeffrey O'Malley, Director, Division of Data, Research, and Policy; Paloma Escudero, Director, Division of Communication; Tessa Wardlaw, Associate Director (Data and Analytics), Division of Data, Research, and Policy; Edward Carwardine, Deputy Director, Division of Communication; Holly Newby, Chief, Data Analysis Unit, Data and Analytics, Division of Data, Research, and Policy; Elizabeth Dettori; Archana Dwivedi; Martin C Evans; Priscilla Idele; Julia Krasevec; Catherine Langevin-Falcon; Marixie Mercado; Nicholas Rees; Annette Rolfe. The authors extend their sincere gratitude to the United Nations Population Division for providing the estimates and projections that form the basis of the report s analysis and for providing useful comments, and to the World Bank for providing data on poverty.

5 Generation 23 Generation 23 AFRICA 5...Introduction 7...Executive summary 13...Chapter 1 Child demographics in Total population C F child, adolescent, working-age and elderly populations Women of reproductive age fertility Births Mortality, life expectancy and dependency Density and urbanization fragility and poverty 43...Chapter 2 Policy issues 5...Appendix 56...Tables: Demographic indicators 1

6 AFRICA United Nations Economic Commission for (UNECA) regions Cabo Verde Senegal Gambia Guinea- Bissau Sierra Leone West BEN Benin BFA Burkina Faso CPV Cabo Verde CIV Côte d'ivoire GMB Gambia GHA Ghana GIN Guinea GNB Guinea-Bissau LBR Liberia MLI Mali NER Niger NGA Nigeria SEN Senegal SLE Sierra Leone TGO Togo Note: The regional aggregates follow the United Nations Economic Commission for (UNECA) regions. The detailed classification can be found at node/2798/. Mauritania Liberia Guinea Morocco Togo Benin Ghana Côte d'ivoire Sao Tome Cameroon and Principe Equatorial Gabon Guinea Congo Central CMR Cameroon CAF Central n Republic TCD Chad COG Congo GNQ Equatorial Guinea GAB Gabon STP Sao Tome and Principe Southern AGO BWA LSO MWI MUS MOZ NAM ZAF SWZ ZMB ZWE Mali Burkina Faso Angola Botswana Lesotho Malawi Mauritius Mozambique Namibia South Swaziland Zambia Zimbabwe Algeria Niger Nigeria Tunisia Libya Chad Angola Namibia Central n Republic Democratic Republic of the Congo Zambia Botswana South Egypt Sudan North DZA Algeria EGY Egypt LBY Libya MRT Mauritania MAR Morocco SDN Sudan TUN Tunisia South Sudan Zimbabwe Uganda Malawi Lesotho Eritrea Ethiopia Kenya United Republic of Tanzania Mozambique Swaziland Eastern BDI Burundi COM Comoros COD Democratic Republic of the Congo DJI Djibouti ERI Eritrea ETH Ethiopia KEN Kenya MDG Madagascar RWA Rwanda SYC Seychelles SOM Somalia SSD South Sudan UGA Uganda TZA United Republic of Tanzania Djibouti Somalia Rwanda Burundi Comoros Madagascar Seychelles Mauritius Note on maps: All maps included in this publication are stylized and not to scale. They do not reflect a position by UNICEF on the legal status of any country or area or the delimitation of any frontiers. The final boundary between the Republic of the Sudan and the Republic of South Sudan has not yet been determined. The final status of the Abyei area has not yet been determined. Source for page 3: UNICEF analysis based on United Nations, Department of Economic and Social Affairs, Population Division, World Population Prospects: The 212 Revision (UN WPP), United Nations, New York,

7 AFRICA CHILD Population under 18 by generation MLI MDG TZA SLE BFA ERI DZA GENERATION 215 MAR KEN MOZ BDI TCD GIN GHA NER ZWE UGA EGY CIV BEN CMR MLI ETH MDG MWI NGA TZA ZAF DZA AGO ZMB SEN SSD ZWE SOM COD GENERATION 21 LBR TGO COG MWI KEN MAR MOZ ZAF NER DZA TCD AGO GHA UGA EGY SEN CIV SOM GENERATION SDN ZWE NGA COD CMR BDI 25 ZMB MLI GIN ETH AGO SSD MDG BEN RWA TZA RWA KEN ZAF BEN MOZ MAR MWI TCD NER BDI BFA GHA UGA EGY GIN CIV TGO CMR NGA COD SDN COG GENERATION 23 SDN SLE ZMB SEN SOM ETH AGO SSD SEN ZAF RWA BFA MWI BFA DZA SEN SOM BDI NGA MOZ GIN MDG KEN MLI COG ZWE TGO UGA ETH AFRICA CMR COD NER EGY CIV TZA GHA SDN TCD ZMB SSD RWA BEN ERI SLE MAR GENERATION 198 AGO DZA ZAF EGY NGA TZA KEN UGA COD ETH SDN MAR GENERATION 195 EGY NGA COD TZA ETH ZAF DZA 195 The size of each circle is proportional to the population of children under 18. 3

8 4 Introduction UNICEF/ETHA213_436/Jiro Ose
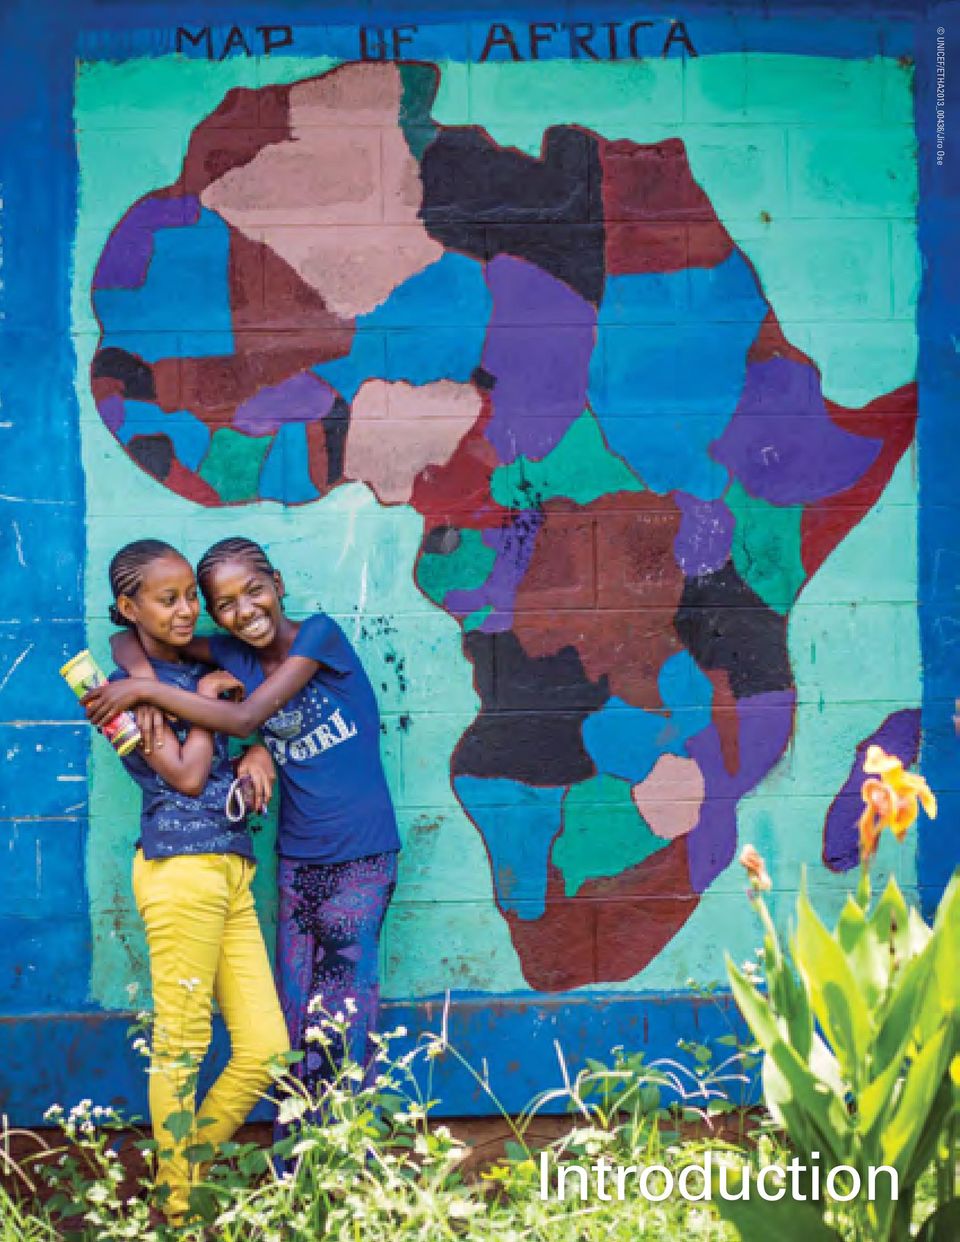
9 Generation 23 Introduction It can be said that there are four basic and primary things that the mass of people in a society wish for: to live in a safe environment, to be able to work and provide for themselves, to have access to good public health and to have sound educational opportunities for their children. These words belong to Nelson Mandela, s most revered leader in modern times, and reflect his hopes for his continent s over 1 billion inhabitants. Until relatively recently, much of has been among the economically least developed and least densely populated places on earth, replete with villages and rural communities. But is changing rapidly, in its economy, trade and investment; in climate change; in conflict and stability; in urbanization, migration patterns and most of all in demographics. Demographics are key to s increasing centrality to the global development and growth agenda. In particular, the demographics of s children are experiencing a shift on a scale perhaps unprecedented in human history. Consider this: on current trends, almost 2 billion babies will be born in in the next 35 years. Over the same period s under-18 population will increase by two thirds, reaching almost 1 billion by mid-century; and close to half of the world population of children will be n by the end of the 21st century. Among the most surprising findings of this report s predecessor then entitled Generation 225 and Beyond * released in November 212 was the massive shift in the world s child population towards in recent decades. Since then, revised global population projections from the United Nations Population Division, based on the latest version of World Population Prospects, the 212 Revision released in 213, indicate an even stronger move in global child demographics towards. Our previous reporting of one in every three children in the world living in by 25 has proven to be an underestimate: the population revisions now indicate that by mid-century the continent will be home to around 41 per cent of all of the world s births, 4 per cent of all global under-fives, and 37 per cent of all children (under-18s). The Generation 23 project renamed to reflect the end date of the post-215 agenda that is beginning to emerge and to focus on child demographic shifts in the years running up to 23 and beyond provides key data and analysis, and raises policy issues that will foster debate and discussion and influence decisions in the coming years. This report, focusing exclusively on, has two key components. Chapter 1 provides an in-depth analysis of child demographic trends in, for the region as a whole, by subregion, and country-by-country, and contextualizes some of these trends. Chapter 2 seeks to raise some key policy questions though by no means exhaustively on the implications of s child demographics for the continent itself and for the world. The authors acknowledge that the actual demographic trends may differ from the projections due to policy interventions and changes in underlying assumptions. For example, we are aware that different rates of economic growth among nations may alter the composition of countries classified as low-income, middle-income and high-income; or that policies may change the rates of fertility or urbanization. Nonetheless, we consider that the key points highlighted in this review of demographic trends have important implications for global, regional and national actions to help realize the rights of all of the continent s children in the 21st century, foster inclusive and sustainable development, and set the ground for a more peaceful, stable and prosperous. * You, D. and Anthony, D., Generation 225 and Beyond. Occasional Papers, No. 1, UNICEF,

10 UNICEF/ETHA_214_189/Jiro Ose Generation 23 : Executive summary 6
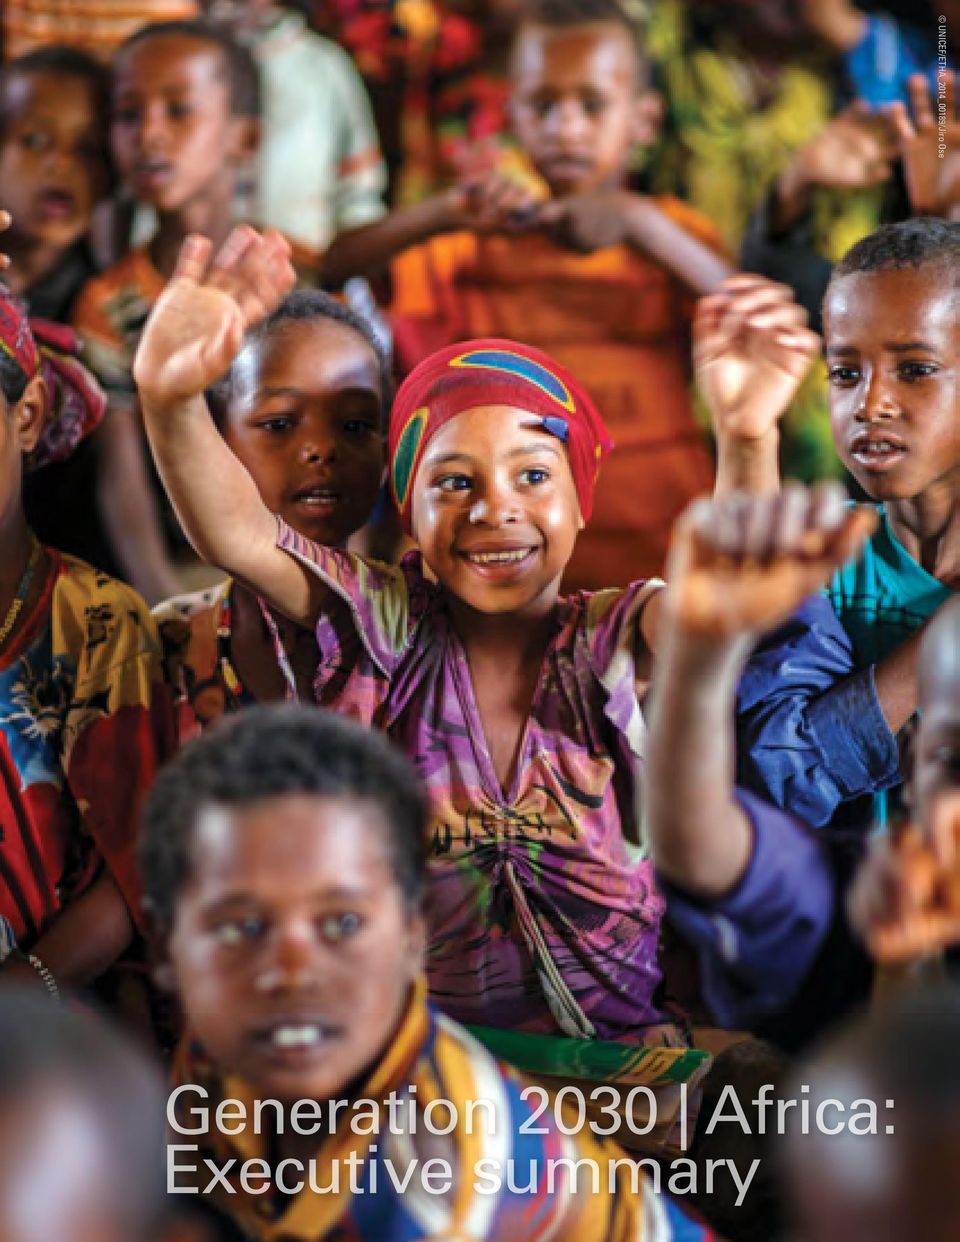
11 Generation 23 Generation 23 Executive summary Four in 1 of the world s people will be n by the end of this century has experienced a marked increase in its population in last few decades. Its current population is five times its size in 195. And the continent s rapid population expansion is set to continue, with its inhabitants doubling from 1.2 billion to 2.4 billion between 215 and 25, and eventually reaching 4.2 billion by 21. The future of humanity is increasingly n. More than half the projected 2.2 billion rise in the world population in is expected to take place in, even though the continent s population growth rate will slow. On current trends, within 35 years, 1 in every 4 people will be n, rising to 4 in 1 people by the end of the century. Back in 195, only 9 among 1 of the world s number of inhabitants were n. With its inhabitants set to soar, will become increasingly crowded, with its population density projected to increase from 8 persons per square kilometre in 195 to 39 in 215 and to about 8 by mid-century. A billion children will live in by mid-century In 25, around 41 per cent of the world s births, 4 per cent of all under-fives, 37 per cent of all children under 18 and 35 per cent of all adolescents will be n higher than previously projected. In 195, only about 1 per cent of the world s births, under-fives, under-18s and adolescents were n. The population of s under-fives will swell by 51 per cent from 179 million in 215 to 271 million in 25 and its overall child population (under-18s) will increase by two thirds from 547 million in 215 to almost 1 billion by mid-century. It is projected that 1.1 billion children under 18 will be living in by 21, accounting for almost half (47 per cent) of the world population of children at that time. has the highest child dependency ratio in the world More than any other region, s children lie at the heart of its demographic and social transition. Today, almost 47 per cent of ns are children under 18. In 15 n countries, more than half of the total population are children under 18. has the highest child dependency ratio 73 children under age 15 per 1 persons of working age in 215, close to double the global average. This ratio is projected to decline steadily as fertility rates ebb and the working-age population expands, but will still remain far higher than other regions. In contrast, s old-age dependency ratio (defined as elderly person 65 years and older per 1 working-age persons) is expected to increase slowly from a very low level of 6 in 215 to 9 in 25 and climb to 22 in 21. These ratios will be far, far lower than anywhere else. 7

12 Almost 2 billion babies will be born in between 215 and 25 due to high fertility rates and increasing number of women of reproductive age Continued high rates of fertility and an increasing number of women of reproductive age are the driving force behind s surge in births and children, although divergences have appeared between countries and communities within countries in the region. Each n woman on average will have 4.7 children in far above the global average of 2.5. Niger has the highest total fertility rate of any country, with an average of 7.5 children per woman in 215. In total, 15 n countries will have an average fertility rate of 5 children or more per woman in 215. In the coming decades, s fertility rates are expected to drop in some cases sharply but will stay well above the rest of the world. s population surge has swelled its ranks of women of reproductive age (15 49), from 54 million in 195 to 28 million in 215; on current trends, this figure will further increase to 47 million in 23 and to 67 million in 25. In 195, only 11 million n babies were born. This number has increased to more than 4 million in 215 and will continue to expand within the next 35 years. By mid-century, 41 per cent of the world s births will take place in, and almost 2 billion births will take place on this continent alone over the next 35 years or so. The annual number of births in is only estimated to decline towards the end of the century. Child survival has improved in, but the continent still accounts for half of all child deaths, and this figure is set to rise to around 7 per cent by mid-century There has been considerable progress on child survival in since 199 and particularly since the year 2. But faster progress in other regions has left with the highest concentration of global under-five and under-18 deaths of any region. In, one in every 11 children born still dies before their fifth birthday, a rate 14 times greater than in the average in high-income countries. The continent currently accounts for more than half of the world s child deaths. This share will continue to rise to around 7 per cent by the middle of the century, given the continent s current mortality, fertility and demographic levels and trends, and assumptions of, continued rates of progress elsewhere. Life expectancy for s children has risen sharply in recent decades but is still shorter than the global average; within 2 years, will have its first generation of children who can expect to reach pensionable age Life is still shorter in than anywhere else on earth. In the 195s, life expectancy at birth in was less than 4 years about 3 years shorter than in the developed regions of the world at that time. Today, ns average life expectancy at birth is 58 years, a considerable gain but still a full 12 years shorter than the global average. By 235, as a continent will have its first generation of children that can expect to reach the pensionable age of 65 years, as life expectancy at birth by this year will rise above 65 years for the first time. 8

13 Generation 23 Continuous urbanization will most likely lead to the majority of s people and children living in cities in less than 25 years The image of as a rural continent is fast changing amid rapid urban growth. Currently, 4 per cent of 's population lives in cities. The past few decades have seen a frenetic pace of urbanization, considering that in 195 just 14 per cent, and in 198 just 27 per cent of the continental population was classified as living in urban areas. By late 23s, is set to become a continent with more population living in urban than in rural areas. On current trends, by mid-century almost 6 per cent of 's population will live in cities. s urban children are increasingly likely to grow up in the continent s rapidly expanding megacities with 1 million or more inhabitants. Lagos, 's second biggest urban agglomeration, will see its population swell by 1.8 times over the next 15 years from 13 million in 215 to 24 million in 23, while the populace of Al-Qahirah (Cairo), currently in first place, will expand from 19 million to 25 million over the same period. Today three in 1 of s children are living in fragile and conflict-affected contexts Conflict and fragility continue to undermine human rights and social and economic progress in a number of n countries. Of the 34 countries classified by the World Bank in 214 as having fragile and conflict-affected contexts, 2 are n. Around one fourth of the continent's population resides in these 2 countries, which also account for almost three in 1 n children under 18, totalling 143 million. Almost 3 in every 1 births in, and one third of all under-five deaths in, occur in countries with fragile and conflict-affected contexts. Four in 1 of ns and almost half of sub-saharan 's populace live below the international poverty line of US$1.25 per day About 6 per cent of the n population and 7 per cent of sub-saharan -- survives on less than US$2 per day. In the two subregions of Eastern and West, about three quarters of the population lives on less than US$2 per day. Extreme poverty is also rife on the continent; around 4 per cent of 's population, and almost half (48 per cent) of sub-saharan live on less US$1.25 per day. Divergences in fertility rates are marked in sub-saharan, with disparities highest in West and Central between richest and poorest Fertility rates are highest among the poorest n communities. In the Democratic Republic of the Congo, for example, women in the lowest wealth quintile have on average 7.4 children, 3.2 children more than women in the wealthiest quintile. Women in the poorest quintile in Chad, the Democratic Republic of the Congo, Ethiopia, Mali, Niger, Nigeria and the United Republic of Tanzania have on average 2-4 children more than women in the wealthiest quintile. Similar trends are prevalent in other countries. 9

14 Special attention is required for Nigeria, which is the country with the largest increase in absolute numbers of both births and child population At the country level, the greatest number of births in takes place in Nigeria; by 215 one fifth of the continent s births will take place in that country alone, accounting for 5 per cent of all global births. From 215 to 23, 136 million births will take place in Nigeria 19 per cent of all n babies and 6 per cent of the global total. By 25, Nigeria alone will account for almost one tenth of all births in the world. In absolute terms, Nigeria is projected to add from 231 to 25 an additional 224 million babies (21 per cent of the births in and 8 per cent of all births in the world). Niger, Mali and other smaller n nations with high fertility rates and large relative projected increases in child and total population in the world also require particular attention and investment At the country level, in 215 the highest fertility in the world is estimated in Niger, with 7.5 children per woman, followed by Mali with 6.8 children per woman. In 25, their fertility levels are projected to remain the highest in at 4.8 for Niger and 4. for Mali. Niger is also expected to have the largest percentage increase in the number of births more than doubling from 1 million in 215 to 2.5 million babies in 25. Niger is projected to have the largest relative increase in its total population its population in 25 (69 million) will be more than triple the population in 215 (19 million). In 21, 24 million people are projected to live in Niger. Investing in children will be paramount for to realize the rights of its burgeoning child population and reap a potential demographic dividend Almost 2 billion babies will be born in within 35 years and almost 1 billion children, nearly 4 per cent of the world s total will live in by mid-century. If investments are made in expanded and improved health care, education and protection and participation mechanisms, these 1 billion children and their predecessors, the children of today and tomorrow, have the potential to transform the continent, breaking centuries old cycles of poverty and inequity. Moreover, the continent could reap the vast potential economic benefits experienced previously in other regions and countries from its changing age structure, with lower dependency ratios and an expanded labour force. But reaping the demographic dividend will heavily depend on investing now in human capital. Supporting s poor families to do this for their children will be paramount if is to take full advantage of its demographic transition in the coming decades. An opposite scenario is also possible. Unless investment in the continent s children is prioritized, the sheer burden of population expansion has the potential to undermine attempts to eradicate poverty through economic growth, and worse, could result in rising poverty and marginalization of many if economic growth were to falter. Without equitable investment in children, prioritizing the poorest and most disadvantaged in the coming decades, also risks repeating the mistakes of other continents and experiencing ever-widening disparities among its children even as its economy prospers, with negative implications for human rights, employment, sustained growth and political stability. 1

15 Generation 23 Investing in girls and women, especially in reproductive health, education, and preventing child marriage is key to s demographic transition Demographic trends are not inevitable; most are policy responsive. A discourse must emerge on how to extend access to greater reproductive health services to s families including culturally sensitive reproductive health education and services for women and particularly adolescent females to reduce the unmet need in family planning. Investing in and empowering girls and young women will be imperative to slow adolescent fertility rates, and build an fit for all. Expanded programmes to end child marriage (defined as a union in which one or both parties are under age 18), which is highly prevalent across the continent, must also be included as part of efforts to address s demographic transition. Child marriage is a determining factor in sustaining elevated rates of adolescent pregnancy, high lifetime fertility rates and exclusion from education. Prioritizing girls education in will be paramount. Studies clearly show that educated women delay their first pregnancy, and space their births more widely than women who lack education, and are more likely to ensure that their children go to and stay in school. Empowerment of girls and women in must go beyond the statistics, however, to the roots of discrimination, marginalization and violence that undermine their rights. Cultural, social, economic and political barriers that perpetuate the disempowerment of women must be urgently addressed if is to manage its demographic transition and reap the full rewards of prosperity that a demographic dividend can bring. National development plans must take greater account of projected shifts in s child population and support better data systems With many n countries set to see unprecedented absolute increases in their child and overall populations, national development planning and systems strengthening must be adapted and sharpened to prepare for these demographic shifts. Demographic analysis at national and particularly at the subnational levels must become a much more integral component of development programming in. Civil registration and vital statistics (CRVS) systems will be essential for strengthening development planning at the national and subnational levels. Without accurate demographic data and analysis, it will be difficult to plan adequately for the required increases in essential services that s burgeoning child population will require. UNICEF considers it imperative that a discourse takes place on s child demographics, poverty and inequity and rights, and that all the many stakeholders that will help to determine the continent s future, including governments and donors, the private sector, civil society organizations, religious leaders, and children themselves, be included and have a voice. It is time to acknowledge our shared responsibility to the future of and take the policy decisions required for all s children, present and future, to finally realize all their rights. 11

16 1 Child demographics in 12 UNICEF/NYHQ26-261/Michael Kamber
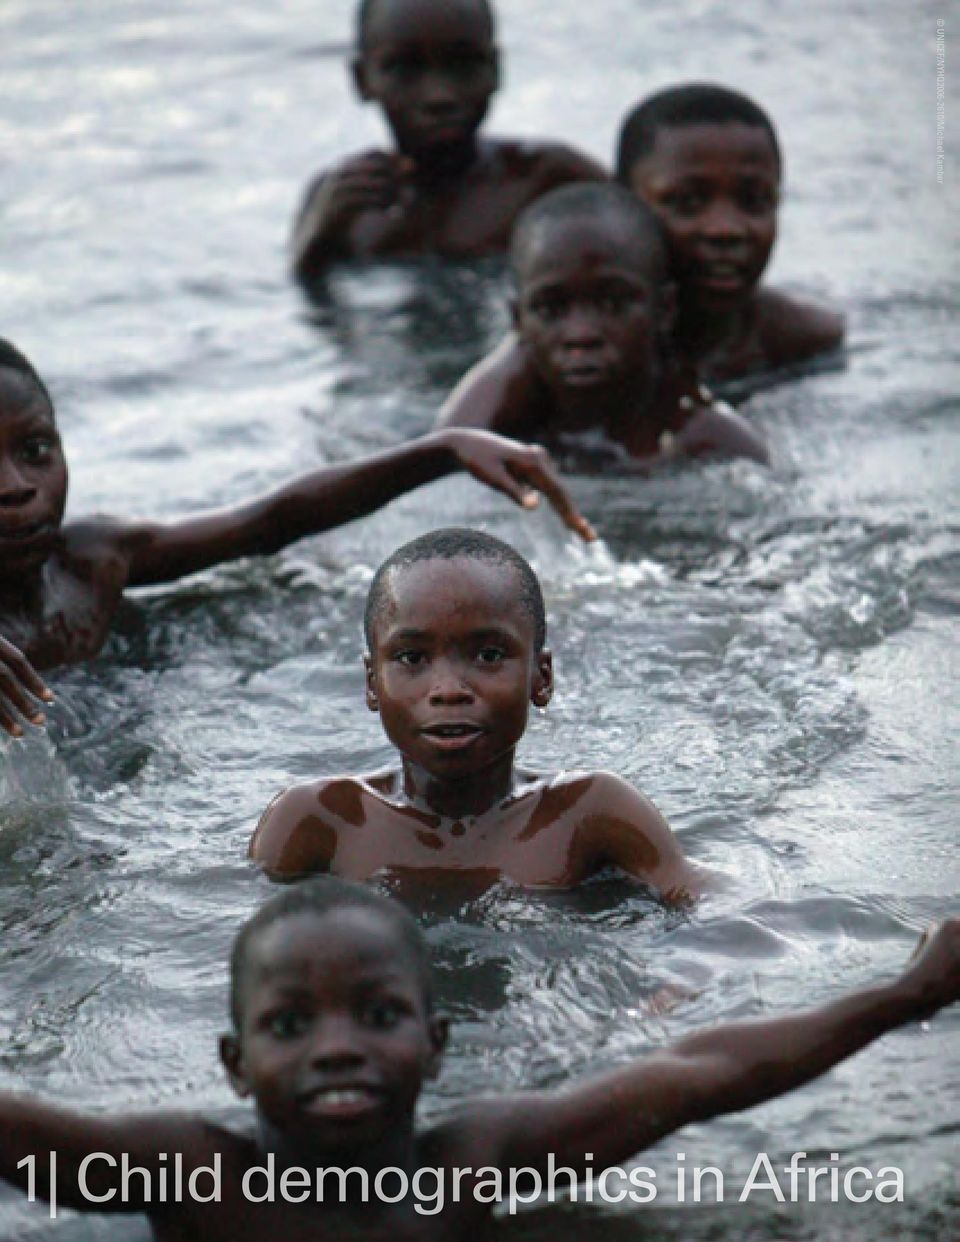
17 Generation 23 1 Child demographics in, already the world s second most populous continent with over 1 billion inhabitants, is experiencing a demographic shift unprecedented in its scale and swiftness. Consider this: In the next 35 years, 1.8 billion babies will be born in ; the continent s population will double in size; and its under-18 population will increase by two thirds to reach almost 1 billion. Today more than 7 billion people are living in the world and on current projections there will be 11 billion by the end of the 21st century. 's population will continue to grow significantly while all the other continents will see a relatively smaller increase or decline in their current numbers of births, total population and child population. is also ageing at a far slower pace than the rest of the world, and could potentially reap a demographic dividend as its labour force expands at a faster rate than its dependent population. By the end of the century, is projected to have almost quadrupled its population to over 4 billion, and will be home to almost 4 per cent of humanity. Understanding this demographic transition and putting in place the necessary policies to address its challenges and opportunities will be key to securing an fit for its children. This chapter analyses the projected levels and trends in s population, fertility, births, mortality, population density and urbanization, setting the scene for a discussion of key policy issues in the next chapter. The analysis is based mostly on the latest estimates provided by the United Nations Population Division 1 using the medium fertility variant; other sources have also been used where applicable. Total population Despite slowing growth rates, s population will double by 25 The latest projections by the United Nations Population Division indicate a sharp increase in s inhabitants through the rest of the century, even as population growth rates continue to slow. 's population will double in just 35 years to 2.4 billion in 25, and is projected to eventually hit 4.2 billion by 21 (Figure 1). About half a billion will be added already by 23. More than half of the 2.2 billion projected rise in the world's population between 215 and 25 will take place on this continent alone. As a result of changing global population dynamics, and with Asia s population growth set to slow markedly, will increase its share of the world population to almost 25 per cent by mid-century and 39 per cent by the end of the century, up from just 9 per cent in 195 and 16 per cent in United Nations, Department of Economic and Social Affairs, Population Division, World Population Prospects: The 212 Revision, United Nations, New York,

18 's population will double from 215 to 25 FIG. 1 Total population by region, A. Total population B. Share of total population Rest of the world 1 Population (in billions) Asia Restofthe world % 5 5 % 25 Asia Source: UNICEF analysis based on United Nations, Department of Economic and Social Affairs, Population Division, World Population Prospects: The 212 Revision (UN WPP), United Nations, New York, 213. West and Eastern will be the main drivers of population growth, with West becoming the most populous region in by 267 FIG. 2 Population in by UNECA region, A. Total population B. Share of total population 2, 1 Central 1 Population (in millions) 1,6 1, West Eastern Southern North Central North Southern % 5 5 % Eastern West Note: The regional aggregates follow the United Nations Economic Commission for (UNECA) regions. The detailed classification can be found at Source: UNICEF analysis based on UN WPP 212 Revision. 14

19 Generation 23 By mid-century, two thirds of s population will live in either Eastern or West The n population is concentrated mostly in Eastern and West, which together account for more than 6 per cent of the continent s inhabitants today. Of the 1.2 billion n inhabitants estimated for 215, around 33 per cent live in Eastern, 3 per cent in West, 19 per cent in North, 14 per cent in Southern and 4 per cent in Central. By the middle of the century, West and Eastern will be home to more than 8 million inhabitants each, doubling their present totals of under 4 million, and will together account for more than two thirds of s inhabitants (Figure 2). Similarly, Southern and Central s populations will approximately double, to around 3 million and 1 million respectively. Based on current trends, the four sub-saharan n regions will continue to see increases in their population totals through the rest of the century; only North will see its population begin to level out towards the latter part of the century. In just 35 years, Nigeria s population will be 2.5 times its current size, reaching 44 million Among s 54 countries, Nigeria has by far the largest population with 184 million inhabitants, accounting for 16 per cent of s population in 215 (Figure 5A). Nigeria will contribute to more than a fifth of the total growth of the n population between 215 and 25. By 21, almost 1 billion people (914 million) are projected to live in Nigeria alone. The next three most populous countries currently are Ethiopia (99 million), Egypt (85 million) and the Democratic Republic of Congo (71 million) (Figure 5A). Ten countries will contribute massively to the region s immense population increase in absolute terms between 215 and 25: Nigeria (257 million additional inhabitants); Ethiopia (+ 89 million); Democratic Republic of the Congo (+ 84 million); the United Republic of Tanzania (+ 77 million); Uganda (+ 64 million); Kenya and Niger (both + 5 million); Sudan (+ 38 million); Egypt (+ 37 million) and Mozambique (+ 33 million). Niger has the largest percentage increase in population among n countries In terms of percentage rises, the largest increases will be recorded in Niger (26 per cent), whose population will rise from 19 million to 69 million from 215 to 25. By 21, 24 million people are projected to live in Niger. The other largest relative increases after Niger for the period are projected for Zambia (185 per cent); Mali (178 per cent); Uganda (159 per cent); the United Republic of Tanzania, Gambia and Burundi (all 147 per cent); Chad (146 per cent); Somalia (143 per cent) and Nigeria (14 per cent). The absolute number of children in will increase, while their share among the total population in will decline to almost 4% in 25 FIG. 3 Population in by age group, A. Population B. Share of population Older population (age 6 and over) 1 Population (in billions) Childpopulation (underage5) Childpopulation (age5 17) Adult population (age18 59) Olderpopulation (age 6and over) 75 Adult population (age 18 59) 75 %5 5 % Child population (age 5 17) Child population (under age 5) Source: UNICEF analysis based on UN WPP 212 Revision. 15

20 The child population under 18 in will increase by two thirds to almost 1 billion from , and will become home to almost half the world's children by 21 FIG. 4 Children under 18, A. Number of children under 18, by region B. Share of children under 18, by region Population (in millions) 1,6 1,4 1,2 1, Asia Restofthe world 1 1 Rest of the world % 5 25 Asia 5 % Population (in millions) C. Number of children under 18 in, by UNECA region West Eastern Southern North Central D. Share of children under 18 in, by UNECA region 1 Central 1 Southern 75 North 75 % 5 Eastern 5% West Source: UNICEF analysis based on UN WPP 212 Revision. UNICEF/MLWB26-7/Pirozzi 16
 C. Number of children under 18 in, by UNECA region 5 4 3 2 1 195 198 21 24 27 21 West Eastern Southern North Central D.")
21 Generation 23 Nigeria will continue to increase its share in the n population; by 25, one fifth of children under 18 in will live in Nigeria FIG. 5 Top 1 countries in with largest total population and most children under 18, 215 and 25 A. Total population, in millions (% of ) Sudan, 4 (3%) Uganda,4 (3%) Other countries, 453 (39%) Algeria, 41 (3%) Nigeria, 184 (16%) Kenya, 47 (4%) Ethiopia, 99 (8%) Egypt, 85 (7%) Democratic Republicofthe Congo,71 (6%) South, 53 (5%) United Republic of Tanzania,52 (4%) South, 63 (3%) Niger, 69 (3%) Other countries, 945 (4%) Sudan, 77 (3%) Kenya, 97(4%) Nigeria, 44 (18%) Ethiopia, 188 (8%) Democratic Republic of thecongo, 155(6%) United Republic of Tanzania, 129 (5%) Egypt, 122 (5%) Uganda, 14 (4%) 215 Nigeria, 93 (17%) B. Children under 18, in millions (% of ) By 221 the child population of Nigeria will be 19 million the same as the child population of in Nigeria, 191 (21%) Other countries, 216 (39%) Ethiopia, 48 (9%) Democratic Republic ofthe Congo, 36 (7%) Other countries, 343 (38%) Democratic Republic of the Congo, 63 (7%) Ethiopia, 58 (6%) Mozambique, 14 (3%) South, 18 (3%) Sudan, 19 (3%) Uganda, 22 (4%) Egypt, 31 (6%) United Republic of Tanzania, 27 (5%) Kenya, 23 (4%) Mozambique, 25 (3%) Sudan, 27 (3%) Egypt, 32 (4%) Niger, 36 (4%) Kenya, 36 (4%) United Republic of Tanzania, 54 (6%) Uganda, 44 (5%) Note: The first number cited for each country refers to the child population in millions, the second to its share of the n population. Source: UNICEF analysis based on UN WPP 212 Revision. 17
22 Child, adolescent, working-age and elderly populations While the n populace has grown in absolute numbers from 195 to 215, its overall age structure has not changed considerably. Children under 18 years, and the adult population from age 18 to 59, have remained in similar proportions, accounting for some per cent each in 215. Persons aged 6 and above currently represent just 5 per cent of the n population (Figure 3). However, this composition will begin to shift: slowly but steadily at first, and then more rapidly later on in the century, as the growth in the continent s child population slows slightly and life expectancy for s inhabitants rises. From 215 to 25, all three age groups are projected to continue to grow, but the expansion rate will be steeper in the age group and particularly steep in the age group 6 and over (Figure 3). The n population is much younger than the rest of the world Today, as in 195, 5 per cent of the n population is under 2 years of age, while globally the median age of the world's population has risen from about 24 years in 195 to about 3 years in 215. By 25, the n population will be older than it is today with a median age around 25 years, but will remain well below the global average of 36 years. In 215, in 15 n countries, more than half of the population will be under 18. These countries include Niger (57 per cent); Uganda and Chad (both 55 per cent); Mali, Angola and Somalia (all 54 per cent); Zambia (53 per cent); Gambia, Burkina Faso, Mozambique and Malawi (all 52 per cent); the Democratic Republic of the Congo, the United Republic of Tanzania, Burundi and Nigeria (all 51 per cent). s under-five population will swell by 51 per cent by 25, and its under-18s will increase by two thirds to almost 1 billion. The number of adolescents will grow by 83 per cent to almost half a billion. By 21, will be home to almost half the world s children under 18 In 195, only 39 million children under 5, 19 million children under 18 and 5 million adolescents lived in. In 215, these numbers increased to 179 million, 547 million and 257 million respectively. 's child population is projected to continue to burgeon. Over the next 15 years until 23 the child population under 5 will grow by 22 per cent to 22 million, the child population under 18 will increase by 3 per cent to 711 million and the adolescent population will rise by 39 per cent to 356 million. From 215 to 25, the continent s under-five population will increase by 51 per cent, or 91 million, rising to 271 million. Over the same period, its under-18 population will expand by two thirds, to almost 1 billion children (99 million), while the number of adolescents (1 19 years) will swell by 83 per cent from 257 million to 47 million. With child populations set to decline in the rest of the world s regions, by the end of the century there will be an even greater concentration of the world s under-18s in, at 1.1 billion, almost half (47 per cent) of the global total (Figure 4). Nigeria will see the largest absolute increase in its under-18 and under-five populations, both doubling over the time period from 215 to 25. By 25, one fifth of s children under 18 will live in Nigeria (Figure 5). Other notable increases in both age groups will be experienced by the United Republic of Tanzania, the Democratic Republic of Congo and Niger (Figure 6). will eventually begin to age in the second half of the 21st century, with almost 8 million elderly persons living there in 21, up from just 64 million today s inhabitants aged 6 years and older will grow from the current 64 million to 211 million in 25, an absolute increase of 148 million and a relative increase of 232 per cent. By 21, it is projected that 794 million ns will be aged 6 and over. Even with this dramatic pace of ageing, will still be by far the most youthful continent in the world throughout the 21st century. The share of older persons in the n populace will rise from 5 per cent currently to 9 per cent in 25 and to 19 per cent by 21, but this will still be far smaller a share than any other continent or region. will take over from Asia as the continent with the most children in 267 Since 195, more than half of the world s child population have lived, and still live, in Asia. But since the beginning of the 21st century, Asia s share in the global child population has steadily declined. By 215, 55 per cent of under-fives, 57 per cent of under-18s and 58 per cent of adolescents are estimated to live in Asia. These shares are set to fall further by about 1 percentage points respectively by mid-century, and reach 37 per cent, 38 per cent and 38 per cent respectively by its end (Figure 4). 18
23 Generation 23 The number of children under 18 in Nigeria is projected to increase from 93 million in 215 to 191 million in 25, an increase of 98 million, or 15%, from 215 to 25 FIG. 6 Top 1 countries in with largest absolute and percentage increases in children under 18 from 215 to 25 A. By largest absolute increases, child population in millions B. By largest percentage increases, child population in millions (% increase) Nigeria 93 United Republic United Republic of Tanzania 27 of Tanzania Democratic Republic Democratic 36 Republic ofthe Congo ofthe Congo Niger Niger Uganda 22 Uganda Kenya Mali 23 Nigeria 9 +12Mali Kenya Niger Niger (226%) (226%) Zambia Zambia (146%) (146%) Mali Mali (138%) (138%) Burundi 6 +6 Burundi (17%) 6 +6 (17%) Nigeria 93 Nigeria (15%) +98 (15%) United Republic United 27Republic +28 (13%) (13%) of Tanzania of Tanzania Uganda 22 Uganda +22 (99%) (99%) Zambia Zambia Gambia 1 +1 Gambia (98%) 1 +1 (98%) Mozambique Mozambique Somalia 6 +6 Somalia (97%) 6 +6 (97%) Ethiopia 48 Ethiopia Malawi 9 +8 Malawi (92%) 9 +8 (92%) 215 Increase 215 from Increase 215 to from to Increase 215 from Increase 215 to from to 25 Note: The first number cited for each country refers to the population in 215, the second to the increase from 215 to 25. Together they represent the population in 25. Source: UNICEF analysis based on UN WPP 212 Revision. In contrast to Asia s dwindling share of the world s child population, s share has risen rapidly since 195 when the continent was home to 12 per cent of the world s underfives, 11 per cent of under-18s and 1 per cent of adolescents. By 215, is estimated to be home to 27 per cent of the world s under-fives, 24 per cent of its under-18s and 22 per cent of its adolescents. Based on current projections, 4 per cent of the world s under-fives, 37 per cent of under-18s and 35 per cent of the adolescent population will live in by 25. UNICEF-NYHQ Eseibo 19
24 s population of women of reproductive age is projected to more than double between 215 and 25 FIG. 7 Women of reproductive age by region, A. Number of women aged B. Share of women aged Rest of the world Population (in billions) Restofthe world Asia Source: UNICEF analysis based on UN WPP 212 Revision % 5 25 Asia 5 % Women of reproductive age By mid-century, the number of women of reproductive age in will more than double, in contrast to Asia, whose numbers of women of reproductive age are shrinking The number of women of reproductive age (15 49 years) in in the year 215 (28 million) will be more than five times its level in 195. This total is projected to increase further to 47 million in 23 and then to 67 million in 25, reaching almost 1 billion (991 million) by the end of the century (Figure 7). Contrast this to Asia, where the total number of women of reproductive age rose from 333 million in 195 to 1.1 billion in 215, and will stabilize around 1.1 billion before declining to 91 million by the end of the century. In addition, s share of the world population of women of reproductive age is set to grow staggeringly quickly. Whereas in 195, 9 per cent of all women aged were n, this share will rise to 15 per cent in 215 and again to 28 per cent in 25, ending the century at 44 per cent of the global total. Asia s share, which was 53 per cent of the global total in 195, will decline from 61 per cent in 215 to 52 per cent in 25 and reach 4 per cent in 21. In contrast, the rest of the world, which in 195 held 38 per cent of women of reproductive age, will see this share shrink steadily to just 16 per cent by 21. Fertility s fertility rates will continue their downward trend, but still remain far above global averages s average fertility rate is in decline, and has been for decades. But its rate of decline is slow and the continent s fertility rates remains far higher than anywhere else in the world. On current trends, this trend will continue at least until mid-century. Fertility in will drop from around 4.7 children per woman in to 3.8 in , and to 3.1 by , and further decline to 2.1 children per woman by the end of the century (Figure 8). On the n continent, fertility is highest in West, with an estimated average rate of 5.6 children per woman for the period , followed by Central and Eastern (both 5.1), Southern (4.) and North (3.1). In both North and Southern, the average fertility rates began to decline in the late 196s, but it was not until the late 198s that fertility in Eastern, Western and Central began to drop after having increased from 195 onwards (Figure 8). For all regions, fertility levels are projected to continue to decline steadily over the remainder of the century (Figure 8). By 25, all n s subregions, with the exception of 2
25 Generation 23 Fertility levels in remain much higher than the global average FIG. 8 A. Total fertility in and the world, B. Total fertility by UNECA region, Children per woman World Source: UNICEF analysis based on UN WPP 212 Revision. Children per woman Central Eastern North Southern West World Fertility declines start for North and Southern Fertility declines startfor Central, Eastern, and West In 15 countries, total fertility is at 5 or more children per woman in 215 A. Total fertility in countries in, 215 Children per woman FIG. 9 B. Top 15 countries in with highest total fertility, 215 and 25 Children per woman Note: This map is stylized and not to scale. It does not reflect a position by UNICEF on the legal status of any country or area or the delimitation of any frontiers. The final boundary between the Republic of the Sudan and the Republic of South Sudan has not yet been determined. The final status of the Abyei area has not yet been determined Source: UNICEF analysis based on UN WPP 212 Revision Note: The red or grey bar shows the fertility rate in 215, the dashed yellow line shows the projected fertility rate in
26 The poorest countries and households tend to have the highest fertility FIG. 1 A. Total fertility in n countries by national income, 215 and Note: The plot shows the fertility levels in 215 and the projected fertility levels in 25. Values below the diagonal indicate that the fertility is projected to decline over the period from 215 to 25 while values above the diagonal indicate an increase. Children per woman, Source: UNICEF analysis based on UN WPP 212 Revision. The national income classifications follow the World Bank income classification, Children per woman, 215 Low-income Lower-middle-income Upper-middle-income High-income B. Total fertility by wealth quintiles in selected n countries 9 Lowest Second Middle Fourth Highest 8 Children per woman Chad MICS 21 Democratic Republic of the Congo DHS 27 Egypt DHS 28 Ethiopia DHS 211 Mali DHS 26 Niger DHS 212 Nigeria DHS 213 United Republic of Tanzania DHS 21 Source: UNICEF analysis based on Multiple Indicator Cluster Surveys (MICS) and Demographic and Health Surveys (DHS) data. West, will have less than 3 children per woman, and by this century s close the average fertility rate in all n subregions will hover at around 2 children per woman. Average fertility levels vary widely across, and are strongly correlated with national income At the country level, 215 estimates for s fertility rates vary widely, from 1.5 children per woman in Mauritius to 7.5 children per woman for Niger. Fifteen n countries have fertility levels of five children or more per woman (Figure 9). In general, fertility levels remain closely correlated with national income (Figure 1). The countries with average fertility rates greater than six children per women (Chad, Mali, Niger and Somalia) all belong to the group of nations with low income levels. 22
27 Generation 23 Adolescent fertility rates are above 12 births per 1, adolescent girls aged in 15 n countries FIG. 11 tend to be higher in rural areas than in urban areas. In Niger, women in rural areas have on average about two and a half children more than women living in urban areas and, in Ethiopia, women in rural areas have about three children more. Top 15 countries with the highest adolescent fertility rates in, Births per 1, adolescent girls aged Niger 25 Mali Angola Chad Malawi Mozambique Democratic Republic ofthe Congo Guinea Côte d'ivoire Congo Uganda Zambia Madagascar United Republic of Tanzania Nigeria World Source: UNICEF analysis based on UN WPP 212 Revision. 45 With the exception of countries with already low levels of fertility rates, significant drops in fertility rates are projected for most n countries over the course of the century, and particularly in those countries with the highest rates at present. Fertility levels in Angola, Chad, the Democratic Republic of the Congo, Mali, Niger, Somalia and Uganda are estimated to drop by more than 2.5 children per woman over the next 35 years (Figure 9). Nonetheless, 19 countries will still have fertility rates above 3 children per women by mid-century. Figure 1B clearly shows that in the countries analysed, fertility rates are consistently higher for the poorer quintiles compared to their richer counterparts. Women in the poorest quintile in Chad, the Democratic Republic of the Congo, Ethiopia, Mali, Niger, Nigeria and the United Republic of Tanzania have on average 2 or almost 4 children more than women in the wealthiest quintile. Survey data also show that fertility levels 98 Adolescent fertility (adolescent girls aged 15 19) in is more than double the global average, and quadruples the world rate in some of the poorest countries Adolescent girls aged in have the highest rates of fertility for their age cohort in the world, with 98 births per 1, adolescent girls, compared to the average of 45 at the global level. From 21 to 215, 14 per cent of all babies in were born to adolescent girls and women under 2, compared to 9 per cent globally. For the same time period, at the country level, 15 countries in have 12 or more live births per 1, adolescent girls aged 15 to 19. The highest adolescent fertility rates are estimated for Niger with 25 births per 1, adolescent girls, followed by Mali (176), Angola (17) and Chad (152) (Figure 11). The lowest adolescent fertility rates in are estimated for countries in North : Libya, with 3 births per 1, adolescent girls aged 15 19; Tunisia (5), and Algeria (1). Contraceptive prevalence remains low and unmet need high Today worldwide, almost two thirds of women of childbearing age who are in a union are using contraceptive methods. 2 In, this proportion drops to a third of all women. On the continent, 32 n countries have contraceptive prevalence levels below 4 per cent. Half of these countries in have an estimated level of contraceptive prevalence below 2 per cent and they are mainly located in Western and Eastern (Figure 12). Globally, 12 per cent of all women of childbearing age are estimated to have an unmet need for family planning in 215; for the n continent this proportion rises to 23 per cent. Unmet need for family planning tends to be lowest in countries where contraceptive prevalence is already high (above 6 per cent). In, 38 countries are estimated to have high unmet need levels, ranging from 2 per cent to 35 per cent of all women of reproductive age who are married or in a union (Figure 13). In 28 of them the contraceptive prevalence is below 3 per cent. 2 United Nations, Department of Economic and Social Affairs, Population Division, Model-based Estimates and Projections of Family Planning Indicators, United Nations, New York,
28 In 16 n countries less than 2 percent of women of reproductive age in a union are using contraceptive methods FIG. 12 Percentage of married or in-union women aged 15 to 49 who are using any method of contraception, 215 Source: UNICEF analysis based on United Nations, Department of Economic and Social Affairs, Population Division, Model-based Estimates and Projections of Family Planning Indicators, United Nations, New York, 214. Note: This map is stylized and not to scale. It does not reflect a position by UNICEF on the legal status of any country or area or the delimitation of any frontiers. The final boundary between the Republic of the Sudan and the Republic of South Sudan has not yet been determined. The final status of the Abyei area has not yet been determined. UNICEF-NYHQ Holt 24
29 Generation 23 In about half of the countries in, a fourth of the women of reproductive age in a union have an unmet need for family planning FIG. 13 Percentage of married or in-union women aged 15 to 49 who want to stop or delay childbearing but are not using a method of contraception, 215 Source: UNICEF analysis based on United Nations, Department of Economic and Social Affairs, Population Division, Model-based Estimates and Projections of Family Planning Indicators, United Nations, New York, 214. Note: This map is stylized and not to scale. It does not reflect a position by UNICEF on the legal status of any country or area or the delimitation of any frontiers. The final boundary between the Republic of the Sudan and the Republic of South Sudan has not yet been determined. The final status of the Abyei area has not yet been determined. Note: This map is stylized and not to scale. It does not reflect a position by UNICEF on the legal status of any country or area or the delimitation of any frontiers. The final boundary between the Republic of the Sudan and the Republic of South Sudan has not yet been determined. The final status of the Abyei area has not yet been determined. Source: UNICEF analysis based on UN WPP 212 Revision. 25
30 The number of births will continue to grow in but decline in the rest of the world; Four in 1 of the world's babies will be born in by mid-century FIG. 14 Births, A. Number of births, by region B. Share of births, by region 1 1 Rest of the world 1 Births (in millions) % 5 5 % Asia Rest of the world Asia C. Number of births in, by UNECA region D. Share of births in, by UNECA region Births (in millions) Central 1 North Southern % 5 Eastern 5 % West 25 West Eastern Southern North Central Source: UNICEF analysis based on UN WPP 212 Revision. 26 UNICEF-NYHQ Noorani
31 Generation 23 Births In 195, accounted for one in every nine global births. By 23 is projected to account for almost one in every three global births. At the end of the century, will account for almost half of all the world s births More and more of the world's children are being born in. The trends are truly striking and require contemplation. Today, around 29 per cent of the world's births take place in. By 23, this share will increase to 35 per cent and based on current trends will reach 41 per cent by mid-century. And by 21, almost half of all of the world s children (47 per cent) will be born in. This is an increase from the figures reported in the first edition of this series on child demographics, when s share of global births was projected at one third by mid-century; the revision is based on new estimates from the United Nations Population Division. It is also an almost unfathomable increase in historical terms, considering that in 195 only 12 per cent of the world s births took place in (Figure 14). The continent will see almost half a billion births in the next 1 years or so, and almost 1.8 billion births over the next 35 years to mid-century Even under the assumption of large declines in the fertility levels in, the continent s number of births is not estimated to decline until the 28s because of the increasing number of women of reproductive age (Figure 7). In fact, the absolute numbers of births are also set to increase massively. On current trends, over the next 15 years from 215 until 23, 7 million babies slightly under the entire current population of the European continent will be born in, with a further 1.1 billion births on the continent between 231 and 25 (Figure 15). In sum, 1.8 billion babies will be born from 215 to 25, which is 7 million babies more than over the equivalent number of years from 198 to 215. These 1.8 billion babies will account for 35 per cent of the 5 billion babies projected to be born in the world from 215 to 25. Put another way, in 215, around 3.4 million births will take place in every month, adding up to around 4 million a year. This contrasts sharply with 195, when s births were less than 1 million per month. West will relatively soon surpass Eastern as the subregion with the highest number of births in, as births in low-income countries proliferate Subregional birth trends within vary markedly. West s relatively higher fertility rates compared to other subregions will see it surpass Eastern as the region with the highest numbers of births by 229. In about three years time, from 218 onward, the number of births in Southern will exceed those in North for the first time (Figure 14). By 25, 1 in every 11 of the world s babies will be born in Nigeria, which will experience more than 36 million births in the next 35 years Presently, 1 in every 5 births in takes place in Nigeria, which accounts for 1 in every 19 global births. Based on current trends, between now and 23, 136 million babies will be born in Nigeria, and from 231 until mid-century there will be 224 million more, adding up to 359 million births more than the current population of the United States in the next 35 years (Figure 16). Assuming current trends persist, Nigeria will be home to 1 in every 11 global births by 25. In , 1.8 billion babies will be born in, 7 million more than in Cumulative number of births in, , and billion billion billion Source: UNICEF analysis based on UN WPP 212 Revision. FIG
32 Nigeria will experience the largest increase in absolute number of births among n countries FIG. 16 Top 1 countries with the greatest number of births in A. Births, , in millions (% in ) B. Births, and (in millions) Nigeria Other countries, 277 (4%) Nigeria, 136 (19%) Democratic Republic ofthe Congo,53 (8%) Democratic Republic of the Congo Ethiopia United Republic of Tanzania Uganda Mozambique, 19 (3%) Niger, 2 (3%) Sudan, 23 (3%) Kenya, 27 (4%) Ethiopia 53 (8%) United Republic of Tanzania, 37 (5%) Uganda, 31 (4%) Egypt, 29 (4%) Egypt Kenya Sudan Niger Mozambique Note: The first number cited for each country refers to births in millions, the second to its share of n births. Source: UNICEF analysis based on UN WPP 212 Revision. 28 UNICEF-SLRA Asselin
33 Generation 23 Child survival has improved in, but child deaths will be more and more concentrated in FIG. 17 Under-18 deaths by region, A. Under-18 deaths B. Share of under-18 deaths 1 1 Rest of the world 1 Deaths (in millions) % % Asia 25 Asia Restofthe world Source: UNICEF analysis based on UN WPP 212 Revision. Mortality, life expectancy and dependency Child survival has improved markedly across, but the continent still accounts for half of global child deaths, a figure that will rise to 7 per cent by mid-century A child born in today has a much higher chance of reaching her or his fifth birthday than almost a quarter of a decade ago. Back then, in 199, more than 1 in every 6 n children died before reaching age 5; in 212, the latest year for which estimates are available, that ratio fell to 1 in every 11 children born. 3 The 198s and 199s were a particularly challenging time for child mortality in : Births surged and so did child deaths because progress in reducing child mortality was not enough to out pace the increasing number of births. This trend continued until the late 199s, when began to see a fall in its absolute numbers of child deaths. The regional decline in under-five and under-18 deaths that has occurred since the late 199s is encouraging, and in large part is thanks to the concerted efforts of national and international 3 UNICEF, Committing to Child Survival: A Promise Renewed Progress Report 213, New York, 213. partners to prioritize child survival interventions in sub-saharan. But faster progress elsewhere has left far behind the rest of the world, leading to a high concentration of the world's child deaths on this continent. Today, more than half of deaths among children under 18 occur in, a figure that is projected to rise to 7 per cent by mid-century (Figure 17). Life expectancy for s children has risen sharply in recent decades and will continue to rise, steadily narrowing the gap with other regions Children born in can now expect to live considerably longer lives than previous generations. In the 195s, 4-something s were relatively rare in, with average life expectancy at 37 years, significantly lower than in the developed regions of the world (65 years). That gap has narrowed even as life expectancy in all regions has risen. Today, n life expectancy at birth is 58 years far greater than in any time in the continent s recorded history but still 19 years lesser than the developed regions and 12 years lesser than the global average of 7 years in (Figure 18). This gap will narrow steadily according to current projections, and by 235, will have its first generation that can expect to reach pensionable age, as life expectancy at birth will reach 65 years for the first time. 29
34 s overall dependency ratio will stay high, due to its expanding child population, in contrast to other regions that face rising dependency due to growing elderly populations s dependency ratio measured as children (14 and younger) + elderly (65 and older) as a share of the working-age population (15 64 years) is high, at 79 per 1 persons of working age in 215, but has declined steadily since 195. But unlike any other continent or region, 's overall dependency ratio is driven by an outstandingly high child dependency ratio (Figure 19); in contrast, most other regions are facing increasing dependency ratios driven by ageing populations. has the highest child dependency ratio, at 73 children per 1 persons of working age in 215, close to double the global average of 4 children per 1 persons close to working age. High child dependency and low old-age dependency ratios are especially prevalent in Eastern, West and Central. North and Southern, to a lesser extent, display lower child dependency ratios (Figure 2). In the coming decades,, like all regions, will see a sharp increase in its old-age dependency ratio as its population finally begins to age, particularly after mid-century. But unlike the rest of the world, s dependency ratio is projected to keep falling as the growth in the working-age population and falling child dependency ratio outweigh the moderate increases in oldage dependency until close to the end of the 21st century. Across, there is considerable divergence in the composition of dependency ratios. In 215, the n countries with the highest child dependency ratios are Niger Life expectancy at birth is increasing, but remains shorter in than in other regions Years Life expectancy at birth by region, World Developedregions Asia Source: UNICEF analysis based on UN WPP 212 Revision FIG. 18 Note: Developed regions and developing regions follow those of United Nations Statistical Division 'Standard country or area codes for statistical use'. The detailed classification can be found at with 16, Uganda with 97, Chad and Mali with 96, Angola and Somalia with 93, Zambia with 91, Gambia with 88, Mozambique with 87 and Malawi with 86 (Figure 21A). No n country has a particularly high rate of old-age dependency, but among those with the highest old-age dependency ratios in are Mauritius with 13; Seychelles and Tunisia with 11; Egypt, Gabon and South with 9; Cabo Verde, Morocco and Libya with 8 and Algeria with 7 (Figure 21B). 3 UNICEF-SLRA Asselin
35 Generation 23 has the highest child dependency ratio in the world FIG. 19 Composition of dependency ratios (child and old-age), Number of child (under 15) and old-age (65 and over) dependants per 1 persons of working age (15 64) A. Dependency ratios in B. Dependency ratios in Asia 1 child old-age 1 1 child old-age C. Dependency ratios in the rest of the world D. Global dependency ratios 1 child old-age 1 1 child old-age Source: UNICEF analysis based on UN WPP 212 Revision. 31
36 Total dependency ratios in s regions are mainly driven by high child dependency ratios, and very low old-age dependency ratios FIG. 2 Child- and old-age dependency ratios in UNECA regions, Number of child (under 15) and old-age (65 and over) dependants per 1 persons of working age (15 64) A. Child dependency ratios B. Old-age dependency ratios West Eastern Southern North Central World West Eastern Southern North Central World Source: UNICEF analysis based on UN WPP 212 Revision. In 215, in Niger, there are more children than persons of working age: 16 dependent children per 1 persons of working age FIG. 21 Top 1 countries in with highest child, old-age and total dependency ratios, 215 Number of dependants per 1 persons of working age (15 64) A. Child dependency ratios B. Old-age dependency ratios C. Total dependency ratios Niger Uganda Chad Mali Angola Somalia Zambia Gambia Mozambique Malawi Mauritius Seychelles Tunisia Egypt Gabon South Cabo Verde Morocco Libya Algeria Niger Uganda Chad Mali Somalia Angola Zambia Mozambique Malawi Gambia World 4 73 World 6 13 World Source: UNICEF analysis based on UN WPP 212 Revision. 32
37 Generation 23 Population density has risen sharply in in recent decades FIG. 22 The most densely populated n countries are mainly low-income countries FIG. 23 Population density by region (persons per sq. km) Top 1 most densely populated countries in, 215 (persons per sq. km) Mauritius Rwanda Comoros Burundi Nigeria Gambia Uganda Malawi Togo Cabo Verde Source: UNICEF analysis based on UN WPP 212 Revision. Note: Countries with more than 5, inhabitants. Source: UNICEF analysis based on UN WPP 212 Revision. Density and urbanization will become far more crowded this century, with the continent s population density set to almost quadruple by 21 The surge in its inhabitants has seen become much more densely populated in recent decades. The continent s population density has risen from 8 persons per square kilometre in 195 to 39 per square kilometre in 215. It will more than double to 8 persons per square kilometre in 25, and almost quadruple to 139 persons per square kilometre by the end of the century roughly the current population density of China (146) (Figure 22). Among the n countries with more than 5, inhabitants, Mauritius is the most densely populated country with 615 persons per square kilometre, followed by Rwanda with 472, Comoros with 414, Burundi with 388, and Nigeria with 199 (Figure 23). In Nigeria, population density is expected to rise to 296 persons per square km in 23, and to 477 in 25, and 989 persons per square km in 21 roughly the current population density of Bangladesh. By the end of the century, Burundi is projected to become the most densely populated country in with 2,22 persons per square kilometre, followed by Rwanda with 1,375 persons per square kilometre. The image of as a mostly rural continent is beginning to fade quickly amid rapid urbanization that will lead to the majority of its people and children living in cities in less than 25 years To many outside the continent, the image of often continues to be largely rural. The figures still somewhat support this notion, but only just: nowadays 4 per cent of 's population lives in urban areas. The past three decades have seen a frenetic pace of urbanization; considering that in 198, just 27 per cent of the population was classified as living in urban areas. This rapid growth is set to continue, with set to become an urban continent by the late 23s with the majority of its population living in cities or towns. By mid-century, 56 per cent of 's population will live in urban areas (Figure 24). Huge discrepancies in urbanization persist across regions and countries in Urbanization in 215 is most advanced in the North region, where more than half of the population lives in cities or towns, followed by Central (46 per cent), West (45 per cent), and Southern (44 per cent). Eastern is far less urbanized than the other regions, with only about a fourth of its population currently living in cities or town (28 per cent) (Figure 25). At the national level, in 215, urbanization will be most advanced in Gabon with 87 per cent of the population living in cities and towns, followed by Libya, Algeria, Tunisia and Morocco in North, smaller countries such as Djibouti, Cabo Verde, Sao Tome and Principe, the Congo in Central, and South (Figure 26). But will still be home to countries with a high population of rural inhabitants. For example, Burundi, the continent s 33
38 In less than 25 years, the majority of s population will live in urban areas FIG 24 Rural and urban population by region, A. 6 B. Asia 6 Population (in billions) Population (in billions) C. Rest of the world 6 D. World Population (in billions) Population (in billions) Source: UNICEF analysis based on United Nations, Department of Economic and Social Affairs, Population Division, World Urbanization Prospects: The 214 Revision (UN WUP), United Nations, New York, 214. fourth most densely populated country, has the highest proportion of the population living in rural areas in 215 (88 per cent), followed by Uganda, Malawi, Niger, South Sudan, and Ethiopia all with more than 8 per cent rural population. Six out of the top 1 countries with the largest percentage of rural populations are located in Eastern and five out of these were classified as fragile contexts in 214. Although more children still live in rural areas, the growth in s urban child population has outstripped that of its rural counterpart For children, urbanization trends have been equally pronounced on the n continent. 4 In 198, about three quarters of all children under 5 and under 18 lived in rural areas, while in 215 this ratio will fall to about 6 per cent. Compared to the rural population, the child and adult population in urban areas has been growing much faster over the last 35 years from 198 to 215. Over this period, the absolute increase in child population in urban and rural areas is similar but the relative increases are much larger in the urban areas. In 215, the child population in urban areas will be more than three times its size in 198, while the rural child population is only about twice its size in 198. Dependency ratios in rural areas tend to be higher than in urban areas in In 198, child dependency ratios in rural areas in were significantly higher than in urban areas, with 9 children per 1 persons of working age, compared to 74 in urban areas. In 215, differences in child dependency ratios between rural and urban areas remain substantial with 78 child dependents per 1 persons of working age in rural areas and 66 in urban areas. 4 United Nations, Department of Economic and Social Affairs, Population Division, Urban and Rural Population by Age and Sex, , United Nations, New York, version 2 August
39 Generation 23 s urban children are increasingly likely to grow up in rapidly expanding megacities Projections are not available for urban-rural population trends disaggregated by age. But based on the estimations for urban concentration, there is an increasing likelihood according to the projections of the United Nation Population Division that in the future 's urban children will also live in megacities. The population of Al-Qahirah (Cairo), Egypt will rise to 25 million in 23 from 19 million in 215. The population in Lagos, Nigeria, the second biggest agglomeration in, is projected to grow from 13 million in 215 to 24 million in 23. Meanwhile, Kinshasa in the Democratic Republic of the Congo will become the second largest urban agglomeration in sub-saharan with 2 million inhabitants in 23, up from 12 million in 215. An analysis 5 for by the French Agency for Development (AFD) confirms that the urban population in West has increased on a large scale from 195 until today and that the number of urban centres with populations above 1, inhabitants has grown continuously, from 125 in 195 to close to 1,3 in 21. However, the study emphasizes that while a large number of smaller agglomerations have emerged in West, a smaller part of the population is living in agglomerations with more than 1, inhabitants. Also, their analysis shows slower trends in urbanization today than the United Nations 5 Agence Française de Développement (AFD), 'polis urbanisation trends a geostatistical approach West study', Paris, 211, available at By 25, in all regions except Eastern the majority of the population will live in cities and towns Percentage urban in total population Percentage of population residing in urban areas by UNECA region, % 5 25 Source: UNICEF analysis based on UN WUP 214 Revision. FIG West Southern Eastern North Central World estimates and the authors conclude that today s urban growth is less pronounced than 5 years ago since the rise in the percentage of urban population in total to rural population has slowed continuously since the 198s. More reliable data to base estimates upon will be needed to assess more accurately the current urbanization trends in the n regions. Huge disparities in urbanization persist between countries FIG. 26 Top 1 n countries with highest percentage of population residing in urban and rural areas, 215 A. Top 1 countries in with highest percentage urban population in 215 B. Top 1 countries in with highest percentage rural population in Gabon Libya Djibouti Algeria Tunisia Cabo Verde Congo Sao Tome and Principe South Morocco Burundi Uganda Malawi Niger South Sudan Ethiopia Swaziland Chad Eritrea Kenya Source: UNICEF analysis based on UN WUP 214 Revision. 35
40 Today, three in 1 of s children are living in fragile and conflict-affected states FIG. 27 Number of children under 18 in fragile and conflict-affected states, 214 (in millions) Libya 2.2 Guinea-Bissau.8 Sierra Leone 3 Liberia 2.2 Mali 8.5 Côte d'ivoire 1. Togo 3.4 Central n South Sudan Republic Congo 2.2 Chad 7.3 Democratic Republic of the Congo 35.7 Sudan 18.4 Burundi 5.3 Malawi 8.7 Eritrea 3.2 Comoros.4 Somalia 5.8 Children under 18 Fragile, 143 (27%) Non-fragile, 393 (73%) Note: This map is stylized and not to scale. It does not reflect a position by UNICEF on the legal status of any country or area or the delimitation of any frontiers. The final boundary between the Republic of the Sudan and the Republic of South Sudan has not yet been determined. The final status of the Abyei area has not yet been determined. Zimbabwe 6.7 Madagascar 11.5 Births, children under 5 and 5 17, and deaths by fragile and conflict-affected states in, 214 (in millions) A. Births, 214 B. Children, 214 C. Average annual number of under-18 deaths, Fragile Non-fragile Fragile Non-fragile Fragile Non-fragile Note: Fragile and conflicted-affected states refer to the World Bank 'Harmonized List of Fragile Situations FY14'. Fragile Situations have: either (a) a harmonized average Country Policy and Institutional Assessment (CPIA) country rating of 3.2 or less, or (b) the presence of a UN and/or regional peace-keeping or peace-building mission during the past three years. For further details of this classification please refer to Source: UNICEF analysis based on UN WPP 212 Revision. Children under 5 Children 5-17 Under 5 deaths Under 5-17 deaths 36
41 Generation 23 Fragility and poverty Around three in 1 of s children are growing up in fragile and conflict-affected states Many of 's children are growing up in situations of fragility, poverty and inequality. Of the 34 countries currently classified by the World Bank as fragile and conflict-affected contexts in 214, 2 are n. Around one fourth of the continent's population (288 million), 27 per cent of the child population under 18 (143 million) and 27 per cent of the child population under 5 (47 million) live in these 2 fragile contexts. Almost three in 1 births in, and one third of under-five deaths occur in these 2 contexts (Figure 27). Six of the countries with fertility levels over five children per women are classified as fragile and conflictaffected states (Burundi, Chad, the Democratic Republic of the Congo, Malawi, Mali and Somalia). A broader concept of fragility is used by the Organisation for Economic Co-operation and Development (OECD), 6 combining the World Bank list and the Failed State Index from the Fund for Peace. Following this classification 31 n countries are classified as fragile contexts. The OECD highlights that these states are less likely to meet the MDGs, and four of the n fragile states with available data are unlikely to meet any of the MDGs by 215. The report underscores that people living in a context of conflict and fragility are largely affected by poverty and that progress in fragile states on eradicating poverty has been especially slow. 6 Organisation for Economic Co-operation and Development: Fragile States 214: Domestic Revenue mobilization in fragile states, OECD, Paris, 214. Almost half of s countries are classified as low-income, and are home to around half of its total population and child population Almost half (26) of the continent s 54 countries are classified as low-income, comprising 552 million inhabitants in 215, almost half of s overall population. Seventeen n countries are classified as lower-middle-income countries with 47 million people in 215 (4 per cent); 1 are upper-middle-income countries with 142 million in 215 (12 per cent); and only one country (Equatorial Guinea) is a high-income country with less than a million people. In the continent, 9 out of 1 children under 18 are living in low- and lower-middle-income countries (Figure 28). Most of s population is living in poverty Most of s population is living in poverty, often extreme, despite high GDP growth rates in recent years. Based on the latest data available for 45 of 's 54 countries from the World Bank, 58 per cent of the n population and 7 per cent of sub Saharan survives on less than US$2 per day. In the two subregions of Eastern and Western, more than 7 per cent of the population lives on less than US$2 per day. Extreme poverty is also rife on the continent; around 4 per cent of 's population, and almost half of sub-saharan live on less US$1.25 per day (Figure 29). While less data are available for poverty breakdowns by age group, current estimations from the World Bank based on data for 26 countries in sub-saharan show that children have a higher poverty rate than adults in these countries. 7 More than half of the children under 18 live in in extreme poverty on less than US$1.25 per day. 7 The World Bank, International Income Distribution Database (I2D2), The World Bank, Washington, D.C., 214. UNICEF-NYHQ Bindra 37
42 9 in 1 children in live in the 26 low-income and 17 lower-middle-income countries FIG. 28 Countries in by national income, 215 Children under 18 Note: This map is stylized and not to scale. It does not reflect a position by UNICEF on the legal status of any country or area or the delimitation of any frontiers. The final boundary between the Republic of the Sudan and the Republic of South Sudan has not yet been determined. The final status of the Abyei area has not yet been determined. Source: UNICEF analysis based on UN WPP 212 Revision. The national income classifications follow the World Bank income classification, 214. Almost half of the population in sub-saharan lives in extreme poverty FIG. 29 Percentage of poor in the population, 21 A. Percentage of the population living below US$1.25 per day B. Percentage of the population living below US$2 per day % % North Central Southern West Eastern Sub- Saharan Arica Sub- Saharan Arica 18 North 5 Central 59 Southern West Eastern Source: UNICEF analysis based on the World Bank 'PovcalNet: the on-line tool for poverty measurement developed by the Development Research Group of the World Bank',
43 UNICEF-BRDA Krzysiek Generation 23 Data from UNICEF s Multiple Overlapping Deprivation Analysis (MODA) 8 for 23 countries in show that a vast majority of children under 5 are deprived in terms of nutrition, health, water, sanitation, and housing. From 71 to 98 per cent of children under 5 in countries with survey data have deprivations in access to goods and services related to nutrition, health, water, sanitation and housing which are crucial for their survival and development. On average children experience deprivations in two to three of the five above mentioned dimensions. Among the countries compared, the deprivation intensity is lowest in Rwanda 8 United Nations Children s Fund, Multiple Overlapping Deprivation Analysis (MODA), UNICEF, 214. and highest in Chad, where child poverty is most intense with children on average being deprived in three to four dimensions. Poverty rates for 5 17-year-olds are only marginally lower than for the under-fives. Data for 24 n countries reveal that among children aged 5 17 between 56 to 95 per cent are deprived in at least one of five following dimensions: education, information, water, sanitation and housing. The deprivation is highest in Malawi with 95 per cent of all children being deprived in at least one dimension. Children in Chad are deprived most intensively; on average a child in Chad is deprived in more than three of the five dimensions. 39
44 AFRICA demographic transition In demographic transition, the population moves from one demographic structure to another. Typically, following the initial stage, four stages are involved in the demographic transition process that describe how secular shifts in fertility and mortality levels change the age structure of a population from many children and few elderly to few children and many elderly. In the transitional period, countries can experience unprecedented levels of population growth. Demographic transition in stages Stage 1: Fertility and mortality are high and fluctuating. Births and deaths counterbalance, therefore population size increases very slowly, if at all. Stage 2: Mortality starts to decline, especially among children and young adults. Population size increases because the number of births is greater than the number of deaths Birth rate 4 5 Stage 3: Fertility levels also start to decline, and population growth slows down. Death rate Population size is still growing due to the young age structure of the population Total population (women of reproductive age), despite lower levels of fertility. Stage 4: Fertility and mortality are both low, resulting in low population growth and population ageing. Stage 5: A fifth stage where fertility levels fall below replacement level has been suggested. Eventually population will decline over the long term. This stage is also called the 'second demographic transition' or 'second fertility transition'. High child dependency ratios In the course of stage 2 of the demographic transition, declining mortality and rising life expectancy not only impact the population size, they also alter the age structure of the population. As the initial mortality decline concentrates in children under 5, the survival of infants and children increases. The population grows younger and the proportion of children relative to adults gets larger. During this stage, the working-age population supports an increasing number of dependent children. The young age structure, which is the result of high fertility and low mortality, entails future population growth. The relative abundance of younger people results in a birth rate that is higher than the death rate even if the fertility rate is at replacement. The population pyramid for Nigeria in 215 shows a very young population with few elderly people (Figure A). The age structure in the population has not changed significantly compared to 195. The number of young children in the population is increasing, with new births getting added every year to the base. Nigeria has high potential for future growth. With reduced child mortality, a large proportion of the big cohorts who are now children will survive to adulthood and have children of their own, thus contributing to population growth. Through improvements in adult survival, the sides of the pyramid have become less steeply sloping, and the adult population larger. Low child dependency ratios The prolonged decline in fertility initially affects the base of the population pyramid, as the proportion of children begins to decline. When the relative size of younger cohorts in the population eventually starts declining, the cohorts that had initially benefited from the decreasing mortality keep the population of working age growing and a 'youth bulge' is created. During this period, the proportion of the population of working age grows relative to the proportion of both children and elderly people combined, producing more potential workers per dependent. For a longer period, which can last more than a decade, the decline in the younger age groups is not compensated by an increase in the older age groups, so that the working-age populations tends to become larger than the non-working-age population. The age pyramid for South in 215 reflects the fact that fertility rates have fallen and the current cohorts of women of childbearing age are not giving rise to very large cohorts of children. The age structure of the population is changing the working-age population in South, which is becoming larger than the group of dependents. In 25, the dependency ratios in South will be at 47 dependents per 1 persons of working age, compared to 54 in 215 and 73 in 195. A. Population by age and sex in Nigeria, 195, 215, 25 and 21 (in millions) Male Female 8+ Male Female 8+ Male Female 8+ Male Female 4 Source: UNICEF analysis based on UN WPP 212 Revision.
45 AFRICA demographic dividend B. Population by age and sex in South, 195, 215, 25 and 21 (in millions) Male Female Male Female Male Female Male Source: UNICEF analysis based on UN WPP 212 Revision. Female Demographic dividend The situation of having a relatively larger working-age population is related to the so-called first demographic dividend.* The age structure of the population can have important economic consequences for the population since an increased number of potential workers per dependent increases the potential for increasing production and savings. The demographic dividend has to be seen as a window of opportunity for accelerated economic growth may or may not be realized. The favourable age structure of a population between fertility decline and an ageing population frames the window of opportunity in the third phase of the demographic transition. Besides the favourable age structure, inclusive and equitable economic and social policies as well as political and social stability matter for reaping the demographic bonus. In the next stage of the demographic transition the increasing longevity leads to a rapid growth of the group of elderly people. At the same time, low fertility results in a slower growth of the working-age population. The ageing population can create a burden for the working-age population if supported by intergenerational transfers, either through pension systems or from adult offspring. It has been argued that this burden would neutralize or be limited by life cycle savings of the elderly.** As the working-age population matures the prospect of retirement can provide the motivation to save for financial security. The additional savings can either be consumed or used to prolong economic growth. This stage of economic growth has been termed the second demographic dividend which can occur in the fourth phase of the demographic transition. Country classification The stage of countries in their demographic transition can be assessed by comparing the trajectory of fertility and mortality trends as well as the age structure. Most countries in sub-saharan have so far not experienced favourable dependency structures. Many of these countries are still experience high fertility rates today. Currently countries in can be classified broadly into 4 groups according to their fertility trends. In the first group adolescents and youth are currently entering the working-age population, and dependency ratios are decreasing. In the second group of countries, fertility started declining more noticeably in the 197s and 198s and by the mid 21st century a large group of adolescents will enter the working-age population. In the third group of countries fertility levels are still high but declining, which will after a prolonged decline lead to a change in the age structure of the population. The fourth group includes countries with small or only recent declines in the fertility levels, their potential for population growth remains high and the age structure will only change slowly. All countries in have experienced significant reductions in child and adult mortality. Since 195 life expectancy at birth increased in all n countries. However, substantial variations in mortality declines exist between countries. Several countries in fragile and conflict affected situations in have shown smaller reductions in mortality levels, and countries with high HIV prevalence experienced a stagnation or reduction in life expectancy in the late 199 and early 2s. * Bloom, D.E., D. Canning and J. Sevilla. The Demographic Dividend: A New Perspective on the Economic Consequences of Population Change. Population Matters Monograph MR-1274, RAND, Santa Monica 23. **Lee, R. and A. Mason, eds., 'Population Aging and the Generational Economy: A Global Perspective', Edward Elgar, Chetenham, 211. Countries in by fertility level and decline Countries Fertility level (range and average across countries) Low fertility Algeria, Cabo Verde, Egypt, Libya, Mauritius, Morocco, Seychelles, South, Tunisia (average: 2.4) Medium fertility level and declining Botswana, Djibouti, Lesotho, Namibia, Swaziland, Zimbabwe (average: 3.2) High fertility and declining Benin, Cameroon, Central n Republic, Comoros, Côte d'ivoire, Eritrea, Ethiopia, Equatorial Guinea, Gabon, Ghana, Guinea-Bissau, Kenya, Liberia, Madagascar, Mauritania, Rwanda, Sao Tome and Principe, Senegal, Sierra Leone, South Sudan, Sudan, Togo (average: 4.6) Fertility decline began Late 195 early s 197s 197s 198s 198s to now Total dependency ratio, (range 4% 58% 58% 74% 7% 86% 82% 112% and average across countries) (average: 49%) (average: 65%) (average: 79%) (average: 94%) High fertility and slowly or only recently declining Angola, Burkina Faso, Burundi, Chad, Congo, Democratic Republic of the Congo, Gambia, Guinea, Mali, Malawi, Mozambique, Niger, Nigeria, Somalia, Uganda, United Republic of Tanzania, Zambia (average: 5.9) Source: UNICEF analysis based on UN WPP 212 Revision. 41
46 UNICEF-NYHQ Pirozzi 42 2 Policy issues
47 Generation 23 2 Policy issues The 2 Millennium Declaration made meeting the special needs of one of the priorities for human development in the 21st century. And while much has been achieved in the past decade and a half, s burgeoning population together with the multiplicity of deprivations and risks that many of its children face on a daily basis makes this all the more an urgent priority for the post-215 framework. With s child population set to grow by two thirds by mid-century and number almost 1 billion, and with subnational child populations likely to grow even more rapidly in settings of poverty, inequality and fragility than national aggregate projections suggest, more ambitious strategies are required to realize the rights of all s children. International dialogue on s child demographics and their implications for children s rights, development and future is urgently required The seismic demographic shifts that s child population will experience are among the most important questions facing the continent, and indeed vital issues for the world. Global, regional and national policy debates and discourse on the implications of these trends are imperative, to better prepare for the post-215 agenda and to create an fit for all of its children in the rest of the century. As globalization continues to increase the interconnectedness and interdependence of the world s citizens, the reverberations of s demographic transition will be felt far beyond the continent s borders. It has implications for a diverse range of issues, from China s growing demand for resources and major investments in ; Europe s challenges with migration from ; and s emerging status as a major consumer and investment market; to political stability and human security, energy usage, protection, and global poverty reduction. A study by Kantorová and co-authors 9 illustrates how population growth can be challenging for public health services. Relative progress in the coverage of skilled attendance at birth in sub-saharan is slow due to the increasing annual number of births, only rising from 4 per cent in 199 to 53 per cent in 212. However, the absolute number of births attended by a skilled health provider doubled from 9 million to 18 million over the same period. Increasing numbers of births will continue to have a serious impact on the ability of countries to provide the necessary health services, unless programmes and resources are significantly expanded. In order to keep the same coverage of birth attendance as in 212 (53 per cent) for the year 23, roughly 25 million births need to be attended 7 million births more than the 18 million in 212, requiring many more health personnel and facilities. Without addressing s demographic challenge, the world as a whole may not be able to meet the post-215 targets it eventually sets, and move towards the Millennium Declaration s aims of a world marked by prosperity, peace, stability, equity, 9 Kantorová, V, Biddlecom, A. and Newby, H. Keeping pace with population growth, The Lancet, vol. 384, No. 994, 26 July 214, pp
48 tolerance and environmental sustainability by the end of this century. Investing in children will be paramount for to realize the rights of its burgeoning child population and benefit from a potential demographic dividend Almost 2 billion babies will be born in within 35 years and almost one billion children, nearly 4 per cent of the world s total, will live in by mid-century. If invested in through expanded and improved health care, education, protection and participation mechanisms, these 1 billion children and their predecessors, the children of today and tomorrow, have the potential to transform the continent, breaking centuries old cycles of poverty and inequity. But the opposite is also possible. Unless investment in the continent s children is prioritized, the sheer burden of population expansion has the potential to undermine attempts to eradicate poverty through economic growth, and worse, could result in rising poverty and marginalization of many if growth were to falter. A pressing concern is the potential for a slowing and possible reversal in s and indeed the world s annual numbers of under-five deaths, as falling mortality rates in the continent might be offset by a vastly higher number of births from a rapidly expanding population of women of reproductive age. And without equitable investment in children, prioritizing the poorest and most disadvantaged in the coming decades, risks repeating the mistakes of other continents and experiencing ever-widening disparities among its children even as its economy prospers, with negative implications for employment, sustained growth and political and social stability. Investment in children is also the best hope for to reap a potentially massive and historic demographic dividend, as the labour force increases and dependency rates fall rapidly in many n nations. For its youngest citizens, such investment is of the highest importance: science increasingly underscores the criticality of the earliest years. For example, poor nutrition in the first 1, days of a child's life can lead to stunted growth, which is irreversible and associated with impaired cognitive ability and reduced school and work performance. Investing in s adolescents and youth as well is its young children will also be paramount, for at least two reasons. The first is that such investment is required to break the vicious cycle of poverty and inequality that transpires when adolescents are engaged prematurely in adult roles of marriage and parenthood. Elevated incidence of early sex, unmet need for contraception and reproductive health services, and early marriage in are root causes of high adolescent fertility and high lifetime number of births for mothers. Not only does premature entry into these roles have physical and psychological risks for adolescents, particularly adolescent females, they also often prevent them from entering or completing secondary education, enjoying their adolescence to the fullest, and reaching their full potential. Second, s demographic dividend is far from guaranteed by its changing demographics alone. It is the 1-year-olds today that will be entering the labour force in a decade s time when many more of n nations begin to experience their demographic transition as dependency rates fall further. Increased labour supply owing to expansion in the working-age population, together with falling dependency ratios, may not in themselves sustain economic growth at elevated levels seen in recent years unless the additional labour can be productively absorbed. This is underscored in the n Common Position on post-215 agenda, whose economic policy agenda is focused on structural economic transformation, industrialization and employment generation. It is also reiterated in the n Union s Agenda 263, which charts a framework for the continent s development for the next 5 years. The best way of reaping the demographic dividend and structurally transforming s economy will heavily depend on investing now in human capital, particularly in health, nutrition, water and sanitation, and particularly quality education. Supporting s poor families to do this for their children, through service delivery and social protection in particular, will be paramount if is to take full advantage of its demographic transition in the coming decades. s adolescents and youth will require the skills and knowledge to meet the challenges of a changing, but also to be able to compete in an increasingly mechanized and hyper-connected global marketplace. That many of s adolescents increasingly have access to ICT through mobile telephony is a welcome window of opportunity for innovative and participation, but this must be complemented by far greater investments in their education, health care and protection, and linking education to employment opportunities. 44
49 Generation 23 Pro-active policy responses to s projected demographic shifts, including expanded reproductive health services, are imperative The demographic trends described in this report are not inevitable; most are policy responsive. But addressing the phenomenal pace of s population increase will require courageous and determined action. In particular, a discourse must emerge on how to extend access to greater reproductive health services to s families including culturally sensitive reproductive health education and services for women and particularly adolescent girls to reduce the unmet need in an equitable and socially sensitive fashion that also encourages utilization, is non-discriminatory against any child or woman, and does no harm. Unmet need for family planning reflects the gap between childbearing desires and contraceptive use. The estimates of the United Nations Population Division showed that for 215 in sub-saharan, 25 per cent of women of reproductive age who are married or in a union have an unmet need for family planning. 1 A report released by the United Nations Population Division in December underscored that most countries in sub-saharan have not seen a notable reduction in unmet need since 199, in contrast to other regions. However, recent success stories in sub-saharan (such as Ethiopia, Malawi and Rwanda) show that meeting demand for family planning can be accelerated if reproductive health becomes a higher governmental priority. Reducing adolescent fertility rates in is essential for improving the reproductive health of n adolescents and will be critical to pro-active responses to s projected demographic shifts. High levels of adolescent fertility are associated with elevated rates of unsatisfied demand for reproductive health services, including family planning. In 18 sub- Saharan n countries, more than 5 per cent of adolescent females report unmet need for family planning. 12 Investing in and empowering girls and young women, including ending child marriage and 1 United Nations, Department of Economic and Social Affairs, Population Division. Model-based Estimates and Projections of Family Planning Indicators, United Nations, New York, United Nations, Department of Economic and Social Affairs, Population Division. Meeting Demand for Family Planning, Population Facts No. 213/6, December 213. United Nations, New York. 12 United Nations, Department of Economic and Social Affairs, Population Division, Adolescent Fertility since the International Conference on Population and Development (ICPD) in Cairo, United Nations, New York, 213. prioritizing girls education, will be imperative to build an fit for children Investing in and empowering girls and young women will be imperative to slow adolescent fertility rates, and build an fit for all. Expanded programmes to end child marriage (as defined as a union in which one or both parties are under age 18), which is highly prevalent across the continent, must also be included as part of efforts to address s demographic transition. Child marriage is a determining factor in sustaining elevated rates of adolescent pregnancy and high lifetime fertility rates for women, and in excluding girls from education. Studies clearly show that educated women delay their first pregnancy, and space their births more widely than women who lack education. Prioritizing and girls education as well as ensuring quality education for all in will therefore also be among the most powerful measures to build an prepared for its demographic transitions and ready to take advantage of its potential demographic dividend. The majority of the world's countries that report high adolescent fertility and low school life expectancy (i.e., the number of years of schooling that a girl pupil can expect to spend from the beginning of primary through secondary school) are in sub-saharan, where out-of-school rates are also highest. 13 Empowerment of women and girls in must go beyond the statistics, as elsewhere, to the roots of discrimination, marginalization and violence that undermine their rights. Cultural, social, economic and political barriers that perpetuate the disempowerment of women must be urgently addressed if is to manage its demographic transition and reap the full rewards of prosperity that a demographic dividend can bring. National development plans and systems strengthening must take greater account of projected shifts in s child population, and focus ever more strongly on equity-based approaches in policy and programming With many n countries set to see unprecedented absolute increases in their child and overall populations, national development planning and systems strengthening must be adapted and sharpened to prepare for these demographic shifts. This will necessarily include a stronger focus on 13 United Nations Educational, Scientific and Cultural Organization Institute for Statistics. Education For All Global Monitoring Report 213/14. UNESCO, Paris,
50 demographic data and analysis at national and subnational levels. In short, demographic analysis at national and particularly at the subnational levels must become a much more integral component of development programming in. Civil registration and vital statistics (CRVS) systems will be essential for strengthening development planning at the national and subnational levels. Without accurate demographic data and analysis, it will be difficult to plan adequately for the required increases in essential services that s burgeoning child population will require. A key issue that requires urgent attention is birth registration: at present, only 44 per cent of s births are registered, leaving an estimated 85 million children under 5 unregistered. 14 Eight of the 1 countries with the lowest levels of birth registration are in sub-saharan. Investment in equity-based approaches to programming and policy for children are more imperative than ever, if we are to avert growth in the absolute number of s poor and extreme poor children and families in the decades to come. As Chapter 1 attests, these are the groups with the highest fertility and mortality rates among women and children, and most often the least able to access and utilize essential services. In addition, programmes and policies must adapt and focus on the changing nature of s poor, which may well increasingly become stratified along ethnic lines and will almost certainly become increasingly concentrated in both villages and slums. Climate change will cause new sources of risk and vulnerability that have implications for s demographic transition Perhaps more than any other continent, n nations are set to see a multiplicity of risks from climate change, particularly warming, drought, rising sea levels, and resource scarcity. Six of the 1 countries most vulnerable to climate change rated by Maplecroft 15 in late 213 are in. Three of s most populous countries, Nigeria, the Democratic Republic of the Congo and Ethiopia, which currently are home to one third of s children, number among these six. And these three countries alone will add an additional 134 million children in the next 35 years. Unless we change our approach to the 14 United Nations Children s Fund, Every Child s Birth Right: Inequities and trends in birth registration, UNICEF, New York, Maplecroft, Climate Change Vulnerability Index 214, October 213, environment radically, s children face an uncertain future from the direct and indirect risk of climate change. Among the effects are likely to be a rise in fragility; deterioration of environmental conditions; soaring migration as desertification and scarcity will drive migrants to the cities and to other regions; and delta cities threatened by rising sea levels. Parts of already face considerable shortages of vital services and resources such as water and food. Without adequate planning and preparation, s demographic expansion is likely to result in increased scarcity of vital resources, including food, water and energy. Twice the people will need at least twice the resources and probably more. Better resource planning and management will be imperative if shortages of vital goods and services are to be averted. In the decades to come, s demand for energy is likely to soar, for everything from lighting homes and streets, to providing power for business and public services. Rapid urbanization and a growing middle class will only intensify the demand for energy. has the potential to harness a variety of energy sources: hydrocarbons, hydroelectricity, wind and solar among them. With many of its population still not reliant on power driven by fossil fuels, and in the interests of its children and the environment, also has a perhaps unique opportunity among all regions to focus on building renewable and sustainable sources of energy for its rapidly expanding population, and to build a sustainable environment for its children. Child mortality, undernutrition, poverty, desperation and crises will increasingly become pressing issues in urban areas of, and development initiatives must adapt accordingly Urbanization also poses a growing challenge to realizing the rights of s poorest children in particular. In the absence of new models and strategies for absorbing internal migrants and helping to realize their rights, faces a rise in its slum population, particularly in its megacities. The rural poor migrants will bring their deprivations of child mortality, undernutrition and poverty with them to the cities, and it is likely that the number of under-five and under-18 deaths in urban areas will increase in the coming years, even if though the majority will still take place in rural areas. And emerging challenges, such as traffic accidents among adolescents and urban youth violence, will only heighten as a threat to childhood in urban. 46
51 Generation 23 For adolescents and youth, an increasingly urban in the coming decades will bring to the fore the attendant problems of urban unemployment and underemployment, and the hopelessness of bleak economic prospects for urban youth that is currently being experienced in other world regions, with attendant potential to spur disillusionment and disenfranchisement among youth. This, combined with other factors such as sprawling slums, could spill over into increasing urban violence and crime. Much more must therefore be done to address the needs of s urban adolescents and youth. Education systems, in particular, along with health care, must increasingly focus on quality of outcomes, and also on curricula that link achievements and learning in schools and colleges to the evolving needs of the n labour market. But other actions, such as civic participation, prevention of substance abuse, and recreational activities, to name but three, will also be important to meet s children s social and civic rights. Much of the focus of child survival and development efforts of recent decades in has been to step up rural-based programmes through emphasis on community-based approaches targeted at the poorest and most disadvantaged. These have often yielded substantial results, as is seen by the progress made in many n countries towards the Millennium Development Goals. Programmes in rural areas need to expand: will remain a rural continent for the foreseeable future. But with many rural inhabitants rapidly moving themselves and their families to the cities and this trend likely to intensify if economic growth remains rapid a two-pronged approach is now required, one that prioritizes and adapts programming and policy to slums as well as villages. Scaling up urban programming for is no longer optional but increasingly imperative. Building resilience for s children in the many countries facing situations of fragility will be critical to realizing their rights The scale of emergency response to natural disasters and conflict is likely to expand, given the likelihood of increasing numbers among the poorest regions and communities of the continent, who are also the most impacted by these crises. National, regional and international emergency programming must be prepared to scale up efforts in these areas and work with n governments to improve disaster risk reduction, preparedness and resilience. The fragility of many n nations is also a factor sustaining high fertility rates. Fragile states tend to have higher rates of child mortality than non-fragile states, sustaining incentives to maintain high levels of fertility (although fertility levels may decline during certain types of humanitarian crises and conflicts UNICEF-NYHQ Ramoneda 47
52 periodically). They also tend to have high rates of illiteracy and extreme poverty and marginalization, complicating efforts at extending reproductive health services. When conflict is present, the challenges are magnified further, as systems break down further. Building resilience in, through peace-building, risk and foresight-based planning, creation of social safety nets and integrating humanitarian and development work, will be critical to both help support s growing child population in fragile states and also to reduce their fragility in the future. Approaches such as the Peacebuilding, Education and Advocacy programme, introduced in several n nations and which, among other things, seeks to increase the capacity of parents, children and other stakeholders to prevent, reduce and cope with conflict and promote peace, will need to be expanded to help ensure that s children grow up in a continent of stability, security and prosperity. Tackling extreme poverty and investing in poor children in now will be critical to provide better and more sustainable future living standards for all, and to permanently reduce future poverty and inequity If current demographic trends continue, and s economic growth rate remains steady or falters, there is a strong possibility that millions more children will grow up in extreme poverty. Even though currently has one of the world s fastest GDP growth rates, most of its population is missing out on this economic boom, which in many countries is being driven by extractive industries and commodity-based exports. Poverty remains stubbornly high, particularly in sub- Saharan, and inequality within countries is often as pronounced as in other more affluent regions, and sometimes more. In addition, World Bank data for sub-saharan in 26 countries with data available shows that more than half of children under 18 are living in extremely poverty on less than US$1.25 per day. This scenario may be reversed, however, through sustained investments in s children and youth in quality education and health care; in adequate nutrition, water and sanitation; in improved protection systems against violence, exploitation and abuse; in initiatives to lower rates of child marriage and labour; through fostering a culture of entrepreneurship and empowerment; and by implementing inclusive and sustainable policies that act against all forms of discrimination against children, and seek to protect s unique environment for current and future generations. A first step must be a keen global and regional discussion on how to vastly reduce extreme poverty in within the next decade. And this should take place within the context of the post-215 agenda and the emerging conversation on how this agenda will be financed. A new debate on equity for s children must emerge so that another generation of children on this continent will not be lost to poverty, fragility and inequality. All stakeholders face the challenge of supporting faster and more sustainable human development in in the 21st century. The purpose of the Generation 23 series on child demographics is not to answer all of the many policy questions its analysis raises but rather to begin to pose the questions and spark debate and discourse that will hopefully lead to decisive and determined action. There are a growing number of forums and conversations on the future of, and these are spurring a rich dialogue and diverse policy options. Fewer of these forums, however, have explicitly focused on s children, and fewer still on the seismic demographic shifts for them that will be a leading determinant of their lives and those of their children in the remainder of this century. UNICEF considers it imperative that a discourse takes place on s child demographics, poverty and inequity and rights, and that all the many stakeholders that will help to determine the continent s future, including governments and donors, the private sector, civil society organizations, religious leaders, and children themselves, be included and have a voice. It is time to acknowledge our shared responsibility to the future of and take the policy decisions required for all s children, present and future, to finally realize all of their rights. 2 Policy issues 48
53 UNICEF-NYHQ Eseibo Generation 23 Appendix and tables 49
54 APPENDIX Trends in total fertility rates in countries by UNECA region, , number of children per woman FIG A Central Cameroon Central n Republic Chad Congo Equatorial Guinea Gabon Sao Tome & Principe Central World Eastern Comoros Democratic Republic of the Congo Djibouti Eritrea Ethiopia Kenya Madagascar Rwanda Seychelles Somalia South Sudan Uganda United Republic of Tanzania Eastern World North Southern Algeria Egypt Libya Mauritania Morocco Sudan Tunisia North World Angola Botswana Lesotho Malawi Mauritius Mozambique Namibia South Swaziland Zambia Zimbabwe Southern World West Benin Burkina Faso Cabo Verde Côte d'ivoire Gambia Ghana Guinea Guinea-Bissau Liberia Mali Niger Nigeria Senegal Sierra Leone Togo West World Source: UNICEF analysis based on UN WPP 212 Revision. 5
55 Generation 23 Children under 5, adolescents, and persons aged 6 and over by region, FIG A2 A. Number of children under 5 B. Share of children under 5 Population (in millions) Asia Restofthe world % Rest of the world 5 5% Asia Population (in millions) C. Number of adolescents Asia Rest of the world D. Share of adolescents 1 1 Rest of the world % 5 5 % 25 Asia E. Number of persons aged 6 and over 1,6 F. Share of persons aged 6 and over 1 1 Popualtion (in millions) 1,4 1,2 1, Asia Restofthe world Rest of the world % 5 5 % 25 Asia Source: UNICEF analysis based on UN WPP 212 Revision. 51
56 APPENDIX Children under 5, adolescents, and persons aged 6 and over by UNECA region, FIG A3 A. Number of children under 5 B. Share of children under 5 Population (in millions) Central 1 North Southern % 5 Eastern 5 % West 25 West Eastern Southern North Central C. Number of adolescents D. Share of adolescents Population (in millions) Central 1 North Southern % 5 Eastern 5 % West 25 West Eastern Southern North Central Population (in millions) E. Number of persons aged 6 and over F. Share of persons aged 6 and over 1 Central Southern 75 North % 5 West % West Eastern Southern North Central Eastern Source: UNICEF analysis based on UN WPP 212 Revision. 52
57 Generation 23 Top 1 countries in with the greatest numbers of children under age 5 and adolescents, 215 and 25 FIG A4 215 A. Children under 5, in millions (% of ) 25 Nigeria, 32 (18%) Nigeria, 58 (22%) Other countries, 72 (4%) Algeria, 5 (3%) South, 5 (3%) Sudan, 6 (3%) Ethiopia, 15 (8%) Kenya, 7 (4%) Democratic Republic of the Congo, 12 (7%) Egypt, 9 (5%) United Republic of Tanzania, 9 (5%) Uganda, 7 (4%) Mozambique, 7 (3%) Sudan, 8 (3%) Other countries, 12 (38%) Egypt, 9 (3%) Kenya, 1 (4%) Democratic Republic of the Congo, 19 (7%) Uganda, 13 (5%) Niger, 12 (4%) United Republic of Tanzania, 16 (6%) Ethiopia, 16 (6%) B. Adolescents, in millions (% of ) Nigeria, 41 (16%) Nigeria, 96 (2%) Other countries, 11 (39%) Mozambique, 7 (3%) Sudan, 9 (4%) South, 1 (4%) Ethiopia, 25 (1%) Democratic Republic of the Congo, 17 (6%) Egypt, 16 (6%) United Republic of Tanzania, 12 (5%) Kenya, 11 (4%) Uganda, 1 (4%) Mozambique, 13 (5%) Sudan, 15 (3%) Other countries, 179 (38%) Niger, 17 (4%) Egypt, 18 (4%) Ethiopia, 32 (7%) Kenya, 19 (4%) Democratic Republic of the Congo, 32 (7%) United Republic of Tanzania, 27 (6%) Uganda, 22 (5%) Note: The first number cited for each country refers to the child population in millions, the second to its share of the n population. Source: UNICEF analysis based on UN WPP 212 Revision. 53
58 APPENDIX Top 1 countries in with the largest absolute and percentage increases in children under 5 and adolescents from FIG A5 A. By largest absolute increases, children under 5 in millions B. By largest percentage increases, children under 5 in millions (% increase) - Nigeria Niger 4 +8 (191%) Niger 4 +8 Zambia 3 +4 (128%) - United Republic Nigeria Niger 4 +8 (191%) 9 +7 Mali 3 +3 (19%) of Tanzania Democratic Republic Niger 4 +8 Zambia 12 United Republic 3 +4 (128%) +6 9 of the Congo of Tanzania +7 (83%) United Republic 9 +7 Mali 3 +3 (19%) of Tanzania Uganda 7 +6 Nigeria (82%) Democratic Republic 12 United Republic +6 9 of the Zambia Congo 3 +4 of Tanzania +7 (83%) Malawi 3 +2 (79%) Uganda 7 +6 Nigeria 32 Mali 3 +3 Somalia 2 +2 (77%) +26 (82%) Zambia 3 +4 Malawi 3 +2 (79%) Kenya 7 +3 Uganda 7 +6 (76%) Mali 3 +3 Somalia 2 +2 (77%) Mozambique 5 +3 Burundi 2 +2 (75%) Kenya 7 +3 Uganda 7 +6 (76%) Madagascar 4 +3 Gambia +.3 (71%) Mozambique 5 +3 Burundi 2 +2 (75%) 215 Madagascar Increase from 215 to Increase from 215 to 25 Gambia +.3 (71%) 215 Increase from 215 to Increase from 215 to 25 C. By largest absolute increases, adolescents in millions D. By largest percentage increases, adolescents in millions, Nigeria Niger (% increase) (267%) United Republic of Tanzania Mali 4 +7 (172%) Democratic Republic Nigeria Niger (267%) of the Congo Zambia 4 +6 (163%) United Republic of Tanzania Mali 4 +7 (172%) Uganda Burundi 2 +3 (142%) Democratic Republic of the Congo Zambia 4 +6 (163%) Niger Nigeria (132%) Uganda Burundi Kenya United Republic 2 +3 (142%) (13%) of Tanzania Niger Nigeria (132%) Ethiopia Gambia.5 +1 (128%) Kenya United Republic (13%) Mali 4+7 of Tanzania Uganda (128%) Ethiopia Gambia Mozambique 7 +6 Somalia.5 +1 (128%) 3 +3 (122%) Mali 4+7 Uganda Angola 5 +6 Chad (128%) 3 +4 (117%) Mozambique 7 +6 Somalia 3 +3 (122%) 215 Angola 5 Increase +6 from 215 to Chad 3 Increase +4 (117%) from 215 to Increase from 215 to Increase from 215 to 25 Note: The first number cited for each country refers to the population in 215, the second to the increase from 215 to 25. Together they represent the population in 25. Source: UNICEF analysis based on UN WPP 212 Revision. 54
59 Generation 23 Population by age and sex in, 195, 215, 25 and 21 (in millions) FIG A Male 195 Female Male Children (under 18) 215 Female Adults (18 and above) Male 25 Female Male 21 Female Source: UNICEF analysis based on UN WPP 212 Revision. Regional classification and notes Averages for regions and the world presented in this report are calculated using data from countries and areas as classified below. Numbers and percentages are rounded and therefore may not sum to totals. Countries listed individually are those with 9, inhabitants or more in 212; the others are included in the aggregates but are not listed separately. Continents Asia Afghanistan, Armenia, Azerbaijan, Bahrain, Bangladesh, Bhutan, Brunei Darussalam, Cambodia, China, Cyprus, Democratic People's Republic of Korea, Georgia, India, Indonesia, Iran (Islamic Republic of), Iraq, Israel, Japan, Jordan, Kazakhstan, Kuwait, Kyrgyzstan, Lao People's Democratic Republic, Lebanon, Malaysia, Maldives, Mongolia, Myanmar, Nepal, Oman, Pakistan, Philippines, Qatar, Republic of Korea, Saudi Arabia, Singapore, Sri Lanka, State of Palestine, Syrian Arab Republic, Tajikistan, Thailand, Timor-Leste, Turkey, Turkmenistan, United Arab Emirates, Uzbekistan, Viet Nam, Yemen Algeria, Angola, Benin, Botswana, Burkina Faso, Burundi, Cameroon, Cabo Verde, Central n Republic, Chad, Comoros, Congo, Côte d'ivoire, the Democratic Republic of the Congo, Djibouti, Egypt, Equatorial Guinea, Eritrea, Ethiopia, Gabon, Gambia, Ghana, Guinea, Guinea-Bissau, Kenya, Lesotho, Liberia, Libya, Madagascar, Malawi, Mali, Mauritania, Mauritius, Morocco, Mozambique, Namibia, Niger, Nigeria, Rwanda, Sao Tome and Principe, Senegal, Seychelles, Sierra Leone, Somalia, South, South Sudan, Sudan, Swaziland, Togo, Tunisia, Uganda, United Republic of Tanzania, Zambia, Zimbabwe Rest of the world Albania, Andorra, Antigua and Barbuda, Argentina, Australia, Austria, Bahamas, Barbados, Belarus, Belgium, Belize, Bolivia (Plurinational State of), Bosnia and Herzegovina, Brazil, Bulgaria, Canada, Chile, Colombia, Cook Islands, Costa Rica, Croatia, Cuba, Czech Republic, Denmark, Dominica, Dominican Republic, Ecuador, El Salvador, Estonia, Fiji, Finland, France, Germany, Greece, Grenada, Guatemala, Guyana, Haiti, Holy See, Honduras, Hungary, Iceland, Ireland, Italy, Jamaica, Kiribati, Latvia, Liechtenstein, Lithuania, Luxembourg, Malta, Marshall Islands, Mexico, Micronesia (Federated States of), Monaco, Montenegro, Nauru, Netherlands, New Zealand, Nicaragua, Niue, Norway, Palau, Panama, Papua New Guinea, Paraguay, Peru, Poland, Portugal, Republic of Moldova, Romania, Russian Federation, Saint Kitts and Nevis, Saint Lucia, Samoa, San Marino, Serbia, Slovakia, Slovenia, Solomon Islands, Spain, Saint Vincent and the Grenadines, Suriname, Sweden, Switzerland, The Former Yugoslav Republic of Macedonia, Tonga, Trinidad and Tobago, Tuvalu, Ukraine, United Kingdom, United States of America, Uruguay, Vanuatu, Venezuela (Bolivarian Republic of) United Nations Economic Commission for Central Cameroon, Central n Republic, Chad, Congo, Equatorial Guinea, Gabon, Sao Tome and Principe Eastern Burundi, Comoros, Democratic Republic of the Congo, Djibouti, Eritrea, Ethiopia, Kenya, Madagascar, Rwanda, Seychelles, Somalia, South Sudan, Uganda, United Republic of Tanzania North Algeria, Egypt, Libya, Mauritania, Morocco, Sudan, Tunisia Southern Angola, Botswana, Lesotho, Malawi, Mauritius, Mozambique, Namibia, South, Swaziland, Zambia, Zimbabwe West Benin, Burkina Faso, Cabo Verde, Côte d'ivoire, Gambia, Ghana, Guinea, Guinea-Bissau, Liberia, Mali, Niger, Nigeria, Senegal, Sierra Leone, Togo n Union regions Central Burundi, Cameroon, Central n Republic, Chad, Congo, Democratic Republic of the Congo, Equatorial Guinea, Gabon, Sao Tome and Principe Eastern Comoros, Djibouti, Eritrea, Ethiopia, Kenya, Madagascar, Mauritius, Rwanda, Seychelles, Somalia, South Sudan, Sudan, Uganda, United Republic of Tanzania Northern Algeria, Egypt, Libya, Mauritania, Tunisia, Western Sahara Southern Angola, Botswana, Lesotho, Malawi, Mozambique, Namibia, South, Swaziland, Zambia, Zimbabwe Western Benin, Burkina Faso, Cabo Verde, Côte d'ivoire, Gambia, Ghana, Guinea, Guinea-Bissau, Liberia, Mali, Niger, Nigeria, Senegal, Sierra Leone, Togo 55
60 AFRICA demographic indicators population Total population (thousands) Child population under 5 (thousands) Countries or areas Algeria 8,872 19,475 4,633 48,561 54,522 1,43 3,553 4,633 3,593 3,772 Angola 4,148 7,637 22,82 34,783 54, ,491 4,145 5,495 6,629 Benin 2,255 3,718 1,88 15,57 22, ,78 2,84 2,382 Botswana ,56 2,348 2, Burkina Faso 4,284 6,823 17,915 26,564 4, ,278 3,88 3,963 4,96 Burundi 2,39 4,127 1,813 16,392 26, ,4 2,479 3,54 Cabo Verde Cameroon 4,466 8,932 23,393 33,74 48, ,635 3,746 4,536 5,396 Central n Republic 1,327 2,274 4,83 6,318 8, Chad 2,52 4,513 13,66 2,878 33, ,56 3,395 4,245 Comoros ,57 1, Congo 88 1,796 4,671 6,754 1, ,298 Côte d'ivoire 2,63 8,266 21,295 29,227 42, ,599 3,389 4,57 4,989 Democratic Republic of the Congo 12,184 26,357 71,246 13, ,291 2,17 4,78 12,357 15,738 18,85 Djibouti ,75 1, Egypt 21,514 44,932 84,76 12, ,798 3,731 6,894 9,285 8,893 8,682 Equatorial Guinea ,139 1, Eritrea 1,141 2,415 6,738 9,782 14, ,14 1,238 1,427 Ethiopia 18,128 35,241 98, ,67 187,573 3,328 6,75 14,577 16,224 16,149 Gabon ,751 2,382 3, Gambia ,97 3,56 4, Ghana 4,981 1,82 26,984 35,264 45, ,933 3,735 3,996 4,249 Guinea 3,94 4,495 12,348 17,322 24, ,945 2,329 2,625 Guinea-Bissau ,788 2,473 3, Kenya 6,77 16,268 46,749 66,36 97,173 1,56 3,347 7,221 8,697 1,477 Lesotho 734 1,37 2,12 2,419 2, Liberia 93 1,893 4,53 6,395 9, ,34 Libya 1,113 3,78 6,317 7,459 8, Madagascar 4,84 8,747 24,235 36, 55, ,647 3,77 5,8 6,47 Malawi 2,881 6,237 17,39 25,96 41, ,244 2,911 3,95 5,219 Mali 4,638 6,735 16,259 26,34 45, ,23 3,129 4,589 6,535 Mauritania 66 1,534 4,8 5,64 7, Mauritius ,254 1,288 1, Morocco 8,986 19,799 33,955 39,19 42,884 1,388 3,229 3,68 3,9 2,872 Mozambique 6,442 12,142 27,122 38,876 59,929 1,1 2,172 4,538 5,941 7,3 Namibia 485 1,13 2,392 3,42 3, Niger 2,56 5,834 19,268 34,513 69, ,161 3,991 6,828 11,627 Nigeria 37,86 73, , ,12 44,355 6,33 13,373 32,16 43,74 58,473 Rwanda 2,186 5,141 12,428 17,771 25, ,61 1,935 2,257 2,466 Sao Tome and Principe Senegal 2,477 5,569 14,967 21,856 32, ,87 2,494 3,51 3,848 Seychelles Sierra Leone 1,944 3,18 6,319 8,58 1, ,4 1,78 Somalia 2,264 6,9 11,123 16,88 27, ,76 2,33 2,786 3,598 South 13,683 29,77 53,491 58,96 63,45 2,88 4,55 5,268 4,796 4,432 South Sudan 2,583 4,72 12,152 17,297 24, ,882 2,318 2,654 Sudan 5,734 14,418 39,613 55,78 77,138 1,3 2,729 5,85 7,38 7,987 Swaziland ,286 1,516 1, Togo 1,395 2,721 7,171 1,15 14, ,135 1,322 1,613 Tunisia 3,99 6,38 11,235 12,561 13, Uganda 5,158 12,55 4,141 63,388 14, ,439 7,47 1,183 13,136 United Republic of Tanzania 7,65 18,687 52,291 79, ,417 1,461 3,542 8,992 12,7 16,477 Zambia 2,372 5,847 15,52 24,957 44, ,123 2,841 4,155 6,476 Zimbabwe 2,747 7,289 15,46 2,292 26, ,454 2,118 2,244 2, Source: United Nations, Department of Economic and Social Affairs, Population Division, World Population Prospects: The 212 Revision, United Nations, New York, 213.
61 demographic indicators population Adolescents (thousands) Child population under 18 (thousands) % children under 18 in total population Countries or areas 1,99 4,624 6,47 8,942 6,928 4,185 1,313 13,339 14,699 13, Algeria 882 1,74 5,449 8,131 11,57 1,963 4,46 12,254 17,1 22, Angola ,528 3,397 4, ,97 5,312 6,763 8, Benin Botswana 933 1,565 4,279 6,11 8,484 2,15 3,556 9,286 12,58 16, Burkina Faso ,325 3,965 5,62 1,88 2,14 5,512 7,996 11, Burundi Cabo Verde 939 1,937 5,416 7,396 9,567 2,42 4,537 11,496 14,739 18, Cameroon ,97 1,338 1, ,1 2,23 2,593 2, Central n Republic ,33 5,2 7,236 1,93 2,37 7,461 1,59 14, Chad Comoros ,36 1,519 2, ,281 3,8 4, Congo 594 1,69 4,851 6,535 8,496 1,33 4,225 1,156 13,135 16, Côte d'ivoire 2,68 5,87 16,691 23,648 32,149 6,87 13,421 36,497 49,32 62, Democratic Republic of the Congo Djibouti 4,411 1,245 15,625 18,364 17,884 9,762 21,94 3,76 32,58 31, Egypt Equatorial Guinea ,485 2,24 2, ,277 3,39 4,239 5, Eritrea 3,971 7,374 24,596 29,265 32,451 9,128 17,964 48,229 55,77 58, Ethiopia , Gabon , ,31 1,57 2, Gambia 1,12 2,529 5,851 7,29 8,16 2,567 5,654 11,952 13,75 14, Ghana ,833 3,816 4,744 1,33 2,151 5,978 7,578 8, Guinea ,84 1, Guinea-Bissau 1,277 3,848 1,535 14,453 18,822 2,799 9,27 22,513 28,419 35, Kenya Lesotho ,44 1,395 1, ,23 2,794 3, Liberia ,118 1, ,615 2,176 1,994 1, Libya 858 1,991 5,714 7,835 1,965 1,814 4,618 11,776 16,2 21, Madagascar 638 1,43 4,16 5,977 8,746 1,498 3,336 8,932 12,369 17, Malawi 934 1,475 3,798 6,297 1,337 2,75 3,348 8,8 13,716 2, Mali ,196 1, ,879 2,358 2, Mauritania Mauritius 2,1 5,34 5,814 6,967 5,76 4,183 1,198 11,241 11,774 1, Morocco 1,386 2,681 6,52 9,42 12,851 3,86 6,87 14,34 18,628 24, Mozambique ,84 1, Namibia 611 1,31 4,534 8,35 16,629 1,438 3,133 1,918 19,413 35, Niger 8,196 15,958 41,363 63,737 95,82 18,147 36,974 93, , , Nigeria 492 1,164 3,21 3,885 4,697 1,94 2,798 6,126 7,547 8, Rwanda Sao Tome and Principe 535 1,228 3,426 5,9 6,637 1,184 2,947 7,456 9,934 12, Senegal Seychelles ,461 1,73 1, ,579 3,3 3,393 3, Sierra Leone 476 1,351 2,679 3,967 5,94 1,68 3,47 5,967 8,485 11, Somalia 2,825 6,561 9,66 1,215 9,423 6,11 13,949 18,459 17,89 16, South 57 1,47 2,828 3,79 4,778 1,292 2,389 5,858 7,565 9, South Sudan 1,256 3,314 9,19 11,631 14,578 2,865 7,71 18,662 23,7 27, Sudan Swaziland ,66 2,222 2, ,434 3,44 4,349 5, Togo 741 1,562 1,67 1,813 1,384 1,458 3,19 3,79 3,24 2, Tunisia 1,114 2,93 9,853 15,254 22,481 2,561 6,767 22,2 31,823 43, Uganda 1,734 4,28 11,932 18,344 27,462 4,9 9,96 26,726 37,834 54, United Republic of Tanzania 529 1,345 3,713 5,874 9,753 1,221 3,147 8,247 12,616 2, Zambia 6 1,738 3,422 4,33 4,44 1,324 4,59 6,87 8,44 8, Zimbabwe Source: United Nations, Department of Economic and Social Affairs, Population Division, World Population Prospects: The 212 Revision, United Nations, New York,
62 AFRICA demographic indicators Birth, fertility and urbanization Number of births (thousands) Cumulative number of births (thousands) Countries or areas Algeria ,19 13,113 14,743 Angola ,24 1,418 23,563 17,858 26,877 Benin ,764 6,792 9,789 Botswana , Burkina Faso ,31 17,793 12,721 19,282 Burundi ,836 8,254 13,412 Cabo Verde Cameroon ,136 21,955 14,752 21,482 Central n Republic ,639 2,657 3,395 Chad ,92 11,55 16,961 Comoros Congo ,7 3,42 4,98 Côte d'ivoire ,5 2,91 13,188 19,49 Democratic Republic of the Congo 568 1,228 2,988 3,625 4,124 72,839 53,27 78,426 Djibouti Egypt 1,117 1,697 1,899 1,86 1,722 61,197 29,447 35,929 Equatorial Guinea Eritrea ,773 3,946 5,639 Ethiopia 925 1,751 3,17 3,377 3,276 9,614 52,879 66,975 Gabon , ,278 Gambia ,866 1,539 2,457 Ghana ,352 13,244 17,628 Guinea ,727 7,699 1,84 Guinea-Bissau ,793 1,141 1,642 Kenya ,579 1,878 2,174 4,947 27,454 41,16 Lesotho , ,1 Liberia ,61 2,735 4,52 Libya ,357 1,754 1,897 Madagascar ,58 1,326 21,17 15,192 24,5 Malawi ,129 17,461 12,53 2,321 Mali ,53 1,416 17,43 14,468 25,118 Mauritania ,446 2,362 3,473 Mauritius Morocco ,557 1,591 11,78 Mozambique ,3 1,34 1,539 26,688 18,63 28,648 Namibia ,935 1,2 1,197 Niger ,552 2,522 19,645 19,837 41,17 Nigeria 1,758 3,441 7,441 9,616 12, , , ,977 Rwanda ,783 7,25 9,955 Sao Tome and Principe Senegal ,527 9,66 15,8 Seychelles Sierra Leone ,579 3,687 4,72 Somalia ,268 8,872 14,176 South 618 1,19 1, ,842 16,371 18,858 South Sudan ,331 7,556 1,664 Sudan ,3 1,523 1,68 35,14 22,69 32,267 Swaziland , Togo ,499 4,31 6,343 Tunisia ,892 2,688 2,885 Uganda ,696 2,221 2,751 38,589 31,361 5,464 United Republic of Tanzania ,998 2,633 3,461 47,97 36,736 61,911 Zambia ,398 15,47 12,59 23,42 Zimbabwe ,92 7,518 9, Source: United Nations, Department of Economic and Social Affairs, Population Division, World Population Prospects: The 212 Revision, United Nations, New York, 213.
63 demographic indicators Birth, fertility and urbanization Total fertility (children per woman) Percentage of population residing in urban areas Countries or areas Algeria Angola Benin Botswana Burkina Faso Burundi Cabo Verde Cameroon Central n Republic Chad Comoros Congo Côte d'ivoire Democratic Republic of the Congo Djibouti Egypt Equatorial Guinea Eritrea Ethiopia Gabon Gambia Ghana Guinea Guinea-Bissau Kenya Lesotho Liberia Libya Madagascar Malawi Mali Mauritania Mauritius Morocco Mozambique Namibia Niger Nigeria Rwanda Sao Tome and Principe Senegal Seychelles Sierra Leone Somalia South South Sudan Sudan Swaziland Togo Tunisia Uganda United Republic of Tanzania Zambia Zimbabwe Source: United Nations, Department of Economic and Social Affairs, Population Division, World Urbanization Prospects: The 214 Revision, United Nations, New York,
64 WORLD demographic indicators population Total population (thousands) Child population under 5 (thousands) Continents , ,739 1,164,52 1,632,239 2,39,735 38,699 86,71 179, ,549 27,718 Asia 1,386,17 2,611,52 4,353,518 4,854,755 5,133,89 197,92 334, , ,124 3,579 Rest of the world 897,82 1,331,3 1,766,994 1,896,674 1,986,537 98, , , , ,245 Europe 548, , , ,15 78,79 51,679 49,788 4,89 35,693 36,147 Latin America and the Caribbean 164,98 359, , ,58 775,93 26,478 51,845 53,55 5,117 44,424 Northern America 171,55 254,687 36,999 43, ,81 18,873 18,477 23,13 24,994 26,842 Oceania 12,456 22,58 38,518 46,355 55,818 1,52 2,174 3,189 3,44 3,831 UNECA* regions Central 9,862 18,557 49,226 7,823 16,496 1,496 3,362 8,169 1,137 12,275 Eastern 64,18 141,62 388, ,815 85,98 11,492 26,81 63,582 79,245 95,418 North 49,979 19,544 22,54 271,43 325,86 8,323 18,237 25,611 24,498 25,354 Southern 34,671 73,117 16, ,576 31,79 5,731 12,815 22,846 27,61 33,27 West 7,15 135, ,699 59,981 86,626 11,658 24,847 59,11 78,68 14,42 n Union regions Central 24,355 49,41 131,285 19, ,477 4,43 8,925 22,53 28,353 34,629 Eastern 55, , ,429 53,45 746,486 1,64 24,85 55,142 68,135 81,19 Northern 35,273 75, , ,546 26,628 5,96 12,32 16,138 14,55 14,545 Southern 34,178 72, , ,288 3,478 5,642 12,76 22,775 27,532 33,211 Western 7,15 135, ,699 59,981 86,626 11,658 24,847 59,11 78,68 14,42 World 2,512,382 4,42,91 7,285,14 8,383,668 9,511, ,15 542, ,55 661, ,543 demographic indicators Birth, fertility and urbanization Number of births (thousands) Cumulative number of births (thousands) Continents or areas ,148 21,599 4,34 47,937 56,974 1,48,746 74,61 1,62,735 Asia 61,671 76,67 74,651 66,336 6,95 2,735,229 1,122,5 1,265,289 Rest of the world 23,53 25,956 24,19 22,732 22, , , ,622 Europe 11,835 1,125 7,944 7,54 7, , , ,498 Latin America and the Caribbean 7,234 11,526 1,85 9,996 8,84 44, , ,94 Northern America 4,121 3,846 4,668 4,99 5, ,799 77,824 13,351 Oceania ,191 1,732 14,679 UNECA* regions Central ,883 2,24 2,595 46,831 32,993 48,897 Eastern 3,193 6,781 14,352 17,273 2,31 364, , ,912 North 2,575 4,47 5,34 5,44 5, ,698 82,564 12,975 Southern 1,659 3,135 5,11 6,6 7,18 142,6 88, ,369 West 3,295 6,425 13,619 17,373 22, , ,681 41,582 n Union regions Central 1,11 2,288 5,345 6,426 7,459 13,55 94,453 14,734 Eastern 2,85 6,19 12,24 14,624 16, ,69 214, ,589 Northern 1,841 2,99 3,34 2,93 2,99 14,294 49,549 59,133 Southern 1,637 3,113 5,96 5,992 7,7 141,331 88, ,122 Western 3,295 6,425 13,619 17,373 22, , ,681 41,582 World 96, , ,64 137,4 139,212 4,657,574 2,21,897 2,776,646 6 *United Nations Economic Commission for Source: United Nations, Department of Economic and Social Affairs, Population Division, World Population Prospects: The 212 Revision, United Nations, New York, 213.
65 demographic indicators population Adolescents (thousands) Child population under 18 (thousands) % children under 18 in total population Countries or areas 49,325 17, , , ,767 18, ,91 547,128 71,913 98, ,98 593, ,192 71,3 63, ,1 1,155,862 1,272,651 1,232,93 1,111, Asia 159,431 24, ,1 241,94 228,129 37,27 433,885 43,3 424,53 45, Rest of the world 97,53 19,51 75,195 8,192 72, , , , ,83 13, Europe 35, 82,88 111,475 14,791 94,375 76, ,89 196, , , Latin America and the Caribbean 24,994 44,167 46,688 5,19 53,847 53,973 71,556 83,3 9,139 96, Northern America 1,934 4,281 5,742 6,848 7,529 4,257 7,922 1,862 12,367 13, Oceania UNECA* regions 2,1 4,2 11,46 16,56 21,5 4,338 9,351 24,67 32,461 41, Central 13,981 31,52 92,22 127,1 168,562 31,646 73, , , , Eastern 1,875 25,839 4,221 5,131 48,944 23,282 54,829 81,134 89,437 89, North 7,381 16,612 34,752 45,598 58,742 16,338 37,16 72,31 9, , Southern 15,78 29,574 78, , ,19 33,392 68, ,73 243,33 341, West n Union regions 5,188 1,825 3,476 43,669 59,268 11,513 24,877 66,68 89, , Central 12,171 28,24 82,3 111,26 145,499 27,59 66, , , , Eastern 7,523 17,522 25,392 31,651 28,761 16,241 36,995 51,417 54,861 52, Northern 7,268 16,383 34,567 45,457 58,614 16,84 36,695 72,17 89,91 112, Southern 15,78 29,574 78, , ,19 33,392 68, ,73 243,33 341, Western 496, ,29 1,188,281 1,38,355 1,328,82 1,7,24 1,833,657 2,249,782 2,368,372 2,426, World demographic indicators Birth, fertility and urbanization Total fertility (children per woman) Percentage of population residing in urban areas Continents or areas Asia Rest of the world Europe Latin America and the Caribbean Northern America Oceania UNECA* regions Central Eastern North Southern West n Union regions Central Eastern Northern Southern Western World Source: United Nations, Department of Economic and Social Affairs, Population Division, World Urbanization Prospects: The 214 Revision, United Nations, New York,
66 UNICEF/RWAA /Noorani
67 UNICEF Division of Data, Research, and Policy 3 United Nations Plaza New York, NY 117, USA
68 AFRICA Generation 23 UNICEF Division of Data, Research, and Policy August 214 ISBN:
Progress and prospects
 Ending CHILD MARRIAGE Progress and prospects UNICEF/BANA213-182/Kiron The current situation Worldwide, more than 7 million women alive today were married before their 18th birthday. More than one in three
A Snapshot of Drinking Water and Sanitation in Africa 2012 Update
 A Snapshot of Drinking Water and Sanitation in 1 Update A regional perspective based on new data from the WHO/UNICEF Joint Monitoring Programme for Water Supply and Sanitation UNICEF/NYHQ8-46/Harneis,
DEFINITION OF THE CHILD: THE INTERNATIONAL/REGIONAL LEGAL FRAMEWORK. The African Charter on the Rights and Welfare of the Child, 1990
 DEFINITION OF THE CHILD: THE INTERNATIONAL/REGIONAL LEGAL FRAMEWORK Article 2: Definition of a Child The African Charter on the Rights and Welfare of the Child, 1990 For tile purposes of this Charter.
AIO Life Seminar Abidjan - Côte d Ivoire
 AIO Life Seminar Abidjan - Côte d Ivoire Life Insurance Market Survey of Selected African Countries Bertus Thomas Africa Committee of the Actuarial Society of South Africa Agenda SECTION 1 SURVEY OBJECTIVE
DEMOGRAPHIC AND SOCIOECONOMIC DETERMINANTS OF SCHOOL ATTENDANCE: AN ANALYSIS OF HOUSEHOLD SURVEY DATA
 BACKGROUND PAPER FOR FIXING THE BROKEN PROMISE OF EDUCATION FOR ALL DEMOGRAPHIC AND SOCIOECONOMIC DETERMINANTS OF SCHOOL ATTENDANCE: AN ANALYSIS OF HOUSEHOLD SURVEY DATA By Hiroyuki Hattori, UNICEF This
UNAIDS 2013 AIDS by the numbers
 UNAIDS 2013 AIDS by the numbers 33 % decrease in new HIV infections since 2001 29 % decrease in AIDS-related deaths (adults and children) since 2005 52 % decrease in new HIV infections in children since
Ensuring access: health insurance schemes and HIV
 Ensuring access: health insurance schemes and HIV Joep M.A. Lange Academic Medical Center, University of Amsterdam Amsterdam Institute for Global Health & Development With great help from: Onno Schellekens
The Africa Infrastructure
 AIDI May 2016 www.afdb.org Chief Economist Complex Table of Contents 1. Introduction and Background 1. Introduction and Background 2. The AIDI 2016 Highlights 3. Main Results 4. Conclusions References
country profiles WHO regions
 country profiles WHO regions AFR AMR EMR EUR SEAR WPR Algeria Total population: 37 63 aged years and older (+): 73% in urban areas: 66% Income group (World Bank): Upper middle income 196 196 197 197 198
Manufacturing & Reproducing Magnetic & Optical Media Africa Report
 Brochure More information from http://www.researchandmarkets.com/reports/3520587/ Manufacturing & Reproducing Magnetic & Optical Media Africa Report Description: MANUFACTURING & REPRODUCING MAGNETIC &
WHO Global Health Expenditure Atlas
 WHO Global Health Expenditure Atlas September 214 WHO Library Cataloguing-in-Publication Data WHO global health expenditure atlas. 1.Health expenditures statistics and numerical data. 2.Health systems
Social protection and poverty reduction
 Social protection and poverty reduction Despite the positive economic growth path projected for Africa, the possibility of further global shocks coupled with persistent risks for households make proactive
Libreville Declaration on Health and Environment in Africa
 Libreville Declaration on Health and Environment in Africa Libreville, 29 August 2008 REPUBLIQUE GABONAISE World Health Organization Regional Office for Africa Libreville Declaration on Health and Environment
THE STATE OF MOBILE ADVERTISING
 AFRICA THE STATE OF MOBILE ADVERTISING Africa is a land of contrasts. It is the world s second-largest continent (after Asia), and home to the second-largest population yet it only outpaces Antarctica
Goal 6: Combat HIV, AIDS, malaria, and other major diseases
 The adolescent birth rate is highest in Niger, Chad, Mali, and Mozambique, which are among the poorest countries on the continent. In these countries early marriage is common and the proportion of girls
PRESS RELEASE WORLD POPULATION TO EXCEED 9 BILLION BY 2050:
 PRESS RELEASE Embargoed until 12:00 PM, 11 March, 2009 WORLD POPULATION TO EXCEED 9 BILLION BY 2050: Developing Countries to Add 2.3 Billion Inhabitants with 1.1 Billion Aged Over 60 and 1.2 Billion of
People and Demography
 PART 1The setting PART 1 People and Demography The population of all Africa was estimated at 802.5 million people in 2000 and it rose to 1 010.3 million inhabitants in 2010, which means an average annual
Financing Education for All in Sub Saharan Africa: Progress and Prospects
 Financing Education for All in Sub Saharan Africa: Progress and Prospects Albert Motivans Education for All Working Group Paris, 3 February 211 1 Improving the coverage and quality of education finance
United Nations Development Programme United Nations Institute for Training and Research
 UNDP RBA and UNITAR supporting the strategic development priorities of Africa As we approach the New Year, it is important to reflect on what has been achieved. Throughout 011, UNITAR has worked in close
Corporate Overview Creating Business Advantage
 Corporate Overview Creating Business Advantage 14 April 2013 Agenda The power of the group Our achievements Quick facts African regulatory environment Portfolio of offerings Creating value in Africa African
Global Demographic Trends and their Implications for Employment
 Global Demographic Trends and their Implications for Employment BACKGROUND RESEARCH PAPER David Lam and Murray Leibbrandt Submitted to the High Level Panel on the Post-2015 Development Agenda This paper
Pensions Core Course Mark Dorfman The World Bank. March 7, 2014
 PENSION PATTERNS & REFORM CHALLENGES IN SUB-SAHARAN AFRICA Pensions Core Course Mark Dorfman The World Bank Slide 1 Organization 1. Design summary 2. Challenges 3. Design reform principles 4. A process
THE ROLE OF BIG DATA/ MOBILE PHONE DATA IN DESIGNING PRODUCTS TO PROMOTE FINANCIAL INCLUSION
 THE ROLE OF BIG DATA/ MOBILE PHONE DATA IN DESIGNING PRODUCTS TO PROMOTE FINANCIAL INCLUSION Joseph Nketsiah GM, Risk Management Division, HFC BANK www.hfcbank.com.gh 1 Using customer data for marketing
In 2003, African heads of state made a commitment to
 Issue Note November 213 No. 22 Trends in Public Agricultural Expenditures in Africa Samuel Benin and Bingxin Yu 1 In 23, African heads of state made a commitment to invest percent of their total national
Eligibility List 2015
 The Global Fund adopted an allocation-based approach for funding programs against HIV/AIDS, TB and malaria in 2013. The Global Fund policy states that countries can receive allocation only if their components
UNFCCC initiatives: CDM and DNA Help Desks, the CDM Loan Scheme, Regional Collaboration Centres
 UNFCCC initiatives: CDM and DNA Help Desks, the CDM Loan Scheme, Regional Collaboration Centres Africa Carbon Forum 03 July 2013 - Abidjan, Côte d Ivoire Ms. Flordeliza Andres Programme Officer, UNFCCC
A Snapshot of Drinking Water and Sanitation in Africa A regional perspective based on new data from the WHO/UNICEF Joint Monitoring Programme for
 A Snapshot of Drinking Water and Sanitation in A regional perspective based on new data from the WHO/UNICEF Joint Monitoring Programme for Water Supply and Sanitation Prepared for AMCOM as a contribution
EARLY MARRIAGE A HARMFUL TRADITIONAL PRACTICE A STATISTICAL EXPLORATION
 EARLY MARRIAGE A HARMFUL TRADITIONAL PRACTICE A STATISTICAL EXPLORATION EARLY MARRIAGE A HARMFUL TRADITIONAL PRACTICE A STATISTICAL EXPLORATION CONTENTS I. INTRODUCTION......................................................1
Proforma Cost for international UN Volunteers for UN Partner Agencies for 2016. International UN Volunteers (12 months)
") Proforma Cost for international UN Volunteers for UN Partner Agencies for 2016 Country Of Assignment International UN Volunteers (12 months) International UN Youth Volunteers (12 months) University Volunteers
Proforma Cost for international UN Volunteers for UN Partner Agencies for 2016 Country Of Assignment International UN Volunteers (12 months) International UN Youth Volunteers (12 months) University Volunteers
Global Fuel Economy Initiative Africa Auto Club Event Discussion and Background Paper Venue TBA. Draft not for circulation
 Global Fuel Economy Initiative Africa Auto Club Event Discussion and Background Paper Venue TBA Draft not for circulation Launched on March 4, 2009 by the United Nations Environment Programme (UNEP), the
Quote Reference. Underwriting Terms. Premium Currency USD. Payment Frequency. Quotation Validity BUPA AFRICA PROPOSAL.
 Quote Reference Family Quote 2013 Underwriting Terms BUPA AFRICA PROPOSAL Full Medical Underwriting and/or Continuous PreviousMedical Exclusions Premium Currency USD Payment Frequency One annual payment
The African Union Education Outlook Report: Early Childhood Development: A Continental Perspective
 The African Union Education Outlook Report: Early Childhood Development: A Continental Perspective Early childhood is defined as the period from birth to eight years old. This early period is considered
Table 5: HIV/AIDS statistics for Africa (excluding North Africa), 2001 and 2009
, 2001 and 2009") Table 5: HIV/AIDS statistics for Africa (excluding North Africa), 2001 and 2009 Year People living with HIV (million) People newly infected with HIV (million) Children living with HIV (million) AIDS-related
Table 5: HIV/AIDS statistics for Africa (excluding North Africa), 2001 and 2009 Year People living with HIV (million) People newly infected with HIV (million) Children living with HIV (million) AIDS-related
Doing Business 2015 Fact Sheet: Sub-Saharan Africa
 Doing Business 2015 Fact Sheet: Sub-Saharan Africa Thirty-five of 47 economies in Sub-Saharan Africa implemented at least one regulatory reform making it easier to do business in the year from June 1,
EXPLORER HEALTH PLAN. Product Summary From 1 September 2013. bupa-intl.com. Insured by Working with Brokered by
 EXPLORER HEALTH PLAN Product Summary From 1 September 2013 bupa-intl.com Insured by Working with Brokered by ABOUT BUPA AND JUBILEE ABOUT ABOUT BUPA BUPA, AND JUBILEE AND JUBILEE JUBILEE AND JWS GLOBAL
Summary of GAVI Alliance Investments in Immunization Coverage Data Quality
 Summary of GAVI Alliance Investments in Immunization Coverage Data Quality The GAVI Alliance strategy and business plan for 2013-2014 includes a range of activities related to the assessment and improvement
BADEA EXPORT FINANCING SCHEME (BEFS) GUIDELINES
 GUIDELINES") BADEA EXPORT FINANCING SCHEME (BEFS) GUIDELINES 1 P.O. Box 5925 Jeddah 21432 Kingdom of Saudi Arabia Telephone: 636 1400 Telex: 601137-601407 ISDB SJ Facsimile: 636 6871 Jeddah (IDB) Facsimile: 637 1064
BADEA EXPORT FINANCING SCHEME (BEFS) GUIDELINES 1 P.O. Box 5925 Jeddah 21432 Kingdom of Saudi Arabia Telephone: 636 1400 Telex: 601137-601407 ISDB SJ Facsimile: 636 6871 Jeddah (IDB) Facsimile: 637 1064
African Elephant (Loxondonta africana)
") African Elephant (Loxondonta africana) Further Details on Data Used for the Global Assessment For the 2004 assessment, current generation data were obtained from the African Elephant Status Report 2002
African Elephant (Loxondonta africana) Further Details on Data Used for the Global Assessment For the 2004 assessment, current generation data were obtained from the African Elephant Status Report 2002
The Effective Vaccine Management Initiative Past, Present and Future
 EVM setting a standard for the vaccine supply chain The Effective Vaccine Management Initiative Past, Present and Future Paul Colrain TechNet meeting Dakar, Senegal, February 2013 February 2013 TechNet
A TEACHER FOR EVERY CHILD: Projecting Global Teacher Needs from 2015 to 2030
 A TEACHER FOR EVERY CHILD: Projecting Global Teacher Needs from 2015 to 2030 UIS FACT SHEET OCTOBER 2013, No.27 According to new global projections from the UNESCO Institute for Statistics, chronic shortages
Goal 6: Combat HIV/AIDS, malaria and other diseases
 Goal 6: Combat HIV/AIDS, malaria and other diseases Africa s progress in the fight against HIV/AIDS, TB and malaria is being sustained even stepped up. This is noteworthy as there are worrying signs of
How To Calculate The Cost Of A Road Accident In Africa
 ND CA EVELOPMEN T S ND PP FO AF RIC F EM ENT AF RI A LO D UN BANQ UE INE DE DEVE EN T EM PP A IC FR LO AIN DE DEVE Market Brief Statistics Department, June 2013, AfDB Chief Economist Complex www.afdb.org
Countries Ranked by Per Capita Income A. IBRD Only 1 Category iv (over $7,185)
") Page 1 of 5 Note: This OP 3.10, Annex C replaces the version dated September 2013. The revised terms are effective for all loans that are approved on or after July 1, 2014. Countries Ranked by Per Capita
Page 1 of 5 Note: This OP 3.10, Annex C replaces the version dated September 2013. The revised terms are effective for all loans that are approved on or after July 1, 2014. Countries Ranked by Per Capita
The next step in African development: Aid, investment, or another round of debt? Michael Nicholson * Sarah Lane **
 The next step in African development: Aid, investment, or another round of debt? Michael Nicholson * Sarah Lane ** U.S. Agency for International Development November 2012 Abstract Amidst intense debt relief,
Assessing Progress in Africa toward the Millennium Development Goals, 2011
 North Africa, on the other hand, has made the greatest progress by improving the lives of 8.7 million, or 34.9 percent, slum dwellers (UN-Habitat, 2010). At the country level, the trend shows that of the
Abortion Policies and Reproductive Health around the World United Nations
 Abortion Policies and Reproductive Health around the World United Nations Department of Economic and Social Affairs Population Division DESA The Department of Economic and Social Affairs of the United
Education is the key to lasting development
 Education is the key to lasting development As world leaders prepare to meet in New York later this month to discuss progress on the Millennium Development Goals, UNESCO s Education for All Global Monitoring
PRIORITY AREAS FOR SOCIAL DEVELOPMENT PERSPECTIVES FROM AFRICA EUNICE G. KAMWENDO UNDP REGIONAL BUREAU FOR AFRICA
 PRIORITY AREAS FOR SOCIAL DEVELOPMENT PERSPECTIVES FROM AFRICA EUNICE G. KAMWENDO UNDP REGIONAL BUREAU FOR AFRICA Outline Reflections on social Development in Africa along the following 4 pillars: Growth
FAO E-learning Center
 FAO E-learning Center FAO, Partnerships Advocacy and Capacity Development Division Cristina Petracchi Elearning Team Leader Rome, 23 March, 2016 The FAO E-learning Center Education for all Anytime Anywhere
Africa-China trading relationship
 -China trading relationship tralac has been monitoring the trading relationship between and China for several years. This brief provides a synopsis of the latest -China trade data and an evaluation of
Human Rights and Governance: The Empirical Challenge. Daniel Kaufmann World Bank Institute. www.worldbank.org/wbi/governance/
 Human Rights and Governance: The Empirical Challenge Daniel Kaufmann World Bank Institute www.worldbank.org/wbi/governance/ Presentation at Human Rights and Development: Towards Mutual Reinforcement Conference,
Distance to frontier
 Doing Business 2013 Fact Sheet: Sub-Saharan Africa Of the 50 economies making the most improvement in business regulation for domestic firms since 2005, 17 are in Sub-Saharan Africa. From June 2011 to
World Population to reach 10 billion by 2100 if Fertility in all Countries Converges to Replacement Level
 UNITED NATIONS PRESS RELEASE EMBARGOED UNTIL 3 MAY 2011, 11:00 A.M., NEW YORK TIME World Population to reach 10 billion by if Fertility in all Countries Converges to Replacement Level UNITED NATIONS, 3
Re/insurance in sub- Saharan Africa. Gearing up for strong growth Dr. Kurt Karl, Head of Economic Research & Consulting, Swiss Re
 Re/insurance in sub- Saharan Africa Gearing up for strong growth Dr. Kurt Karl, Head of Economic Research & Consulting, Swiss Re Agenda Macroeconomic environment and outlook Insurance market development
KIGALI DECLARATION ON THE DEVELOPMENT OF AN EQUITABLE INFORMATION SOCIETY IN AFRICA
 KIGALI DECLARATION ON THE DEVELOPMENT OF AN EQUITABLE INFORMATION SOCIETY IN AFRICA We, the Representatives of the African Parliaments to the Kigali International Conference Recalling the commitment of
www.pwc.ie Africa Business Forum December 2014
 www.pwc.ie Africa Business Forum December 2014 Welcome Colm O Callaghan Director, Ireland Africa Business Forum December 2014 2 Agenda Speaker Topic Colm O Callaghan, Ireland Welcome address Tim Morgan,
How Universal is Access to Reproductive Health?
 How Universal is Access to Reproductive Health? A review of the evidence Cover Copyright UNFPA 2010 September 2010 Publication available at: http://www.unfpa.org/public/home/publications/pid/6526 The designations
THE RIGHTS START TO LIFE
 THE RIGHTS START TO LIFE A STATISTICAL ANALYSIS OF BIRTH REGISTRATION THE RIGHTS START TO LIFE CONTENTS I. INTRODUCTION..................................................... 1 II. GLOBAL ASSESSMENT..............................................
FINDINGS FROM AFROBAROMETER ROUND 5 SURVEY DEMOCRATIC ATTITUDES/BELIEFS, CITIZENSHIP & CIVIC RESPONSIBILITIES
 FINDINGS FROM AFROBAROMETER ROUND 5 SURVEY DEMOCRATIC ATTITUDES/BELIEFS, CITIZENSHIP & CIVIC RESPONSIBILITIES th JULY, 13 What is the Afrobarometer? The Afrobarometer (AB) is a comparative series of public
Action required The Committee is requested to take note of the position of 2010 11 income and expenditure as of 30 September 2010.
 INTERNATIONAL LABOUR OFFICE Governing Body 309th Session, Geneva, November 2010 Programme, Financial and Administrative Committee GB.309/PFA/1 PFA FOR INFORMATION FIRST ITEM ON THE AGENDA Programme and
Appendix A. Crisis Indicators and Infrastructure Lending
 Appendix A. Crisis Indicators and Infrastructure Lending APPENDIX A Table A.1. Crisis Indicators (Case Study Countries) Country % as Share of GDP Share of in Bank Crisis Severity Score (principal factor
Human Resources for Health Why we need to act now
 Human Resources for Health Why we need to act now Progress towards the MDGs, particularly in Africa is slow, or even stagnating. Poor people cannot access basic services for want of doctors, nurses and
A HISTORY OF THE HIV/AIDS EPIDEMIC WITH EMPHASIS ON AFRICA *
 UN/POP/MORT/2003/2 5 September 2003 ENGLISH ONLY WORKSHOP ON HIV/AIDS AND ADULT MORTALITY IN DEVELOPING COUNTRIES Population Division Department of Economic and Social Affairs United Nations Secretariat
BRIEFING NOTE 1 THE LANDSCAPE OF MICROINSURANCE IN AFRICA. 1. Counting the microinsured in Africa. 2. So how many are covered by microinsurance?
 BRIEFING NOTE 1 Microinsurance Innovation Facility THE LANDSCAPE OF MICROINSURANCE IN AFRICA 1. Counting the microinsured in Africa In various forms microinsurance has been available to some low-income
Sending Money Home to Africa
 Enabling poor rural people to overcome poverty Sending Money Home to Africa Remittance markets, enabling environment and prospects Introduction For centuries people have crossed borders seeking better
HIV/AIDS IN SUB-SAHARAN AFRICA: THE GROWING EPIDEMIC?
 HIV/AIDS IN SUB-SAHARAN AFRICA: THE GROWING EPIDEMIC? Paul Bennell 1 It is widely believed that the AIDS epidemic continues to spread rapidly throughout the African continent with rising levels of HIV
HOSPITALITY AND LEISURE IN the MIDDLE EAST AND AFRICA
 HOSPITALITY AND LEISURE IN the MIDDLE EAST AND AFRICA Doing business in the region offers unique opportunities and challenges, and with this comes a need to understand the cultural, economic and political
This note provides additional information to understand the Debt Relief statistics reported in the GPEX Tables.
 Technical Note 3 Debt Relief This note provides additional information to understand the Debt Relief statistics reported in the GPEX Tables. Introduction 1. Debt is a major development issue. There is
Fiscal Space & Public Expenditure on the Social Sectors
 Briefing Paper Strengthening Social Protection for Children inequality reduction of poverty social protection February 2009 reaching the MDGs strategy security social exclusion Social Policies social protection
PROCEEDINGS KIGALI 3-4 NOVEMBRE,
 PROCEEDINGS KIGALI 3-4 NOVEMBRE, 2005 The 7 th Conference of Ministers Responsible for Animal Resources was held in the conference room of Intercontinental hotel - Kigali (Rwanda) from 3 rd to 4 th November
Empowering African Women: An Agenda for Action
 Empowering African Women: An Agenda for Action AFRICA GENDER EQUALITY INDEX 2015 Empowering African Women: An Agenda for Action AFRICA GENDER EQUALITY INDEX 2015 ACKNOWLEDGMENT The Africa Gender Equality
UNHCR, United Nations High Commissioner for Refugees
 Belgium 22 Jul 1953 r 08 Apr 1969 a Belize 27 Jun 1990 a 27 Jun 1990 a Benin 04 Apr 1962 s 06 Jul 1970 a Bolivia 09 Feb 1982 a 09 Feb 1982 a Bosnia and Herzegovina 01 Sep 1993 s 01 Sep 1993 s Botswana
Child Marriages: 39,000 Every Day
 Embargo: Hold for release until noon EST, Thursday 7 March 2013 Too Young to Wed Panel on Thursday 7 March, 2:30-4:30 p.m. Dag Hammarskjold Library Auditorium, United Nations Headquarters, New York Please
Guidelines for DBA Coverage for Direct and Host Country Contracts
 Guidelines for DBA Coverage for Direct and Host Country Contracts An Additional Help document for ADS Chapter 302 New Reference: 06/14/2007 Responsible Office: OAA/P File Name: 302sap_061407_cd48 BACKGROUND:
The Education for All Fast Track Initiative
 The Education for All Fast Track Initiative Desmond Bermingham Introduction The Education for All Fast Track Initiative (FTI) is a global partnership to help low income countries to achieve the education
Watermarks: Indicators of Irrigation Sector Performance in Africa
 BACKGROUND PAPER 4 (PHASE II) Watermarks: Indicators of Irrigation Sector Performance in Africa SUMMARY Mark Svendsen, Mandy Ewing, and Siwa Msangi International Food Policy Research Institute DECEMBER
HOTEL CHAIN DEVELOPMENT PIPELINES IN AFRICA, 2014
 W HOSPITALITY GROUP Plot 10, Babatunde Crescent Off Oniru Market Road Lekki Phase 1 Lagos, Nigeria Tel: +234 (0) 1 791 4165 www.w-hospitalitygroup.com HOTEL CHAIN DEVELOPMENT PIPELINES IN AFRICA, 2014
MDRI HIPC. heavily indebted poor countries initiative. To provide additional support to HIPCs to reach the MDGs.
 Goal To ensure deep, broad and fast debt relief and thereby contribute toward growth, poverty reduction, and debt sustainability in the poorest, most heavily indebted countries. HIPC heavily indebted poor
Figure 1.1 The Parade of World Income. Copyright 2005 Pearson Addison-Wesley. All rights reserved. 1-1
 Figure 1.1 The Parade of World Income Copyright 2005 Pearson Addison-Wesley. All rights reserved. 1-1 Copyright 2005 Pearson Addison-Wesley. All rights reserved. 1-2 Growth and Development: The Questions
States Parties to the 1951 Convention relating to the Status of Refugees and the 1967 Protocol
 States Parties to the 1951 Convention relating to the Status of Refugees and the 1967 Protocol Date of entry into force: 22 April 1954 (Convention) 4 October 1967 (Protocol) As of 1 October 2008 Total
MINIMUM AGE OF MARRIAGE IN AFRICA
 MINIMUM AGE OF MARRIAGE IN AFRICA Algeria Angola 19 years Family Code, 2005 Article 7: A marriage is deemed valid if both the male and female are 19 years of age. However, the judge may grant an exemption
MEMORANDUM OF UNDERSTANDING
 MEMORANDUM OF UNDERSTANDING between CAFRAD (African Training and Research Centre in Administration for Development) and EUCLID (Euclid University) in connection with Cooperation to further their mutual
OFFICIAL NAMES OF THE UNITED NATIONS MEMBERSHIP
 OFFICIAL NAMES OF THE UNITED NATIONS MEMBERSHIP Islamic Republic of Afghanistan Republic of Albania People s Democratic Republic of Algeria Principality of Andorra Republic of Angola Antigua and Barbuda
UIS INFORMATION PAPER JUNE 2013. ADULT AND YOUTH LITERACY National, regional and global trends, 1985-2015
 UIS INFORMATION PAPER JUNE 213 ADULT AND YOUTH LITERACY National, regional and global trends, 1985-215 UNESCO The constitution of the United Nations Educational, Scientific and Cultural Organization (UNESCO)
Teen Pregnancy in Sub-Saharan Africa: The Application of Social Disorganisation Theory
 Teen Pregnancy in Sub-Saharan Africa: The Application of Social Disorganisation Theory Extended Abstract Population Association of America 2015 Annual Meeting-April 30-May 2, San Diego,CA Sibusiso Mkwananzi*