NOAA Technical Memorandum NWS SR-132 THREE INITIAL CUMATOLOGICAL STUDIES FOR WFO MELBOURNE, FLORIDA: A FIRST STEP IN
|
|
|
- Verity Crawford
- 10 years ago
- Views:
Transcription
1 NOAA Technical Memorandum NWS SR-132 THREE INITIAL CUMATOLOGICAL STUDIES FOR WFO MELBOURNE, FLORIDA: A FIRST STEP IN THE PREPARATION FOR FUTURE OPERATIONS Gary K. Schmocker David W. Sharp Bartlett C. Hagemeyer National Weather Service Office Melbourne, Florida Scientific Services Southern Region Fort Worth, Texas October 1990 UNITED STATiS Nm-I Oceaaie add AtmoqJberic A.dm.iaiItratio NatioDaI Weather Serrice DEPARTMENT OF COMMERCE JoIIaA.~ mbert W. FtiIt.)' Robert A. MosIwJw. Setntuy u.- 8etretarJ..'AdmiDiItraior AMiIWd AduUoistrator

2 NOAA Technical Memorandum NWS SR-132 THREE INITIAL CLIMATOLOGICAL STUDIES FOR WFO MELBOURNE, FLORIDA: A FIRST STEP IN THE PREPARATION FOR FUTURE OPERATIONS Gary K. Schmocker David W. Sharp Bartlett C. Hagemeyer National Weather Service Office Melbourne, Florida Scientific Services Southern Region Fort Worth, Texas October 1990 ABSTRACT A monthly climatology of temperature and precipitation for central Florida and a daily temperature climatology for Melbourne, Florida, were produced to aid in the preparation of routine forecasts at the new National Weather Service (NWS) Office in Melbourne. A detailed tornado climatology for the land area within 125 nm of Melbourne was also produced to assess risk and identify suitable forecast problems relating to severe weather for investigation. This information is part of a large body of meteorological knowledge forecasters will need for their new forecast and warning areas as the NWS undergoes a far reaching Modernization and Associated Restructuring (MAR) in the 1990's. The procedures and results presented are useful for forecasters in central Florida and instructive for other Weather Service Offices (WSOs) planning for the transition to a Weather Forecast Office (WFO) in the modernized NWS. 1. INTRODUCTION As the Modernization and Associated Restructuring (MAR) of the National Weather Service (NWS) progresses, fundamental changes in the way operations are carried out will take place (NOAA, 1990). In the case of future WFO Melbourne, Florida, a new Weather Service Office (WSO) was formed and staffed with professional forecasters who will eventually be responsible for issuing all forecasts and warnings in an area previously covered by several (WSOs). These offices have traditionally been primarily concerned with labor-intensive surface and/or radar data collection and dissemination, limited adaptive forecasts, and short-fused local warnings, based on a few empirical rules. The MAR of the NWS stresses the importance of understanding mesoscale processes and the need for more detailed forecasts and warnings by training a professional staff and exploiting the capabilities of modern systems. Its cornerstone is the deployment of high technology tools throughout the field for the first time, but a detailed knowledge of local and regional climatology and weather regimes in the context of larger scale influences will be essential to success. Forecasters must be prepared to use these tools and put science into the products they produce.

3 Figure 1. WFO Melbourne County warning area (CWA). The Melbourne office will evolve from a WSO to a NEXRAD WSO (NWSO), and ultimately to a WFO. Figure 1 shows future WFO Melbourne's County warning area (CWA) consisting of ten counties in east central Florida, and Figure 2 shows the future forecast zones (41-45). Figure 2. WFO Melbourne Forecast Zones.
.")
4 Except for the formation of an entirely new office, Melbourne's transition will be representative of most other WSOs scheduled to become WFOs. Unlike the WSFO, where much of the professional development activities have been concentrated and where a collection of knowledge about forecast problems and procedures is often accumulated over the years, most WSOs have little historical meteorological information on the scale needed to address problems in their future WFO areas of responsibility. In the case of Melbourne, there was virtually no information; and the transition to full WFO status would be greatly aided by a fundamental understanding of weather types affecting our area. This process should not be left to chance, but planned in an orderly fashion well in advance. Hebert (1989) outlined much of the operational planning (i.e., training) necessary to prepare future office staffs to fulfill future service goals. For Florida, Hebert compiled a comprehensive list of information on weather regimes and climatology that forecasters should have for their CWA. Melbourne and other WSOs could benefit by beginning an orderly and complete meteorological assessment of their future forecast areas. This fundamental understanding can then serve as a jumping-off point when the new technology arrives, a sort of foundation of meteorological knowledge that can be built upon. As MAR progresses, professional staffing and activities will increase; and many meteorologists will have to become familiar with new areas and learn new techniques and systems at the same time. The necessary training and fundamental knowledge required to face future responsibilities, and do them well, is considerable. Ideally, an office would like to have complete, detailed information on all forecast problems; but this takes time. At Melbourne we have completed three priority problems first and will tackle other problems in the near future. Most important was to gain a fundamental knowledge of the temporal evolution of normal temperature and precipitation regimes for the forecast area. When starting a brand new forecast office with new forecasters, this is the most fundamental data needed for day-to-day operations. To accomplish this, an annual and monthly temperature and precipitation climatology for the central Florida peninsula surrounding Melbourne was completed. Additionally, since Melbourne is a new station making a new local forecast for an area where model output statistics (MOS) presently are not available, daily climatological maximum and minimum temperature guidance was produced for Melbourne from cooperative observation station data as an aid for the forecaster. Finally, to assess one of the most significant weather hazards first, a detailed tornado climatology for the land area within 125 nm of Melbourne was completed, and the need for further specific severe weather studies was determined. These three climatological studies are presented in the following sections. The results are specifically useful for forecasters at Melbourne and surrounding stations, and may be instructive for other WSOs that will evolve to WFOs. 2. MONTHLY AND ANNUAL TEMPERATURE AND PRECIPITATION CLIMATOLOGY A detailed regional climatology is desirable for learning about a new forecast area and preparing detailed, accurate forecasts. A first and fundamental step is the preparation of analyses of monthly and annual normals of precipitation and maximum and minimum temperatures to aid in the identification and understanding of forecast problems peculiar to the CWA.

5 a. Data and Analysis Normals of monthly and annual precipitation, and maximum and minimum temperatures for were obtained from Climatological Data for Florida published by the National Climatic Data Center (NCDC). For central Florida 55 stations with precipitation data and 46 with temperature data are included. An analysis grid was laid out over central Florida to maximize coverage of observations and minimize the inclusion of water areas with no data points at the edges of the grid. The grid space and geographic background map with climatological station locations is shown as Figure 3. (Squares, with elevation in feet above mean sea level to the right, indicate station location; the Melbourne CWA is enclosed by a heavy dark line). Fig. 3 Coop Station Database and Elevation (ft) Stations in coastal counties are dense enough to be representative in the Melbourne CWA, but a significant data-sparse region is found between Orlando and northern Lake Okeechobee. However, data are now available from two stations in Okeechobee County (Fort Drum 5NW and Okeechobee Hurricane Gate #6, marked by bold "X's" on Fig. 3). It is likely these stations will be included in new normals. In any case, the lack of interior stations in some areas indicates a weakness in the current climatological network. This illustrates a need to continue to recruit observers as the MAR of the NWS progresses, and the need for verification of detailed zone forecasts becomes more important. Unfortunately, the deployment of the Automated Surface Observation System (ASOS) in the 1990s will do little to alleviate this problem as the stations will be placed mainly along the coast and the heavily populated corridor from Daytona Beach to

6 the Orlando area. Despite poor resolution in some areas, and at times questionable observation procedures (Robinson, 1990), the data included in this study are the best available at the present time. The new normals for will be input into the program when available, and can be easily reanalyzed. Table 1 contains a list of all stations used in the analyses, along with their elevations and XY coordinates. Stations with precipitation data only are indicated by (P). The station coordinates along with their respective temperature and/or precipitation data were entered into computer data files for processing. Data analysis and map plotting were done with a commercial software package which used the "Krigging" method of optimal interpolation that takes advantage of regional variable theory (see Burrough, 1985, and Ripley, 1981). After the computer analyzed and contoured the data, the analyses were smoothed by hand where necessary due to poor data density. The analyses were finished by labeling the contours and noting the wettest (W) and driest (D) areas on the precipitation analysis, and the hottest (H) and coldest (C) areas on the temperature analyses. Table 1. Station List used in the analysis

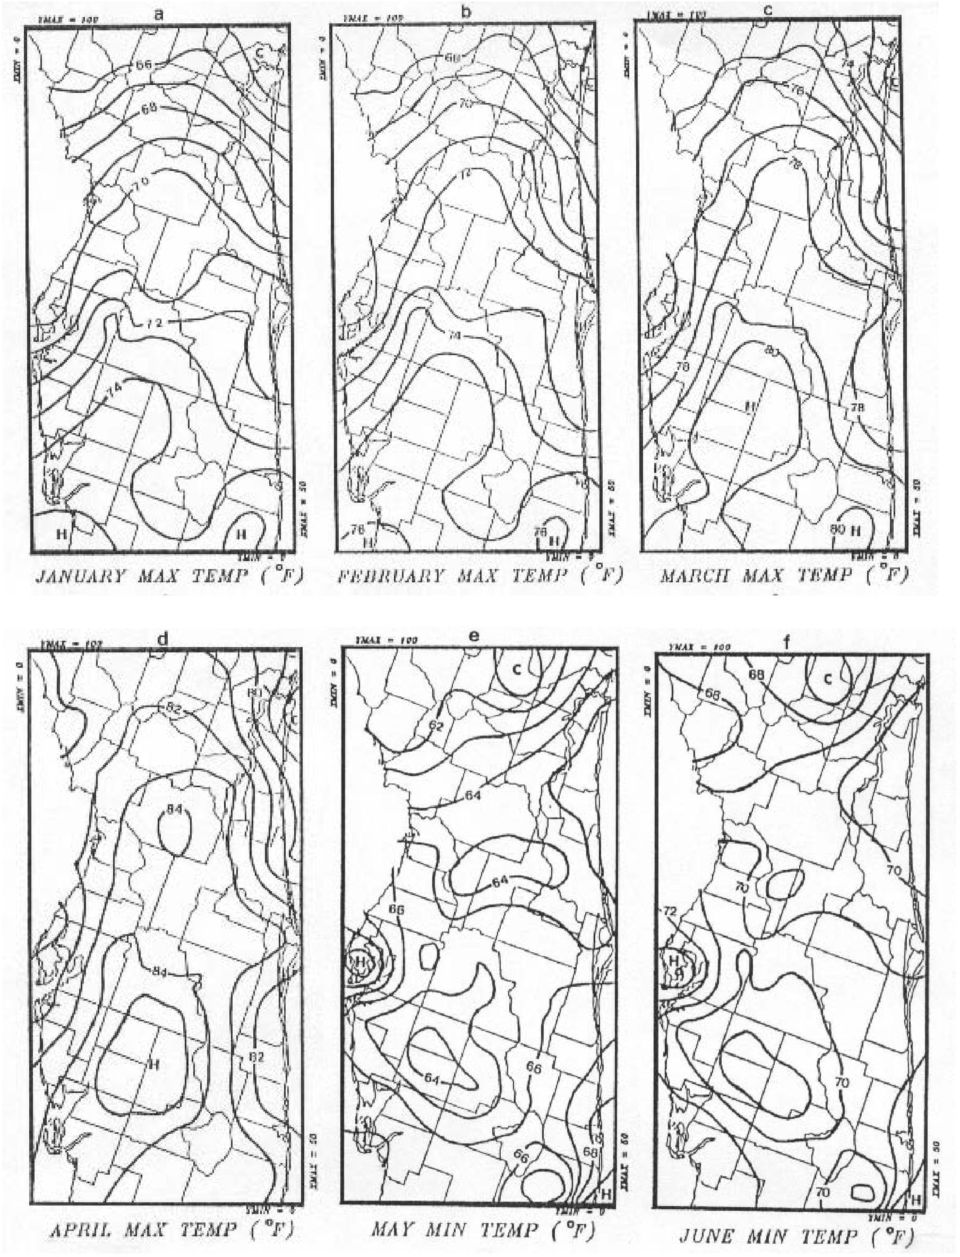
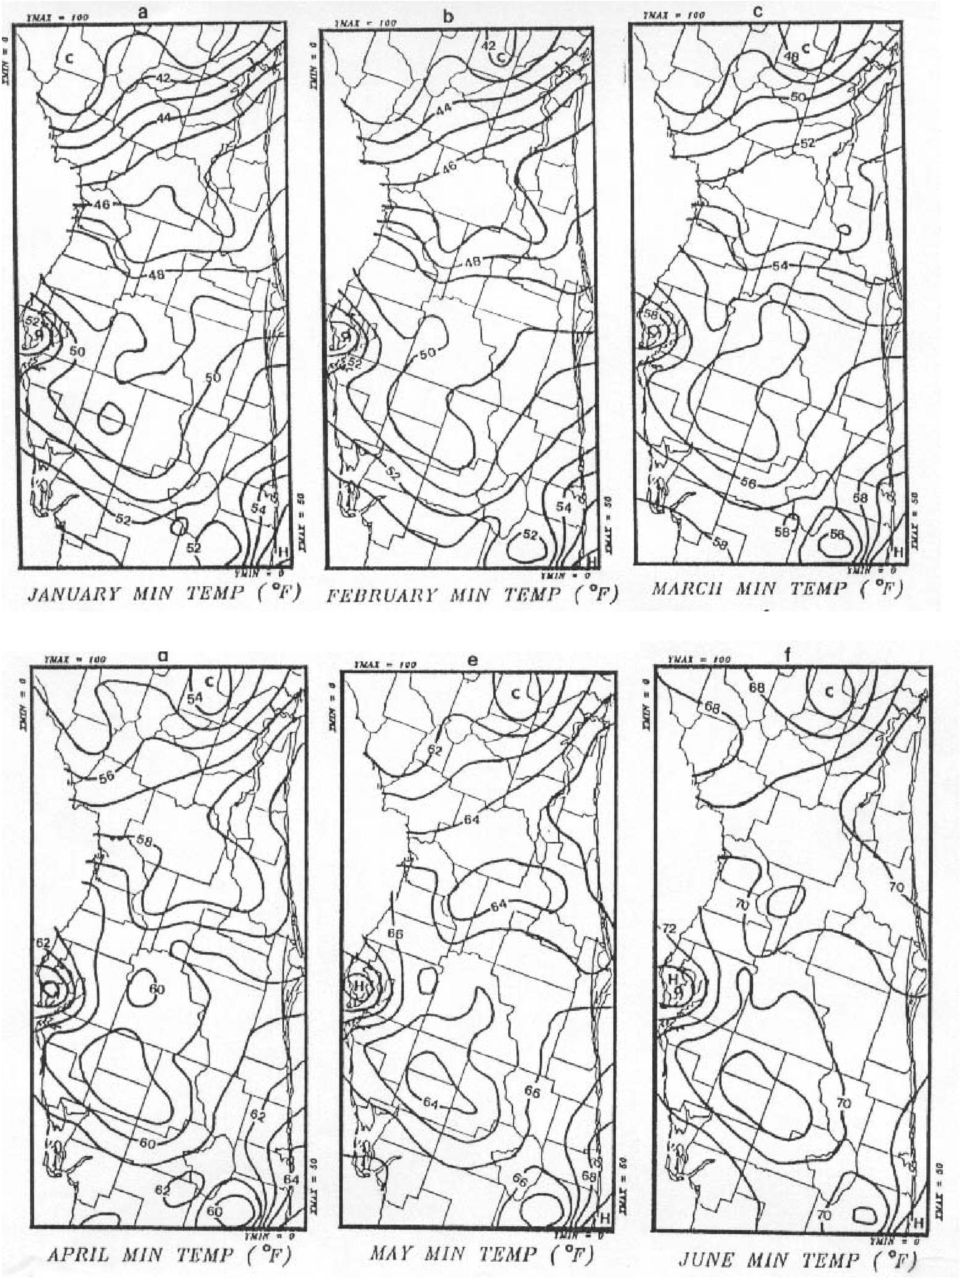
7 The analyses of annual mean minimum temperature, maximum temperature, and precipitation are shown as Figs. 4a-c respectively. Analyses of monthly mean precipitation, maximum temperature, and minimum temperature are shown as Figs. 5a-l, 6a-l, and 7a-l respectively. Brief discussion of these analyses are included in the following paragraphs. b. Discussion of Analyses The annual maximum and minimum temperature analyses (Figs. 4a - 4b) clearly show that the maximum and minimum temperatures are generally a function of both latitude and proximity to the coast. In general, minimum temperatures are cooler north and interior and warmer south and along the coast, while maximum temperatures are warmer south and interior and cooler north and along the coast. The annual precipitation analysis (Fig. 4c) shows no clearly defined spatial patterns, as it is a composite of changing monthly and/or seasonal regimes. In general, it is wettest north and south and driest in central sections. Fig. 4a Annual Min Temp Fig. 4b Annual Max Temp Fig. 4c Annual Precip
 clearly show that the maximum and minimum temperatures are generally a function of both latitude and proximity to the coast.")
8 (1) Precipitation Analyses of mean precipitation for January through December are shown as Figs. 5a-l. A general inspection of the data clearly shows two seasons (wet and dry) of approximately six months each. The months of May through October are the wettest months. The driest months are generally from November through April.

9 Except for November, the transition month between the wet and dry seasons, the dry season months are characterized by a general north/south gradient of precipitation with the wettest region in the northwest section and the driest region in the southwest. Precipitation in Melbourne's CWA averages 2 to 3 inches a month during this period. The northern section precipitation maxima are due to the southward movement of the tracks of mid-latitude cyclones and the most favorable upper level dynamics after November. Precipitation across central Florida during this time of the year is usually caused by cold frontal passages and prefrontal troughs that

10 occasionally penetrate that far south, but typically lose their strength as they do so. Surface lows usually track north of central Florida, as do upper level centers of vorticity maxima. April is a transition month between the dry and wet seasons and is peculiar in that it is drier than March or May. This is due to the decrease in mid-latitude systems affecting the area and the fact that a moist tropical maritime air mass is not yet in place, and significant sea breeze forcing has not yet begun. In the late spring and summer months of May through October, a significant change in the precipitation patterns is evident with larger magnitudes and gradients. The mid-latitude synoptic scale dynamic forcing mechanisms remain mainly north of this region, while mesoscale forcing mechanisms, such as the sea breeze and local circulations, become more significant in the favorable thermodynamic environment. Abundant low level moisture exists with instability greatest in the late afternoon as surface heating destabilizes the lower levels. The main forcing mechanisms which exist are low level convergence along sea/lake breeze fronts and thunderstorm outflow boundaries. Under generally easterly flow in June, July and August, the east coast sea breeze results in frequent afternoon thunderstorms inland while it is relatively drier along the east coast except around Cape Canaveral where northeast and southeast sea breezes can converge. There is a very distinct dry anomaly centered around Melbourne compared to stations inland and the Cape Canaveral area to the north that is most notable in August. Forecasters should take note that on a typical sea breeze day in easterly flow the chance of rain should be significantly higher over northern Brevard County and interior counties than for coastal areas south of Cape Canaveral. In July and August the west coast is wetter than interior areas due to west coast sea breeze activity, and earlier east coast sea breeze activity moving westward into the area and/or creating outflow boundaries which interact with the activity in the west. An abrupt change occurs after August as conditions become drier over the interior and west coast and wet on the east coast in September, October, and November. Isohyets are nearly parallel to the coast. This is probably due to a peak in disturbances in the easterlies and fall coastal heavy rains (Carlson, 1967), but the cause requires further investigation (2) Temperature Maximum Temperature Maps Figures 6a-l

11
12 Minimum Temperature Maps Figures 7a-l

13
14

15 Analyses of mean maximum and minimum temperatures for January through December are shown as Figs. 6a-1 and Figs. 7a-l respectively. In looking at the temperature analyses, two main climate controls are clearly evident. The first is the latitudinal variation of the solar insolation which creates a north to south temperature gradient. The second is continentality which produces a land/water temperature contrast or east to west temperature gradient across east central Florida and a west to east gradient in west central Florida. The Atlantic Ocean and the Gulf of Mexico moderate the temperatures at the coastal locations. In general, maximum temperatures are higher in interior and southern sections for all months and lower on the coasts. The greatest contrast in temperature between the coast and interior is found in May. In the Melbourne CWA there is a strong temperature gradient in the northern part of the CWA during November through May, while very weak gradients are found in July through October. The analyses show the warmest maximum and minimum temperatures are in July and August over central Florida. Minimum temperatures in the month of September are also fairly warm over east central Florida. The coldest maximum and minimum temperatures in central Florida occur in January. The months of March and April are basically a transition into the warmer months of summer, with the maximum temperature gradient decreasing and the north-south temperature gradient giving way to a land-water (east-west) temperature gradient in the Melbourne CWA. October and November are fall transition months, and gradients return from a mainly inland/coastal maximum temperature contrast to a north/south temperature contrast. Minimum temperatures are generally lower north and interior for all months, and a strong temperature gradient exists across northern sections from October through April. In the winter months the minimum temperature is mainly a function of latitude, with a thermal trough in the interior due to the Atlantic Ocean and Gulf of Mexico's moderating influence on coastal temperatures. In the summer months, the temperature gradient weakens, and the minimum temperature is about equally a function of both latitude and proximity to the coast. The coldest location is consistently in the extreme north section of the grid. From winter to summer the coldest location shifts from the northwest section to the northern interior. In the winter months continental polar air masses have undergone the least modification in this northwest section. An important realization a forecaster must draw from the analyses is the significant variation in the temperature and precipitation regimes due to the dominant climatic control of the interaction between the land the surrounding water, as well as the storm tracks of mid-latitude and tropical systems that affect the area. The new forecasters at Melbourne will need to study the monthly spatial patterns of temperature and precipitation to become familiar with the mesoscale forecasting complexities of this subtropical maritime climate and prepare detailed and accurate forecasts. One example of a practical application of the data would be to quantify the typical max/min temperature difference between Orlando and Daytona Beach (for which there is guidance) and Melbourne (for which there is not) and adjust the guidance accordingly. Another example would be to use the data as relative climatological guidance for the CWA (i.e., on a typical February day morning lows would range from the upper 40s at Daytona Beach to the low to mid 50s in Stuart and Ft. Pierce to the south). The major spatial and temporal patterns of rainfall and temperature have been briefly discussed; however, other smaller scale features will require further study with greater data density. These

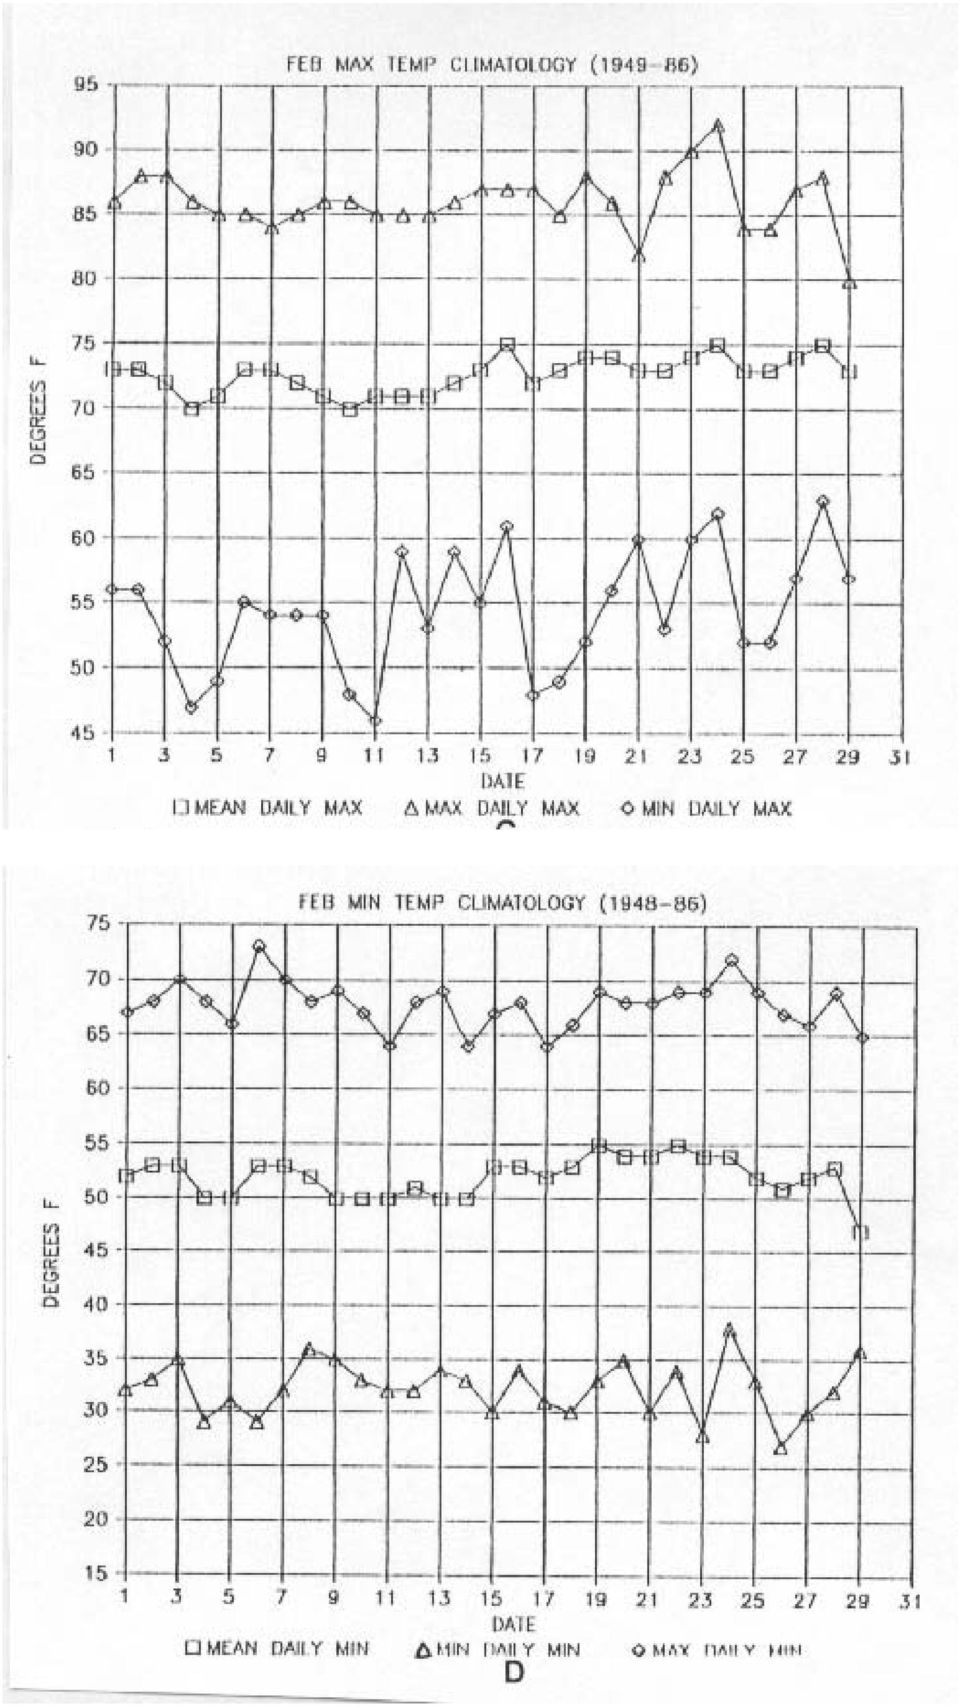
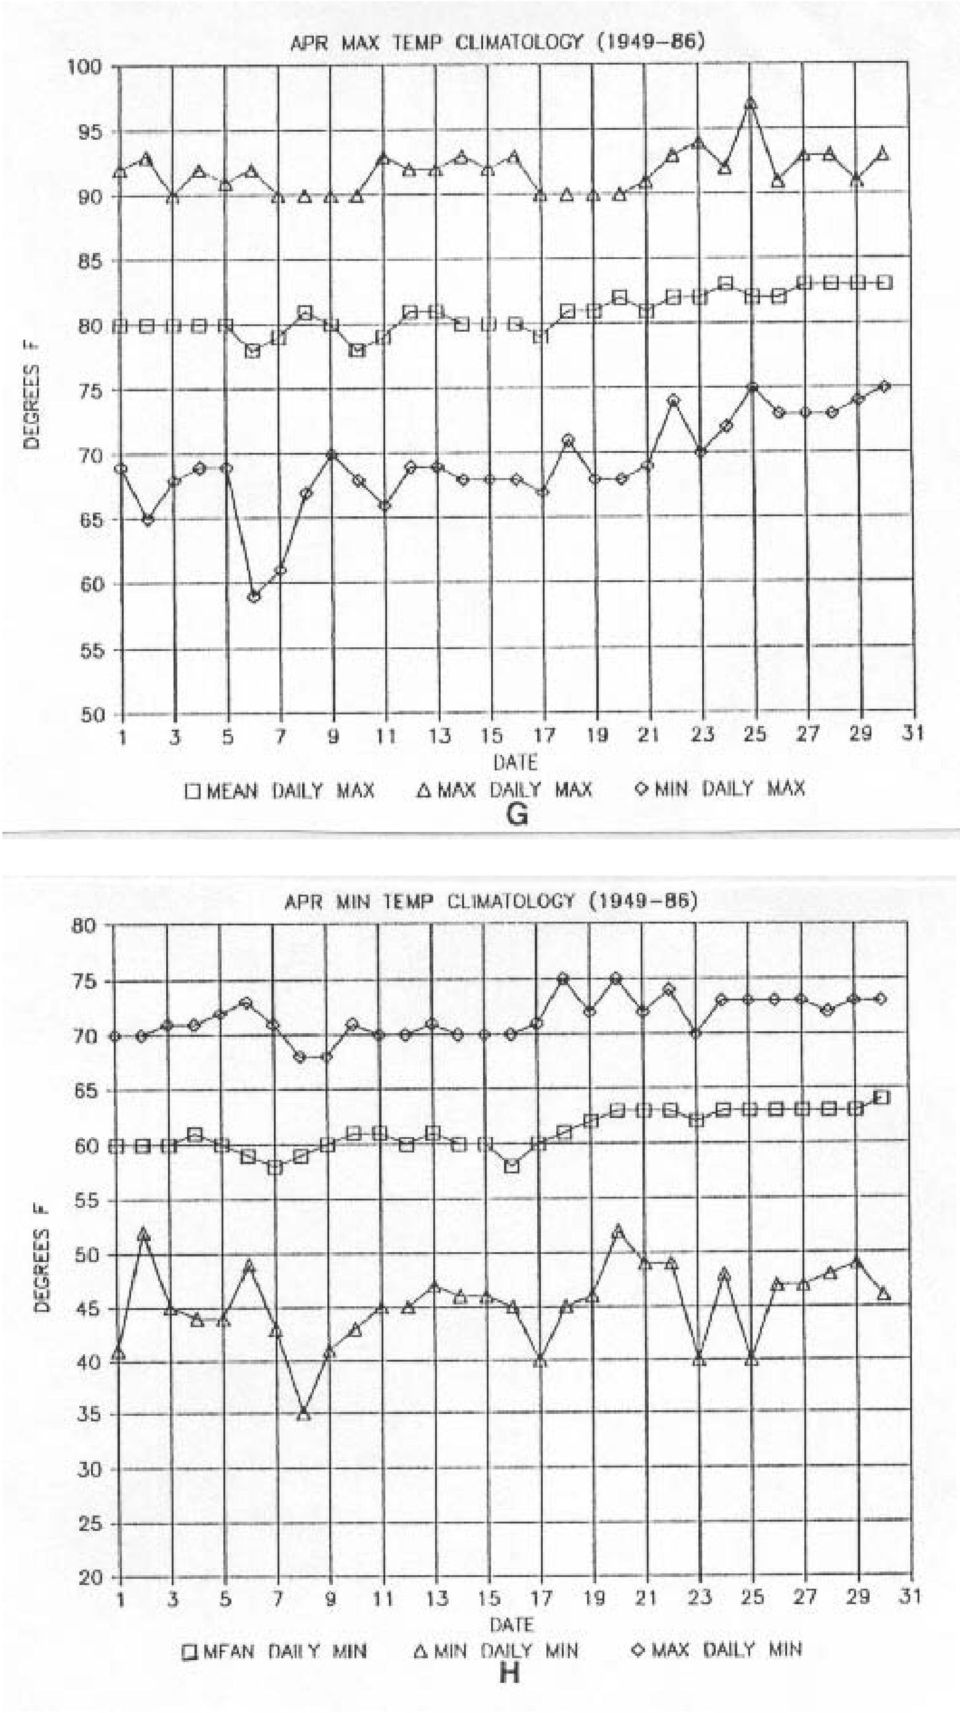
16 studies should consider mesoscale climatic variations due to soil and vegetation type and moisture, surface albedo, ocean currents, and small scale changes in elevation over central Florida. It is hoped the analyses presented here will be a good starting point for the new forecasters at NWSO Melbourne, helping them to gain initial experience and understanding of this region's weather and climate. 3.0 DAILY TEMPERATURE CLIMATOLOGY FOR MELBOURNE, FLORIDA The implementation of modern technologies at proposed WFOs can lead to greater forecast accuracy and detail in the future. Even so, the simple foundation upon which site forecasting is based -- that is, the climatological part of the local area -- must not be forgotten. Since the weather office at Melbourne is new, a method had to be found to familiarize forecasters with local climatology. Additionally, MOS guidance is not currently available for Melbourne. Given this lack of numerical guidance, forecasters may find it helpful to use climatology as the starting point for their local temperature forecast. To begin to address these issues, a daily temperature climatology of Melbourne was produced. The data for this study were taken from the Cooperative Climatological Station Records of the City Water Treatment Plant in Melbourne. Data were obtained through the NCDC for the period July 1948 through November While it appears the data set is good, any climatological study should be concerned with various factors that can affect accuracy, such as observational procedures, equipment, station relocation, or any change in the physical environment surrounding the collecting station through the concerned period (Robinson, 1990). It is important to comment here that the means are not smoothed, and record values are not considered official by the NCDC; but there are 38 years of continuous record, and these are the best data available. Data are presented in a series of 24 graphs (Figs. 8a-x), two for each month, representing both maximum and minimum temperature data. Six curves were plotted for each month: Maximum Daily Maximum (XDX), Minimum Daily Maximum (NDX), Mean Daily Maximum (MDX), Minimum Daily Minimum (NDN), Maximum Daily Minimum (XDN), and Mean Daily Minimum (MDN). The idea behind these graphs is that for any given day the forecaster can quickly reference average high and low temperatures to use as the basis for routine forecasts. For extreme events, record plots can be used to help define upper and lower bounds.

17 Figures 8a-x. Daily Maximum and Minimum Temperature Climatology Graphs by Month

18
19

20
21
22
23
24
25
26
27
28
29 Beginning with January (Figs. 8a-b), daily maximum temperatures should be in the low to mid 70s with minimums in the low to mid 50s. This also holds true for both February and December (Figs. 8c-d and 8w-x respectively). Aside from the means, the real key to temperature forecasting this time of year is an understanding of the large degree difference between the XDX and the NDX curves, and likewise, the difference between the NDN and XDN curves. On January 19 for example, although the MDX would point to a possible forecast high of 71 deg and the MDN a low of 50 deg, it is the difference between related extremes that provides the insight. The high temperature could be as warm as 81 deg or as cool as 42 deg, and low temperatures could be as warm as 62 deg or as cool as 19 deg. Clearly, most extreme cold values can be attributed to the deep southward penetration of mid-latitude winter storm systems which bring cold, dry, continental polar air to Melbourne's otherwise warm maritime tropical environment. If after cold frontal passage, surface winds blow from the north straight down the peninsula, little modification of the new air mass occurs. However, given the area's maritime influences, extreme cold is not apt to remain for prolonged periods. Any shift in wind direction results in some amount of air mass modification bringing temperatures back towards the norm. Conversely, warm values (as described by XDX and XDN curves) may be explained as that situation before cold frontal passage when the surface wind flow has a strong, warm, southerly component. December, January, and February may be defined as the winter months in Melbourne, with January boasting the coldest temperatures and the all-time record low of 17 deg. A common feature of all three months is the large day-to-day variability of the NDN and NDX curves which suggests difficulty when forecasting the magnitude of significant cold events. Figs. 8e-f show March as a transitional period with a warming of each curve through the month. While the XDX and XDN curves warm steadily, the NDN and the NDX curves still show intervals of large day-to-day variability. March 3 is an excellent example. The record low for that day is 25 deg -- a significant cold event. The corresponding NDX is 49 deg which actually occurred on the same day in Although Melbourne enjoys an early spring, at times synoptic patterns shift into place as to produce additional winter-type episodes. Another day of interest is March 23. This is the date of the "latest observed freeze (32 deg)," and also suggests that despite the warming, cold spells can happen even in late March. April (Figs. 8g & h) continues the transition. Evidence of cold and dry air influx still exists, but not to the extent of previous months, as sun angles are getting higher and daytime heating more pronounced. It is noteworthy that in April the NDX plot dips to as low as 59 deg on the 6th. In spring, more often than not, NDX values such as this are a product of overrunning. If relatively cooler, drier air is in place over the central peninsula at the same time winds take on an onshore component, overrunning can occur. The result is a thick low-level cloud deck that effectively blocks incoming solar radiation. If the deck produces precipitation, evaporative cooling can further suppress the daily high. When considering the NDN and the XDN plots during March and April, a lesson to be learned for the forecaster would be to guard against forecasting sustained warm temperatures too quickly. May (Figs. 8i-j) and June (Figs. 8k-l) are similar in that the warming of each curve continues, but at a much slower rate. Day-to-day variability in record values is not as chaotic, and the degree gap between the means and extremes is closing. Humidity gradually increases, and most midlatitude cyclones pass north of Melbourne.
30 Summertime finds Melbourne deeply entrenched in a tropical regime. Figs. 8m-p reveal July and August as the hottest time of the year. The range between means and extremes (as well as related extremes) is greatly reduced. This places great value on the means themselves. In fact, even though mean data have not been smoothed, values hardly vary from day-to-day. The main mechanism at work producing curves with such little fluctuation is the predominant easterly flow around the Bermuda High across central Florida at this time of year. This keeps an east coast station such as Melbourne in a higher absolute humidity environment. The abundance of moisture maintains a smaller average diurnal temperature range and provides fuel for afternoon thunderstorms. One should give second thought to a forecast that digresses too far from the means during this time of year. It is interesting to note that on occasion summer high temperatures can get quite hot, but only four times has the high reached 100 deg, and only once has it surpassed it (102 deg on July Melbourne's all-time high). The lack of exceedingly hot temperatures is likely the result of an easterly sea breeze that sets up during the early afternoon. Once the sea breeze passes, little additional heating will take place. Persistence forecasting often works well during the summer. September (Figs. 8q-r) completes summer with a continuation of the slight day-to-day variation in the means. Hot spikes in the XDX plot become less frequent; and by the second half of the month, the NDN curve begins to distance itself from that of the MDN. Probably the most interesting charts are those of October (Figs. 8s-t), a definite transitional month. The days become shorter, which is readily apparent by the steeply sloped MDX and MDN curves as they significantly cool significantly from beginning to end of the month. However, the sun is still capable of producing maxima exceeding 95 deg, as seen on the 2nd. On the other hand, highs of only 65 deg can occur, especially late in the month as shown by the 26th. Minima can be as warm as 81 deg (on the 11th), or as cool as 41 deg (on the 17th). October is within tropical cyclone season. It is also a time when drier, cooler air from the north begins to occasionally invade the peninsula. Coastal waters are still quite warm and have tremendous impact on minima when surface winds blow onshore. Yet, if cooler air happens to be in place at the surface when winds shift onshore, overrunning can occur with clouds and precipitation, thus impacting the maximum. These considerations and others have to be taken into account when forecasting temperatures in October. The final two graphs to be discussed are those of November (Figs. 8u-v). (December was discussed earlier with January and February.) The range between related extremes has once again become large. Individual record plots, especially the NDN and NDX, are now rough; and the unsmoothed means start to fluctuate. During the month, only slight cooling takes place in the XDX and XDN curves; but significant cooling occurs in the NDN and NDX curves. The result is a net cooling of the means. Graphs such as these can be very useful for forecasters. To Melbourne forecasters, they are particularly helpful since they help compensate for the lack of statistically-based numerical guidance and local experience. Additional insight can be gained by plotting observed daily maxima and minima as they occur to identify current temperature trends. With the opening of other future WFOs at new locations, a similar analysis of climatological data may be helpful, especially during the transition stage when new forecasters are added to the staff. Climatological data are more easily interpreted in graphical form, and storing the graphs on a personal computer makes for easy updating. Consideration of the graphs on a daily basis should help forecasters to focus on pertinent forecast problems, and also identify other areas for further investigation.
31 4. TORNADO CLIMATOLOGY Tornadoes are one of the most significant meteorological hazards that can affect a forecast area. Climatological information on tornado characteristics and their spatial and temporal distribution is vital to assessing the threat for any given area of the country. The tornado climatology presented here was compiled from computer printouts supplied by the Verification Section of the National Severe Storms Forecast Center (NSSFC) for the period 1950 through 1988 and include data on all documented tornadoes within a 125 nm radius of Melbourne (1002 tornadoes). The area covered extends beyond the Melbourne CWA. Indeed, a plot of the locations of all 1002 tornadoes (Fig Melbourne is located at the origin of the grid) shows that a majority of the tornadoes occurred in west central Florida. Figure 9. Tornado plots within 125 NM of Melbourne.
32 Fig. 9 also shows that most of the reported tornadoes are along the coastline, where population density is high and waterspouts moving onshore account for some of the tornado reports; and along the heavily populated corridor from around Daytona Beach to Orlando to the Tampa Bay area. The sparsely populated area southwest of Melbourne shows a virtual lack of reported tornadoes. While there may be a valid meteorological reason for a lack of tornadoes in this area, a more likely explanation is that it suffers from a lack of observations, as does the COOP climatology. Thus, due to reporting problems, a large sample was desirable in order to get a better regional representation of the variety of conditions that might be expected anywhere across central Florida. Additionally, since the conditions that favor tornado and waterspout development on the west coast may be quite different from those on the east coast, data were also tabulated specifically for WFO Melbourne's CWA. Figure 10. Monthy Totals of all Tornadoes reported within 125 nm of Melbourne.
33 Fig. 10 is a bar graph of the monthly totals of all tornadoes reported within 125 nm of Melbourne. The graph indicates that tornado activity is at a maximum in June and a minimum in November with a secondary maximum in March. A decrease in overall tornado activity in April may seem odd, but this is a unique regional phenomena and is correlated with the decrease in April rainfall that was discussed in Section 2. Yearly totals of weak/moderate (F0-1 [w/m]) and strong/violent (F2-5 [s/v]) tornadoes (Fujita, 1981) are shown in Fig. 11a. Most notable is the significant yearly increase in w/m tornadoes after the late 1960s that is related to better reporting procedures, but even during this period there is great annual variability in w/m tornadic activity. The occurrences of s/v tornadoes, which are most likely to be reported in any case, show no great systematic increase. Note the great annual variability in s/v tornadoes, with four years (1957, 1974, 1976 and 1984) having no s/v tornadoes, while years such as 1972 and 1983, which were strong El Nino years (Weare, 1986), each had 16. Some general trends in s/v activity are evident with the years 1968 through 1973 being most active, and the current period from 1984 to present being very inactive. The graph of annual accumulated tornadoes (Fig. 11b) again demonstrates the dramatic increase in reported w/m tornadoes in the last 20 years compared to the gradual increase in the s/v tornadoes. The general tornado reporting and distribution characteristics and limitations discussed above have been
34 found in many other tornado climatology studies on large scales (for example Kelly, et. al., 1978, and Schaefer and Galway, 1982). Fig. 12a is a graph of the hourly distribution for all tornadoes. The distribution approaches a normal curve with a mean time of 1500 EST. Most tornadoes occur between 1200 and 1900 EST, but tornadoes have occurred during every hour of the day. Fig. 12b shows the average time of tornado touchdown by month for all tornadoes in the Melbourne CWA. Most notable is the observation that the mean touchdown time for all months is 1458 EST, but it is prior to noon for January through March and in the afternoon for all other months.
35
36 Figs. 13a-d show the hourly distributions of tornadoes by month and are presented to more clearly describe the monthly and seasonal characteristics of tornado occurrences. Fig. 13a shows the distributions for January, February and March. This period is clearly different from the others with most of the tornadoes occurring prior to noon. January tornadoes peak at 1100 EST with a secondary peak at 0300 EST, and February tornadoes peak at 0900 EST with a secondary peak at 1700 EST. Tornadoes for March peak at 0500 EST with a secondary peak at 1500 EST. In April, May, and June (Fig. 13b) the majority of tornadoes occur in the early afternoon, peaking at 1300 EST in April, 1430 in May and 1500 EST in June; but there is still considerable morning activity. Tornadoes occurring in the summer months (Fig. 13c) occur almost exclusively in the afternoon and early evening hours. The highest hourly frequency of tornadoes for the year occurs at 1500 EST in July with 25, followed by 24 at 1500 EST in June. Clearly, the timing of warm season tornadoes is closely correlated with afternoon heating. The fewest tornadoes are recorded in the months of October, November, and December (Fig. 13d). While the hourly tornado occurrences are more evenly distributed throughout the day, there are still relative maxima for all three months in the early afternoon.
37
38 Some summary details on the characteristics of the tornadoes are provided by graphs of tornadoes by F-scale, path length, and path width shown in Figs.14a-14b and 14c, respectively. The graphs show that the majority of tornadoes are relatively weak, narrow, and short-lived. This reflects the fact that a majority of the tornadoes form during the afternoon in the warm season due to thermal forcing in a weak dynamic environment. The average tornado, computed from all tornado reports with sufficient data, has an F-scale of 0.8, a path length of 1.2 miles and a path width of 50 yards. Fig. 14a shows that there has never been a reported F5 tornado (wind speeds >260 mph) within 125 nm of Melbourne; but 2 F4's, 16 F3's, and 150 F2's have been documented. It is desirable to look in more detail at the temporal characteristics of the strong tornadoes reported in Melbourne's CWA. Fig. 14a.
39 Fig 14b. Fig 14c.
40 The monthly frequencies of s/v tornadoes (F2-5), and killer and injury tornadoes (regardless of F-scale), for the ten counties in Melbourne's CWA only are shown as Fig. 15a. Strong and violent tornadoes and/or injury tornadoes have occurred in every month of the year with maximum frequency in March and April compared to the all tornado population which as a maximum frequency in June. There have been four killer tornadoes in the Melbourne CWA, two in April and two in September. It is of interest to note that the September tornadoes were not associated with tropical cyclones, as might be expected. These cases may be looked into in more detail. The hourly distribution of s/v tornadoes, and killer/injury tornadoes, are shown as Fig. 15b. It is interesting to note that while the all tornado population distribution (Fig. 12a) shows a distinct maximum centered around 1500 EST, the s/v tornadoes are much more evenly distributed throughout the day, with 35 occurring before noon and 32 after noon. There were 15 injury tornadoes before noon and 16 after noon, but all four killer tornadoes occurred in the morning (2, 4, 8, and 10 a.m.). Clearly the s/v tornadoes depend more on strong dynamics, regardless of the time of day, than on strong surface heating in the afternoon, as is typically the case with the w/m tornadoes.
41 STRONG AND VIOLENT TORNADOES IN NWSO MELBOURNE CWA ( ) , [ _ TORNADOES ~ KILLE R om INJURY I F 10 R E a - -. a U E 6 N r Ị,. C 4 -.,' - :~~.~._., Y ;~i o..-...u=-.""--...u:,,",---.!..i'li F2 10 F6 Tornado8a Only JAN FEB MAR APR MAY JUN JUL AUG SEP OCT NOV DEC MONTH Figure I5a. STRONG AND VIOLENT TORNADOES IN NWSO MELBOURNE CWA ( ) 10 -, , J- TORNADOES ~ KILLER lillillj INJURIES I... F R E 6._._ - -_ Q U ~ 4 _..._ _--....' C Y 2._ F2 to F5 Tornadoea Only --, m I~ 11m 1m ". I U o B HOUR (EST) Figure ISb _
42 The hourly distributions of strong and violent tornadoes by month are shown as Figs. 16a-1. There are generally not enough cases in each month to allow confident interpretations of the significance of temporal trends, but the presentations are nonetheless instructive. Notable is that of the relatively large samples of s/v tornadoes found in March and April, nearly all occurred in the morning.
43 Fig. 16a-l. Monthly Frequency of Strong Tornadoes in the Melbourne CWA by Hour. The climatological analyses demonstrate that the tornado threat within 125 nm of Melbourne is significant, averaging 26 tornadoes a year since 1950, and showing great year-to-year variability. The data clearly indicate two significant forecast problems: (1) the frequent occurrence of weak, short-lived tornadoes during the afternoon in the summer, sometimes originating as waterspouts
44 over the Atlantic Ocean and inland waterways, and (2) the occurrence of strong tornadoes causing injury, death, and considerable damage during the morning hours in late winter and spring. This broad look at the tornado climatology serves as a baseline of knowledge and logically leads to the desire for more detailed studies directly relating to significant forecast problems. It is much quicker, and more logical, to train forecasters by looking at past events and developing historical case studies, rather than waiting for events to happen and then studying them. After reviewing the tornado data, the following subjects were identified as specific topics for further investigation: (1) The synoptic climatology of all cases since 1950 when at least five tornadoes occurred within a four-hour period, and at least one of the tornadoes occurred in Melbourne's CWA (17 cases -- a subjective definition of a central Florida tornado "outbreak"). (2) A study of the weather regime of June 1981 when w/m afternoon tornadoes occurred on 11 of 30 days, including a five consecutive day period. (3) A case study of the worst recorded tornado event in the history of central Florida on April 4, 1966, when a tornado travelled from the Tampa Bay area to near Cape Canaveral killing 11 people and injuring over 500. (4) A study of 0000 and 1200 UTC proximity upper-air soundings taken within +2 hours of tornado touchdowns within Melbourne's CWA, with particular emphasis on the comparison between the vertical profile of the environmental wind in morning and afternoon tornadoes. This information may well have important applications involving vertical wind profiles from the WSR-88D Doppler radar and the Cape Canaveral wind profiler Melbourne forecasters will have access to beginning in These studies are under way and ideally should be completed by the WSR-88D commissioning date. 5. CONCLUDING REMARKS The three climatological analyses presented here have already been found to be helpful in better understanding our new forecast environment. They provide not only the beginning of a fundamental baseline of meteorological knowledge, but a focusing mechanism for consideration of future operational research projects and directions. Much more work needs to be done, and additional studies are in progress. These studies should not be looked upon as a means to an end, but rather as a starting point. They are part of a continuum of meteorological knowledge covering all scales that must be accumulated, analyzed, evaluated, and re-evaluated in an ongoing process as we move into the modernized era. We should move forward with an operational philosophy geared toward solving problems much like the philosophy of method put forth by Scorer (1958). The philosophy is even more valid today, as we are soon to gain access to new technology and data sets. His thoughts are paraphrased below: There will always be an infinity of phenomena which we do not understand. Our task is to select from the complexity of Nature problems which we can solve. Generally the procedure is not to
45 pose problems, but to construct an ever-growing edifice of theory and knowledge which we call science, and as it grows we find that phenomena we have observed begin to fall into place. We have to try all the time to fit what we see into a theory, or pattern; and the inspiration comes when we notice something which will not fit... ACKNOWLEDGMENTS Dan Smith, Chief, Scientific Service Division, Southern Region Headquarters, provided the tornado data through the Verification Section of the NSSFC. Cooperative climatological data were provided by Robert L. Money, Acting Chief, Climate Services Division of the NCDC. Peggy France and Robert Goree contributed to the preparation of the tornado graphics. Mike Turner drew the original map backgrounds for the temperature and precipitation analyses. Thanks to Mike Sabones, Science and Operations Officer, WSO Melbourne, and Paul Hebert, NWS Florida Area Manager, for reviewing the manuscript and making suggestions for improvement. REFERENCES Burrough, P.A., 1985: Principles of Geographic Information Systems for Land Resources Assessment. Oxford University Press, pp Carlson, T.N., 1967: Isentropic upslope motion and an instance of heavy rain over south Florida. Mon. Wea. Rev., 95: Fujita, T., 1981: Tornadoes and downbursts in the context of generalized planetary scales. J. Atmos. Sci., 38: Hebert, Paul J., 1989: An operational planning guide for future NWSOs and WFOs. Internal NWS Memorandum. Kelly, D.L., J.T. Schaefer, R.P. McNulty, C.A. Doswell III, and R. F. Abbey, Jr., 1978: An augmented tornado climatology. Mon. Wea. Rev., 106: NOAA, 1990: National Implementation Plan for the Modernization and Associated Restructuring of the National Weather Service. Washington, D.C. Ripley, B., 1981: Spatial Statistics. Wiley and Sons, 252 pp. Robinson, D.A., 1990: The United States cooperative climate-observing systems: reflections and recommendations. Bull. Amer. Meteor. Soc., 71: Schaefer, J.T., and J. G. Galway, 1982: Population biases in the tornado climatology. Preprints 12th Conf. Severe Local Storms (San Antonio, TX) Amer. Meteor. Soc., Scorer, R.S., 1958: Natural Aerodynamics. Pergamon Press, pp Weare, B. C., 1986: An extension of an El Nino index. Mon. Wea. Rev., 114:
A SEVERE WEATHER CLIMATOLOGY FOR THE WILMINGTON, NC WFO COUNTY WARNING AREA
 A SEVERE WEATHER CLIMATOLOGY FOR THE WILMINGTON, NC WFO COUNTY WARNING AREA Carl R. Morgan National Weather Service Wilmington, NC 1. INTRODUCTION The National Weather Service (NWS) Warning Forecast Office
Climate of Illinois Narrative Jim Angel, state climatologist. Introduction. Climatic controls
 Climate of Illinois Narrative Jim Angel, state climatologist Introduction Illinois lies midway between the Continental Divide and the Atlantic Ocean, and the state's southern tip is 500 miles north of
2. The map below shows high-pressure and low-pressure weather systems in the United States.
 1. Which weather instrument has most improved the accuracy of weather forecasts over the past 40 years? 1) thermometer 3) weather satellite 2) sling psychrometer 4) weather balloon 6. Wind velocity is
Southern AER Atmospheric Education Resource
 Southern AER Atmospheric Education Resource Vol. 9 No. 5 Spring 2003 Editor: Lauren Bell In this issue: g Climate Creations exploring mother nature s remote control for weather and Climate. g Crazy Climate
Heavy Rainfall from Hurricane Connie August 1955 By Michael Kozar and Richard Grumm National Weather Service, State College, PA 16803
 Heavy Rainfall from Hurricane Connie August 1955 By Michael Kozar and Richard Grumm National Weather Service, State College, PA 16803 1. Introduction Hurricane Connie became the first hurricane of the
8B.6 A DETAILED ANALYSIS OF SPC HIGH RISK OUTLOOKS, 2003-2009
 8B.6 A DETAILED ANALYSIS OF SPC HIGH RISK OUTLOOKS, 2003-2009 Jason M. Davis*, Andrew R. Dean 2, and Jared L. Guyer 2 Valparaiso University, Valparaiso, IN 2 NOAA/NWS Storm Prediction Center, Norman, OK.
MIAMI-SOUTH FLORIDA National Weather Service Forecast Office http://www.weather.gov/miami
 MIAMI-SOUTH FLORIDA National Weather Service Forecast Office http://www.weather.gov/miami November 2014 Weather Summary Cooler and Drier than Normal December 1, 2014: Cooler than normal temperatures was
MIAMI-SOUTH FLORIDA National Weather Service Forecast Office http://www.weather.gov/miami
 MIAMI-SOUTH FLORIDA National Weather Service Forecast Office http://www.weather.gov/miami Summer 2015 Weather Summary Wet West and Dry East September 2, 2015: One of the most variable summers in recent
Climate Extremes Research: Recent Findings and New Direc8ons
 Climate Extremes Research: Recent Findings and New Direc8ons Kenneth Kunkel NOAA Cooperative Institute for Climate and Satellites North Carolina State University and National Climatic Data Center h#p://assessment.globalchange.gov
8.5 Comparing Canadian Climates (Lab)
") These 3 climate graphs and tables of data show average temperatures and precipitation for each month in Victoria, Winnipeg and Whitehorse: Figure 1.1 Month J F M A M J J A S O N D Year Precipitation 139
These 3 climate graphs and tables of data show average temperatures and precipitation for each month in Victoria, Winnipeg and Whitehorse: Figure 1.1 Month J F M A M J J A S O N D Year Precipitation 139
2015 Climate Review for Puerto Rico and the U.S. Virgin Islands. Odalys Martínez-Sánchez
 2015 Climate Review for Puerto Rico and the U.S. Virgin Islands. Odalys Martínez-Sánchez 2015 can be described as a dry and hot year across Puerto Rico (PR) and the U.S. Virgin Islands (USVI). Below normal
Anyone Else Notice That Its Been Windy Lately?
 National Weather Service Aberdeen, South Dakota January 2014 Inside this issue: Has it Been Windy Lately or What? 2013 Year in Review 2013 Year in Review (cont.) 1 2 3 Has it Been Windy Lately or What?
MIAMI-SOUTH FLORIDA National Weather Service Forecast Office http://www.weather.gov/miami
 MIAMI-SOUTH FLORIDA National Weather Service Forecast Office http://www.weather.gov/miami January Summary: Warm and Dry Winter Rolls On February 1, 2013: South Florida s warm and dry winter pattern of
The Pennsylvania Observer
 The Pennsylvania Observer August 3, 2009 July 2009 - Pennsylvania Weather Recap Written by: Dan DePodwin After a cool month of June, some hoped July would bring usual summertime warmth to the state of
Convective Clouds. Convective clouds 1
 Convective clouds 1 Convective Clouds Introduction Convective clouds are formed in vertical motions that result from the instability of the atmosphere. This instability can be caused by: a. heating at
Monsoon Variability and Extreme Weather Events
 Monsoon Variability and Extreme Weather Events M Rajeevan National Climate Centre India Meteorological Department Pune 411 005 [email protected] Outline of the presentation Monsoon rainfall Variability
Chapter Overview. Seasons. Earth s Seasons. Distribution of Solar Energy. Solar Energy on Earth. CHAPTER 6 Air-Sea Interaction
 Chapter Overview CHAPTER 6 Air-Sea Interaction The atmosphere and the ocean are one independent system. Earth has seasons because of the tilt on its axis. There are three major wind belts in each hemisphere.
Seasonal & Daily Temperatures. Seasons & Sun's Distance. Solstice & Equinox. Seasons & Solar Intensity
 Seasonal & Daily Temperatures Seasons & Sun's Distance The role of Earth's tilt, revolution, & rotation in causing spatial, seasonal, & daily temperature variations Please read Chapter 3 in Ahrens Figure
South Africa. General Climate. UNDP Climate Change Country Profiles. A. Karmalkar 1, C. McSweeney 1, M. New 1,2 and G. Lizcano 1
 UNDP Climate Change Country Profiles South Africa A. Karmalkar 1, C. McSweeney 1, M. New 1,2 and G. Lizcano 1 1. School of Geography and Environment, University of Oxford. 2. Tyndall Centre for Climate
Name Period 4 th Six Weeks Notes 2015 Weather
 Name Period 4 th Six Weeks Notes 2015 Weather Radiation Convection Currents Winds Jet Streams Energy from the Sun reaches Earth as electromagnetic waves This energy fuels all life on Earth including the
Storms Short Study Guide
 Name: Class: Date: Storms Short Study Guide Multiple Choice Identify the letter of the choice that best completes the statement or answers the question. 1. A(n) thunderstorm forms because of unequal heating
How to analyze synoptic-scale weather patterns Table of Contents
 How to analyze synoptic-scale weather patterns Table of Contents Before You Begin... 2 1. Identify H and L pressure systems... 3 2. Locate fronts and determine frontal activity... 5 3. Determine surface
WEATHER AND CLIMATE practice test
 WEATHER AND CLIMATE practice test Multiple Choice Identify the choice that best completes the statement or answers the question. 1. What role does runoff play in the water cycle? a. It is the process in
Air Masses and Fronts
 Air Masses and Fronts Air Masses The weather of the United States east of the Rocky Mountains is dominated by large masses of air that travel south from the wide expanses of land in Canada, and north from
Storm tide is the water level rise during a storm due to the combination of storm surge and the astronomical tide.
 INTRODUCTION TO STORM SURGE Introduction to Storm Surge BOLIVAR PENINSULA IN TEXAS AFTER HURRICANE IKE (2008) What is Storm Surge? Inland Extent Storm surge can penetrate well inland from the coastline.
How Do Oceans Affect Weather and Climate?
 How Do Oceans Affect Weather and Climate? In Learning Set 2, you explored how water heats up more slowly than land and also cools off more slowly than land. Weather is caused by events in the atmosphere.
The Climate of Oregon Climate Zone 2 Willamette Valley
 /05 E-55 No. ci oi Unbound issue e2_, Does not circulate Special Report 914 May 1993 The Climate of Oregon Climate Zone 2 Property of OREGON STATE UNIVERSITY Library Serials Corvallis, OR 97331-4503 Agricultural
Storm tide is the water level rise during a storm due to the combination of storm surge and the astronomical tide.
 INTRODUCTION TO STORM SURGE Introduction to Storm Surge National Hurricane Center Storm Surge Unit BOLIVAR PENINSULA IN TEXAS AFTER HURRICANE IKE (2008) What is Storm Surge? Inland Extent Storm surge can
Texas Department of Public Safety Texas Division of Emergency Management. Texas State Operations Center
 Texas Department of Public Safety Texas Division of Emergency Management Texas State Operations Center Situation Awareness Brief Saturday, July 20 th 2013 As of 0900 CDT Tropical Weather Outlook For the
Geography affects climate.
 KEY CONCEPT Climate is a long-term weather pattern. BEFORE, you learned The Sun s energy heats Earth s surface unevenly The atmosphere s temperature changes with altitude Oceans affect wind flow NOW, you
CGC1D1: Interactions in the Physical Environment Factors that Affect Climate
 Name: Date: Day/Period: CGC1D1: Interactions in the Physical Environment Factors that Affect Climate Chapter 12 in the Making Connections textbook deals with Climate Connections. Use pages 127-144 to fill
SIXTH GRADE WEATHER 1 WEEK LESSON PLANS AND ACTIVITIES
 SIXTH GRADE WEATHER 1 WEEK LESSON PLANS AND ACTIVITIES WATER CYCLE OVERVIEW OF SIXTH GRADE WATER WEEK 1. PRE: Evaluating components of the water cycle. LAB: Experimenting with porosity and permeability.
Basics of weather interpretation
 Basics of weather interpretation Safety at Sea Seminar, April 2 nd 2016 Dr. Gina Henderson Oceanography Dept., USNA [email protected] Image source: http://earthobservatory.nasa.gov/naturalhazards/view.php?id=80399,
Development of an Integrated Data Product for Hawaii Climate
 Development of an Integrated Data Product for Hawaii Climate Jan Hafner, Shang-Ping Xie (PI)(IPRC/SOEST U. of Hawaii) Yi-Leng Chen (Co-I) (Meteorology Dept. Univ. of Hawaii) contribution Georgette Holmes
ENVIRONMENTAL STRUCTURE AND FUNCTION: CLIMATE SYSTEM Vol. II - Low-Latitude Climate Zones and Climate Types - E.I. Khlebnikova
 LOW-LATITUDE CLIMATE ZONES AND CLIMATE TYPES E.I. Khlebnikova Main Geophysical Observatory, St. Petersburg, Russia Keywords: equatorial continental climate, ITCZ, subequatorial continental (equatorial
How To Assess Natural Hazards In Houston County, Minn.
 Natural Hazards Assessment Houston County, MN Prepared by: NOAA / National Weather Service La Crosse, WI Natural Hazards Assessment for Houston County, MN Prepared by NOAA / National Weather Service La
List 10 different words to describe the weather in the box, below.
 Weather and Climate Lesson 1 Web Quest: What is the Weather? List 10 different words to describe the weather in the box, below. How do we measure the weather? Use this web link to help you: http://www.bbc.co.uk/weather/weatherwise/activities/weatherstation/
Hurricanes. Characteristics of a Hurricane
 Hurricanes Readings: A&B Ch. 12 Topics 1. Characteristics 2. Location 3. Structure 4. Development a. Tropical Disturbance b. Tropical Depression c. Tropical Storm d. Hurricane e. Influences f. Path g.
CHAPTER 3. The sun and the seasons. Locating the position of the sun
 zenith 90 summer solstice 75 equinox 52 winter solstice 29 altitude angles observer Figure 3.1: Solar noon altitude angles for Melbourne SOUTH winter midday shadow WEST summer midday shadow summer EAST
URGENT - WEATHER MESSAGE NATIONAL WEATHER SERVICE MELBOURNE FL 402 AM EST MON JAN 6 2014
 URGENT - WEATHER MESSAGE...FREEZE AND HARD FREEZE WARNINGS IN EFFECT FOR PORTIONS OF EAST CENTRAL FLORIDA TONIGHT......LAKE WIND ADVISORY IN EFFECT FOR PORTIONS OF EAST CENTRAL FLORIDA THIS AFTERNOON...
WEATHER AND CLIMATE WHY DOES IT MATTER?
 WEATHER AND CLIMATE Rising global average temperature is associated with widespread changes in weather patterns. Scientific studies indicate that extreme weather events such as heat waves and large storms
Fundamentals of Climate Change (PCC 587): Water Vapor
: Water Vapor") Fundamentals of Climate Change (PCC 587): Water Vapor DARGAN M. W. FRIERSON UNIVERSITY OF WASHINGTON, DEPARTMENT OF ATMOSPHERIC SCIENCES DAY 2: 9/30/13 Water Water is a remarkable molecule Water vapor
Fundamentals of Climate Change (PCC 587): Water Vapor DARGAN M. W. FRIERSON UNIVERSITY OF WASHINGTON, DEPARTMENT OF ATMOSPHERIC SCIENCES DAY 2: 9/30/13 Water Water is a remarkable molecule Water vapor
Georgia Performance Standards Framework for Natural Disasters 6 th Grade
 The following instructional plan is part of a GaDOE collection of Unit Frameworks, Performance Tasks, examples of Student Work, and Teacher Commentary. Many more GaDOE approved instructional plans are
Deke Arndt Climate Monitoring Branch Na6onal Clima6c Data Center 25 June 2013
 Deke Arndt Climate Monitoring Branch Na6onal Clima6c Data Center 25 June 2013 The National Climatic Data Center The World s Largest Archive of Weather & Climate Data NCDC is located in Asheville, North
How To Understand The Weather Patterns In Tallahassee, Florida
 PATTERN RECOGNITION OF SIGNIFICANT SNOWFALL EVENTS IN TALLAHASSEE, FLORIDA Jeffery D. Fournier and Andrew I. Watson NOAA/National Weather Service Weather Forecast Office Tallahassee, Florida Abstract Skew-T
FOURTH GRADE WEATHER
 FOURTH GRADE WEATHER 1 WEEK LESSON PLANS AND ACTIVITIES WATER CYCLE OVERVIEW OF FOURTH GRADE WATER WEEK 1. PRE: Comparing different reservoirs of water. LAB: Experimenting with surface tension and capillary
2013 Annual Climate Summary for the Southeast United States
 Months of heavy rain forced the U.S. Army Corp of Engineers to open the spillways at Lake Hartwell, located at the headwaters of the Savannah River along the South Carolina-Georgia border, on July 9,.
What Causes Climate? Use Target Reading Skills
 Climate and Climate Change Name Date Class Climate and Climate Change Guided Reading and Study What Causes Climate? This section describes factors that determine climate, or the average weather conditions
Weather Briefing for Southeast Texas October 24 th, 2015
 Weather Briefing for Southeast Texas October 24 th, 2015 Dangerous Flash Flood Event Saturday through Sunday 8:16 AM Overview Ongoing: record deep moisture in place, elevated seas, rip currents, high surf,
David P. Ruth* Meteorological Development Laboratory Office of Science and Technology National Weather Service, NOAA Silver Spring, Maryland
 9.9 TRANSLATING ADVANCES IN NUMERICAL WEATHER PREDICTION INTO OFFICIAL NWS FORECASTS David P. Ruth* Meteorological Development Laboratory Office of Science and Technology National Weather Service, NOAA
THE STRATEGIC PLAN OF THE HYDROMETEOROLOGICAL PREDICTION CENTER
 THE STRATEGIC PLAN OF THE HYDROMETEOROLOGICAL PREDICTION CENTER FISCAL YEARS 2012 2016 INTRODUCTION Over the next ten years, the National Weather Service (NWS) of the National Oceanic and Atmospheric Administration
Analyze Weather in Cold Regions and Mountainous Terrain
 Analyze Weather in Cold Regions and Mountainous Terrain Terminal Learning Objective Action: Analyze weather of cold regions and mountainous terrain Condition: Given a training mission that involves a specified
Empirical study of the temporal variation of a tropical surface temperature on hourly time integration
 Global Advanced Research Journal of Physical and Applied Sciences Vol. 4 (1) pp. 051-056, September, 2015 Available online http://www.garj.org/garjpas/index.htm Copyright 2015 Global Advanced Research
Mixing Heights & Smoke Dispersion. Casey Sullivan Meteorologist/Forecaster National Weather Service Chicago
 Mixing Heights & Smoke Dispersion Casey Sullivan Meteorologist/Forecaster National Weather Service Chicago Brief Introduction Fire Weather Program Manager Liaison between the NWS Chicago office and local
Temporal variation in snow cover over sea ice in Antarctica using AMSR-E data product
 Temporal variation in snow cover over sea ice in Antarctica using AMSR-E data product Michael J. Lewis Ph.D. Student, Department of Earth and Environmental Science University of Texas at San Antonio ABSTRACT
Climate Change on the Prairie:
 Climate Change on the Prairie: A Basic Guide to Climate Change in the High Plains Region - UPDATE Global Climate Change Why does the climate change? The Earth s climate has changed throughout history and
Jessica Blunden, Ph.D., Scientist, ERT Inc., Climate Monitoring Branch, NOAA s National Climatic Data Center
 Kathryn Sullivan, Ph.D, Acting Under Secretary of Commerce for Oceans and Atmosphere and NOAA Administrator Thomas R. Karl, L.H.D., Director,, and Chair of the Subcommittee on Global Change Research Jessica
Multi-Jurisdictional Hazard Mitigation Plan
 Flooding General Flooding is the leading cause of death among all types of natural disasters throughout the United States, with its ability to roll boulders the size of cars, tear out trees, and destroy
Climate Change. Lauma M. Jurkevics - DWR, Southern Region Senior Environmental Scientist
 Climate Change A n o t h e r F a c t o r i n M a n a g i n g S o u t h e r n C a l i f o r n i a s W a t e r R e s o u r c e s Lauma M. Jurkevics - DWR, Southern Region Senior Environmental Scientist USEPA-Region
Name: OBJECTIVES Correctly define: WEATHER BASICS: STATION MODELS: MOISTURE: PRESSURE AND WIND: Weather
 Name: OBJECTIVES Correctly define: air mass, air pressure, anemometer, barometer, cyclone, dew point, front, isobar, isotherm, meteorology, precipitation, psychrometer, relative humidity, saturated, transpiration
6.4 THE SIERRA ROTORS PROJECT, OBSERVATIONS OF MOUNTAIN WAVES. William O. J. Brown 1 *, Stephen A. Cohn 1, Vanda Grubiši 2, and Brian Billings 2
 6.4 THE SIERRA ROTORS PROJECT, OBSERVATIONS OF MOUNTAIN WAVES William O. J. Brown 1 *, Stephen A. Cohn 1, Vanda Grubiši 2, and Brian Billings 2 1 National Center for Atmospheric Research, Boulder, Colorado.
Lecture 4: Pressure and Wind
 Lecture 4: Pressure and Wind Pressure, Measurement, Distribution Forces Affect Wind Geostrophic Balance Winds in Upper Atmosphere Near-Surface Winds Hydrostatic Balance (why the sky isn t falling!) Thermal
Basic Climatological Station Metadata Current status. Metadata compiled: 30 JAN 2008. Synoptic Network, Reference Climate Stations
 Station: CAPE OTWAY LIGHTHOUSE Bureau of Meteorology station number: Bureau of Meteorology district name: West Coast State: VIC World Meteorological Organization number: Identification: YCTY Basic Climatological
7613-1 - Page 1. Weather Unit Exam Pre-Test Questions
 Weather Unit Exam Pre-Test Questions 7613-1 - Page 1 Name: 1) Equal quantities of water are placed in four uncovered containers with different shapes and left on a table at room temperature. From which
Scheduling Best Practices
 The eighth article in the Scheduling Best Practices series is How to Handle the Weather. Our colleague Beth Blair, a managing consultant in Warner s Disputes Resolution Group, has over 20 years of experience
California Standards Grades 9 12 Boardworks 2009 Science Contents Standards Mapping
 California Standards Grades 912 Boardworks 2009 Science Contents Standards Mapping Earth Sciences Earth s Place in the Universe 1. Astronomy and planetary exploration reveal the solar system s structure,
In a majority of ice-crystal icing engine events, convective weather occurs in a very warm, moist, tropical-like environment. aero quarterly qtr_01 10
 In a majority of ice-crystal icing engine events, convective weather occurs in a very warm, moist, tropical-like environment. 22 avoiding convective Weather linked to Ice-crystal Icing engine events understanding
VOCALS-CUpEx: The Chilean Upwelling Experiment
 VOCALS-CUpEx: The Chilean Upwelling Experiment René D. Garreaud 1, José Rutllant 1,2, Ricardo Muñoz 1, David Rahn 1, Marcel Ramos 2 and Dante Figueroa 3 (1) Department of Geophysics, Universidad de Chile;
Project Title: Quantifying Uncertainties of High-Resolution WRF Modeling on Downslope Wind Forecasts in the Las Vegas Valley
 University: Florida Institute of Technology Name of University Researcher Preparing Report: Sen Chiao NWS Office: Las Vegas Name of NWS Researcher Preparing Report: Stanley Czyzyk Type of Project (Partners
The State of the Climate And Extreme Weather. Deke Arndt NOAA s National Climatic Data Center
 The State of the Climate And Extreme Weather Deke Arndt June Feb 2013 2011 1 The world s largest archive of weather and climate data NCDC is located in Asheville, North Carolina A place of active retirement
The IPCC Special Report on Managing the Risks of Extreme Events and Disasters to Advance Climate Change Adaptation
 The IPCC Special Report on Managing the Risks of Extreme Events and Disasters to Advance Climate Change Adaptation A changing climate leads to changes in extreme weather and climate events 2 How do changes
OBSERVATIONS FROM THE APRIL 13 2004 WAKE LOW DAMAGING WIND EVENT IN SOUTH FLORIDA. Robert R. Handel and Pablo Santos NOAA/NWS, Miami, Florida ABSTRACT
 OBSERVATIONS FROM THE APRIL 13 2004 WAKE LOW DAMAGING WIND EVENT IN SOUTH FLORIDA Robert R. Handel and Pablo Santos NOAA/NWS, Miami, Florida ABSTRACT On Tuesday, April 13, 2004, a high wind event swept
The Development of an Evaporative Cooler Warning System for Phoenix
 The Development of an Evaporative Cooler Warning System for Phoenix, Arizona Adam J Kalkstein Laurence S. Kalkstein Presented to the NOAA/NWS Office, Phoenix, Arizona May, 2004 INTRODUCTION Previous research
J4.1 CENTRAL NORTH CAROLINA TORNADOES FROM THE 16 APRIL 2011 OUTBREAK. Matthew Parker* North Carolina State University, Raleigh, North Carolina
 J4.1 CENTRAL NORTH CAROLINA TORNADOES FROM THE 16 APRIL 2011 OUTBREAK Matthew Parker* North Carolina State University, Raleigh, North Carolina Jonathan Blaes NOAA/National Weather Service, Raleigh, North
TOPIC: CLOUD CLASSIFICATION
 INDIAN INSTITUTE OF TECHNOLOGY, DELHI DEPARTMENT OF ATMOSPHERIC SCIENCE ASL720: Satellite Meteorology and Remote Sensing TERM PAPER TOPIC: CLOUD CLASSIFICATION Group Members: Anil Kumar (2010ME10649) Mayank
Chapter 3: Weather Map. Weather Maps. The Station Model. Weather Map on 7/7/2005 4/29/2011
 Chapter 3: Weather Map Weather Maps Many variables are needed to described weather conditions. Local weathers are affected by weather pattern. We need to see all the numbers describing weathers at many
Seasonal Temperature Variations
 Seasonal and Daily Temperatures Fig. 3-CO, p. 54 Seasonal Temperature Variations What causes the seasons What governs the seasons is the amount of solar radiation reaching the ground What two primary factors
In This Issue. El Niño and Florida s Expected Severe Weather by Daniel Noah, Warning Coordination Meteorologist
 Wiinter 2015//2016 In This Issue El Niño and Florida s Expected Severe Weather National Weather Service Tampa Bay s Newest Forecaster New Marine Advisory Group forms at NWS Tampa We Are Looking for Ambassadors
South Dakota Severe Weather Awareness Week April 22nd through 26th
 National Weather Service Aberdeen, South Dakota April 2013 Inside this issue: Severe Weather Awareness Impact Based Warnings Impact Based Warnings (cont) Record Cold March Record Cold March (cont) Seasonal
Forecaster comments to the ORTECH Report
 Forecaster comments to the ORTECH Report The Alberta Forecasting Pilot Project was truly a pioneering and landmark effort in the assessment of wind power production forecast performance in North America.
Urban heat islands and summertime convective thunderstorms in Atlanta: three case studies
 Atmospheric Environment 34 (2000) 507}516 Urban heat islands and summertime convective thunderstorms in Atlanta: three case studies Robert Bornstein*, Qinglu Lin Department of Meteorology, San Jose State
DIURNAL CYCLE OF CLOUD SYSTEM MIGRATION OVER SUMATERA ISLAND
 DIURNAL CYCLE OF CLOUD SYSTEM MIGRATION OVER SUMATERA ISLAND NAMIKO SAKURAI 1, FUMIE MURATA 2, MANABU D. YAMANAKA 1,3, SHUICHI MORI 3, JUN-ICHI HAMADA 3, HIROYUKI HASHIGUCHI 4, YUDI IMAN TAUHID 5, TIEN
Arizona Climate Summary February 2015 Summary of conditions for January 2015
 Arizona Climate Summary February 2015 Summary of conditions for January 2015 January 2015 Temperature and Precipitation Summary January 1 st 14 th : January started off with a very strong low pressure
Frank and Charles Cohen Department of Meteorology The Pennsylvania State University University Park, PA, 16801 -U.S.A.
 376 THE SIMULATION OF TROPICAL CONVECTIVE SYSTEMS William M. Frank and Charles Cohen Department of Meteorology The Pennsylvania State University University Park, PA, 16801 -U.S.A. ABSTRACT IN NUMERICAL
CHAPTER 5 Lectures 10 & 11 Air Temperature and Air Temperature Cycles
 CHAPTER 5 Lectures 10 & 11 Air Temperature and Air Temperature Cycles I. Air Temperature: Five important factors influence air temperature: A. Insolation B. Latitude C. Surface types D. Coastal vs. interior
ENSO Cycle: Recent Evolution, Current Status and Predictions. Update prepared by Climate Prediction Center / NCEP 9 May 2011
 ENSO Cycle: Recent Evolution, Current Status and Predictions Update prepared by Climate Prediction Center / NCEP 9 May 2011 Outline Overview Recent Evolution and Current Conditions Oceanic Niño Index (ONI)
Renewable Energy. Solar Power. Courseware Sample 86352-F0
 Renewable Energy Solar Power Courseware Sample 86352-F0 A RENEWABLE ENERGY SOLAR POWER Courseware Sample by the staff of Lab-Volt Ltd. Copyright 2009 Lab-Volt Ltd. All rights reserved. No part of this
J3.3 AN END-TO-END QUALITY ASSURANCE SYSTEM FOR THE MODERNIZED COOP NETWORK
 J3.3 AN END-TO-END QUALITY ASSURANCE SYSTEM FOR THE MODERNIZED COOP NETWORK Christopher A. Fiebrich*, Renee A. McPherson, Clayton C. Fain, Jenifer R. Henslee, and Phillip D. Hurlbut Oklahoma Climatological
Diurnal Cycle of Convection at the ARM SGP Site: Role of Large-Scale Forcing, Surface Fluxes, and Convective Inhibition
 Thirteenth ARM Science Team Meeting Proceedings, Broomfield, Colorado, March 31-April 4, 23 Diurnal Cycle of Convection at the ARM SGP Site: Role of Large-Scale Forcing, Surface Fluxes, and Convective
A.4 SEVERE WEATHER PLAN
 Page 1 of 5 A.4 SEVERE WEATHER PLAN 1.0 Purpose 1.1 The purpose of this Severe Weather Response Plan is to minimize the impact on the University from a severe weather incident 2.0 Applicability 2.1 This
Climatography of the United States No. 20 1971-2000
 Climate Division: CA 6 NWS Call Sign: SAN Month (1) Min (2) Month(1) Extremes Lowest (2) Temperature ( F) Lowest Month(1) Degree s (1) Base Temp 65 Heating Cooling 100 Number of s (3) Jan 65.8 49.7 57.8
ESSENTIAL COMPONENTS OF WATER-LEVEL MONITORING PROGRAMS. Selection of Observation Wells
 ESSENTIAL COMPONENTS OF WATER-LEVEL MONITORING PROGRAMS Before discussing the uses and importance of long-term water-level data, it is useful to review essential components of a water-level monitoring
CLOUD COVER IMPACT ON PHOTOVOLTAIC POWER PRODUCTION IN SOUTH AFRICA
 CLOUD COVER IMPACT ON PHOTOVOLTAIC POWER PRODUCTION IN SOUTH AFRICA Marcel Suri 1, Tomas Cebecauer 1, Artur Skoczek 1, Ronald Marais 2, Crescent Mushwana 2, Josh Reinecke 3 and Riaan Meyer 4 1 GeoModel
Water & Climate Review
 Water & Climate Review 1. The cross section below shows the direction of air flowing over a mountain. Points A and B are at the same elevation on opposite sides of the mountain. 4. The graph below shows
Climate and Weather. This document explains where we obtain weather and climate data and how we incorporate it into metrics:
 OVERVIEW Climate and Weather The climate of the area where your property is located and the annual fluctuations you experience in weather conditions can affect how much energy you need to operate your
REDUCING UNCERTAINTY IN SOLAR ENERGY ESTIMATES
 REDUCING UNCERTAINTY IN SOLAR ENERGY ESTIMATES Mitigating Energy Risk through On-Site Monitoring Marie Schnitzer, Vice President of Consulting Services Christopher Thuman, Senior Meteorologist Peter Johnson,
Section 5 CLIMATE TABLES
 Section Section CLIMATE SOURCES OF DATA... -1 HISTORICAL CONTEXT... -1 PRECIPITATION... -2 TEMPERATURES... -3 EVAPOTRANSPIRATION... -3 WIND SPEED AND DIRECTION... -4 DEGREE DAYS...-4 CONCLUSIONS AND RECOMMENDATIONS...