AGENDA: INTRODUCTION: 1. How is our cloud monitoring setup? 2. Which are the tools used? 3. How do we access monitoring dashboard?
|
|
|
- Buddy Goodman
- 8 years ago
- Views:
Transcription

1 Nagios Introduction

2 AGENDA: INTRODUCTION: 1. How is our cloud monitoring setup? 2. Which are the tools used? 3. How do we access monitoring dashboard? 4. What are the user id / password? 5. How to check the alerts received is fixed or still exist? 6. Nagios Tactical View? 7. Host Trends or Status History? 8. Check_mk Status Detail Screen?

3 How is our cloud Monitoring setup? Cybercon P2P Link URL: vxchnge SET UP CentOS 6.X Nagios Core Version:4.0.3 Nagios Graph Version: 1.5 Nagios agios/ Navisite

4 Which are the tools used? Nagios Nagios is a powerful, enterprise-class host, service, application, and network monitoring program. Designed to be fast, flexible, and rock-solid stable. Nagios runs on *NIX hosts and can monitor Windows, Linux/Unix/BSD, Netware, and network devices. Check_mk Check_mk is an extension to the Nagios monitoring system. Offloading work from the Nagios core to make it scale better, allowing more systems to be monitored from a single Nagios server. OSSEC HIDS OSSEC is an Open Source Host-based Intrusion Detection System that performs log analysis, file integrity checking, policy monitoring, rootkit detection, real-time alerting and active response. ALERTBOT AlertBot is an industry leader in URL monitoring service. AlertBot monitors URL`s with the goal of gathering performance data and alerting the company of failures. DELL Open Manage Server Administrator Server Administrator is designed for system administrators to manage systems locally and remotely on a network. Which we Integrated with Nagios for Hardware health monitoring.


5 How do we access Monitoring Dashboard? URL: Click on NOC, It will redirect to Datacenter wise Monitoring page : For example, if we will click on Cybercon and Vxchnge, it will redirect to login page: User ID : nocguest Password: M3tr1c*321

6 How do we access Monitoring Dashboard? After providing the details, it will land to Nagios Dashboard:

 For Hosts: https://cloudmgmt.metricstream.")
7 How to check the alerts Received is fixed or not? For Services: Problems Services (Unhandled) For Hosts: Problems Hosts (Unhandled) To check Individual Servers Type <Hostname> in Search Option Example : Sterlingapp*


8 Nagios Tactical View:

9 Host Trends or Status History:


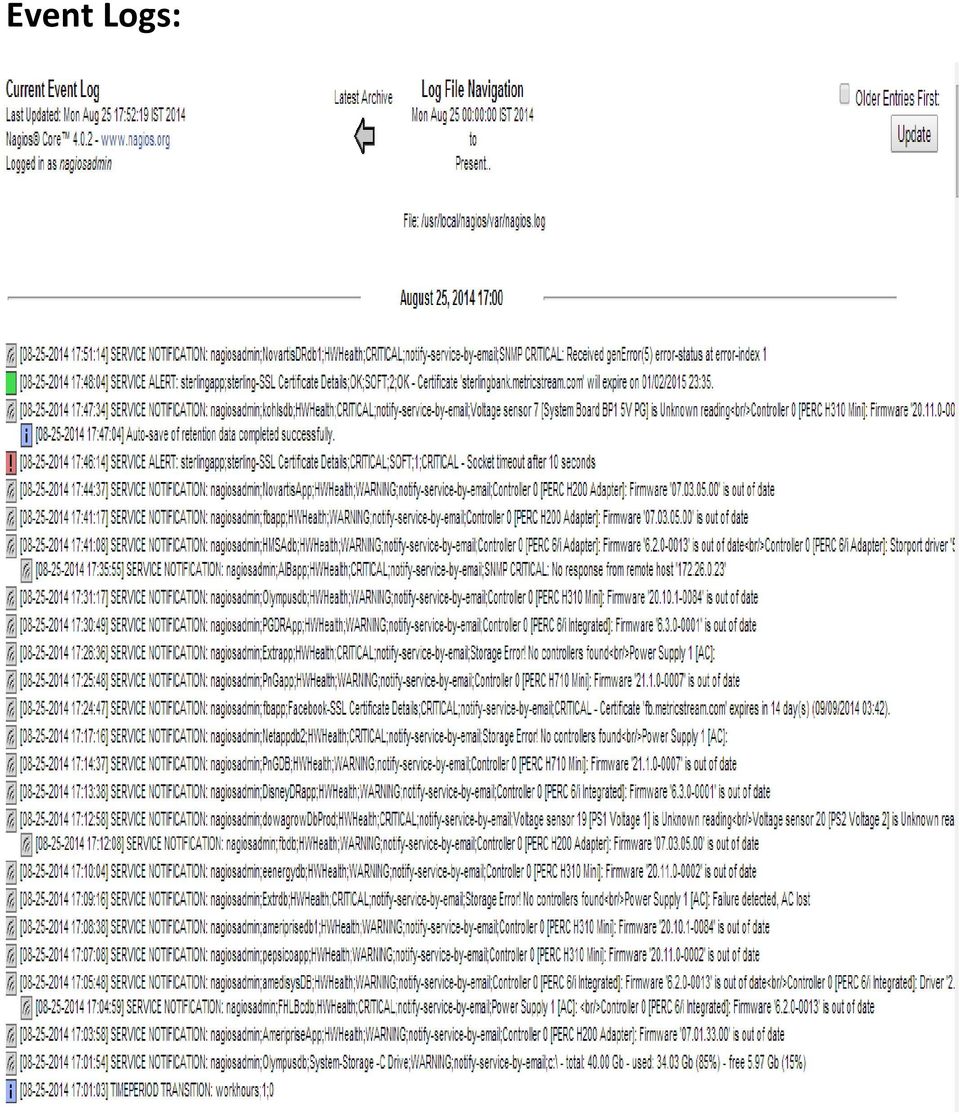
10 Event Logs:
11 Check_mk Status Detail Screen: Check_mk Dashboard Check_mk Hosts Check_mk Individual Host Check_mk Alerts

12 Check_mk Status Detail Screen: Check_mk 1. It can be used as a front-end and extension of a Nagios monitoring systems, for monitoring performance and health of networking devices, servers and infrastructure systems. 2. Auto detection of configuration of data points in a monitored system (inventory) 3. special checks in addition to standard Nagios plugins. 4. Agentless (SNMP-based) monitoring 5. Replacement of standard Nagios GUI and centralized monitoring 6. Graphical administration of the monitoring system 7. Filtering, viewing and alerting for log files and event data like SNMP traps.
 monitoring 5.")


13 Cloud Monitoring

14 Agenda: 1. What are the System / Application / Database alerts enabled? 2. What are the hardware monitoring alerts enabled? 3. Nagios setup for alert mechanism and which are DL s enabled for action? 4. How Nagios helps cloud applications monitoring? 5. What can it do? 6. Whom to reach if its Server related, application, SSL, Network, False alert? 7. How PE can create their own SOP s to handle such alerts to improve their work efficiency? 8. Road map?

15 What are the System / App / DB alerts Enabled? System Monitoring Enabled: 1. Disk usage 2. System CPU Load 3. System UP time 4. System Memory Usage Application Monitoring Enabled: Service Monitoring like Apache Tomcat Open office Oracle DB Tns Listener SSL expiry Monitoring Oracle health (tnsping, tablespace, invalid objects)

16 What are the Hardware alerts Enabled? Hardware Monitoring Enabled: Plugin Features: Storage components checked: Controllers Physical drives Logical drives Cache batteries Connectors (channels) Enclosures Enclosure fans Enclosure power supplies Enclosure temperature probes Enclosure management modules (EMMs)
 Enclosures Enclosure fans Enclosure power supplies Enclosure")
17 Nagios Setup For alert Mechanism: Harddisk Space Issue If space consumption is below 85% If space consumption is between 85%-95% If space consumption is above 95% Memory Usage Issue If RAM usage is below 85% If RAM usage is between 85%-90% If RAM usage is above 90% System Uptime System Running Perfectly Host Down Host Up

18 Nagios Setup For alert Mechanism: Application Monitoring Apache Tomcat Open office Oracle If Service is running If the service was stopped or if there was any issue. SSL Monitoring More than 30 Days 15 to 30 Days 0 to 15 Days

19 How Nagios helps cloud applications monitoring? Avoidance of Too many red flashing lights Just the facts only want root cause failures to be reported, not cascade of every downstream failure. Avoids unnecessary checks e.g. HTTP responds, therefore no need to ping e.g. power outage, no ping response, so don t bother trying anything else Services are running fine no need to do check if the host itself is alive What Can it Do? Individual node status Is it up? What is its load? What is the memory and swap usage? NFS and network load? Are the partitions full? Are applications and services running properly? How about ping latency? Aggregated node status Same info, but across groups of nodes

20 Notification Examples

21 How PE can Create their own SOP? Relook at the Existing SOP`s of PE followed already for outages or Customer cases. Based on the alert received and action to be taken existing SOP`s to be updated with the Monitoring Capabilities by PE. Road Map: Nagios upcoming features. 1. Merging both Nagios site Vxchnge and Navisite in Check_mk for single view. 2. MetricStream ECP license expire alert intimation 3. Oracle schema user expire alert intimation. 4. Graphical report on alerts for easy sort. 5. Grouping the host base customer for easy view. 6. Account wise grouping for easy view.
Nagios introduction. Dhruba Raj Bhandari (CCNA) Additions by Phil Regnauld. bhandari.dhruba@scp.com.np
 Additions by Phil Regnauld. bhandari.dhruba@scp.com.np") Nagios introduction Dhruba Raj Bhandari (CCNA) Additions by Phil Regnauld bhandari.dhruba@scp.com.np Why Nagios? Open source Relatively scaleable, Manageable, Secure and more Best documentation available
Nagios introduction Dhruba Raj Bhandari (CCNA) Additions by Phil Regnauld bhandari.dhruba@scp.com.np Why Nagios? Open source Relatively scaleable, Manageable, Secure and more Best documentation available
OMNITURE MONITORING. Ensuring the Security and Availability of Customer Data. June 16, 2008 Version 2.0
 Ensuring the Security and Availability of Customer Data June 16, 2008 Version 2.0 CHAPTER 1 1 Omniture Monitoring The Omniture Network Operations (NetOps) team has built a highly customized monitoring
MONITORING RED HAT GLUSTER SERVER DEPLOYMENTS With the Nagios IT infrastructure monitoring tool
 TECHNOLOGY DETAIL MONITORING RED HAT GLUSTER SERVER DEPLOYMENTS With the Nagios IT infrastructure monitoring tool INTRODUCTION Storage system monitoring is a fundamental task for a storage administrator.
Application Discovery Manager User s Guide vcenter Application Discovery Manager 6.2.1
 Application Discovery Manager User s Guide vcenter Application Discovery Manager 6.2.1 This document supports the version of each product listed and supports all subsequent versions until the document
A SURVEY ON AUTOMATED SERVER MONITORING
 A SURVEY ON AUTOMATED SERVER MONITORING S.Priscilla Florence Persis B.Tech IT III year SNS College of Engineering,Coimbatore. priscillapersis@gmail.com Abstract This paper covers the automatic way of server
Network Monitoring. Dhruba Raj Bhandari (CCNA) Manager Systems Soaltee Crowne Plaza Kathmandu NEPAL bhandari.dhruba@scp.com.np
 Manager Systems Soaltee Crowne Plaza Kathmandu NEPAL bhandari.dhruba@scp.com.np") Network Monitoring Dhruba Raj Bhandari (CCNA) Manager Systems Soaltee Crowne Plaza Kathmandu NEPAL bhandari.dhruba@scp.com.np Welcome! Network Management Workshop Network Monitoring Concepts, Tools And
Network Monitoring Dhruba Raj Bhandari (CCNA) Manager Systems Soaltee Crowne Plaza Kathmandu NEPAL bhandari.dhruba@scp.com.np Welcome! Network Management Workshop Network Monitoring Concepts, Tools And
mbits Network Operations Centrec
 mbits Network Operations Centrec The mbits Network Operations Centre (NOC) is co-located and fully operationally integrated with the mbits Service Desk. The NOC is staffed by fulltime mbits employees,
NMS300 Network Management System
 NMS300 Network Management System User Manual June 2013 202-11289-01 350 East Plumeria Drive San Jose, CA 95134 USA Support Thank you for purchasing this NETGEAR product. After installing your device, locate
Implementing a secure high visited web site by using of Open Source softwares. S.Dawood Sajjadi Maryam Tanha. University Putra Malaysia (UPM)
") Implementing of an open source high visited web site 1 Implementing a secure high visited web site by using of Open Source softwares S.Dawood Sajjadi Maryam Tanha University Putra Malaysia (UPM) March
Implementing of an open source high visited web site 1 Implementing a secure high visited web site by using of Open Source softwares S.Dawood Sajjadi Maryam Tanha University Putra Malaysia (UPM) March
Amahi Instruction Manual
 History of Amahi Chapter 1 Installing fedora 12 and Amahi Home Digital Assistant (HDA) Chapter 2 Your DHCP/DNS options Chapter 3 Network Troubleshooting Chapter 4 Getting Started Appendix: Advanced Hard
HPCC Monitoring and Reporting (Technical Preview) Boca Raton Documentation Team
 Boca Raton Documentation Team") HPCC Monitoring and Reporting (Technical Preview) Boca Raton Documentation Team HPCC Monitoring and Reporting (Technical Preview) Boca Raton Documentation Team Copyright 2015 HPCC Systems. All rights reserved
HPCC Monitoring and Reporting (Technical Preview) Boca Raton Documentation Team HPCC Monitoring and Reporting (Technical Preview) Boca Raton Documentation Team Copyright 2015 HPCC Systems. All rights reserved
Network Monitoring Comparison
 Network Monitoring Comparison vs Network Monitoring is essential for every network administrator. It determines how effective your IT team is at solving problems or even completely eliminating them. Even
Availability Management Nagios overview. TEIN2 training Bangkok September 2005
 1 Availability Management Nagios overview Agenda 2 Introduction Objectives Functionalities Requirement. Architecture & Operation Operation Description WEB portal Plugins and extensions Plugins description
CSS ONEVIEW G-Cloud CA Nimsoft Monitoring
 CSS ONEVIEW G-Cloud CA Nimsoft Monitoring Service Definition 01/04/2014 CSS Delivers Contents Contents... 2 Executive Summary... 3 Document Audience... 3 Document Scope... 3 Information Assurance:... 3
Maintaining Non-Stop Services with Multi Layer Monitoring
 Maintaining Non-Stop Services with Multi Layer Monitoring Lahav Savir System Architect and CEO of Emind Systems lahavs@emindsys.com www.emindsys.com The approach Non-stop applications can t leave on their
MySQL Enterprise Monitor
 MySQL Enterprise Monitor Lynn Ferrante Principal Sales Consultant 1 Program Agenda MySQL Enterprise Monitor Overview Architecture Roles Demo 2 Overview 3 MySQL Enterprise Edition Highest Levels of Security,
FUNCTIONAL OVERVIEW www.amdosoft.com
 Business Process Protectors Business Service Management Active Error Identification Event Driven Automation Error Handling and Escalation Intelligent Notification Process Reporting IT Management Business
EMS. Trap Collection Active Alarm Alarms sent by E-mail & SMS. Location, status and serial numbers of all assets can be managed and exported
 EMS SmartView TM Superior Design with Real-Time Monitor and Control Trap Collection Active Alarm Alarms sent by E-mail & SMS Network Topology Network Element Discovery Network Element Configuration Location,
Dell Server Management Pack Suite Version 6.0 for Microsoft System Center Operations Manager User's Guide
 Dell Server Management Pack Suite Version 6.0 for Microsoft System Center Operations Manager User's Guide Notes, Cautions, and Warnings NOTE: A NOTE indicates important information that helps you make
SMARTcontrol. Dashboard. from
 SMARTcontrol from 1% Dashboard The Dashboard gives you a real time view of hardware states in an easy to read graph and gauge layout. The system allows you to show data from as far back as 48 hours. Performance
COMMANDS 1 Overview... 1 Default Commands... 2 Creating a Script from a Command... 10 Document Revision History... 10
 LabTech Commands COMMANDS 1 Overview... 1 Default Commands... 2 Creating a Script from a Command... 10 Document Revision History... 10 Overview Commands in the LabTech Control Center send specific instructions
Proactive Network Performance Monitoring
 Proactive Network Performance Monitoring No other tool is as flexible and robust as Goliath Performance Monitor We have been using Goliath Performance Monitor for many years. We have looked at other tools
PANDORA FMS NETWORK DEVICE MONITORING
 NETWORK DEVICE MONITORING pag. 2 INTRODUCTION This document aims to explain how Pandora FMS is able to monitor all network devices available on the marke such as Routers, Switches, Modems, Access points,
Command Center 5.0 2015-05-15 13:29:23 UTC. 2015 Citrix Systems, Inc. All rights reserved. Terms of Use Trademarks Privacy Statement
 Command Center 5.0 2015-05-15 13:29:23 UTC 2015 Citrix Systems, Inc. All rights reserved. Terms of Use Trademarks Privacy Statement Contents Command Center 5.0... 11 Command Center 5.0... 13 Release Notes...
HP OO 10.X - SiteScope Monitoring Templates
 HP OO Community Guides HP OO 10.X - SiteScope Monitoring Templates As with any application continuous automated monitoring is key. Monitoring is important in order to quickly identify potential issues,
SapphireIMS Business Service Monitoring Feature Specification
 SapphireIMS Business Service Monitoring Feature Specification All rights reserved. COPYRIGHT NOTICE AND DISCLAIMER No parts of this document may be reproduced in any form without the express written permission
Datasheet FUJITSU Cloud Monitoring Service
 Datasheet FUJITSU Cloud Monitoring Service FUJITSU Cloud Monitoring Service powered by CA Technologies offers a single, unified interface for tracking all the vital, dynamic resources your business relies
Informatica Corporation Proactive Monitoring for PowerCenter Operations Version 3.0 Release Notes May 2014
 Contents Informatica Corporation Proactive Monitoring for PowerCenter Operations Version 3.0 Release Notes May 2014 Copyright (c) 2012-2014 Informatica Corporation. All rights reserved. Installation...
Quick Start Guide. www.uptrendsinfra.com
 Quick Start Guide Uptrends Infra is a cloud service that monitors your on-premise hardware and software infrastructure. This Quick Start Guide contains the instructions to get you up to speed with your
PANDORA FMS NETWORK DEVICES MONITORING
 NETWORK DEVICES MONITORING pag. 2 INTRODUCTION This document aims to explain how Pandora FMS can monitor all the network devices available in the market, like Routers, Switches, Modems, Access points,
Managing your Red Hat Enterprise Linux guests with RHN Satellite
 Managing your Red Hat Enterprise Linux guests with RHN Satellite Matthew Davis, Level 1 Production Support Manager, Red Hat Brad Hinson, Sr. Support Engineer Lead System z, Red Hat Mark Spencer, Sr. Solutions
OS Installation Guide Red Hat Linux 9.0
 OS Installation Guide Red Hat Linux 9.0 C o n t e n t s Contents 3 About This Guide 5 1 Planning Your Installation 7 Requirements 7 2 Installing Red Hat 9.0 Error! Bookmark not defined. What s Next? 19
Tushar Joshi Turtle Networks Ltd
 MySQL Database for High Availability Web Applications Tushar Joshi Turtle Networks Ltd www.turtle.net Overview What is High Availability? Web/Network Architecture Applications MySQL Replication MySQL Clustering
Centralized Orchestration and Performance Monitoring
 DATASHEET NetScaler Command Center Centralized Orchestration and Performance Monitoring Key Benefits Performance Management High Availability (HA) Support Seamless VPX management Enables Extensible architecture
Heroix Longitude Quick Start Guide V7.1
 Heroix Longitude Quick Start Guide V7.1 Copyright 2011 Heroix 165 Bay State Drive Braintree, MA 02184 Tel: 800-229-6500 / 781-848-1701 Fax: 781-843-3472 Email: support@heroix.com Notice Heroix provides
The Monitis Monitoring Agent ver. 1.2
 The Monitis Monitoring Agent ver. 1.2 General principles, Security and Performance Monitis provides a server and network monitoring agent that can check the health of servers, networks and applications
HP Insight Management Agents architecture for Windows servers
 HP Insight Management Agents architecture for Windows servers Technology brief, 2 nd edition Introduction... 3 A first look at the Insight Management Agents architecture... 3 HP Insight Management agents...
One software solution to monitor your entire network, including devices, applications traffic and availability.
 One software solution to monitor your entire network, including devices, applications traffic and availability. About Britannic Expert Integrators We are award winning specialists in IP communications,
Network Monitoring. Easy, failsafe, and complete visibility of your network. Our customers have the same view as our NOC technicians.
 One software solution to monitor your entire network, including devices, applications, traffic, and availability. Network monitoring is the constant evaluation fo your systems performance within the IT
1 Data Center Infrastructure Remote Monitoring
 Page 1 of 7 Service Description: Cisco Managed Services for Data Center Infrastructure Technology Addendum to Cisco Managed Services for Enterprise Common Service Description This document referred to
Products and Solutions
 Products and Solutions Olivier Beutels Sales Manager SkySQL Ab Vangelis Katsikaros Partner Oracle, MySQL and InnoDB are registered trademarks of Oracle and/or its affiliates. Other names may be trademarks
Chapter 8 Monitoring and Logging
 Chapter 8 Monitoring and Logging This chapter describes the SSL VPN Concentrator status information, logging, alerting and reporting features. It describes: SSL VPN Concentrator Status Active Users Event
Using the VCDS Application Monitoring Tool
 CHAPTER 5 This chapter describes how to use Cisco VQE Client Configuration Delivery Server (VCDS) Application Monitoring Tool (AMT). VCDS is a software component installed on each VQE Tools server, the
Centerity Monitor Standard V3.8 USER GUIDE VERSION 7.14
 Centerity Monitor Standard V3.8 USER GUIDE VERSION 7.14 2 Contents About This Guide... 4 End-User License Agreement (EULA)... 4 Before You Begin... 4 Audience... 4 Related Documentation... 4 Chapter 1:
The data between TC Monitor and remote devices is exchanged using HTTP protocol. Monitored devices operate either as server or client mode.
 1. Introduction TC Monitor is easy to use Windows application for monitoring and control of some Teracom Ethernet (TCW) and GSM/GPRS (TCG) controllers. The supported devices are TCW122B-CM, TCW181B- CM,
Dell Server Management Pack Suite Version 5.0.1 For Microsoft System Center Operations Manager And System Center Essentials User s Guide
 Dell Server Management Pack Suite Version 5.0.1 For Microsoft System Center Operations Manager And System Center Essentials User s Guide Notes, Cautions, and Warnings NOTE: A NOTE indicates important information
There are numerous ways to access monitors:
 Remote Monitors REMOTE MONITORS... 1 Overview... 1 Accessing Monitors... 1 Creating Monitors... 2 Monitor Wizard Options... 11 Editing the Monitor Configuration... 14 Status... 15 Location... 17 Alerting...
Using New Relic to Monitor Your Servers
 TUTORIAL Using New Relic to Monitor Your Servers by Alan Skorkin Contents Introduction 3 Why Do I Need a Service to Monitor Boxes at All? 4 It Works in Real Life 4 Installing the New Relic Server Monitoring
Java, PHP & Ruby - Cloud Hosting
 Java, PHP & Ruby - Cloud Hosting NO LOCK-IN No technical lock-in and no binding contract. We believe in open standards without any technical lock-ins. We think that Open source provides flexibility and
Centerity Monitor Standard V3.8.4 USER GUIDE VERSION 9.15
 Centerity Monitor Standard V3.8.4 USER GUIDE VERSION 9.15 2 Contents About This Guide... 4 End-User License Agreement (EULA)... 4 Before You Begin... 4 Audience... 4 Related Documentation... 4 Technical
Online Help StruxureWare Data Center Expert
 Online Help StruxureWare Data Center Expert Version 7.2.1 What's New in StruxureWare Data Center Expert 7.2.x Learn more about the new features available in the StruxureWare Data Center Expert 7.2.x release.
IBM. Vulnerability scanning and best practices
 IBM Vulnerability scanning and best practices ii Vulnerability scanning and best practices Contents Vulnerability scanning strategy and best practices.............. 1 Scan types............... 2 Scan duration
Edge Configuration Series Reporting Overview
 Reporting Edge Configuration Series Reporting Overview The Reporting portion of the Edge appliance provides a number of enhanced network monitoring and reporting capabilities. WAN Reporting Provides detailed
DOSarrest External MULTI-SENSOR ARRAY FOR ANALYSIS OF YOUR CDN'S PERFORMANCE IMMEDIATE DETECTION AND REPORTING OF OUTAGES AND / OR ISSUES
 .com DOSarrest External Monitoring S ystem (DEMS) User s Guide REAL BROWSER MONITORING OF YOUR WEBSITE MULTI-SENSOR ARRAY FOR ANALYSIS OF YOUR CDN'S PERFORMANCE IMMEDIATE DETECTION AND REPORTING OF OUTAGES
ZEN LOAD BALANCER EE v3.02 DATASHEET The Load Balancing made easy
 ZEN LOAD BALANCER EE v3.02 DATASHEET The Load Balancing made easy OVERVIEW The global communication and the continuous growth of services provided through the Internet or local infrastructure require to
WINDOWS SERVER MONITORING
 WINDOWS SERVER Server uptime, all of the time CNS Windows Server Monitoring provides organizations with the ability to monitor the health and availability of their Windows server infrastructure. Through
Cisco Application Networking Manager Version 2.0
 Cisco Application Networking Manager Version 2.0 Cisco Application Networking Manager (ANM) software enables centralized configuration, operations, and monitoring of Cisco data center networking equipment
Tk20 Network Infrastructure
 Tk20 Network Infrastructure Tk20 Network Infrastructure Table of Contents Overview... 4 Physical Layout... 4 Air Conditioning:... 4 Backup Power:... 4 Personnel Security:... 4 Fire Prevention and Suppression:...
Dell OpenManage Mobile Version 1.4 User s Guide (Android)
") Dell OpenManage Mobile Version 1.4 User s Guide (Android) Notes, cautions, and warnings NOTE: A NOTE indicates important information that helps you make better use of your computer. CAUTION: A CAUTION
Dell OpenManage Mobile Version 1.4 User s Guide (Android) Notes, cautions, and warnings NOTE: A NOTE indicates important information that helps you make better use of your computer. CAUTION: A CAUTION
Migration and Building of Data Centers in IBM SoftLayer with the RackWare Management Module
 Migration and Building of Data Centers in IBM SoftLayer with the RackWare Management Module June, 2015 WHITE PAPER Contents Advantages of IBM SoftLayer and RackWare Together... 4 Relationship between
Red Hat Network Satellite Management and automation of your Red Hat Enterprise Linux environment
 Red Hat Network Satellite Management and automation of your Red Hat Enterprise Linux environment WHAT IS IT? Red Hat Network (RHN) Satellite server is an easy-to-use, advanced systems management platform
ENTERPRISE-CLASS MONITORING SOLUTION FOR EVERYONE ALL-IN-ONE OPEN-SOURCE DISTRIBUTED MONITORING
 ENTERPRISE-CLASS MONITORING SOLUTION FOR EVERYONE ALL-IN-ONE OPEN-SOURCE DISTRIBUTED MONITORING 1 CONTENTS About Zabbix Software... 2 Main Functions... 3 Architecture... 4 Installation Requirements...
Acronis Monitoring Service
 Acronis Monitoring Service USER GUIDE Table of contents 1 About the Acronis Monitoring Service...4 2 Software Requirements...4 3 Understanding basic concepts...5 4 Getting started...7 4.1 Setting up website
Red Hat Satellite Management and automation of your Red Hat Enterprise Linux environment
 Red Hat Satellite Management and automation of your Red Hat Enterprise Linux environment WHAT IS IT? Red Hat Satellite server is an easy-to-use, advanced systems management platform for your Linux infrastructure.
HP Server Management Packs for Microsoft System Center Essentials User Guide
 HP Server Management Packs for Microsoft System Center Essentials User Guide Part Number 460344-001 September 2007 (First Edition) Copyright 2007 Hewlett-Packard Development Company, L.P. The information
Monitor all of your critical infrastructure from a single, integrated system.
 Monitor all of your critical infrastructure from a single, integrated system. Do you know what s happening on your network right now? Take control of your network with real-time insight! When you know
Mitel MarWatch. Webinar. Pardeep Koonar Director of Sales Martello Technologies November 13, 2014
 Mitel MarWatch Webinar Pardeep Koonar Director of Sales Martello Technologies November 13, 2014 MarWatch Business Case 1,000+ accounts already use it. PROBLEM Version 5 - five years of in-market operation.
Policy Compliance. Getting Started Guide. January 22, 2016
 Policy Compliance Getting Started Guide January 22, 2016 Copyright 2011-2016 by Qualys, Inc. All Rights Reserved. Qualys and the Qualys logo are registered trademarks of Qualys, Inc. All other trademarks
TITANXR Multi-Switch Management Software
 TITANXR Multi-Switch Management Software Centralized management of APCON network monitoring switches Features Centralized APCON system management View status and alerts Configurable Dashboards Monitor
Introduction Installation firewall analyzer step by step installation Startup Syslog and SNMP setup on firewall side firewall analyzer startup
 Introduction Installation firewall analyzer step by step installation Startup Syslog and SNMP setup on firewall side firewall analyzer startup Configuration Syslog server add and check Configure SNMP on
SapphireIMS 4.0 BSM Feature Specification
 SapphireIMS 4.0 BSM Feature Specification v1.4 All rights reserved. COPYRIGHT NOTICE AND DISCLAIMER No parts of this document may be reproduced in any form without the express written permission of Tecknodreams
Barracuda Load Balancer Online Demo Guide
 Barracuda Load Balancer Online Demo Guide Rev 1.3 October 04, 2012 Product Introduction The Barracuda Networks Load Balancer provides comprehensive IP load balancing capabilities to any IP-based application,
Management of VMware ESXi. on HP ProLiant Servers
 Management of VMware ESXi on W H I T E P A P E R Table of Contents Introduction................................................................ 3 HP Systems Insight Manager.................................................
Agent-free Inventory and Monitoring for Storage and Network Devices in Dell PowerEdge 12 th Generation Servers
 Agent-free Inventory and Monitoring for Storage and Network Devices in Dell PowerEdge 12 th Generation Servers This Dell Technical White Paper provides an overview on the agent-free monitoring feature
MONyog White Paper. Webyog
 1. Executive Summary... 2 2. What is the MONyog - MySQL Monitor and Advisor?... 2 3. What is agent-less monitoring?... 3 4. Is MONyog customizable?... 4 5. Comparison between MONyog and other Monitoring
Network Monitoring User Guide
 Network Monitoring User Guide 2007 Belkin Corporation. All rights reserved. F1DUXXX All trade names are registered trademarks of respective manufacturers listed. Table of Contents Pulse TM Overview 1 Pulse
Automated System Monitoring
 Automated System Monitoring Josh Malone jmalone@nrao.edu Systems Administrator National Radio Astronomy Observatory Charlottesville, VA https://blogs.nrao.edu/jmalone 2 One night, about 8 or 9 years ago,
PRTG NETWORK MONITOR. Installed in Seconds. Configured in Minutes. Masters Your Network for Years to Come.
 PRTG NETWORK MONITOR Installed in Seconds. Configured in Minutes. Masters Your Network for Years to Come. PRTG Network Monitor is... NETWORK MONITORING Network monitoring continuously collects current
Getting Started with PRTG Network Monitor 2012 Paessler AG
 Getting Started with PRTG Network Monitor 2012 Paessler AG All rights reserved. No parts of this work may be reproduced in any form or by any means graphic, electronic, or mechanical, including photocopying,
Application Performance Management for Enterprise Applications
 Application Performance Management for Enterprise Applications White Paper from ManageEngine Web: Email: appmanager-support@manageengine.com Table of Contents 1. Introduction 2. Types of applications used
Migration and Building of Data Centers in IBM SoftLayer with the RackWare Management Module
 Migration and Building of Data Centers in IBM SoftLayer with the RackWare Management Module June, 2015 WHITE PAPER Contents Advantages of IBM SoftLayer and RackWare Together... 4 Relationship between
OpenLoad - Rapid Performance Optimization Tools & Techniques for CF Developers
 OpenDemand Systems, Inc. OpenLoad - Rapid Performance Optimization Tools & Techniques for CF Developers Speed Application Development & Improve Performance November 11, 2003 True or False? Exposing common
Configuring SNMP. 2012 Cisco and/or its affiliates. All rights reserved. 1
 Configuring SNMP 2012 Cisco and/or its affiliates. All rights reserved. 1 The Simple Network Management Protocol (SNMP) is part of TCP/IP as defined by the IETF. It is used by network management systems
Juniper Networks Management Pack Documentation
 Juniper Networks Management Pack Documentation Juniper Networks Data Center Switching Management Pack for VMware vrealize Operations (vrops) Release 2.5 Modified: 2015-10-12 Juniper Networks, Inc. 1133
OnCommand Performance Manager 1.1
 OnCommand Performance Manager 1.1 Installation and Setup Guide For Red Hat Enterprise Linux NetApp, Inc. 495 East Java Drive Sunnyvale, CA 94089 U.S. Telephone: +1 (408) 822-6000 Fax: +1 (408) 822-4501
PRTG NETWORK MONITOR. Installed in Seconds. Configured in Minutes. Master Your Network for Years to Come.
 PRTG NETWORK MONITOR Installed in Seconds. Configured in Minutes. Master Your Network for Years to Come. PRTG Network Monitor is... NETWORK MONITORING Network monitoring continuously collects current status
DEPLOYMENT GUIDE Version 1.2. Deploying F5 with Microsoft Exchange Server 2007
 DEPLOYMENT GUIDE Version 1.2 Deploying F5 with Microsoft Exchange Server 2007 Table of Contents Table of Contents Deploying F5 devices with Microsoft Exchange Server 2007 Client Access Servers Prerequisites
DreamFactory on Microsoft SQL Azure
 DreamFactory on Microsoft SQL Azure Account Setup and Installation Guide For general information about the Azure platform, go to http://www.microsoft.com/windowsazure/. For general information about the
Remote Support Competitive Overview
 Competitive Brief Remote Support Competitive Overview April 2014 HP Restricted for HP and Channel Partner Internal Use Only Executive Summary HP remote support and HP Insight Online help customers and
echomountain Enterprise Monitoring, Notification & Reporting Services Protect your business
 Protect your business Enterprise Monitoring, Notification & Reporting Services echomountain 1483 Patriot Blvd Glenview, IL 60026 877.311.1980 sales@echomountain.com echomountain Enterprise Monitoring,
ZABBIX. An Enterprise-Class Open Source Distributed Monitoring Solution. Takanori Suzuki MIRACLE LINUX CORPORATION October 22, 2009
 ZABBIX An Enterprise-Class Open Source Distributed Monitoring Solution Takanori Suzuki MIRACLE LINUX CORPORATION October 22, 2009 Outline Biography ZABBIX New release ZABBIX 1.8 Activity in Japan Biography
Volume SYSLOG JUNCTION. User s Guide. User s Guide
 Volume 1 SYSLOG JUNCTION User s Guide User s Guide SYSLOG JUNCTION USER S GUIDE Introduction I n simple terms, Syslog junction is a log viewer with graphing capabilities. It can receive syslog messages
KEY FEATURES. EASY ACCESS Through web browser for both clients and administrators CLIENT MONITORING. Not dependant on access to site network
 Remote monitoring of all sites in one tool Monitor energy and performance on multiple sites Statistics on energy produced Instant status overview KPI (Key Performance Indicators) Alarms Detect underperforming
Agenda. Capacity Planning practical view CPU Capacity Planning LPAR2RRD LPAR2RRD. Discussion. Premium features Future
 Agenda Capacity Planning practical view CPU Capacity Planning LPAR2RRD LPAR2RRD Premium features Future Discussion What is that? Does that save money? If so then how? Have you already have an IT capacity
This document will list the ManageEngine Applications Manager best practices
 This document will list the ManageEngine Applications Manager best practices 1. Hardware and Software requirements 2. Configuring Applications Manager 3. Securing Applications Manager 4. Fault Management
Monitoring Remedy with BMC Solutions
 Monitoring Remedy with BMC Solutions Overview How does BMC Software monitor Remedy with our own solutions? The challenge is many fold with a solution like Remedy and this does not only apply to Remedy,
PRTG NETWORK MONITOR. Installed in Seconds. Configured in Minutes. Masters Your Network for Years to Come.
 PRTG NETWORK MONITOR Installed in Seconds. Configured in Minutes. Masters Your Network for Years to Come. PRTG Network Monitor is... NETWORK MONITORING Network monitoring continuously collects current
Security Best Practice
 Security Best Practice Presented by Muhibbul Muktadir Tanim mmtanim@gmail.com 1 Hardening Practice for Server Unix / Linux Windows Storage Cyber Awareness & take away Management Checklist 2 Hardening Server
Pandora FMS 3.0 Quick User's Guide: Network Monitoring. Pandora FMS 3.0 Quick User's Guide
 Pandora FMS 3.0 Quick User's Guide April 27th, 2009 1 Contents How to monitor a network computer/device?...3 Concepts...3 What's an agent?...3 What's a module?...3 Data transfer modes...3 What is an alert?...3
Your eyes in the network
 Your eyes in the network init.at informationstechnologie GmbH Tannhäuserplatz 2/5.OG 1150 Wien Austria Page 2 of 10 1 Table of contents 2 Why NOCTUA by init.at... 3 3 Your benefits with NOCTUA:... 4 4