Validation of measurement procedures
|
|
|
- Claud Rice
- 8 years ago
- Views:
Transcription
1 Validation of measurement procedures R. Haeckel and I.Püntmann Zentralkrankenhaus Bremen The new ISO standard which has already been accepted by most nations will soon become the basis for accreditation in many European countries. Subclause of this standard claims that the medical laboratory should only use validated procedures: "The laboratory shall use only validated procedures to confirm that the examination procedures are suitable for the intended use. Validations shall be as extensive as are necessary to meet the needs in the given application or field of application." The term validation has already been defined in ISO 9000:2000 and has been differentiated from verification: verification: confirmation, through the provision of objective evidence, that specified requirements have been fulfilled validation: confirmation, through the provision of objective evidence, that the requirement for a specific intended use or application have been fulfilled The definitions of both terms sound very similar. The only words which differ are set in italics. In other words: verification means testing characteristics which are typical for a instrument independent of a particular procedure, such as e.g. the quality of spectrometer filters; validation is testing the capability of an instrument for a particular procedure, e.g. for the measurement of the blood glucose concentration. The term validation is not familar to clinical chemists. In former times we always used the term evaluation. Validation only mean confirmation of claims, whereas evaluation may also include setting claims by experimental work. However in practice, both terms are used synonymously. In the new concept of the Directive 98/79 of the European Commission on in vitro diagnostic medical devices, industry will be responsible for the validation of commercially available test procedures. Validation must be performed by the laboratory only for in-house, or non-standardized, measurement procedures. A decade ago, the European Committe for Clinical Laboratory Standards (ECCLS) has developed a multicentre evaluation concept which is still valid. It consists of three steps: 1) Evaluation of prototypes by the manufacturer, perhaps in cooperation with user(s). 2) Multicentre evaluation: confirmation of the manufacturer s claims (product ready for introduction on the market).

2 3) Validation: short evaluation by each customer after purchase of the product. In step 3, some national accreditation bodies claim end-user protocols. The ECCLS document for procedure comparison evaluation is complemented by a new standard from the European Committee of Standardization (Performance evaluation of in vitro diagnostic medical devices) which is currently prepared. In the a note in the subclause of the new standard ISO 17025, which is a sister document to ISO 15189, designed for all laboratories, performance criteria for validation are listed: "The techniques used for the determination of the characteristics of a method should be one of, or a combination of, the following: calibration using reference standards or reference materials, comparison of results with other methods, interlaboratory comparisons, systematic assessment of the factors influencing the result, assessment of the uncertainty of the results based on scientific understanding of the theoretical principle of the method and practical experience." All characteristics and the tools how to study them, are well known. However, two characteristics which have changed somehow, will be discussed in more detail: uncertainty and method comparison. Three types of uncertainty have been defined: standard uncertainty (u): imprecision (standard deviation) combined uncertainty (uc): (u u 22 + u 3 2 ) 0,5 expanded uncertainty (U): ku c (if coverage factor k=2, level of confidence 95%) The standard uncertainty, that means the precision determined in the laboratory, is on one side a very useful operational quantity, but on the other side an artificial quantity which does not satisfy the clinician s need. The clinician requires an estimation of the total variability called uncertainty budget which also includes the preanalytical phase and other components. Because of the complexity of modelling the measurement procedure, influences of various input quantities have to be considered as possible sources of uncertainty: - incomplete definition of measurand, - sample heterogeneity - inexact value of calibrators (insufficient traceability) - matrix differences between calibrators and samples - stability of the sample, the analyte or reagents used

3 - presence of interfering compounds in the sample (lack of specificity) - imprecision of statistical algorithms used on results on calibrators - random variability inherent in the measurement process. The information of a large expanded uncertainty may not be very valuable in the treatment of an individual patient. Therefore, it will be necessary to rely on standard uncertainty (imprecision) and in-house reference ranges until the uncertainty is reduced to a reasonable level (Kristensen and Christensen, 1998). The major disadvantage of the new concept is that it is based on many (may be too many) assumptions. On the other side, it opens a new way of thinking. Another essential part of any measurement procedure validation is the comparison with another measurement procedure which is usually applied by the laboratory (see also note 2 of subclause in ISO 15189). Measurement procedure comparison studies are widely used in laboratory medicine to assess agreement between two measurement procedures which measure the same analyte. One measurement procedure is usually considered as the reference, the other one as the test measurement procedure, both of them measure with a certain degree of uncertainty. Usually they disagree to some extent. The question is: can the disagreement be tolerated. The results from comparison studies must be evaluated by two steps: Step 1: definition of the analytical (dis)agreement (conventional concept) Step 2: estimation of diagnostic relevance (future task) The first step is the definition of disagreement, the second step is to consider the acceptability of the detected disagreement concerning the intended purpose. The step 1 is probably familiar to most clinical chemists. It usually starts with the graphical presentation of the paired data obtained from several independent subjects. Two types are still en vogue: the difference plot or one of its modifications such as the normalized differences (Fig.1):
 assumptions. On the other side, it opens a new way of thinking.")
4 the x/y plot (Fig.2):
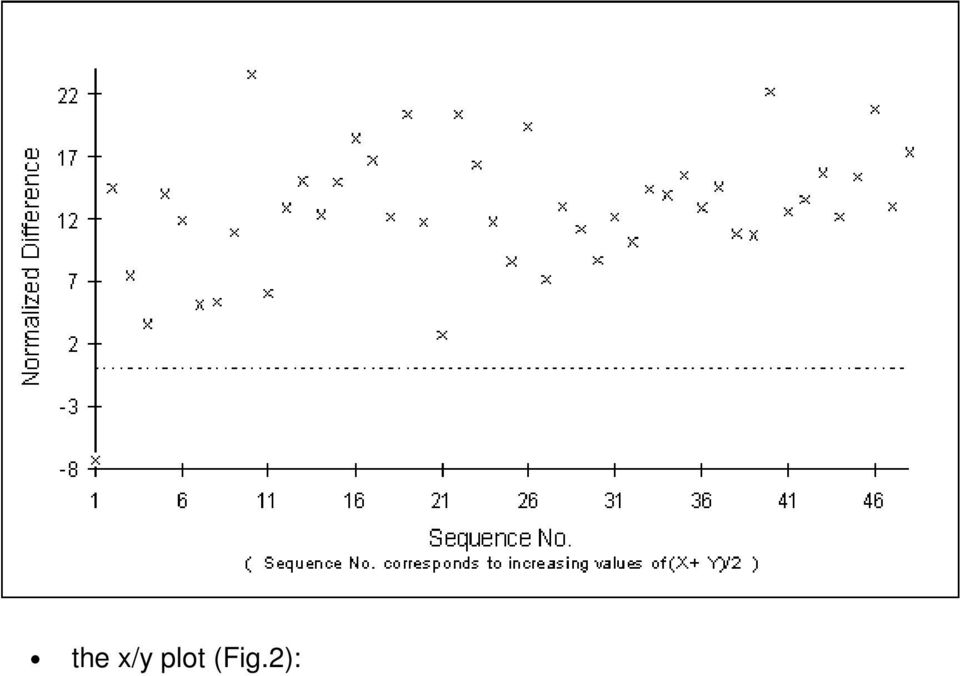
5 Both figures represent the same data set (glucose concentration in capillary blood dertermined with an Elite and an Ebio analyzer). Both plots have their advantages. However, they are both more or less equally useful. Several characteristics are usually examined from these plots that can be judged by individual statistical tests: linearity over the entire range: visually or by Cusum test; slope; intercept calculation of the fitting line (regression analysis): e.g. by (classical linear regression with or without of weighing, standardized principle component analysis, Deming, Passing-Bablok; spread around the fitting line: e.g. md(95) or s y.x ; outliers; maximum/minimum interval;

6 (correlation coefficient). It is still a debate which mathematical procedure should be applied for calculating the fitting line. The Deming and the Passing-Bablok procedures have the advantage that they do not require a normal distribution on both axes. Whereas Americans still prefer the classical regression with some kind of weighing the data, the majority of Europeans appears to use the Passing- Bablok method. The correlation coefficient does not provide any further information and can even be misleading. However, clinicians still like this characteristic because it is a single value. They do not accept if we provide them with a set of several analytical characteristics. The spread around the fitting line can be characterised by several statistical parameters: Example of precision indices in measurement procedure comparisons (Hallé et al.1986): Elite versus EBIO in capillary blood (mg/dl) y = 1,167x 8,167; r = 0,981; n = 143 Standard deviation of residuals: s y.x = 12,0 Dispersion of residuals: - Passing-Bablok regression: md(95) = 15,4 - Standardized principle component: SE = 8.00 Mean percent differences:(y-x)% of x = 11,5 Precision index: 1-1/100(mean % diff.) = 0,89 Despite the different statistical tests available, the fastest and perhaps most reliable testing tool is the eye of an experienced clinical chemist. The statistical characteristics mentioned describe the performance of a measurement procedure in the laboratory, it is an analytical validation, they are sufficient to judge the comparability for the laboratory. The customer of the laboratory requires one characteristic. He wants to know, how many errors does he has to expect when one measurement procedure is replaced by another one. In the example just presented (Fig.2), a low variation occured around the regression line. The md(95) value was 15,4, and the correlation coefficient r = 0,981.However, a significant slope of about 1,167 was observed. Are the discrepancies to be expected due to the total error of clinical relevance? In this example the comparison measurement procedure is a routine measurement procedure for the glucose concentration measurement of a central laboratory, and the test measurement procedure is a typical point of care testing device for blood glucose measurements near the patient.

7 Several consensus documents on the allowable error have been published; in the case of performance goals for glucose: Consensus groups: ADA (1994) 1) < 5 % NCCLS (1994) Error of measurement CV (%) < 20 % [>5,5 mmol/l] < 0,8 mmol/l [ 5,5 mmol/l] CMT (1991) 2) < ±15 % [>6,7mmol/L] < 5,0 ISO-TC 212(1998) < ±18 % [<6,7mmol/L] < +1,1 mmol/l [<5,5 mmol/l] < ± 20 % [>5,5 mmol/l] RiliBÄK 3) (1993) < ± 15 % (of assigned value) 5,0 CLIA (1992) < ± 0,3 mmol/l or + 10 % Individual groups: Fraser et al. (1993) 1,9 % Cok et al. (1985), Koschinsky et al. (1988) 4), Weiss et al. (1994) 5) 20 % Price et al. (1988) 10 % 2,2 % 1) American Diabetes Association 2) Center for Medical Technology (Leiden) 3) Guidelines of the German Association of Physicians 4) ³ 95 % of all test values, below regression line: 17 % 5) 3,3 mmol/l, 15 % ³ 4,7 mmol/l The allowable error varies from 2 to 20 %. There is no consensus among the various consensus proposals. All proposals more or less are based on percentage values. They belong to class 2 in the hierarchy of objectivity suggested by Fraser and Petersen (Clin Chem 1999;45:321): 1. Assessment of the effect of analytical performance on clinical decision making. 1.1 Quality specifications in specific clinical situations. 1.2 General quality specifications based on medical needs: e.g. based on biological variation. 2. Professional recommendations from expert or institutional groups.
 10 % 2,2 % 1) American Diabetes Association 2) Center for Medical Technology (Leiden) 3) Guidelines of the German Association of Physicians 4) ³ 95 % of all test values, below regression line:")
8 3. Quality specifications laid down by regulation or by external quality assessment schemes organizers. 4. Pubslished data on the state of the art from proficiency testing schemes or published methodology. Class 1 has the highest hierarchical level, objectivity requires assessment of the effect of analytical performance on clinical decision making. Boyd and Bruns (Clin Chem 2001;47:209-14) very recently have related performance characteristics of glucose analyzers to error rates in insulin dosage. We have developed a new procedure relating performance characteristics to error rates in diagnostic decision making. This new test answers the question: how many discordant classifications have to be expected at a particular decision limit which discriminates between nondiseased and diseased subjects if a laboratory switches from one measurement procedure to another one. If two procedures of measuring the glucose concentration are compared, a clinically relevant decision is the diagnosis of diabetes mellitus in the fasting state (Fig.3). For capillary blood, WHO has recently recommended a decision limit of 6,1 mmol/l to discriminate between non-diabetic and diabetic glucose concentrations. If a quantity is measured with two measurement procedures, both results may be below the decision limit c d (x 1 /y 1 in Fig.3) or above c d (concordant classification). In a few cases, the results of one procedure (x 2 ) may be below c d and of the other measurement procedure (y 2 ) above c d (discordant classifications: x 2 = non-disease, y 2 = disease). The number of discordant classifications depends on 2 probabilities (Fig.4): (i) the probability that xp occurs in the population (population probability): P p (x p ) (ii) the probability that the test value of y p corresponding to x p lies above c d (analytical probability) for a given x p : P(y p c d Ix p ). If x lies above c d and y below c d, the probability of a false negative decision becomes 1- P(y p c d Ix p ). The population probability P p is determined on the basis of a Gaussian distribution. From this distribution, the probability of occurrence of each possible glucose value within the study population is calculated by numerical integration. The population probability is calculated using a statistical program. The discordance rate P is obtained by multiplying and summing up both probabilities. The probabilities can be calculated using a statistical program. Results of the proposed test are shown in Fig.5 for the comparison of an Elite XL with an EBIO glucometer. The corrsponding data have already been shown
 very recently have related performance characteristics of glucose analyzers to error rates in insulin dosage.")
9 on the difference and the x/y plot. The horizontal axis represent mg/dl fasting plasma glucose concentrations, the vertical axis means the probability P p (x), that x (comparison measurement procedure) occurs in the population studied. The blue curve shows the distribution of the population values measured by the comparison measurement procedure (EBIO). The height of the curve shows the probability (in percent) of occurence of each individual glucose value, rounded to integers. The area below the curve sums to 100 %. The decision limit is located at 6,1 mmol/l ( 110 mg/dl) on the abscisse. The red hull curve left of the decision limit (6,1 mmol/l ( 110 mg/dl)) describe the probability that a value from that position is erroneously classified by the test measurement procedure as lying right of the decision limit (false positive classification). The hull curve is the global probability of a false positive measurement by the test measurement procedure. It is identical with the area under the hull curve in percent of the area under the population curve. Similarily, the green curve right of the decision limit indicate the probabilities for false negative discordances and the remaining area quantifies the probabilities of correct decisions. Conclusions: 1. The responsibility for the validation of laboratory measurement procedures belongs to the institution which has developed a procedure, in most cases the manufacturer. 2. New procedures should be validated by several laboratories, in the future probably by accredited laboratories, preferably by external laboratories (that means the ECCLS concept is still valid). 3. The end-user must be aware of the validation results. If these validation data are not available or incomplete or insufficient, the laboratory itself is responsible for the validation before the new procedure is applied routineously. 4. The end-user should perform a short validation including at least one type of uncertainty, agreement with assigned values of control materials and a measurement procedure comparison study if applicable. 5. Measurement procedure comparison studies require two steps: the definition of analytical (dis)agreement, and an estimation of diagnostic relevance, e.g. of the rate of discordant classifications. Fig.3
 of occurence of each individual glucose value, rounded to integers. The area below the curve sums to 100 %.")
10 x i = comparison measurement procedure y i = measurement procedure to be tested Fig.4 Principle of the new test for discordant classifications: Fig.5

11 Citació recomanada per a aquest document: Haeckel R. Validation of measurement procedures. In vitro veritas 2001;2, art 20:<

USING CLSI GUIDELINES TO PERFORM METHOD EVALUATION STUDIES IN YOUR LABORATORY
 USING CLSI GUIDELINES TO PERFORM METHOD EVALUATION STUDIES IN YOUR LABORATORY Breakout Session 3B Tuesday, May 1 8:30 10 am James Blackwood, MS, CLSI David D. Koch, PhD, FACB, DABCC, Pathology & Laboratory
Content Sheet 7-1: Overview of Quality Control for Quantitative Tests
 Content Sheet 7-1: Overview of Quality Control for Quantitative Tests Role in quality management system Quality Control (QC) is a component of process control, and is a major element of the quality management
Validation and Calibration. Definitions and Terminology
 Validation and Calibration Definitions and Terminology ACCEPTANCE CRITERIA: The specifications and acceptance/rejection criteria, such as acceptable quality level and unacceptable quality level, with an
AP Physics 1 and 2 Lab Investigations
 AP Physics 1 and 2 Lab Investigations Student Guide to Data Analysis New York, NY. College Board, Advanced Placement, Advanced Placement Program, AP, AP Central, and the acorn logo are registered trademarks
ASSURING THE QUALITY OF TEST RESULTS
 Page 1 of 12 Sections Included in this Document and Change History 1. Purpose 2. Scope 3. Responsibilities 4. Background 5. References 6. Procedure/(6. B changed Division of Field Science and DFS to Office
Guidance for Industry
 Guidance for Industry Q2B Validation of Analytical Procedures: Methodology November 1996 ICH Guidance for Industry Q2B Validation of Analytical Procedures: Methodology Additional copies are available from:
Guide to Method Validation for Quantitative Analysis in Chemical Testing Laboratories
 Guide to Method Validation for Quantitative Analysis in Chemical Testing Laboratories Wilton Park House, Wilton Place, Dublin 2, Ireland Tel +353 1 607 3003 Fax +353 1 607 3109 E-mail inab@inab.ie Web
Method Validation/Verification. CAP/CLIA regulated methods at Texas Department of State Health Services Laboratory
 Method Validation/Verification CAP/CLIA regulated methods at Texas Department of State Health Services Laboratory References Westgard J. O.: Basic Method Validation, Westgard Quality Corporation Sarewitz
DECISION LIMITS FOR THE CONFIRMATORY QUANTIFICATION OF THRESHOLD SUBSTANCES
 DECISION LIMITS FOR THE CONFIRMATORY QUANTIFICATION OF THRESHOLD SUBSTANCES Introduction This Technical Document shall be applied to the quantitative determination of a Threshold Substance in a Sample
American Association for Laboratory Accreditation
 Page 1 of 12 The examples provided are intended to demonstrate ways to implement the A2LA policies for the estimation of measurement uncertainty for methods that use counting for determining the number
Contents. Abstract...i. Committee Membership... iii. Foreword... vii. 1 Scope...1
 ISBN 1-56238-584-4 Volume 25 Number 27 ISSN 0273-3099 Interference Testing in Clinical Chemistry; Approved Guideline Second Edition Robert J. McEnroe, PhD Mary F. Burritt, PhD Donald M. Powers, PhD Douglas
2. Simple Linear Regression
 Research methods - II 3 2. Simple Linear Regression Simple linear regression is a technique in parametric statistics that is commonly used for analyzing mean response of a variable Y which changes according
Diagrams and Graphs of Statistical Data
 Diagrams and Graphs of Statistical Data One of the most effective and interesting alternative way in which a statistical data may be presented is through diagrams and graphs. There are several ways in
18.6.1 Terms concerned with internal quality control procedures
 18.6.1 Terms concerned with internal quality control procedures Quality assurance in analytical laboratories Quality assurance is the essential organisational infrastructure that underlies all reliable
Evaluation of Accuracy and User Performance of the TRUE METRIX Self-Monitoring Blood Glucose System *
 Evaluation of Accuracy and User Performance of the TRUE METRIX Self-Monitoring Blood Glucose System * Summary Objectives: To demonstrate that the TRUE METRIX Self-Monitoring Blood Glucose System*, from
South Carolina College- and Career-Ready (SCCCR) Probability and Statistics
 Probability and Statistics") South Carolina College- and Career-Ready (SCCCR) Probability and Statistics South Carolina College- and Career-Ready Mathematical Process Standards The South Carolina College- and Career-Ready (SCCCR)
South Carolina College- and Career-Ready (SCCCR) Probability and Statistics South Carolina College- and Career-Ready Mathematical Process Standards The South Carolina College- and Career-Ready (SCCCR)
USE OF REFERENCE MATERIALS IN THE LABORATORY
 USE OF REFERENCE MATERIALS IN THE LABORATORY What is a reference material? A general definition of a reference material is a material or substance one or more of whose property values are sufficiently
Standardization, Calibration and Quality Control
 Standardization, Calibration and Quality Control Ian Storie Flow cytometry has become an essential tool in the research and clinical diagnostic laboratory. The range of available flow-based diagnostic
International Year of Light 2015 Tech-Talks BREGENZ: Mehmet Arik Well-Being in Office Applications Light Measurement & Quality Parameters
 www.led-professional.com ISSN 1993-890X Trends & Technologies for Future Lighting Solutions ReviewJan/Feb 2015 Issue LpR 47 International Year of Light 2015 Tech-Talks BREGENZ: Mehmet Arik Well-Being in
RUTHERFORD HIGH SCHOOL Rutherford, New Jersey COURSE OUTLINE STATISTICS AND PROBABILITY
 RUTHERFORD HIGH SCHOOL Rutherford, New Jersey COURSE OUTLINE STATISTICS AND PROBABILITY I. INTRODUCTION According to the Common Core Standards (2010), Decisions or predictions are often based on data numbers
General and statistical principles for certification of RM ISO Guide 35 and Guide 34
 General and statistical principles for certification of RM ISO Guide 35 and Guide 34 / REDELAC International Seminar on RM / PT 17 November 2010 Dan Tholen,, M.S. Topics Role of reference materials in
A comparison of blood glucose meters in Australia
 Diabetes Research and Clinical Practice 71 (2006) 113 118 www.elsevier.com/locate/diabres A comparison of blood glucose meters in Australia Matthew Cohen *, Erin Boyle, Carol Delaney, Jonathan Shaw International
1) Write the following as an algebraic expression using x as the variable: Triple a number subtracted from the number
 Write the following as an algebraic expression using x as the variable: Triple a number subtracted from the number") 1) Write the following as an algebraic expression using x as the variable: Triple a number subtracted from the number A. 3(x - x) B. x 3 x C. 3x - x D. x - 3x 2) Write the following as an algebraic expression
1) Write the following as an algebraic expression using x as the variable: Triple a number subtracted from the number A. 3(x - x) B. x 3 x C. 3x - x D. x - 3x 2) Write the following as an algebraic expression
COMMON CORE STATE STANDARDS FOR
 COMMON CORE STATE STANDARDS FOR Mathematics (CCSSM) High School Statistics and Probability Mathematics High School Statistics and Probability Decisions or predictions are often based on data numbers in
Accuracy Test Omnitest 3 Blood Glucose Monitoring System. B. Braun Diabetes Care
 Accuracy Test Omnitest Blood Glucose Monitoring System B. Braun Diabetes Care Accuracy Test Omnitest blood glucose monitoring system according to ISO 97 The accuracy study of Omnitest blood glucose monitoring
What is the purpose of this document? What is in the document? How do I send Feedback?
 This document is designed to help North Carolina educators teach the Common Core (Standard Course of Study). NCDPI staff are continually updating and improving these tools to better serve teachers. Statistics
APPENDIX N. Data Validation Using Data Descriptors
 APPENDIX N Data Validation Using Data Descriptors Data validation is often defined by six data descriptors: 1) reports to decision maker 2) documentation 3) data sources 4) analytical method and detection
Quantifying measurement error from digital instruments
 Quantifying measurement error from digital instruments W. BLAKE LAING AND SEAN BRYANT SOUTHERN ADVENTIST UNIVERSITY CHAT TANOOGA, TN What I m doing HELPING STUDENTS LEARN TO CONSTRUCT KNOWLEDGE First lab:
Magruder Statistics & Data Analysis
 Magruder Statistics & Data Analysis Caution: There will be Equations! Based Closely On: Program Model The International Harmonized Protocol for the Proficiency Testing of Analytical Laboratories, 2006
CHAPTER 13 SIMPLE LINEAR REGRESSION. Opening Example. Simple Regression. Linear Regression
 Opening Example CHAPTER 13 SIMPLE LINEAR REGREION SIMPLE LINEAR REGREION! Simple Regression! Linear Regression Simple Regression Definition A regression model is a mathematical equation that descries the
Applying Statistics Recommended by Regulatory Documents
 Applying Statistics Recommended by Regulatory Documents Steven Walfish President, Statistical Outsourcing Services steven@statisticaloutsourcingservices.com 301-325 325-31293129 About the Speaker Mr. Steven
QUALITY MANAGEMENT IN VETERINARY TESTING LABORATORIES
 NB: Version adopted by the World Assembly of Delegates of the OIE in May 2012 CHAPTER 1.1.4. QUALITY MANAGEMENT IN VETERINARY TESTING LABORATORIES SUMMARY Valid laboratory results are essential for diagnosis,
Maria Belli. (former APAT) IX. Congress of clinical chemistry & laboratory medicine Prague 20-22 September 2009
 IX. Congress of clinical chemistry & laboratory medicine Prague 20-22 September 2009") IX. Congress of clinical chemistry & laboratory medicine Prague 20-22 September 2009 Maria Belli Istituto Superiore per la Protezione e la Ricerca Ambientale (former APAT) production and characterization
IX. Congress of clinical chemistry & laboratory medicine Prague 20-22 September 2009 Maria Belli Istituto Superiore per la Protezione e la Ricerca Ambientale (former APAT) production and characterization
3. Data Analysis, Statistics, and Probability
 3. Data Analysis, Statistics, and Probability Data and probability sense provides students with tools to understand information and uncertainty. Students ask questions and gather and use data to answer
NCSS Statistical Software Principal Components Regression. In ordinary least squares, the regression coefficients are estimated using the formula ( )
") Chapter 340 Principal Components Regression Introduction is a technique for analyzing multiple regression data that suffer from multicollinearity. When multicollinearity occurs, least squares estimates
Chapter 340 Principal Components Regression Introduction is a technique for analyzing multiple regression data that suffer from multicollinearity. When multicollinearity occurs, least squares estimates
Basic Statistics and Data Analysis for Health Researchers from Foreign Countries
 Basic Statistics and Data Analysis for Health Researchers from Foreign Countries Volkert Siersma siersma@sund.ku.dk The Research Unit for General Practice in Copenhagen Dias 1 Content Quantifying association
DATA INTERPRETATION AND STATISTICS
 PholC60 September 001 DATA INTERPRETATION AND STATISTICS Books A easy and systematic introductory text is Essentials of Medical Statistics by Betty Kirkwood, published by Blackwell at about 14. DESCRIPTIVE
VALIDATION OF ANALYTICAL PROCEDURES: TEXT AND METHODOLOGY Q2(R1)
") INTERNATIONAL CONFERENCE ON HARMONISATION OF TECHNICAL REQUIREMENTS FOR REGISTRATION OF PHARMACEUTICALS FOR HUMAN USE ICH HARMONISED TRIPARTITE GUIDELINE VALIDATION OF ANALYTICAL PROCEDURES: TEXT AND METHODOLOGY
INTERNATIONAL CONFERENCE ON HARMONISATION OF TECHNICAL REQUIREMENTS FOR REGISTRATION OF PHARMACEUTICALS FOR HUMAN USE ICH HARMONISED TRIPARTITE GUIDELINE VALIDATION OF ANALYTICAL PROCEDURES: TEXT AND METHODOLOGY
Big Data: Rethinking Text Visualization
 Big Data: Rethinking Text Visualization Dr. Anton Heijs anton.heijs@treparel.com Treparel April 8, 2013 Abstract In this white paper we discuss text visualization approaches and how these are important
G104 - Guide for Estimation of Measurement Uncertainty In Testing. December 2014
 Page 1 of 31 G104 - Guide for Estimation of Measurement Uncertainty In Testing December 2014 2014 by A2LA All rights reserved. No part of this document may be reproduced in any form or by any means without
Institute of Actuaries of India Subject CT3 Probability and Mathematical Statistics
 Institute of Actuaries of India Subject CT3 Probability and Mathematical Statistics For 2015 Examinations Aim The aim of the Probability and Mathematical Statistics subject is to provide a grounding in
A Practical Guide to Internal Quality Control (IQC) for Quantitative Tests in Medical Laboratories
 for Quantitative Tests in Medical Laboratories") A Practical Guide to Internal Quality Control (IQC) for Quantitative Tests in Medical Laboratories () Edited by Richard Pang, PhD, FACB Senior Consultant Pro Q Consulting Services Hong Kong For Hong Kong
A Practical Guide to Internal Quality Control (IQC) for Quantitative Tests in Medical Laboratories () Edited by Richard Pang, PhD, FACB Senior Consultant Pro Q Consulting Services Hong Kong For Hong Kong
Assay Migration Studies for In Vitro Diagnostic Devices Guidance for Industry and FDA Staff
 Assay Migration Studies for In Vitro Diagnostic Devices Guidance for Industry and FDA Staff Document issued on: April 25, 2013 The draft of this document was issued on January 5, 2009. For questions regarding
Correlation key concepts:
 CORRELATION Correlation key concepts: Types of correlation Methods of studying correlation a) Scatter diagram b) Karl pearson s coefficient of correlation c) Spearman s Rank correlation coefficient d)
NATIONAL GENETICS REFERENCE LABORATORY (Manchester)
") NATIONAL GENETICS REFERENCE LABORATORY (Manchester) MLPA analysis spreadsheets User Guide (updated October 2006) INTRODUCTION These spreadsheets are designed to assist with MLPA analysis using the kits
NATIONAL GENETICS REFERENCE LABORATORY (Manchester) MLPA analysis spreadsheets User Guide (updated October 2006) INTRODUCTION These spreadsheets are designed to assist with MLPA analysis using the kits
Section 14 Simple Linear Regression: Introduction to Least Squares Regression
 Slide 1 Section 14 Simple Linear Regression: Introduction to Least Squares Regression There are several different measures of statistical association used for understanding the quantitative relationship
Six Sigma Metric Analysis for Analytical Testing Processes
 Six Sigma Metric Analysis for Analytical Testing Processes Sten Westgard, MS, Westgard QC Introduction Laboratories seek objective assessment and comparison of analytical methods and instrumentation performance.
Methods verification. Transfer of validated methods into laboratories working routine. Dr. Manuela Schulze 1
 Methods verification Transfer of validated methods into laboratories working routine Dr. Manuela Schulze 1 1. Introduction 2. Definitions and differences validation verification 3. How to perform verification
Overview of ISO 17511 for 'Biologicals'
 JCTLM Symposium on Reference Measurement Systems for Biologicals International Bureau of Weights and Measures Pavillon de Breteuil, Sèvres, FR 2004-12-15 Overview of ISO 17511 for 'Biologicals' R. Dybkaer
Chapter 6. The stacking ensemble approach
 82 This chapter proposes the stacking ensemble approach for combining different data mining classifiers to get better performance. Other combination techniques like voting, bagging etc are also described
James O. Westgard, PhD, 1,2 and Sten A. Westgard, MS 2. Abstract
 Clinical Chemistry / ANALYTIC QUALITY TODAY The Quality of Laboratory Testing Today An Assessment of σ Metrics for Analytic Quality Using Performance Data From Proficiency Testing Surveys and the CLIA
X X X a) perfect linear correlation b) no correlation c) positive correlation (r = 1) (r = 0) (0 < r < 1)
 perfect linear correlation b) no correlation c) positive correlation (r = 1) (r = 0) (0 < r < 1)") CORRELATION AND REGRESSION / 47 CHAPTER EIGHT CORRELATION AND REGRESSION Correlation and regression are statistical methods that are commonly used in the medical literature to compare two or more variables.
CORRELATION AND REGRESSION / 47 CHAPTER EIGHT CORRELATION AND REGRESSION Correlation and regression are statistical methods that are commonly used in the medical literature to compare two or more variables.
GUIDELINES FOR THE VALIDATION OF ANALYTICAL METHODS FOR ACTIVE CONSTITUENT, AGRICULTURAL AND VETERINARY CHEMICAL PRODUCTS.
 GUIDELINES FOR THE VALIDATION OF ANALYTICAL METHODS FOR ACTIVE CONSTITUENT, AGRICULTURAL AND VETERINARY CHEMICAL PRODUCTS October 2004 APVMA PO Box E240 KINGSTON 2604 AUSTRALIA http://www.apvma.gov.au
AUDIT PROTOCOL FOR THE VICTORIAN WATER QUALITY MONITORING NETWORK
 AUDIT PROTOCOL FOR THE VICTORIAN WATER QUALITY MONITORING NETWORK ENVIRONMENT PROTECTION AUTHORITY June 1999 AUDIT PROTOCOL FOR THE VICTORIAN WATER QUALITY MONITORING NETWORK, June 1999 David Robinson
Using R for Linear Regression
 Using R for Linear Regression In the following handout words and symbols in bold are R functions and words and symbols in italics are entries supplied by the user; underlined words and symbols are optional
Glossary of Terms for Quality Assurance and Good Laboratory Practices
 Glossary of Terms for Quality Assurance and Good Laboratory Practices A commitment to quality and continuous improvement Photo credits Front cover photographs: top left; istockphoto.com/yegor Korzh UNOV
510(k) SUBSTANTIAL EQUIVALENCE DETERMINATION DECISION SUMMARY
 SUBSTANTIAL EQUIVALENCE DETERMINATION DECISION SUMMARY") 510(k) SUBSTANTIAL EQUIVALENCE DETERMINATION DECISION SUMMARY A. 510(k) Number: k103555 B. Purpose for Submission: New submission C. Measurand: Platelet aggregation D. Type of Test: Platelet aggregometer
510(k) SUBSTANTIAL EQUIVALENCE DETERMINATION DECISION SUMMARY A. 510(k) Number: k103555 B. Purpose for Submission: New submission C. Measurand: Platelet aggregation D. Type of Test: Platelet aggregometer
CORRELATED TO THE SOUTH CAROLINA COLLEGE AND CAREER-READY FOUNDATIONS IN ALGEBRA
 We Can Early Learning Curriculum PreK Grades 8 12 INSIDE ALGEBRA, GRADES 8 12 CORRELATED TO THE SOUTH CAROLINA COLLEGE AND CAREER-READY FOUNDATIONS IN ALGEBRA April 2016 www.voyagersopris.com Mathematical
Simple Linear Regression Inference
 Simple Linear Regression Inference 1 Inference requirements The Normality assumption of the stochastic term e is needed for inference even if it is not a OLS requirement. Therefore we have: Interpretation
Simple linear regression
 Simple linear regression Introduction Simple linear regression is a statistical method for obtaining a formula to predict values of one variable from another where there is a causal relationship between
How to Verify Performance Specifications
 How to Verify Performance Specifications VERIFICATION OF PERFORMANCE SPECIFICATIONS In 2003, the Centers for Medicare and Medicaid Services (CMS) updated the CLIA 88 regulations. As a result of the updated
JOINT COMMISSION INTERNATIONAL ACCREDITATION STANDARDS FOR. 2nd Edition
 JOINT COMMISSION INTERNATIONAL ACCREDITATION STANDARDS FOR CliniCAl laboratories 2nd Edition Effective 1 April 2010 International Patient Safety Goals (IPSG) Goals The following is a list of all goals.
Algebra 1 Course Information
 Course Information Course Description: Students will study patterns, relations, and functions, and focus on the use of mathematical models to understand and analyze quantitative relationships. Through
PT/EQA STANDARDS AND GUIDELINES: QUALITY AND RELIABILITY OF TEST ITEMS
 PT/EQA STANDARDS AND GUIDELINES: QUALITY AND RELIABILITY OF TEST ITEMS Maria Belli Istituto Superiore per la Protezione e la Ricerca Ambientale (former APAT) ISPRA activities production and characterization
Basic Lessons in Laboratory Quality Control
 Bio-Rad Laboratories QC education Basic Lessons in Laboratory Quality Control QC Workbook Basic Lessons in Laboratory Quality Control Written by Greg Cooper, CLS, MHA Manager of Clinical Standards and
2013 MBA Jump Start Program. Statistics Module Part 3
 2013 MBA Jump Start Program Module 1: Statistics Thomas Gilbert Part 3 Statistics Module Part 3 Hypothesis Testing (Inference) Regressions 2 1 Making an Investment Decision A researcher in your firm just
Gap Analysis of ISO 15189:2012 and ISO 15189:2007 in the field of Medical Testing
 Gap Analysis May 2013 Issued: May 2013 Gap Analysis of and in the field of Medical Testing Copyright National Association of Testing Authorities, Australia 2013 This publication is protected by copyright
Step-by-Step Analytical Methods Validation and Protocol in the Quality System Compliance Industry
 Step-by-Step Analytical Methods Validation and Protocol in the Quality System Compliance Industry BY GHULAM A. SHABIR Introduction Methods Validation: Establishing documented evidence that provides a high
Using Excel (Microsoft Office 2007 Version) for Graphical Analysis of Data
 for Graphical Analysis of Data") Using Excel (Microsoft Office 2007 Version) for Graphical Analysis of Data Introduction In several upcoming labs, a primary goal will be to determine the mathematical relationship between two variable
Using Excel (Microsoft Office 2007 Version) for Graphical Analysis of Data Introduction In several upcoming labs, a primary goal will be to determine the mathematical relationship between two variable
POCT in diagnosing and monitoring of Diabetes Mellitus. 13th EFLM Continuous Postgraduate Course, Sverre Sandberg, Noklus / EFLM
 POCT in diagnosing and monitoring of Diabetes Mellitus - 13th EFLM Continuous Postgraduate Course, Sverre Sandberg, Noklus / EFLM The most important constituents - Glucose monitoring and diagnosing - U-albumin
EXPERIMENTAL ERROR AND DATA ANALYSIS
 EXPERIMENTAL ERROR AND DATA ANALYSIS 1. INTRODUCTION: Laboratory experiments involve taking measurements of physical quantities. No measurement of any physical quantity is ever perfectly accurate, except
Changes to UK NEQAS Leucocyte Immunophenotyping Chimerism Performance Monitoring Systems From April 2014. Uncontrolled Copy
 Changes to UK NEQAS Leucocyte Immunophenotyping Chimerism Performance Monitoring Systems From April 2014 Contents 1. The need for change 2. Current systems 3. Proposed z-score system 4. Comparison of z-score
SMF Awareness Seminar 2014
 SMF Awareness Seminar 2014 Clinical Evaluation for In Vitro Diagnostic Medical Devices Dr Jiang Naxin Health Sciences Authority Medical Device Branch 1 In vitro diagnostic product means Definition of IVD
Current Standard: Mathematical Concepts and Applications Shape, Space, and Measurement- Primary
 Shape, Space, and Measurement- Primary A student shall apply concepts of shape, space, and measurement to solve problems involving two- and three-dimensional shapes by demonstrating an understanding of:
ICH Topic Q 2 (R1) Validation of Analytical Procedures: Text and Methodology. Step 5
 Validation of Analytical Procedures: Text and Methodology. Step 5") European Medicines Agency June 1995 CPMP/ICH/381/95 ICH Topic Q 2 (R1) Validation of Analytical Procedures: Text and Methodology Step 5 NOTE FOR GUIDANCE ON VALIDATION OF ANALYTICAL PROCEDURES: TEXT AND
European Medicines Agency June 1995 CPMP/ICH/381/95 ICH Topic Q 2 (R1) Validation of Analytical Procedures: Text and Methodology Step 5 NOTE FOR GUIDANCE ON VALIDATION OF ANALYTICAL PROCEDURES: TEXT AND
Analytical Methods: A Statistical Perspective on the ICH Q2A and Q2B Guidelines for Validation of Analytical Methods
 Page 1 of 6 Analytical Methods: A Statistical Perspective on the ICH Q2A and Q2B Guidelines for Validation of Analytical Methods Dec 1, 2006 By: Steven Walfish BioPharm International ABSTRACT Vagueness
Real-time PCR: Understanding C t
 APPLICATION NOTE Real-Time PCR Real-time PCR: Understanding C t Real-time PCR, also called quantitative PCR or qpcr, can provide a simple and elegant method for determining the amount of a target sequence
An Interactive Tool for Residual Diagnostics for Fitting Spatial Dependencies (with Implementation in R)
") DSC 2003 Working Papers (Draft Versions) http://www.ci.tuwien.ac.at/conferences/dsc-2003/ An Interactive Tool for Residual Diagnostics for Fitting Spatial Dependencies (with Implementation in R) Ernst
DSC 2003 Working Papers (Draft Versions) http://www.ci.tuwien.ac.at/conferences/dsc-2003/ An Interactive Tool for Residual Diagnostics for Fitting Spatial Dependencies (with Implementation in R) Ernst
In vitro diagnostic reagent, calibrator and control material stability
 In vitro diagnostic reagent, calibrator and control material stability Pauline Armstrong Randox Laboratories, Ltd. Crumlin The stability of in vitro medical diagnostic devices whether they are reagents,
Case Study in Data Analysis Does a drug prevent cardiomegaly in heart failure?
 Case Study in Data Analysis Does a drug prevent cardiomegaly in heart failure? Harvey Motulsky hmotulsky@graphpad.com This is the first case in what I expect will be a series of case studies. While I mention
4. Simple regression. QBUS6840 Predictive Analytics. https://www.otexts.org/fpp/4
 4. Simple regression QBUS6840 Predictive Analytics https://www.otexts.org/fpp/4 Outline The simple linear model Least squares estimation Forecasting with regression Non-linear functional forms Regression
Basic research methods. Basic research methods. Question: BRM.2. Question: BRM.1
 BRM.1 The proportion of individuals with a particular disease who die from that condition is called... BRM.2 This study design examines factors that may contribute to a condition by comparing subjects
Linear Regression. Chapter 5. Prediction via Regression Line Number of new birds and Percent returning. Least Squares
 Linear Regression Chapter 5 Regression Objective: To quantify the linear relationship between an explanatory variable (x) and response variable (y). We can then predict the average response for all subjects
2.500 Threshold. 2.000 1000e - 001. Threshold. Exponential phase. Cycle Number
 application note Real-Time PCR: Understanding C T Real-Time PCR: Understanding C T 4.500 3.500 1000e + 001 4.000 3.000 1000e + 000 3.500 2.500 Threshold 3.000 2.000 1000e - 001 Rn 2500 Rn 1500 Rn 2000
Vertical Alignment Colorado Academic Standards 6 th - 7 th - 8 th
 Vertical Alignment Colorado Academic Standards 6 th - 7 th - 8 th Standard 3: Data Analysis, Statistics, and Probability 6 th Prepared Graduates: 1. Solve problems and make decisions that depend on un
11. Analysis of Case-control Studies Logistic Regression
 Research methods II 113 11. Analysis of Case-control Studies Logistic Regression This chapter builds upon and further develops the concepts and strategies described in Ch.6 of Mother and Child Health:
The Determination of Uncertainties in Charpy Impact Testing
 Manual of Codes of Practice for the Determination of Uncertainties in Mechanical Tests on Metallic Materials Code of Practice No. 06 The Determination of Uncertainties in Charpy Impact Testing M.A. Lont
Introduction to Error Analysis
 UNIVERSITÄT BASEL DEPARTEMENT CHEMIE Introduction to Error Analysis Physikalisch Chemisches Praktikum Dr. Nico Bruns, Dr. Katarzyna Kita, Dr. Corinne Vebert 2012 1. Why is error analysis important? First
Data Visualization Techniques
 Data Visualization Techniques From Basics to Big Data with SAS Visual Analytics WHITE PAPER SAS White Paper Table of Contents Introduction.... 1 Generating the Best Visualizations for Your Data... 2 The
IAS CALIBRATION and TESTING LABORATORY ACCREDITATION PROGRAMS DEFINITIONS
 REFERENCES NIST Special Publication 330 IAS CALIBRATION and TESTING LABORATORY ACCREDITATION PROGRAMS DEFINITIONS Revised October 2013 International vocabulary of metrology Basic and general concepts and
Exploratory data analysis (Chapter 2) Fall 2011
 Fall 2011") Exploratory data analysis (Chapter 2) Fall 2011 Data Examples Example 1: Survey Data 1 Data collected from a Stat 371 class in Fall 2005 2 They answered questions about their: gender, major, year in school,
Exploratory data analysis (Chapter 2) Fall 2011 Data Examples Example 1: Survey Data 1 Data collected from a Stat 371 class in Fall 2005 2 They answered questions about their: gender, major, year in school,
Big Data: a new era for Statistics
 Big Data: a new era for Statistics Richard J. Samworth Abstract Richard Samworth (1996) is a Professor of Statistics in the University s Statistical Laboratory, and has been a Fellow of St John s since
Chapter 7: Simple linear regression Learning Objectives
 Chapter 7: Simple linear regression Learning Objectives Reading: Section 7.1 of OpenIntro Statistics Video: Correlation vs. causation, YouTube (2:19) Video: Intro to Linear Regression, YouTube (5:18) -
Analytical Chemistry Lab Reports
 Analytical Chemistry Lab Reports Format and Calculations John Collins collinj2@gmail.com Measurement Analytical chemistry is entirely about measurement, what these measurements signify, and the understanding
Content Sheet 10-1: Overview of External Quality Assessment (EQA)
") Content Sheet 10-1: Overview of External Quality Assessment (EQA) Role in quality management system Assessment is a critical aspect of laboratory quality management, and it can be conducted in several
Content Sheet 10-1: Overview of External Quality Assessment (EQA) Role in quality management system Assessment is a critical aspect of laboratory quality management, and it can be conducted in several
Unaccredited Point-of-Care Laboratory Testing Guideline for Physicians
 Unaccredited Point-of-Care Laboratory Testing Guideline for Physicians Prepared by the Advisory Committee on Laboratory Medicine College of Physicians & Surgeons of Alberta Serving the Public by guiding
Simple Predictive Analytics Curtis Seare
 Using Excel to Solve Business Problems: Simple Predictive Analytics Curtis Seare Copyright: Vault Analytics July 2010 Contents Section I: Background Information Why use Predictive Analytics? How to use
INTRODUCTION TO ERRORS AND ERROR ANALYSIS
 INTRODUCTION TO ERRORS AND ERROR ANALYSIS To many students and to the public in general, an error is something they have done wrong. However, in science, the word error means the uncertainty which accompanies
PRINCIPLE. REF 442635 (200 tests/cartridge) REF 476836 (400 tests/cartridge) ANNUAL REVIEW Reviewed by: Date. Date INTENDED USE
 REF 476836 (400 tests/cartridge) ANNUAL REVIEW Reviewed by: Date. Date INTENDED USE") SYNCHRON System(s) Chemistry Information Sheet Copyright 2010 Beckman Coulter, Inc. Creatine Kinase REF 442635 (200 tests/cartridge) REF 476836 (400 tests/cartridge) For In Vitro Diagnostic Use ANNUAL
SYNCHRON System(s) Chemistry Information Sheet Copyright 2010 Beckman Coulter, Inc. Creatine Kinase REF 442635 (200 tests/cartridge) REF 476836 (400 tests/cartridge) For In Vitro Diagnostic Use ANNUAL