Low Income Trends in York Region to 2011
|
|
|
- Lawrence Kennedy
- 7 years ago
- Views:
Transcription
1 Low Income Trends in York Region to 2011 Information from Statistics Canada Small Area and Administrative Data August, 2014
2 Introduction This information sheet highlights low income trends in York Region from 2000 to 2011using Statistics Canada s Small Area and Administrative Data. This is data generated from income tax returns to provide information on income and some demographic indicators (age and family type) for residents across Canada including York Region. Small Areas and Administrative Data is referred to as income tax data throughout this information sheet. Approach What is income tax data? Income tax data is administrative data. This means it is collected from government program information rather than from surveys. Income tax data is developed by matching personal income tax with other records, such as the Canada Child Tax Benefit, SIN, addresses and birth files. The data is then aggregated into population profiles for families and people not in families. Statistics Canada follows strict confidentiality procedures to develop the data and no personal information or identifiers are provided. Income tax data is a highly accurate data set that covers 100% of tax filers and 96% of all Canadians. It is available annually at a number of geographic levels. 1 How is low income measured? Income tax data uses the Low Income Measure After-Tax (LIM-AT) to identify people who are 1 Income taxes are filed in the spring following the tax year. Income tax data is then developed and issued the following year. For example, 2011 income tax data is developed from the 2011 tax returns filed in the spring of 2012, with data available for release to data users during the summer of living with low income. LIM-AT is calculated as income levels that are 50% of the Canadian after tax median income adjusted for family size and age of children. As an example, in 2011 the LIM- AT was $16,456 for a single person, $32,912 for a couple family with two children under 16 and $34,558 for a couple family with one child over 16 and one under 16. Statistics Canada recalculates LIM-AT every year. A person is considered low income if the income of the family they live in (or, in the case of a person not living in a family, their individual income) fell below the LIM-AT for their family size. Statistics Canada uses census families to calculate LIM-AT for income tax data. A census family includes couples living in the same dwelling with or without children and lone parents with one or more children. All other people are classified as persons not in census families. They may live alone or with another person, such as a family to whom they are related (e.g., brother-in-law, cousin, grandparent) or with a roommate. LIM-AT is just one of several low income lines Statistics Canada uses to track and analyze income trends in Canada (e.g. the Low Income Cut-Off or LICO). Each has their own methodology and different low income thresholds. Income tax data is only available with LIM. Income tax data provides a consistent way to measure low income trends for a population Using income tax data and LIM-AT is a new approach for York Region. Earlier publications of low income information were based on data from the now cancelled long form Census, which used the Before Tax LICO to measure low income. The long form Census data was collected through a mandatory survey of Canadian households. The federal government s decision to replace the long form Census with the voluntary National 1
3 Household Survey for the 2011 Census has disrupted how data users can track low income trends. This is mostly because of a shift in survey methodology. Voluntary surveys are more prone than mandatory surveys to people not responding. This is particularly the case among low and high income groups and can result in having an unrepresentative sample of the population (known as non-response bias). With the new methodology of the National Household Survey, Statistics Canada has indicated that estimates of low income between the National Household Survey and earlier Census long form are not comparable. 2 Income tax data helps fill this gap. It follows a consistent methodology to identify people living on low income so data can be compared over time. Unlike Census data, which is available only every five years, income tax data has the added value of being collected annually. It is important to note that different types of data and low income measures will provide different estimates of low income populations. Data users should be aware of these differences when comparing information from different data sets. Low Income Trends The number of people living on low income is increasing just above population growth As Chart 1 shows, residents living with low income increased from about 98,000 in 2000 to 151,500 in The percent of all residents living with low income (the low income rate) also increased, with the highest during the 2008 and 2009 recession (14.6% and 14.9% respectively) and dropping to 14.3% for 2010 and This is still higher than most years since , , , ,000 80,000 60,000 40,000 20,000 Chart 1 Number and Percent of Low Income Residents in York Region, ,970 98, , , , , , , , ,350 As Chart 2 shows, the growth rate of residents living with low income was slightly above the overall population growth since This suggests that population growth is largely driving the number of low income residents in York Region, but that other factors, as will be discussed later on, are also evident. Overall, the number of residents living with low income grew by almost 55% between 2000 and 2011 compared to 47% for the total popualtion. 148,900 Number of Residents with Low Income Percent of Residents Living with Low Income 151,510 Source: Statistics Canada, Small Area and Administrative Data Division, Annual Estimates for Census Families and Individuals 13C % 15% 14% 13% 12% 11% 10% 2 Statistics Canada (2013). Income Reference Guide National Household Survey. Catalogue No XWE , pages Population growth data used in this information sheet are from income tax data estimates. 2
4 Chart 2 Cumulative Growth Rate, York Region Total Population and Population with Low Income, % 50% 40% 30% 20% 10% 0% Population Growth Low Income Growth workers who had to adjust to losing longstanding jobs. Chart 3 Age of Residents Living with Low Income, York Region 2000 and % % 7.0% 0-17 years 65 years and over years Statistics Canada, Small Area and Administrative Data Division, Annual Estimates for Census Families and Individuals 13C0016 The age and family profiles of low income residents are changing While seniors make up a small part of York Region residents living with low income, Chart 3 shows their share has increased since from about 7% to 11%. This reflects York Region s overall aging profile and also could be a result of: Decreasing coverage of private workplace pension plans Reduced returns from savings and investments Lower earnings for seniors who worked during the recession Senior immigrants who are not eligible for Old Age Security benefits The percent of York Region working age residents living with low income also increased. This could reflect changing labour markets during the 2000s, particularly during the recession of 2008 and The impacts would vary depending on age younger workers who faced challenges in entering or establishing themselves in the labour market and middle-aged to older 65.2% % 11.2% Source: Statistics Canada, Small Area and Administrative Data Division, Annual Estimates for Census Families and Individuals 13C0016 The decreasing share of children also reflects York Region s aging population. As Table 1 shows, while all low income age groups grew in numbers between 2000 and 2011, seniors and working age groups grew faster than children living with low income. Child benefit levels is also a factor, which increased for York Region 3
5 families since 2000 and likely pulled some out of low income. 4 Table 1 Percent Change of York Region Residents Living with Low Income, by Age Group, York Region and Over ,640 60,450 6, ,800 98,770 16,940 % Change 17% 63% 146% Source: Statistics Canada, Small Area and Administrative Data Division, Annual Estimates for Census Families and Individuals 13C0016 Addressing needs of residents living with low income will differ between age groups Income vulnerability requires different responses across age groups. Child benefits and family supports such as child care help parents meet their children s needs while providing a secure environment where children can thrive when parents work. Adults need support in managing major economic and life events, updating skills and sustaining themselves everyday if facing disability or low wage work regardless if they have children or not. Most seniors can expect a basic level of support from Old Age Security, but some may lack enough income to retire and will have to supplement their income through work or rely on informal family support. More low income residents are living alone Chart 4 shows that most York Region residents with low income live in families. However, an increasing percent do not from about 17% in 2000 to 22% in Chart 4 Composition of Low Income Population by Family Type, York Region 15.5% 16.7% 22.1% 14.7% % 63.2% Persons in couple families Persons in loneparent families Non-family persons Source: Statistics Canada, Small Area and Administrative Data Division, Annual Estimates for Census Families and Individuals 4 Changes to child benefits included increases to the National Child Benefit Supplement ( ) and the introduction of the Child Disability Benefit (2003), the Universal Child Care Benefit (2006) and the Ontario Child Benefit (2007). This led to higher average benefit amounts for York Region families who received child benefits between 2000 and 2011 from $1,724 to $3, ,540 York Region families received child benefits in 2011, about 39% of all families. As Table 2 shows, the low income rate for people not living in families increased from close to 24% in 2000 to 31% in In contrast, there was little change for people living in lone parent or couple families. People not living in families are more likely to be low income. Contributing factors could include: fewer government supports 4
6 available to single adults compared to families with children, the impact of the recent recession on singles who faced job loss or the difficulties seniors living alone have living with one income or on survivor benefits. This is further impacted by the shortage of affordable housing in York Region. Table 2 Low Income Rate, By Family Type, York Region Low Income Rate Family type People not in families People in lone parent families People in couple families 24% 31% 28% 27% 11% 11% Source: Statistics Canada, Small Area and Administrative Data Division, , Annual Estimates for Census Families and Individuals, 13C0016 Overall, 33,490 residents not living in families were low income in The number of residents with low income living in lone parent families and couple families was 22,270 and 95,750 respectively in What are the factors impacting on low income trends? Changing demographics People can face periods of low income at different points in their life. Youth who are transitioning from school to work may have low earnings but then progress to better paying jobs over time. The income of seniors usually drops when they stop earning and retire, particularly for women who have had fewer opportunities to work full-time or at the same pay as men. And people who are not in families or who are living in lone parent families are more likely to face low income they have fewer resources available to make ends meet or deal with a financial crisis. Being a newcomer to Canada or part of racialized community, lacking knowledge of English and French, and having a disability are also wellknown factors that place people more at risk of low income. Since 2000, the number of people in these groups is growing in York Region. This reflects York Region s diversity and the need to sustain strategies that promote full inclusion of all groups into York Region s communities and local economy. Employment and business cycles An increase in unemployment rates usually lead to an increase in residents living in low income. This was evident in York Region during the recession of 2008 and 2009 when low income rates peaked. However, employment does not always reduce the risk of having low income, the type of work is as important as being employed. Jobs that are stable and provide good wages, regular hours, and benefits are more likely to keep people above low income levels than jobs that are more precarious or non-standard (i.e. temporary, casual or seasonal, often with low wages and few or no benefits or stability). Employment Surveys indicate job quality remains strong in York Region, however, precarious work continues to rise From 2003 to 2013, full-time employment in York Region decreased as a share of all employment from 77.6% to 73.8%. Parttime employment and contract/seasonal employment increased from 17.8 to 19.7% and from 4.6% to 6.5% respectively. The shift could be attributed to an increase in retail and personal services jobs which are 5
7 typically population-based and generate parttime and seasonal employment. 5 A 2011 survey of working-age residents in the Greater Toronto Area and Hamilton (GTA- H) found that 21% of York Region residents who responded were in temporary employment or were self- employed with no employees. A further 24% reported having jobs with elements of precarity for example, people working full-time but without benefits, not expecting to be employed at the same place for a year or having work hours vary week to week and sometimes below 30 hours. Most people surveyed across the GTA-H who reported low income also faced insecurity in their work. 6 These findings show the need for multiple strategies to: Support people in more insecure jobs to make ends meet, such as affordable housing, child care and access to health and dental benefits Generate good jobs and pathways for low skilled people or those lacking Canadian experience to access workforce opportunities. impact and provide direct supports to many York Region families and individuals. 7 All levels of government offer both targeted and universal programs that residents living with low income can access. Some examples include funding to facilitate access to child care, early intervention and recreation programs and full day kindergarten; supports for low income workers, recent immigrants or residents re-entering the labour market. Other initiatives include health benefits, oral health, healthy babies programs and mental health identification supports for residents living in low income. Housing programs to help keep people housed provide rent supports and supplements, funding for capital repairs and home renovations, and include investments for affordable and social housing projects. Regional and local strategies also have critical roles by helping governments and community stakeholders collaborate and focus resources on preventing and reducing the risk of economic hardship. Government policy Government also influences income levels in many ways (e.g. employment regulations, education, economic development, tax policy), but income benefits have the most immediate 5 York Region (2014). Employment and Industry 2013 p. 6. (Retrieved from 6 The survey was conducted during the fall 2011 by the Poverty and Employment Precarity in Southern Ontario (PEPSO) project, a joint initiative of McMaster University and the United Way Toronto. The survey was a random sample of 4,165 respondents aged 25 to 65 from across Toronto, Hamilton, Burlington and Peel, Durham and York Regions (Markham, Richmond Hill and Vaughan). Wayne Lewchuk, et al. (2013) It s More than Poverty: Employment Precarity and Household Well-being. PEPSO, p. 24 and 59 (Retrieved from 7 The number of York Region residents who received income benefits ranged from 79% to 97% between 2000 and The higher end reflects the almost universal receipt of the Ontario Sales Tax Benefit Transition payments in 2010 and This was meant to provide temporary relief to Ontario residents to help them adjust to the introduction of the Harmonized Sales Tax (HST). Other major government income benefits include workers compensation payments, Canada Pension Plan (regular and disability), Old Age Security, Working Income Tax Benefit, federal and provincial child benefits and other federal and provincial refundable tax credits. 6
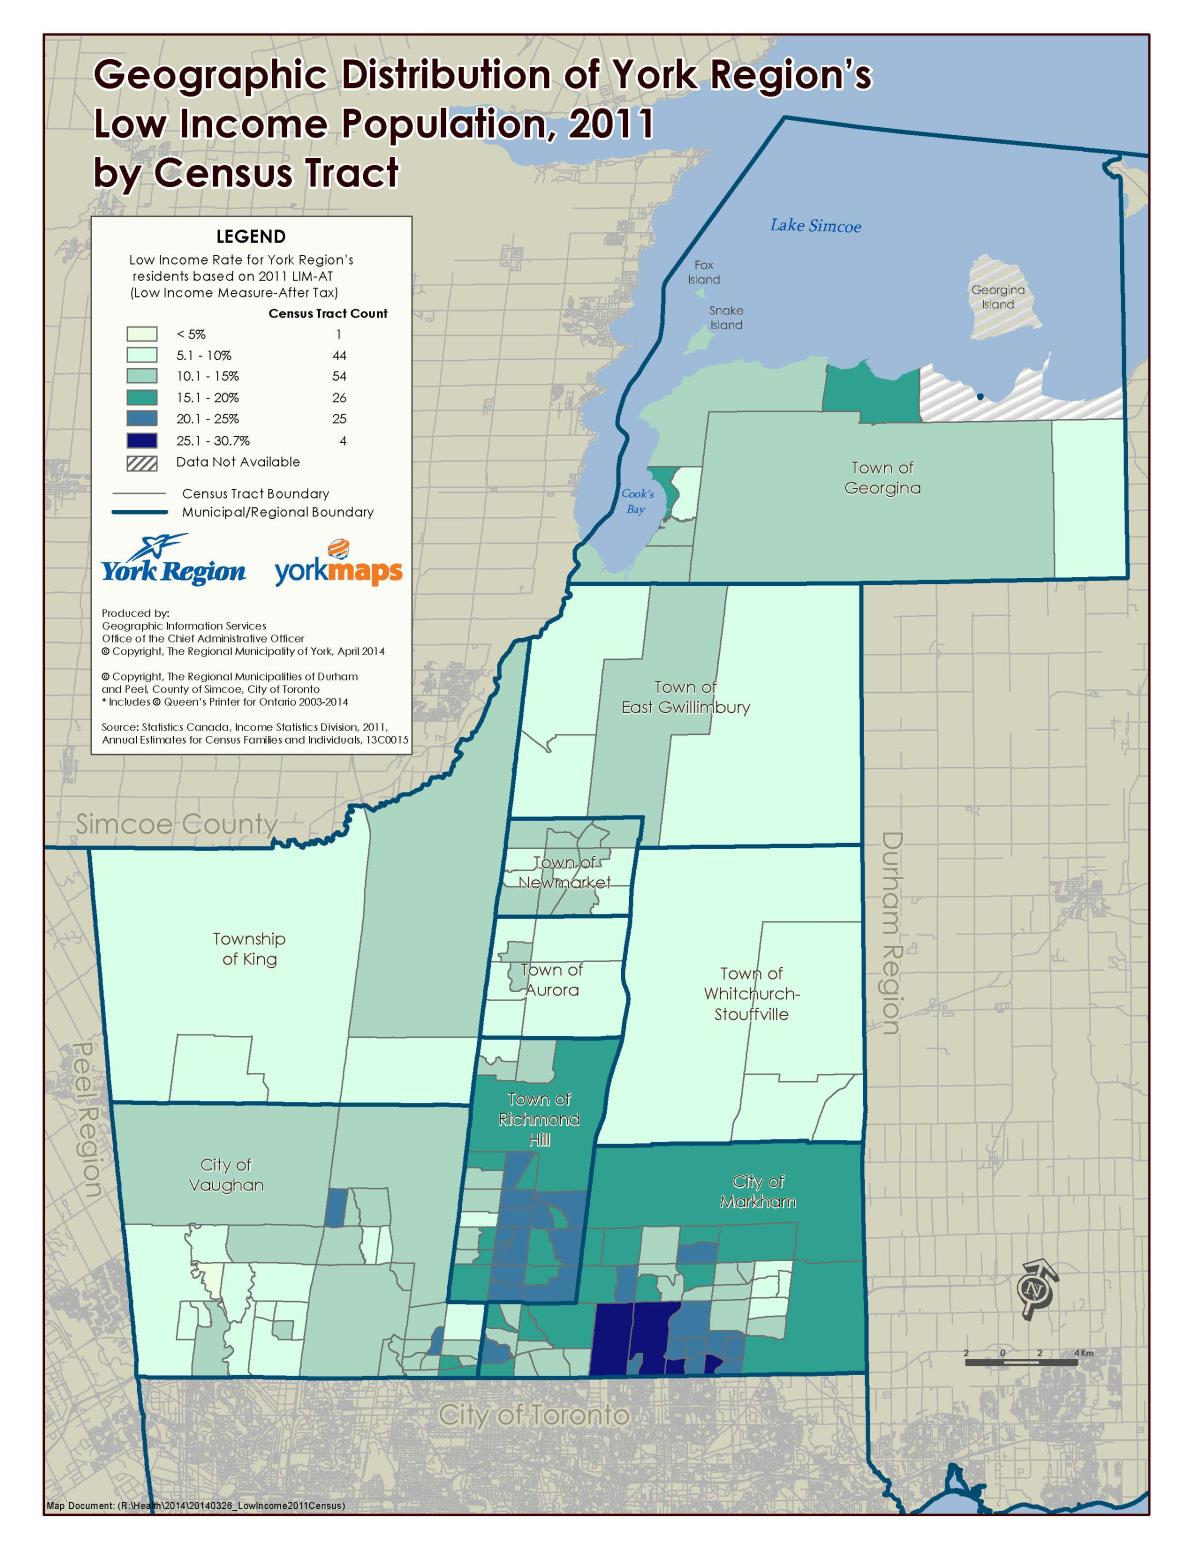
8 18.3% 17.5% 11.7% 10.2% 8.9% 12.3% 8.6% 8.9% 8.4% Distribution of residents living with low income Low income is suburbanizing across the Greater Toronto Area Low income rates vary across the Greater Toronto Area. As Chart 5 shows, York Region is in the middle with higher rates in Peel Region and the City of Toronto and lower rates in Durham and Halton Regions. Like all areas except Toronto, York Region experienced an increase in low income rates between 2006 and % 20% 15% 10% Chart 5 Low Income Rates, Canada, Ontario and Greater Toronto Area, 2006 and % 0% Low income rates vary between local municipalities As Chart 6 shows, Markham and Richmond Hill had low income rates higher than the York Region average in Statistics Canada, Small Area and Administrative Data, 2006 and 2011 Annual Estimates for Census Families and Chart 6 Percent of Residents with Low Income, York Region Local Municipalities, % 16% 12% 8% 4% 0% York Region, 14.3% Source: Statistics Canada, Small Area and Administrative Data Division, , Annual Estimates for Census Families and Individuals, 13C0016 Where do residents with low income live? While residents with low income live across York Region, the majority - about 84% - live in the three southern local municipalities of Markham, Richmond Hill and Vaughan. Map 1 provides community level information by census tracts 8 which can be used as a baseline for understanding the extent low income is becoming concentrated in York Region. This can be looked at in two ways. The first way is by the number of census tracts with moderately high low income rates (20% to 30.7%). In 2011, this included about 19% of all census tracts. 9 8 Census tracts usually have a population of 2,500 to 8, The term moderately high low income rates reflect classifications developed by Canadian Council on Social Development to measure neighborhood poverty. These classifications include: Low = low income rates of zero to 10%; Moderate = 10.1% to 20.0%; moderately high = 20.1% to 30.7%; High = 30.7% to 40.0%; and Very high = 40.1% or more. York Region has no census tracts at the high to very high levels. Canadian Council on Social Development (CCSD) (2007). Poverty by Geography: Urban Poverty in Canada, Ottawa. 7
9 The second way is by looking at the number of low income residents who live in census tracts with moderately high low income rates. In 2011, this included about 30% of all low income residents. Both measures suggest that York Region has avoided high levels of concentrated low income at the community level and most residents living with low income are generally integrated into mixed income communities. Tracking future changes in these measures will be important in determining how well York Region is helping sustain communities that are inclusive for all income levels. Low income residents living in more affluent areas are more likely to benefit from having access to employment and recreational and community facilities. However, they may also have a hard time finding affordable housing and targeted services that help them participate in their community. They may also struggle in avoiding stigma if they cannot pay for extracurricular activities for their children. For low income residents living in rural areas of York Region, accessing services and affordable transportation may be challenges. Organizations wishing to use any portion of this publication are requested to use the following citation when referencing this document: The Regional Municipality of York, Low Income Trends in York Region 2000 to Newmarket, Ontario. For More Information Research and analysis for this information sheet is prepared by the Strategies and Partnerships Branch, Community and Health Services Department, the Regional Municipality of York. This information is not exhaustive of all research relevant to York Region. It is provided for reference purposes only. York Region accepts no liability for the consequences of any actions taken on the basis of the information provided. For all inquiries and questions regarding this information, its dissemination and use, please contact CHSDataandPolicy@york.ca or visit Accessible formats or communication supports are available upon request. 8
10 Map 1
9 2011 NATIONAL HOUSEHOLD SURVEY ISSUES AND DEMOGRAPHIC HIGHLIGHTS
 Clause No. 9 in Report No. 1 of was adopted, without amendment, by the Council of The Regional Municipality of York at its meeting held on January 23, 2014. 9 2011 NATIONAL HOUSEHOLD SURVEY ISSUES AND
2011 Census: Population and Dwelling Counts
 February 8, 2012 2011 Census: Population and Dwelling Counts The 2011 Census Day was May 9, 2011. Today, Statistics Canada released its first set of data from this Census, on population and dwellings.
What if York Region were a village of just
 What if York Region were a village of just 00 PEOPLE? York Region is a diverse global village, made up of many different types of people of various backgrounds and languages. York Region is also fast-growing.
Challenges Facing Youth Transitioning to Work
 Challenges Facing Youth Transitioning to Work November 2015 2015 Community Development Halton, all rights reserved. Copies of this document may be reproduced non-commercially for the purpose of community
FILING INCOME TAXES AND ACCESSING FOOD BANKS
 1 FILING INCOME TAXES AND ACCESSING FOOD BANKS Are Ontarians with low-income getting the benefits they are entitled to? 2011 Research Paper presented by: As the government of Ontario commits to review
Annual Income Estimates for Census Families and Individuals (T1 Family File) Family Data. - User's Guide -
 Family Data. - User's Guide -") Annual Income Estimates for Census Families and Individuals (T1 Family File) Family Data - User's Guide - Statistics Canada 13C0016 Income Statistics Division Statistics Canada income@statcan.gc.ca June
Annual Income Estimates for Census Families and Individuals (T1 Family File) Family Data - User's Guide - Statistics Canada 13C0016 Income Statistics Division Statistics Canada income@statcan.gc.ca June
Competitive Analysis Economic Vision for the City of Burlington
 Competitive Analysis Economic Vision for the City of Burlington Burlington Economic Development Corporation DRAFT 1 Millier Dickinson Blais ACKNOWLEDGEMENT This report has been supported by the Ministry
Who Is Working For Minimum Wage In Ontario? By Sheila Block
 Who Is Working For Minimum Wage In Ontario? By Sheila Block October, 2013 The Wellesley Institute engages in research, policy and community mobilization to advance population health. Copies of this report
Immigration, Citizenship, Place of Birth, Ethnicity, Visible Minorities, Religion and Aboriginal Peoples
 May 9, 2013 2011 National Household Survey: Immigration, Citizenship, Place of Birth, Ethnicity, Visible Minorities, Religion and Aboriginal Peoples The 2011 Census/National Household Survey Day was May
Florida s Families and Children Below the Federal Poverty Level
 Florida s Families and Children Below the Federal Poverty Level Florida Senate Committee on Children, Families, and Elder Affairs Presented by: February 17, 2016 The Florida Legislature Office of Economic
Canada Population: Fertility rate: GDP per capita: Children under 6 years: Female labour force participation:
 Canada Population: 32.2 m. Fertility rate: 1.53. GDP per capita: USD 30 700. Children under 6years: 2 074 860 (2005). Female labour force participation: 73.5% of women (15-64) participate in the formal
Catching Up to Reality: Building the Case for a New Social Model
 Catching Up to Reality: Building the Case for a New Social Model by Jane Jenson Executive Summary January 2004 Research Report F 35 CPRN Social Architecture Papers, is available at http://www.cprn.org
LABOUR MARKET INFORMATION IN THE GREATER TORONTO AREA: GETTING BEHIND THE NUMBERS
 LABOUR MARKET INFORMATION IN THE GREATER TORONTO AREA: GETTING BEHIND THE NUMBERS Prepared for the ICE Committee Prepared by: Tom Zizys March 2015 Executive Summary The Intergovernmental Committee for
ON LABOUR AND INCOME. JUNE 2002 Vol. 3, No. 6 HOUSING: AN INCOME ISSUE PENSIONS: IMMIGRANTS AND VISIBLE MINORITIES.
 Catalogue no. 75-001-XIE ON LABOUR AND INCOME JUNE 2002 Vol. 3, No. 6 HOUSING: AN INCOME ISSUE PENSIONS: IMMIGRANTS AND VISIBLE MINORITIES Statistics Canada Statistique Canada Sophie Lefebvre HOUSING IS
Workforce Ages 25-64 Employment in the ICT Sector (by NAICS) Ontario s Key Technology Cluster 192,245
 Ontario s Key Technology Cluster 192,245") Workforce Ages 25-64 Employment in the ICT Sector (by NAICS) Ontario s Key Technology Clusters 200000 150000 100000 192,245 50000 0 Greater Toronto Area (incl. York Region) 35,070 Ottawa 19,390 Size of
Workforce Ages 25-64 Employment in the ICT Sector (by NAICS) Ontario s Key Technology Clusters 200000 150000 100000 192,245 50000 0 Greater Toronto Area (incl. York Region) 35,070 Ottawa 19,390 Size of
Gre ater Tro uble in Gre ater Toro nto:
 Gre ater Tro uble in Gre ater Toro nto: Child Poverty in the GTA Children s Aid Society of Toronto, December 2008 Table of Contents Greater Trouble in Greater Toronto: Child Poverty in the GTA 1 2 3 3
Article. Economic Well-being. by Cara Williams. December 2010. Component of Statistics Canada Catalogue no. 89-503-X
 Component of Statistics Canada Catalogue no. 89-503-X Women in Canada: A Gender-based Statistical Report Article Economic Well-being by Cara Williams December 2010 How to obtain more information For information
Men retiring early: How How are they doing? Dave Gower
 Men retiring early: How retiring are they doing? early: How are they doing? Dave Gower During the first half of this century, men generally stayed in the labour force until at least age 65. In the second
Community Development & Recreation Committee. Acting Executive Director, Social Development, Finance & Administration
 STAFF REPORT ACTION REQUIRED CD2.6 Toronto Social Development Dashboard Date: March 9, 2015 To: From: Wards: Reference Number: Community Development & Recreation Committee Acting Executive Director, Social
IS PRECARIOUS EMPLOYMENT LOW INCOME EMPLOYMENT? THE CHANGING LABOUR MARKET IN SOUTHERN ONTARIO
 51 Just Labour: A Canadian Journal of Work and Society Volume 22 Autumn 2014 IS PRECARIOUS EMPLOYMENT LOW INCOME EMPLOYMENT? THE CHANGING LABOUR MARKET IN SOUTHERN ONTARIO Wayne Lewchuk Professor, School
Aboriginal People and the Labour Market: Estimates from the Labour Force Survey, 2008-2010
 Catalogue no. 71-588-X, no. 3 ISSN 1919-1200 ISBN 978-1-100-19433-2..Research paper... The Aboriginal Labour Force Analysis Series Aboriginal People and the Labour Market: Estimates from the Labour Force
Incomes and Poverty Report Burlington
 Incomes and Poverty Report Burlington March 2011 2011 Community Development Halton, all rights reserved. Copies of this document may be reproduced non-commercially for the purpose of community awareness
Estevan Student and Market Rental Housing Project. Assessment Report
 Estevan Student and Market Rental Housing Project Assessment Report This Estevan Student and Market Rental Housing Project Assessment has been prepared by Preferred Choice (DJ Leier Enterprises Ltd.) with
Dimensions of core housing need in Canada
 C O O P E R A T I V E H O U S I N G F E D E R A T I O N O F C A N A D A Dimensions of core housing need in Canada Completed by Will Dunning Inc. for Co-operative Housing Federation of Canada July 2007
FACTS ABOUT ABORIGINAL PERSONS IN CALGARY
 FACTS ABOUT ABORIGINAL PERSONS IN CALGARY Copyright 2010 City of Calgary, Community & Neighbourhood Services, Social Policy & Planning Division INTRODUCTION This fact sheet provides an overview of Aboriginal
Unemployment and Unemployment Insurance: a tale of two sources
 Winter 1989 (Vol. 1, No. 3) Unemployment and Unemployment Insurance: a tale of two sources Jean-Mare Lévesque In 1988, unemployment averaged over one million, based on results from the Labour Force Survey
MEASURING INCOME DYNAMICS: The Experience of Canada s Survey of Labour and Income Dynamics
 CANADA CANADA 2 MEASURING INCOME DYNAMICS: The Experience of Canada s Survey of Labour and Income Dynamics by Maryanne Webber Statistics Canada Canada for presentation at Seminar on Poverty Statistics
4 PROPERTY TAX RELIEF OPTIONS FOR SENIORS, LOW-INCOME DISABLED AND OTHER LOW-INCOME PERSONS
 4 PROPERTY TAX RELIEF OPTIONS FOR SENIORS, LOW-INCOME DISABLED AND OTHER LOW-INCOME PERSONS (Regional Council, at its meeting on June 21, 2007, amended the following report to provide that: (a) the Commissioner
Bearing the Brunt: How the 2008-2009 Recession Created Poverty for Canadian Families
 Bearing the Brunt: How the 2008-2009 Recession Created Poverty for Canadian Families Citizens for Public Justice #501-309 Cooper Street Ottawa, ON K2P 0G5 T : 1-800-667-8046 F : 613-232-1275 E: cpj@cpj.ca
WORKING PAPER 5: HOW TO PROVIDE RETIREMENT BENEFITS *
 WORKING PAPER 5: HOW TO PROVIDE RETIREMENT BENEFITS * 1. Key challenge & overview People in precarious employment are less likely to have access to benefits, including retirement benefits. Retirement income
Social Security: Vital to Retirement Security for 35 Million Women and Men
 IWPR Publication #D487 March 2010 Social Security: Vital to Retirement Security for 35 Million Women and Men Jeff Hayes, Heidi Hartmann, and Sunhwa Lee This Briefing Paper examines major sources of income
HIGHLIGHTS. 4.10 thousand people per km 2 45.0% 41.0% live in apartment buildings of 5 or more storeys 17.4% 17.9% 4.9% 5.3%
 HIGHLIGHTS Population Toronto 2011 Population By Age Group Ward Population 667,840 + 4.4% 2006-2011 35% 30% 25% Population Density 20% 15% 10% 4.10 thousand people per km 2 5% 0% 0-14 15-24 25-44 45-64
Proposed Full Tax Deferral Program
 Tax Relief for Low ncome Seniors (FN-20-15) Administration & Finance Committee April 22, 2015 Mark Scinocca, Commissioner of Finance and Regional Treasurer Background xisting tax increase deferral program
How To Help The Region Of Peel
 2015 Federal Pre-Budget Submission The Honourable Joe Oliver Minister of Finance 2015 Introduction As one of Canada s largest and most diverse communities, the Region of Peel is an important hub of economic
Saskatchewan Poverty Progress Profile
 Saskatchewan Poverty Progress Profile OVERVIEW Currently, Saskatchewan does not have a provincial poverty strategy in place. Employment is booming, but poverty remains a sore point in the social fabric
Precarious Jobs in Ontario: Mapping Dimensions of Labour Market. Insecurity by Workers Social Location and Context
 Precarious Jobs in Ontario: Mapping Dimensions of Labour Market Insecurity by Workers Social Location and Context Andrea M. Noack and Leah F. Vosko 1 i TABLE OF CONTENTS I. INTRODUCTION... 1 II. UNDERSTANDING
Introduction. Employment and occupational characteristics of retail commerce and working conditions in the sector INTERNATIONAL LABOUR ORGANIZATION
 INTERNATIONAL LABOUR ORGANIZATION Global Dialogue Forum on the Needs of Workers in relation to Changing Work Processes and the Working Environment in Retail Commerce GDFRC/2011/9 Geneva 21 22 September
You may elect coverage under each benefit separately or elect coverage under a combination of benefits.
 All college retirees 1 Academic, Support and Administrative are covered under this plan. These benefits may be changed from time to time by the College Compensation and Appointments Council (Council).
HIGHLIGHTS. 3.31 thousand people per km 2. 41.0% live in apartment buildings of 5 or more storeys 34.5% 17.9% 17.9% 4.6% 5.3%
 HIGHLIGHTS Population Toronto Ward Population 620,175 + 3.3% 2006-2011 35% 30% 2011 Population By Age Group 25% Population Density 20% 15% 10% 3.31 thousand people per km 2 5% 0% 0-14 15-24 25-44 45-64
Occupational Therapists in Canada, 2010 National and Jurisdictional Highlights and Profiles
 Occupational Therapists in Canada, 2010 National and Jurisdictional Highlights and Profiles October 2011 Spending and Health Workforce Who We Are Established in 1994, CIHI is an independent, not-for-profit
Ontario Trends in Occupational Defined Benefit and Defined Contribution Pension Coverage
 Ontario Trends in Occupational Defined Benefit and Defined Contribution Pension Coverage richard@shillington.ca www.shillington.ca Informetrica Limited Ontario Trends in Occupational Defined Benefit and
PreventingandReducingPoverty. AStrategyforEngagement. DiscussionPaper
 PreventingandReducingPoverty inprinceedwardisland: AStrategyforEngagement DiscussionPaper July2011 Table of Contents Foreword... 1 1.0 Introduction: Towards One Island Society... 2 2.0 Definitions and
Working After Age 65
 ALTERNATIVE FEDERAL BUDGET 2012 TECHNICAL PAPER Working After Age 65 What is at Stake? Angella MacEwen Highlights The OAS and GIS combined today provide one third of the income of all seniors aged over
Homelessness Partnering Strategy Community Plan 2014 2019. Community: Ottawa Aboriginal Region: Ontario
 Homelessness Partnering Strategy Community Plan 2014 2019 Community: Ottawa Aboriginal Region: Ontario The plan has been approved by Canada for implementation. As this Aboriginal Homelessness allocation
Local and Regional Labour Market Trends in the Canadian Automotive Manufacturing Industry
 Local and Regional Labour Market Trends in the Canadian Automotive Manufacturing Industry by Dan Irvine APRC Industry Research Assistant with Support from Unifor Restructuring in the Automotive Industry
State of Working Britain
 State of Working Britain Aim is to Gives an up to date assessment of the performance of UK labour market, to highlight recent important developments seeks to describe and understand the major long-term
Statistics Canada s National Household Survey: State of knowledge for Quebec users
 Statistics Canada s National Household Survey: State of knowledge for Quebec users Information note December 2, 2013 INSTITUT DE LA STATISTIQUE DU QUÉBEC Statistics Canada s National Household Survey:
How is poverty measured in Canada?
 How is poverty measured in Canada? Unlike the United States and some other countries, Canada has no official, governmentmandated poverty line. It is generally agreed that poverty refers to the intersection
Labour Market Outcomes of Young Postsecondary Graduates, 2005 to 2012
 Catalogue no. 11-626-X No. 050 ISSN 1927-503X ISBN 978-0-660-03237-5 Economic Insights Labour Market Outcomes of Young Postsecondary Graduates, 2005 to 2012 by Kristyn Frank, Marc Frenette, and René Morissette
Forecasting Ottawa s Economic Future
 Forecasting Ottawa s Economic Future Never Assume that the Ottawa-Gatineau Economy is Down and Out Mario Lefebvre Director, Centre for Municipal Studies Chateau Laurier, Ottawa October 31, 2012 Uneven
Trends. Challenges. Barriers. Conclusions. November 24, 2004
 A SELF EMPLOYMENT POLICY DISCUSSION PAPER Trends. Challenges. Barriers. Conclusions November 24, 2004 Prepared by: Robert Wilson and Simon Bailey Edited by: Peter Nares and Jennifer Robson-Haddow Page
TRADE UNION MEMBERSHIP 2014. Statistical Bulletin JUNE 2015
 TRADE UNION MEMBERSHIP 2014 Statistical Bulletin JUNE 2015 Contents Contents... 2 Introduction... 3 Key findings... 5 1. Long Term Trends... 6 2.Private and Public Sectors. 12 3. Personal and job characteristics...
DEPARTMENT OF COMMUNITY SERVICES
 DEPARTMENT OF COMMUNITY SERVICES ANNUAL ACCOUNTABILITY REPORT FISCAL YEAR 2012-2013 Table of Contents 1.0 Accountability Statement... 2 2.0 Message from the Minister... 3 3.0 Introduction... 4 4.0 Accomplishments...
Early retirement trends
 Patrick Kieran IN THE EARLY 197S, one in five Canadians was 5 or older. By 8, one in three will fall into this age group. This reality has led many researchers to focus on the potential consequences of
ONTARIO RETIREMENT PENSION PLAN
 THE ONTARIO RETIREMENT PENSION PLAN DISCUSSING A MADE-IN-ONTARIO SOLUTION ASSOCIATE MINISTER S MESSAGE Ask a child what they want to be when they grow up and they ll tell you. A doctor. An astronaut.
Canadian Women And Pensions
 Myths About Canadian Women And Pensions Retirement income for women has improved over the last several decades. However, not all women working today will experience financial security in their senior years.
PENSIONS AT A GLANCE 2011: RETIREMENT-INCOME SYSTEMS IN OECD COUNTRIES PORTUGAL
 PENSIONS AT A GLANCE 2011: RETIREMENT-INCOME SYSTEMS IN OECD COUNTRIES Online Country Profiles, including personal income tax and social security contributions PORTUGAL Portugal: pension system in 2008
FINLAND 2001. 1. Overview of the system
 FINLAND 2001 1. Overview of the system There exists a three-tier system of unemployment benefits: a basic benefit, an earnings related benefit and a means-tested benefit. The earnings related supplement
The automotive manufacturing sector is
 BUILDING A SUSTAINABLE WORKFORCE: APPRENTICESHIP IN THE CANADIAN AUTOMOTIVE INDUSTRY The Canadian Automotive Manufacturing Industry at a Glance The automotive manufacturing sector is struggling in the
NATIONAL BABY FACTS. Infants, Toddlers, and Their Families in the United States THE BASICS ABOUT INFANTS AND TODDLERS
 NATIONAL BABY FACTS Infants, Toddlers, and Their Families in the United States T he facts about infants and toddlers in the United States tell us an important story of what it s like to be a very young
UNITED KINGDOM 2003. The UK Financial year runs from April to April. The rates and rules below are for June 2003.
 UNITED KINGDOM 2003 The UK Financial year runs from April to April. The rates and rules below are for June 2003. 1. Overview of the system The United Kingdom has a contributory flat-rate unemployment insurance
Policy in Focus SUMMARY. Maytree. Featured Research. Fix Employment Insurance to support the temporarily unemployed. Background and Context...
 The Maytree Foundation Maytree Policy in Focus issue 2 Dec 07 Background and Context...2 Employment Insurance Doesn t Insure Many Canadians Featured Research...4 Towards a New Architecture Canada s Adult
Women, Wages and Work A report prepared by the UNC Charlotte Urban Institute for the Women s Summit April 11, 2011
 A report prepared by the UNC Charlotte Urban Institute for the Women s Summit April 11, 2011 A report prepared for the Women s Summit by the UNC Charlotte Urban Institute 1 Table of Contents Table of Contents...
Discouraged workers - where have they gone?
 Autumn 1992 (Vol. 4, No. 3) Article No. 5 Discouraged workers - where have they gone? Ernest B. Akyeampong One of the interesting but less publicized labour market developments over the past five years
PENSIONS AT A GLANCE 2009: RETIREMENT INCOME SYSTEMS IN OECD COUNTRIES UNITED STATES
 PENSIONS AT A GLANCE 29: RETIREMENT INCOME SYSTEMS IN OECD COUNTRIES Online Country Profiles, including personal income tax and social security contributions UNITED STATES United States: pension system
Profile of Rural Health Insurance Coverage
 Profile of Rural Health Insurance Coverage A Chartbook R H R C Rural Health Research & Policy Centers Funded by the Federal Office of Rural Health Policy www.ruralhealthresearch.org UNIVERSITY OF SOUTHERN
Evolution of informal employment in the Dominican Republic
 NOTES O N FORMALIZATION Evolution of informal employment in the Dominican Republic According to official estimates, between 2005 and 2010, informal employment fell from 58,6% to 47,9% as a proportion of
UNINSURED ADULTS IN MAINE, 2013 AND 2014: RATE STAYS STEADY AND BARRIERS TO HEALTH CARE CONTINUE
 UNINSURED ADULTS IN MAINE, 2013 AND 2014: RATE STAYS STEADY AND BARRIERS TO HEALTH CARE CONTINUE December 2015 Beginning in January 2014, the federal Patient Protection and Affordable Care Act (ACA) has
Expanding Health Coverage in Kentucky: Why It Matters. September 2009
 Expanding Health Coverage in Kentucky: Why It Matters September 2009 As the details of federal health reform proposals consume the public debate, reflecting strong and diverse opinions about various options,
9 JOB POSTINGS IN YORK REGION - 2013 TRENDS
 Clause No. 9 in Report No. 7 of was adopted, without amendment, by the Council of The Regional Municipality of York at its meeting held on April 17, 2014. 9 JOB POSTINGS IN YORK REGION - 2013 TRENDS recommends
Opportunities Ontario: Provincial Nominee Program Overview
 Opportunities Ontario: Provincial Nominee Program Overview Temporary Foreign Worker Seminar Windsor, ON March 26, 2013 2 What is Opportunities Ontario? Opportunities Ontario: Provincial Nominee Program:
Coping with Cancer: Know how to get financial help
 Coping with Cancer: Know how to get financial help For patients living with cancer UHN Read this booklet to learn about: What programs are available to you How to apply for and use the programs Programs
HUNGARY. 1. Overview of the system
 HUNGARY 1. Overview of the system is compulsory; benefits are paid for a maximum period of 12 months. A social assistance benefit exists as a last resort financial aid. Income-tested housing benefits are
Household Composition Income & Assets Review
 GREATER SUDBURY SOCIÉTÉ DE LOGEMENT HOUSING CORPORATION DU GRAND SUDBURY Household Composition Income & Assets Review To continue to be eligible for assisted rental housing, you are required by the terms
Policy Brief. St. James Town Research into Action: Immigrant Employment
 Policy Brief St. James Town Research into Action: Immigrant Employment Produced by Matt Kanter November 2009 The evaluation of my credentials from my country were not evaluated the same as in my country
Federal Contribution to Reducing Poverty in Canada
 Federal Contribution to Reducing Poverty in Canada Brief to the House of Commons Standing Committee on Human Resources, Skills and Social Development and the Status of Persons with Disabilities (HUMA)
MANITOBA EARLY CHILDHOOD EDUCATION PROFILE NOVEMBER 2011
 MANITOBA EARLY CHILDHOOD EDUCATION PROFILE NOVEMBER 2011 GOVERNANCE Manitoba: Governance structure early childhood education Lead ministry/ Department of Family Services and Consumer Affairs department
How s Life in Australia?
 How s Life in Australia? The OECD Better Life Initiative, launched in 2011, focuses on the aspects of life that matter to people and that shape their quality of life. The Initiative comprises a set of
TOP 3 OBSTACLES TO SMALL BUSINESS SUCCESS
 TOP 3 OBSTACLES TO SMALL BUSINESS SUCCESS About this report In 2016, the Ontario Chamber of Commerce (OCC), in partnership with chambers of commerce and boards of trade from across the province, is embarking
A Sloan Work & Family Research Network Fact Sheet
 Questions and Answers about GENERATION X/GENERATION Y: Y A Sloan Work & Family Research Network Fact Sheet Introduction The Sloan Work and Family Research Network has prepared Fact Sheets that provide
Guideline scope Workplace health: support for employees with disabilities and long-term conditions
 NATIONAL INSTITUTE FOR HEALTH AND CARE EXCELLENCE Guideline scope Workplace health: support for employees with disabilities and long-term conditions Short title Workplace health: employees with disabilities
Affordable, Quality Child Care: A Great Place to Grow! June 2016
 Affordable, Quality Child Care: A Great Place to Grow! June 2016 Table of Contents 1 Introduction 3 Affordability 5 Quality 7 Support and Development of the Workforce 11 Accessibility 13 Structure and
Updating the Benefits of the GST New Housing Rebate
 Housing Affordability and Choice for Canadians: Building on Success Updating the Benefits of the Introduction: When the Goods and Services Tax (GST) was introduced in 1991, the federal government recognized
Adecade into the 21st century, Michigan s longbruised
 Michigan League FOR Human Services December 2010 Michigan's Economy Continues to Cause Pain: Communities of Color Take a Harder Hit Adecade into the 21st century, Michigan s longbruised economy continues
Impact of the recession
 Regional Trends 43 21/11 Impact of the recession By Cecilia Campos, Alistair Dent, Robert Fry and Alice Reid, Office for National Statistics Abstract This report looks at the impact that the most recent
Strategies to Support Work and Reduce Poverty Eileen Trzcinski
 Strategies to Support Work and Reduce Poverty Eileen Trzcinski Overview of Low Income Working Families in Michigan 1998, the Michigan Budget and Tax Policy Project, an initiative of the Michigan League
THE WAY TO BUILDING A BETTER ONTARIO 2016 Ontario Pre-Budget Submission
 THE WAY TO BUILDING A BETTER ONTARIO 2016 Ontario Pre-Budget Submission February 2016 Tel/Tél: 416.497.4110 Toll-free/Sans frais: 1.800.268.5763 Fax/Téléc: 416.496.6552 Who is Unifor Unifor is a new Canadian
Now and Tomorrow Excellence in Everything We Do
 Now and Tomorrow Excellence in Everything We Do Disability in Canada: A 2006 Profile ISSD-042-02-11 You can order this publication by contacting: Publishing Services Human Resources and Skills Development
Poverty among ethnic groups
 Poverty among ethnic groups how and why does it differ? Peter Kenway and Guy Palmer, New Policy Institute www.jrf.org.uk Contents Introduction and summary 3 1 Poverty rates by ethnic group 9 1 In low income
City of Surrey. Preface. Total Income Fact Sheet
 City of Total Income Fact Sheet Preface Statistics Canada conducts its Census of Population every five years with the most recent census having occurred in 2006. The Census provides information on the
An Analysis of the Social Housing Waiting List in the Region of Ottawa-Carleton. Submitted April 25, 2000
 An Analysis of the Social Housing Waiting List in the Region of Ottawa-Carleton Submitted April 25, 2000 Research Analyst: Jane Whynot Project Management: Ishbel Solvason-Wiebe Karilyn Warr Table of Contents
New Jersey Kids Count 2014 The State of Our Children
 New Jersey Kids Count 2014 The State of Our Children April 24, 2014 Advocates for Children of New Jersey 35 Halsey Street Newark, NJ 07102 973.643.3876 Advocates for Children of New Jersey 2014 What is
Personal debt ON LABOUR AND INCOME
 ON LABOUR AND INCOME Personal debt Although the economy and population are almost times the size of s, the two countries show several similarities. Both have relatively high per-capita income and living
CFUW Ontario Council Response To the. Consultations on the Ontario Retirement Pension Plan
 CFUW Ontario Council Response To the Consultations on the Ontario Retirement Pension Plan February 2015 Submitted by Brenda Robertson President, Ontario Council Canadian Federation of University Women
Population and socio-economic trends in Ontario
 Population and socio-economic trends in Ontario Presentation by Dr. Ivan P. Fellegi, Chief Statistician of Canada February 17 th, 2007 International migration accounts for a larger share of population
Table 1: Health Unit Profiles Initial Report on Public Health, 2014 Update (revised February 2015)
") Size of Region (km 2 ) Population stimates Population Growth Rate (2008-2012) Population Density (km 2 ) % Immigrants # First Nations mployment Rate Northern Regions (H) H Northwestern 171,288 86,175 0.7%
Size of Region (km 2 ) Population stimates Population Growth Rate (2008-2012) Population Density (km 2 ) % Immigrants # First Nations mployment Rate Northern Regions (H) H Northwestern 171,288 86,175 0.7%
Demographic Analysis of the Salt River Pima-Maricopa Indian Community Using 2010 Census and 2010 American Community Survey Estimates
 Demographic Analysis of the Salt River Pima-Maricopa Indian Community Using 2010 Census and 2010 American Community Survey Estimates Completed for: Grants & Contract Office The Salt River Pima-Maricopa
Immigrant & Racialized Women s Issues in Home and Community Care. Dipti Purbhoo Toronto Central CCAC February 21, 2014
 Immigrant & Racialized Women s Issues in Home and Community Care Dipti Purbhoo Toronto Central CCAC February 21, 2014 The World of the TC-CCAC 8000 hospital to home transitions 20 000 clients served in
Employees. Table of Contents
 Table of Contents 1. Introduction 2 2. Recruitment 2 3. Pay and Leave Administration 5 3.1 Pay Administration 5 3.2 Leave Administration 7 4. Benefits 10 5. Employee Assistance Program 12 6. Conflict Resolution
London Community Housing Strategy (LCHS) Questions and Answers
 Questions and Answers") London Community Housing Strategy (LCHS) Questions and Answers What is London s Community Housing Strategy? London s Community Housing Strategy provides direction about how the City can meet the range
London Community Housing Strategy (LCHS) Questions and Answers What is London s Community Housing Strategy? London s Community Housing Strategy provides direction about how the City can meet the range