The Easy R s of EKG Interpretation
|
|
|
- Matthew Stevens
- 9 years ago
- Views:
Transcription
1 The Easy R s of EKG Interpretation I. Let us start at the beginning: The EKG /Rhythm strip is a graphic tracing of the electrical activity of the myocardial cells. It measures the length of time it takes for the initial impulse to fire at the Sino Atria Node (Sinus Node) and then ends in the contracting of the Ventricles. Normally, the impulse starts at the SA Node, and then travels down the internodal pathways stimulating the atria. The impulse then pauses briefly at the AV node to allow complete contraction of the atria to dump more preload into the ventricles. From the AV node, the impulse travels to the Bundle of His, Right and Left Bundle Branches, throughout the Purkinje Fibers and results in stimulation and depolarization/contraction of the Ventricles. The contraction/depolarization of the atria causes a P wave on the EKG. The contraction/depolarization of the ventricles causes a QRS waveform on the EKG indicating ventricular systole. As the myocardium relaxes during diastole and repolarizes, a T wave is results on the EKG. We will not address U wave here as its origin is still in question. Certain disease states, medications and/or electrolyte imbalances can cause alterations in the normal electrical activity of the heart. This can result in delays, slow rhythms, fast rhythms and/or ectopic beats (these are beats originating outside the normal cardiac electrical pathway). If there is a delay in the length of time it takes the impulse to travel from the SA Node to the AV node (>0.20 seconds) initiating atrial contraction, this is called a First Degree AV Block. If the QRS measures > 0.12 seconds or 3 small boxes this is called a Bundle Branch Block indicating a delay in the time it takes the impulse to travel from the AV Node, down the Bundle of His, through 1

2 the right and left bundle branches and distally throughout the tiny purkinje fibers initiating ventricular contraction. If there is a problem in the relationship of the P to the QRS, meaning more P s then QRS s then there is a 2nd or 3 Rd Degree Heart Block. II. The first R is Rate This is the first step in EKG interpretation. A. We need to know that each small line/box represents 0.04 seconds. Therefore, it takes 5 small lines/boxes to make one big box which represents 0.20 seconds. It takes 5 large boxes to = one second. It takes 30 large boxes to equal 6 seconds. With regular or irregular rhythms, you can always count the # of QRS complexes ( Ventricular contractions) in a 6-second strip and multiply by 10 to determine your heart rate/min. B. A more accurate method to determine heart rate in regular rhythms is to count the # of small boxes between two R waves and divide that number into (60 seconds divided by 0.04 = that is why we use this #). Example: from one R to the next R there were 17 small boxes therefore that would be 1500 /17 = or 88 beats/min. This is the most accurate way to determine heart rate, BUT the rhythm MUST be REGULAR!!!!!!!! You can also count the # of big boxes between two R waves and divide it into 300, but again the rhythm MUST be REGULAR. 2

3 III. The second R is for Rhythm- is the rhythm regular or irregular? A. Compare R wave to R wave interval and determine if they are occurring at regular intervals. If so, this indicates a regular rhythm. One method to determine regularity is to make a small mark on a piece of paper over two consecutive R waves, then move the paper to the next R wave and see if the dots line up/march out. You can also use calipers to accomplish this step. B. Next we need to determine the length of time it takes the impulse to travel from the SA Node to the AV Node and accomplish Atrial contraction/depolarization. This is the PR interval and should be < 0.20 seconds or one big box. Make a mark on paper at the upstroke of the P wave and another mark over the R wave (at the top) then move the paper to the top of the EKG paper and measure. If measurement is longer than 0.20 seconds (or one big box) it is defined as a 1 st Degree AV Block. C. The next measurement is the QRS interval to determine the length of time it takes for Ventricular depolarization/contraction. Place a mark over the first negative deflection after the P wave (this is the Q wave) and make the second mark at the end of the second negative deflection after the P wave (this is the S wave). Move the paper to the top of the EKG paper and measure. This measurement should be < 0.12 seconds or 3 small boxes. If it is > than this, it is termed a Bundle Branch Block. 3

4 D. The point where the S and the T wave join is the J point and is important in diagnosing cardiac ischemia or injury. When the myocardium is deprived of oxygen, it becomes ischemic and depressed. This results in ST depression-below the isoelectric line=the horizontal line starting before the P wave that imaginarily travels across the waveforms. If cardiac blood supply is not restored, the myocardium next becomes injured and gets angry and raises it s hand to say, pay attention, I m injured. This is evidenced by ST elevation on the EKG. 4

5 After twenty minutes without oxygen, myocardial tissue dies and quits leaving a large Q wave-greater than 1/3 the height of the R wave and at least 0.04 sec wide. Once myocardial tissue infarcts, it can no longer conduct electricity or contract. REMEMBER.You must use at least 2 different leads (views of the electrical activity of the heart) in order to diagnose ST depression= Ischemia, ST elevation=injury or pathological Q wave=infarct IV. Third R is for Relationship- are there P waves for every QRS and is there a QRS after every P wave. This is looking at the relationship of the Atrium to the Ventricles. Are they communicating to each other, or do we have the Atrium doing one thing (contracting at one rate) and the Ventricles contracting at another rate. When we have more P waves then QRS s it is a second or third degree Heart Block indicating a block at the level of the AV node not allowing all or any P waves from getting through to the ventricles.. Putting all of the above measurements together we are analyzing the EKG rhythmn. V. Lets do some practice strips. REMEMBER the 3 R s 1. Rate 2. Rhythm 3. Relationship 5

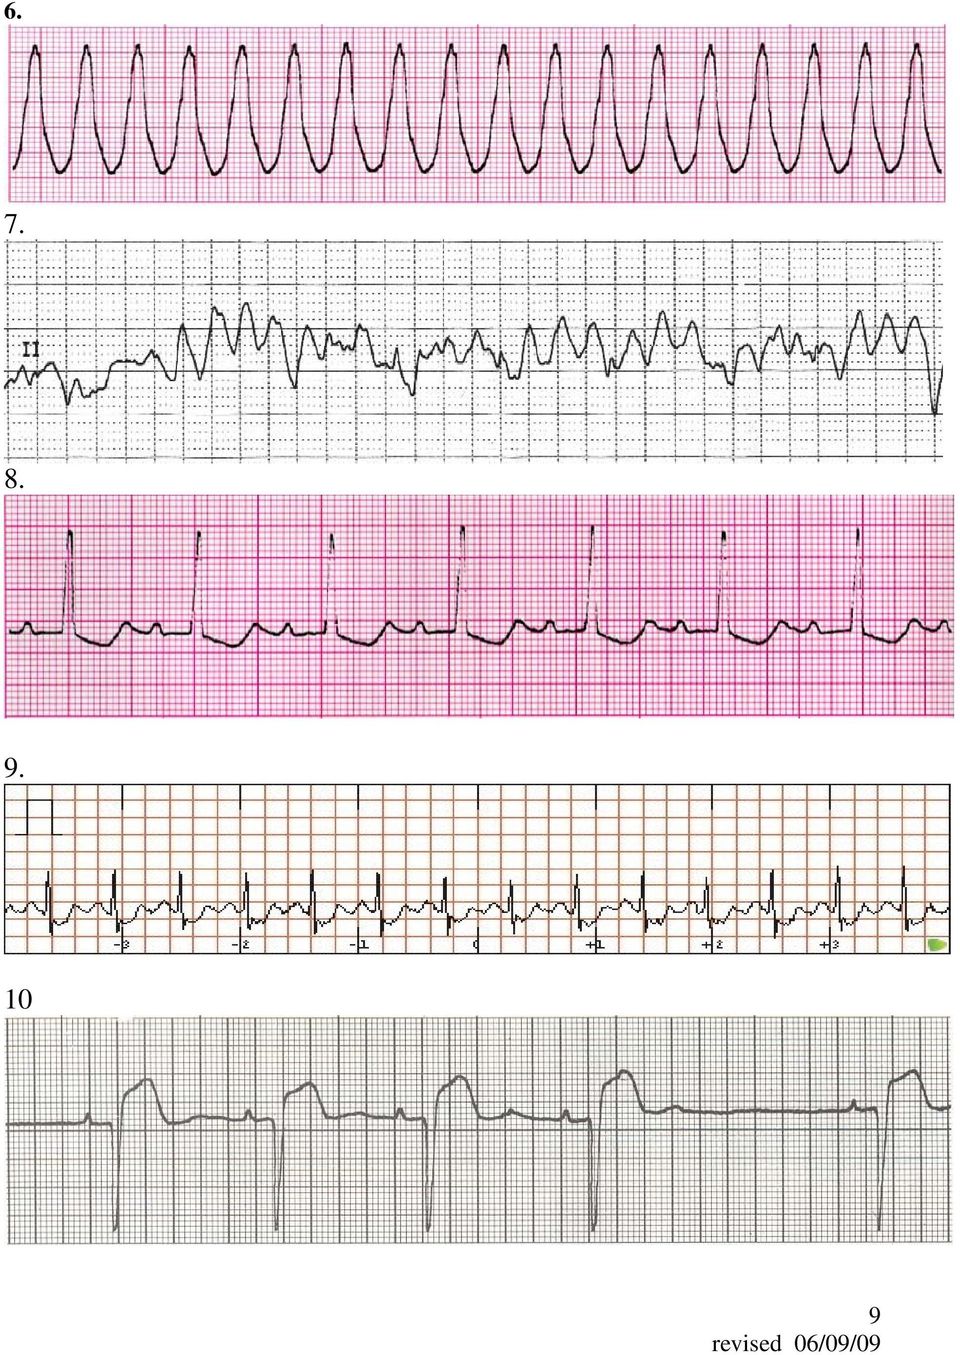
6 Answer Key to Practice Rhythm Strips 1. Rate = 38 small blocks or pulse 39 beats/min. PR = 0.20 QRS =0.10 For every P wave there is a QRS This is a Sinus Bradycardia 2. Rate= 22 Blocks or pulse 68 beats/min. PR= Not able to measure QRS = 0.08 There are more Atrial waves( known as Flutter waves) for every one QRS This is Atrial Flutter with 3:1 conduction 3. Rate= 24 blocks or pulse 62 beats/min. PR= 0.16 QRS= 0.10 For every P wave there is a QRS This is a Normal Sinus Rhythm 4. Rate = 12 blocks or pulse of 125 beats/min. PR= 0.16 QRS= 0.06 For every P wave we have a QRS This is a Sinus Tachycardia 5. Rate = not able to use small box method NOT REGULAR must count # of QRS complexes in 6 second strip and X by 10. PR= Not measurable. PR = not able to measure There are no P waves just undulating /Fibrillating Atrial line & QRS interval is not regular from beat to beat QRS= 0.08 This is Atrial Fibrillation 6. Rate = 9 blocks or pulse rate of 166 beats/min. * MAY NOT HAVE PALPABLE PULSE. There are no discernable P waves PR= Not able to measure QRS= WIDE or > 0.20 This is Ventricular Tachycardia 7. Rate Not measurable as there are no discernable QRS complexes PR= not measurable There are no P waves. QRS not measurable Ventricular Fibrillation 8. Rate = 23 blocks or pulse of 66 beats/min. PR= 0.24 QRS = 0.10 There are P waves for every QRS and a QRS after each P wave. Normal Sinus Rhythm with 1 st degree AV Block 9. Rate= 13 blocks or pulse of 115/min. PR= 0.16 QRS= There are P waves for every QRS and a QRS after every P waves ***** NOTICE ST segment** Sinus Tachycardia with ST Depression 10. Rate= 24 blocks or pulse 62 beats/min. PR= 0.20 QRS= 0.10 There are P waves for every QRS and a QRS after every P 6

7 *** NOTE ST elevation** There is a length of time between 4 th & 5 th beat Normal Sinus Rhythm with ST elevation and possible Sinus pause (the SA node failed to fire) or non-conducted beat 7
 or")
8

9
MULTIPLE CHOICE. Choose the one alternative that best completes the statement or answers the question.
 Exam Name MULTIPLE CHOICE. Choose the one alternative that best completes the statement or answers the question. 1) What term is used to refer to the process of electrical discharge and the flow of electrical
NEONATAL & PEDIATRIC ECG BASICS RHYTHM INTERPRETATION
 NEONATAL & PEDIATRIC ECG BASICS & RHYTHM INTERPRETATION VIKAS KOHLI MD FAAP FACC SENIOR CONSULATANT PEDIATRIC CARDIOLOGY APOLLO HOSPITAL MOB: 9891362233 ECG FAX LINE: 011-26941746 THE BASICS: GRAPH PAPER
Activity 4.2.3: EKG. Introduction. Equipment. Procedure
 Activity 4.2.3: EKG The following is used with permission of Vernier Software and Technology. This activity is based on the experiment Analyzing the Heart with EKG from the book Human Physiology with Vernier,
QRS Complexes. Fast & Easy ECGs A Self-Paced Learning Program
 6 QRS Complexes Fast & Easy ECGs A Self-Paced Learning Program Q I A ECG Waveforms Normally the heart beats in a regular, rhythmic fashion producing a P wave, QRS complex and T wave I Step 4 of ECG Analysis
Understanding the Electrocardiogram. David C. Kasarda M.D. FAAEM St. Luke s Hospital, Bethlehem
 Understanding the Electrocardiogram David C. Kasarda M.D. FAAEM St. Luke s Hospital, Bethlehem Overview 1. History 2. Review of the conduction system 3. EKG: Electrodes and Leads 4. EKG: Waves and Intervals
HTEC 91. Topic for Today: Atrial Rhythms. NSR with PAC. Nonconducted PAC. Nonconducted PAC. Premature Atrial Contractions (PACs)
") HTEC 91 Medical Office Diagnostic Tests Week 4 Topic for Today: Atrial Rhythms PACs: Premature Atrial Contractions PAT: Paroxysmal Atrial Tachycardia AF: Atrial Fibrillation Atrial Flutter Premature Atrial
HTEC 91 Medical Office Diagnostic Tests Week 4 Topic for Today: Atrial Rhythms PACs: Premature Atrial Contractions PAT: Paroxysmal Atrial Tachycardia AF: Atrial Fibrillation Atrial Flutter Premature Atrial
Evaluation copy. Analyzing the Heart with EKG. Computer
 Analyzing the Heart with EKG Computer An electrocardiogram (ECG or EKG) is a graphical recording of the electrical events occurring within the heart. In a healthy heart there is a natural pacemaker in
the basics Perfect Heart Institue, Piyavate Hospital
 ECG INTERPRETATION: the basics Damrong Sukitpunyaroj MD Damrong Sukitpunyaroj, MD Perfect Heart Institue, Piyavate Hospital Overview Conduction Pathways Systematic Interpretation Common abnormalities in
BASIC CARDIAC ARRHYTHMIAS Revised 10/2001
 BASIC CARDIAC ARRHYTHMIAS Revised 10/2001 A Basic Arrhythmia course is a recommended prerequisite for ACLS. A test will be given that will require you to recognize cardiac arrest rhythms and the most common
Introduction to Electrocardiography. The Genesis and Conduction of Cardiac Rhythm
 Introduction to Electrocardiography Munther K. Homoud, M.D. Tufts-New England Medical Center Spring 2008 The Genesis and Conduction of Cardiac Rhythm Automaticity is the cardiac cell s ability to spontaneously
By the end of this continuing education module the clinician will be able to:
 EKG Interpretation WWW.RN.ORG Reviewed March, 2015, Expires April, 2017 Provider Information and Specifics available on our Website Unauthorized Distribution Prohibited 2015 RN.ORG, S.A., RN.ORG, LLC Developed
Tachyarrhythmias (fast heart rhythms)
") Patient information factsheet Tachyarrhythmias (fast heart rhythms) The normal electrical system of the heart The heart has its own electrical conduction system. The conduction system sends signals throughout
Patient information factsheet Tachyarrhythmias (fast heart rhythms) The normal electrical system of the heart The heart has its own electrical conduction system. The conduction system sends signals throughout
Normal Sinus Rhythm. Sinus Bradycardia. Sinus Tachycardia. Rhythm ECG Characteristics Example (NSR) & consistent. & consistent.
 & consistent. & consistent.") Normal Sinus Rhythm (NSR) Rate: 60-100 per minute Rhythm: R- R = P waves: Upright, similar P-R: 0.12-0.20 second & consistent P:qRs: 1P:1qRs Sinus Tachycardia Exercise Hypovolemia Medications Fever Hypoxia
Normal Sinus Rhythm (NSR) Rate: 60-100 per minute Rhythm: R- R = P waves: Upright, similar P-R: 0.12-0.20 second & consistent P:qRs: 1P:1qRs Sinus Tachycardia Exercise Hypovolemia Medications Fever Hypoxia
Interpreting a rhythm strip
 3 Interpreting a rhythm strip Just the facts In this chapter, you ll learn: the components of an ECG complex and their significance and variations techniques for calculating the rate and rhythm of an ECG
INTRODUCTORY GUIDE TO IDENTIFYING ECG IRREGULARITIES
 INTRODUCTORY GUIDE TO IDENTIFYING ECG IRREGULARITIES NOTICE: This is an introductory guide for a user to understand basic ECG tracings and parameters. The guide will allow user to identify some of the
Systematic Approach to 12 Lead EKG Interpretation
 Systematic Approach to 12 Lead EKG Interpretation Maureen Knechtel MPAS, PA-C Wellmont CVA Heart Institute Disclosure Statement of Financial Interest I, Maureen Knechtel, do not have a financial interest/arrangement
Equine Cardiovascular Disease
 Equine Cardiovascular Disease 3 rd most common cause of poor performance in athletic horses (after musculoskeletal and respiratory) Cardiac abnormalities are rare Clinical Signs: Poor performance/exercise
Electrodes placed on the body s surface can detect electrical activity, APPLIED ANATOMY AND PHYSIOLOGY. Circulatory system
 4 READING AND INTERPRETING THE ELECTROCARDIOGRAM Electrodes placed on the body s surface can detect electrical activity, which occurs in the heart. The recording of these electrical events comprises an
Section Four: Pulmonary Artery Waveform Interpretation
 Section Four: Pulmonary Artery Waveform Interpretation All hemodynamic pressures and waveforms are generated by pressure changes in the heart caused by myocardial contraction (systole) and relaxation/filling
ACLS Chapter 3 Rhythm Review Instructor Lesson Plan to Accompany ACLS Study Guide 3e
 ACLS Chapter 3 Rhythm Review Lesson Plan Required reading before this lesson: ACLS Study Guide 3e Textbook Chapter 3 Materials needed: Multimedia projector, computer, ACLS Chapter 3 Recommended minimum
Heart and Vascular System Practice Questions
 Heart and Vascular System Practice Questions Student: 1. The pulmonary veins are unusual as veins because they are transporting. A. oxygenated blood B. de-oxygenated blood C. high fat blood D. nutrient-rich
VCA Veterinary Specialty Center of Seattle
 An electrocardiogram (ECG) is a graph of the heart`s electrical current, which allows evaluation of heart rate, rhythm and conduction. Identification of conduction problems within the heart begins with
Electrophysiology Introduction, Basics. The Myocardial Cell. Chapter 1- Thaler
 Electrophysiology Introduction, Basics Chapter 1- Thaler The Myocardial Cell Syncytium Resting state Polarized negative Membrane pump Depolarization fundamental electrical event of the heart Repolarization
ECG made extra easy. medics.cc
 ElectroCardioGraphyraphy ECG made extra easy Overview Objectives for this tutorial What is an ECG? Overview of performing electrocardiography on a patient Simple physiology Interpreting the ECG Objectives
Electrocardiography I Laboratory
 Introduction The body relies on the heart to circulate blood throughout the body. The heart is responsible for pumping oxygenated blood from the lungs out to the body through the arteries and also circulating
Chapter 20: The Cardiovascular System: The Heart
 Chapter 20: The Cardiovascular System: The Heart Chapter Objectives ANATOMY OF THE HEART 1. Describe the location and orientation of the heart within the thorax and mediastinal cavity. 2. Describe the
RAPID INTERPRETATION OF. EKG s
 Personal Quick Reference Sheets 333 (pages 333 to 346) There is no need to remove these reference pages from your book. To download and print them in full color, go to: www.themdsite.com Reference Sheets
Anatomi & Fysiologi 060301. The cardiovascular system (chapter 20) The circulation system transports; What the heart can do;
 The circulation system transports; What the heart can do;") The cardiovascular system consists of; The cardiovascular system (chapter 20) Principles of Anatomy & Physiology 2009 Blood 2 separate pumps (heart) Many blood vessels with varying diameter and elasticity
The cardiovascular system consists of; The cardiovascular system (chapter 20) Principles of Anatomy & Physiology 2009 Blood 2 separate pumps (heart) Many blood vessels with varying diameter and elasticity
Monitoring EKG. Evaluation copy
 Monitoring EKG Computer 28 An electrocardiogram, or EKG, is a graphical recording of the electrical events occurring within the heart. A typical EKG tracing consists of five identifiable deflections. Each
Interpreting AV (Heart) Blocks: Breaking Down the Mystery
 Blocks: Breaking Down the Mystery") Interpreting AV (Heart) Blocks: Breaking Down the Mystery 2 Contact Hours Copyright 2012 by RN.com. All Rights Reserved. Reproduction and distribution of these materials is prohibited without the express
Interpreting AV (Heart) Blocks: Breaking Down the Mystery 2 Contact Hours Copyright 2012 by RN.com. All Rights Reserved. Reproduction and distribution of these materials is prohibited without the express
12-Lead EKG Interpretation. Judith M. Haluka BS, RCIS, EMT-P
 12-Lead EKG Interpretation Judith M. Haluka BS, RCIS, EMT-P ECG Grid Left to Right = Time/duration Vertical measure of voltage (amplitude) Expressed in mm P-Wave Depolarization of atrial muscle Low voltage
ACLS RHYTHM TEST. 2. A 74-year-old woman with chest pain. Blood pressure 192/90 and rates her pain 9/10.
 ACLS RHYTHM TEST Name Date Choose the best answer for each of the following questions. Each of the following strips is 6 seconds in length. 1. Identify the following rhythm a. Sinus bradycardia with 2
PRO-CPR. 2015 Guidelines: PALS Algorithm Overview. (Non-AHA supplementary precourse material)
") PRO-CPR 2015 Guidelines: PALS Algorithm Overview (Non-AHA supplementary precourse material) Please reference Circulation (from our website), the ECC Handbook, or the 2015 ACLS Course Manual for correct
PRO-CPR 2015 Guidelines: PALS Algorithm Overview (Non-AHA supplementary precourse material) Please reference Circulation (from our website), the ECC Handbook, or the 2015 ACLS Course Manual for correct
Atrial & Junctional Dysrhythmias
 Atrial & Junctional Dysrhythmias Atrial & Junctional Dysrhythmias Atrial Premature Atrial Complex Wandering Atrial Pacemaker Atrial Tachycardia (ectopic) Multifocal Atrial Tachycardia Atrial Flutter Atrial
The heart then repolarises (or refills) in time for the next stimulus and contraction.
 in time for the next stimulus and contraction.") Atrial Fibrillation BRIEFLY, HOW DOES THE HEART PUMP? The heart has four chambers. The upper chambers are called atria. One chamber is called an atrium, and the lower chambers are called ventricles. In
Atrial Fibrillation BRIEFLY, HOW DOES THE HEART PUMP? The heart has four chambers. The upper chambers are called atria. One chamber is called an atrium, and the lower chambers are called ventricles. In
Exchange solutes and water with cells of the body
 Chapter 8 Heart and Blood Vessels Three Types of Blood Vessels Transport Blood Arteries Carry blood away from the heart Transport blood under high pressure Capillaries Exchange solutes and water with cells
Electrocardiography Review and the Normal EKG Response to Exercise
 Electrocardiography Review and the Normal EKG Response to Exercise Cardiac Anatomy Electrical Pathways in the Heart Which valves are the a-v valves? Closure of the a-v valves is associated with which heart
THE HEART Dr. Ali Ebneshahidi
 THE HEART Dr. Ali Ebneshahidi Functions is of the heart & blood vessels 1. The heart is an essential pumping organ in the cardiovascular system where the right heart pumps deoxygenated blood (returned
2 ECG basics. Leads and planes. Leads. Planes. from different perspectives, which are called leads and planes.
 558302.qxp 3/14/12 10:47 PM Page 12 2 ECG basics One of the most valuable diagnostic tools available, an electrocardiogram (ECG) records the heart s electrical activity as waveforms. By interpreting these
Cardiovascular Physiology
 Cardiovascular Physiology Heart Physiology for the heart to work properly contraction and relaxation of chambers must be coordinated cardiac muscle tissue differs from smooth and skeletal muscle tissues
The P Wave: Indicator of Atrial Enlargement
 Marquette University e-publications@marquette Physician Assistant Studies Faculty Research and Publications Health Sciences, College of 8-12-2010 The P Wave: Indicator of Atrial Enlargement Patrick Loftis
School of Health Sciences
 School of Health Sciences Cardiology Teaching Package A Beginners Guide to Normal Heart Function, Sinus Rhythm & Common Cardiac Arrhythmias Welcome This document extends subjects covered in the Cardiology
Basic Cardiac Rhythms Identification and Response
 Basic Cardiac Rhythms Identification and Response Module 1 ANATOMY, PHYSIOLOGY, & ELECTRICAL CONDUCTION Objectives Describe the normal cardiac anatomy and physiology and normal electrical conduction through
Electrocardiogram and Heart Sounds
 Electrocardiogram and Heart Sounds An introduction to the recording and analysis of electrocardiograms, and the sounds of the heart. Written by Staff of ADInstruments Introduction The beating of the heart
Banner Staff Service ECG Study Guide
 Banner Staff Service ECG Study Guide Edited by Larry H. Lybbert, MS, RN Table of Contents ECG STUDY GUIDE... 3 ECG INTERPRETATION BASICS... 4 EKG GRAPH PAPER...4 RATE MEASUREMENT...9 The Six Second Method...9
Atrioventricular (AV) node ablation
 node ablation") Patient information factsheet Atrioventricular (AV) node ablation The normal electrical system of the heart The heart has its own electrical conduction system. The conduction system sends signals throughout
Patient information factsheet Atrioventricular (AV) node ablation The normal electrical system of the heart The heart has its own electrical conduction system. The conduction system sends signals throughout
Table of Contents Error! Bookmark not defined.
 Table of Contents EKG TRACING...1 Figure 1 - EKG Tracing... Error! Bookmark not defined. STEP 1...1 Rate... 1 Figure 2 - Determining the Rate... 1 Step 2...2 Rhythm... 2 Figure 3 - Determining the Rhythm
An ECG Primer. Quick Look. I saw it, but I did not realize it. Elizabeth Peabody
 4 An ECG Primer Quick Look Cardiac Monitoring System - p. 64 ECG Paper - p. 73 Lead Polarity and Vectors - p. 77 Basic ECG Components - p. 79 Heart Rate and Pulse Rate - p. 91 Summary - p. 94 Chapter Quiz
Normal & Abnormal Intracardiac. Lancashire & South Cumbria Cardiac Network
 Normal & Abnormal Intracardiac Pressures Lancashire & South Cumbria Cardiac Network Principle Pressures recorded from catheter tip Electrical transducer - wheatstone bridge mechanical to electrical waveform
HEART HEALTH WEEK 3 SUPPLEMENT. A Beginner s Guide to Cardiovascular Disease HEART FAILURE. Relatively mild, symptoms with intense exercise
 WEEK 3 SUPPLEMENT HEART HEALTH A Beginner s Guide to Cardiovascular Disease HEART FAILURE Heart failure can be defined as the failing (insufficiency) of the heart as a mechanical pump due to either acute
Distance Learning Program Anatomy of the Human Heart/Pig Heart Dissection Middle School/ High School
 Distance Learning Program Anatomy of the Human Heart/Pig Heart Dissection Middle School/ High School This guide is for middle and high school students participating in AIMS Anatomy of the Human Heart and
Feature Vector Selection for Automatic Classification of ECG Arrhythmias
 Feature Vector Selection for Automatic Classification of ECG Arrhythmias Ch.Venkanna 1, B. Raja Ganapathi 2 Assistant Professor, Dept. of ECE, G.V.P. College of Engineering (A), Madhurawada, A.P., India
Normal Intracardiac Pressures. Lancashire & South Cumbria Cardiac Network
 Normal Intracardiac Pressures Lancashire & South Cumbria Cardiac Network Principle Pressures recorded from catheter tip Electrical transducer - wheatstone bridge mechanical to electrical waveform display
BIPOLAR LIMB LEADS UNIPOLAR LIMB LEADS PRECORDIAL (UNIPOLAR) LEADS VIEW OF EACH LEAD INDICATIVE ECG CHANGES
 LEADS VIEW OF EACH LEAD INDICATIVE ECG CHANGES") BIPOLAR LIMB LEADS Have both a distinctive positive and negative pole. Lead I LA (positive) RA (negative) Lead II LL (positive) RA (negative) Lead III LL (positive) LA (negative) UNIPOLAR LIMB LEADS Have
BIPOLAR LIMB LEADS Have both a distinctive positive and negative pole. Lead I LA (positive) RA (negative) Lead II LL (positive) RA (negative) Lead III LL (positive) LA (negative) UNIPOLAR LIMB LEADS Have
DEPARTMENT OF HEALTH AND HUMAN SERVICES Centers for Medicare & Medicaid Services
 DEPARTMENT OF HEALTH AND HUMAN SERVICES Centers for Medicare & Medicaid Services NEW product from the Medicare Learning Network (MLN) Provider Compliance Tips for Computed Tomography (CT) Scans Podcast,
How To Understand What You Know
 Heart Disorders Glossary ABG (Arterial Blood Gas) Test: A test that measures how much oxygen and carbon dioxide are in the blood. Anemia: A condition in which there are low levels of red blood cells in
Welcome to Vibrationdata
 Welcome to Vibrationdata Acoustics Shock Vibration Signal Processing December 2004 Newsletter Ni hao Feature Articles One of my goals is to measure a wide variety of oscillating signals. In some sense,
Current Management of Atrial Fibrillation DISCLOSURES. Heart Beat Anatomy. I have no financial conflicts to disclose
 Current Management of Atrial Fibrillation Mary Macklin, MSN, APRN Concord Hospital Cardiac Associates DISCLOSURES I have no financial conflicts to disclose Book Women: Fit at Fifty. A Guide to Living Long.
Diagnosis Code Crosswalk : ICD-9-CM to ICD-10-CM Cardiac Rhythm and Heart Failure Diagnoses
 Diagnosis Code Crosswalk : to 402.01 Hypertensive heart disease, malignant, with heart failure 402.11 Hypertensive heart disease, benign, with heart failure 402.91 Hypertensive heart disease, unspecified,
Electrophysiology Heart Study - EPS -
 Electrophysiology Heart Study - EPS - What is an EPS? EPS is short for ElectroPhysiology heart Study. This procedure looks at the electrical system of your heart. An EPS will show if you have a heart rhythm
PSIO 603/BME 511 1 Dr. Janis Burt February 19, 2007 MRB 422; 626-6833 [email protected]. MUSCLE EXCITABILITY - Ventricle
 SIO 63/BME 511 1 Dr. Janis Burt February 19, 27 MRB 422; 626-6833 MUSCLE EXCITABILITY - Ventricle READING: Boron & Boulpaep pages: 483-57 OBJECTIVES: 1. Draw a picture of the heart in vertical (frontal
ECG Filtering. Willem Einthoven s EKG machine, 1903
 ECG Filtering Willem Einthoven s EKG machine, 1903 ECG Filtering Three common noise sources q Baseline wander q Power line interference q Muscle noise When filtering any biomedical signal care should be
Electrophysiology study (EPS)
") Patient information factsheet Electrophysiology study (EPS) The normal electrical system of the heart The heart has its own electrical conduction system. The conduction system sends signals throughout
Patient information factsheet Electrophysiology study (EPS) The normal electrical system of the heart The heart has its own electrical conduction system. The conduction system sends signals throughout
Note: The left and right sides of the heart must pump exactly the same volume of blood when averaged over a period of time
 page 1 HEART AS A PUMP A. Functional Anatomy of the Heart 1. Two pumps, arranged in series a. right heart: receives blood from the systemic circulation (via the great veins and vena cava) and pumps blood
EKG Refresh and Practice Normal Sinus Rhythm. P-Waves: PRInterval:
 EKG Refresh and Practice Normal Sinus. : 60-100 beats per minute r Rhythrn: Atrial - - o Pwaves: Uniform in appearance Upright w/ normal shape One Preceding each QRS Nor more than.10 second o PR interval:
Basics of Pacing. Ruth Hickling, RN-BSN Tasha Conley, RN-BSN
 Basics of Pacing Ruth Hickling, RN-BSN Tasha Conley, RN-BSN The Cardiac Conduction System Cardiac Conduction System Review Normal Conduction Conduction QRS QRS Complex Complex RR PP ST ST segment segment
The Heart Rhythm Charity
 The Heart Rhythm Charity Promoting better understanding, diagnosis, treatment and quality of life for individuals with cardiac arrhythmias Registered Charity No. 1107496 2006 Bradycardia (Slow Heart Rhythm)
Catheter Ablation. A Guided Approach for Treating Atrial Arrhythmias
 Catheter Ablation A Guided Approach for Treating Atrial Arrhythmias A P A T I E N T H A N D B O O K This brochure will provide an overview of atrial arrhythmias (heart rhythm problems affecting the upper
The Basics of 12 Lead EKG s
 EMS Solutions Presents The Basics of 12 Lead EKG s NOTICE: You DO NOT Have the Right to Reprint or Resell this Publication. However, you MAY give this report away, provided you do not change or alter the
Atrial Fibrillation: The heart of the matter
 Atrial Fibrillation: The heart of the matter This booklet has been written especially for people with atrial fibrillation (AF), a heart condition often described as an irregular heartbeat (also known
Vtial sign #1: PULSE. Vital Signs: Assessment and Interpretation. Factors that influence pulse rate: Importance of Vital Signs
 Vital Signs: Assessment and Interpretation Elma I. LeDoux, MD, FACP, FACC Associate Professor of Medicine Vtial sign #1: PULSE Reflects heart rate (resting 60-90/min) Should be strong and regular Use 2
Lecture Outline. Cardiovascular Physiology. Cardiovascular System Function. Functional Anatomy of the Heart
 Lecture Outline Cardiovascular Physiology Cardiac Output Controls & Blood Pressure Cardiovascular System Function Functional components of the cardiovascular system: Heart Blood Vessels Blood General functions
Functions of Blood System. Blood Cells
 Functions of Blood System Transport: to and from tissue cells Nutrients to cells: amino acids, glucose, vitamins, minerals, lipids (as lipoproteins). Oxygen: by red blood corpuscles (oxyhaemoglobin - 4
#AS148 - Automated ECG Analysis
 BIOPAC Systems, Inc. 42 Aero Camino Goleta, Ca 93117 Ph (805)685-0066 Fax (805)685-0067 www.biopac.com [email protected] #AS148 - Automated ECG Analysis An electrocardiogram (ECG) is a graphical recording
COVERAGE GUIDANCE: ABLATION FOR ATRIAL FIBRILLATION
 COVERAGE GUIDANCE: ABLATION FOR ATRIAL FIBRILLATION Question: How should the EGBS Coverage Guidance regarding ablation for atrial fibrillation be applied to the Prioritized List? Question source: Evidence
ECG Signal Analysis Using Wavelet Transforms
 Bulg. J. Phys. 35 (2008) 68 77 ECG Signal Analysis Using Wavelet Transforms C. Saritha, V. Sukanya, Y. Narasimha Murthy Department of Physics and Electronics, S.S.B.N. COLLEGE (Autonomous) Anantapur 515
The science of medicine. The compassion to heal.
 A PATIENT S GUIDE TO ELECTROPHYSIOLOGY STUDIES OF THE HEART The science of medicine. The compassion to heal. This teaching booklet is designed to introduce you to electrophysiology studies of the heart.
The abbreviation EKG, for electrocardiogram,
 CLIN PEDIATR OnlineFirst, published on January 28, 2010 as doi:10.1177/0009922809336206 Simplified Pediatric Electrocardiogram Interpretation Clinical Pediatrics Volume XX Number X Month XXXX xx-xx 2009
Detecting Atrial-ventricular blocks Arrhythmia based on RR-intervals on ECG Signals
 Detecting Atrial-ventricular blocks Arrhythmia based on -intervals on ECG Signals Makki Akasha abikier, Ibrahim Musa Ishag, Mohammed Izzeldin, Dong Gyu Lee, Gyoyong shon, Keun Ho Ryu Database/ioinformatics
An Introduction to Tachyarrhythmias R. A. Seyon MN, NP, CCN(C) & Dr. R. G. Williams
 & Dr. R. G. Williams") Arrhythmias 1 An Introduction to Tachyarrhythmias R. A. Seyon MN, NP, CCN(C) & Dr. R. G. Williams Things to keep in mind when analyzing arrhythmias: Electrical activity recorded in 12 and 15 leads Examine
Arrhythmias 1 An Introduction to Tachyarrhythmias R. A. Seyon MN, NP, CCN(C) & Dr. R. G. Williams Things to keep in mind when analyzing arrhythmias: Electrical activity recorded in 12 and 15 leads Examine
ACLS PHARMACOLOGY 2011 Guidelines
 ACLS PHARMACOLOGY 2011 Guidelines ADENOSINE Narrow complex tachycardias or wide complex tachycardias that may be supraventricular in nature. It is effective in treating 90% of the reentry arrhythmias.
The Patient s Guide to the Electrophysiologic Study (EPS) and Catheter Ablation
 and Catheter Ablation") The Patient s Guide to the Electrophysiologic Study (EPS) and Catheter Ablation 2 P a g e Table of Contents Introduction How the Heart Works 3 How the Heart s Electrical System Works 3 Commonly Used Heart
The Patient s Guide to the Electrophysiologic Study (EPS) and Catheter Ablation 2 P a g e Table of Contents Introduction How the Heart Works 3 How the Heart s Electrical System Works 3 Commonly Used Heart
Human Anatomy & Physiology II with Dr. Hubley
 Human Anatomy & Physiology II with Dr. Hubley Exam #1 Name: Instructions This exam consists of 40 multiple-choice questions. Each multiple-choice question answered correctly is worth one point, and the
The Electrocardiogram (ECG)
") The Electrocardiogram (ECG) Preparation for RWM Lab Experiment The first ECG was measured by Augustus Désiré Waller in 1887 using Lippmann's capillary electrometer. Recorded ECG: http://www.youtube.com/watch_popup?v=q0jmfivadue&vq=large
The Electrocardiogram (ECG) Preparation for RWM Lab Experiment The first ECG was measured by Augustus Désiré Waller in 1887 using Lippmann's capillary electrometer. Recorded ECG: http://www.youtube.com/watch_popup?v=q0jmfivadue&vq=large
Key Medical Terms Associated with the Cardiovascular System
 1 Key Medical Terms Associated with the Cardiovascular System Aneurysm: A thin, weakened section of the wall of an artery or vein that bulges outward, forming a balloon-like sac. Common causes are atherosclerosis,
Copyright 2006 Blaufuss Multimedia. All rights reserved. Page 1
 Copyright 2006 Blaufuss Multimedia. All rights reserved. Page 1 002 Sinus Rhythm, atrial rate 90 Mobitz II AVB, Ventricular rate 50 Left Atrial Enlargement Left Ventricular Hypertrophy RBBB a) Long R-R
What to Know About. Atrial Fibrillation
 Atrial Fibrillation What to Know About Atrial Fibrillation Understanding Afib Atrial fibrillation, or Afib, is a condition in which the heart beats irregularly speeding up or slowing down, or beating too
Signal-averaged electrocardiography late potentials
 SIGNAL AVERAGED ECG INTRODUCTION Signal-averaged electrocardiography (SAECG) is a special electrocardiographic technique, in which multiple electric signals from the heart are averaged to remove interference
Detection of Heart Diseases by Mathematical Artificial Intelligence Algorithm Using Phonocardiogram Signals
 International Journal of Innovation and Applied Studies ISSN 2028-9324 Vol. 3 No. 1 May 2013, pp. 145-150 2013 Innovative Space of Scientific Research Journals http://www.issr-journals.org/ijias/ Detection
Cardiovascular System
 Topics to Review Diffusion Skeletal muscle fiber (cell) anatomy Membrane potential and action potentials Action potential propagation Excitation-contraction coupling in skeletal muscle skeletal muscle
Cardioversion for. Atrial Fibrillation. Your Heart s Electrical System Cardioversion Living with Atrial Fibrillation
 Cardioversion for Atrial Fibrillation Your Heart s Electrical System Cardioversion Living with Atrial Fibrillation When You Have Atrial Fibrillation You ve been told you have a heart condition called atrial
Bradycardia CHAPTER 12 CODE SCENARIO
 Senecal-12.qxd 14/04/2005 09:44 AM Page 69 CHAPTER 12 Bradycardia CODE SCENARIO A code is called for a 78-year-old man who was admitted to the hospital for syncope of unknown etiology. He was resting comfortably
ACLS Rhythms for the ACLS Algorithms
 ACLS Rhythms for the ACLS Algorithms The Basics 1. Anatomy of the cardiac conduction system: relationship to the ECG cardiac cycle. A, Heart: anatomy of conduction system. B, P-QRS-T complex: lines to
Electrophysiology Daymar College. Lisa H. Young, RN, BSN, MAE 2011
 Electrophysiology Daymar College Lisa H. Young, RN, BSN, MAE 2011 Electrical Conduction Pathway Chemical Basis for Impulse Formation Cardiac Action Potential Phases http://www.youtube.com/watch?v=oqpffilde0e
Scott Hubbell, MHSc, RRT-NPS, C-NPT, CCT Clinical Education Coordinator/Flight RRT EagleMed
 Scott Hubbell, MHSc, RRT-NPS, C-NPT, CCT Clinical Education Coordinator/Flight RRT EagleMed Identify the 12-Lead Views Explain the vessels of occlusion Describe the three I s Basic Interpretation of 12-Lead
Lethal Arrhythmias: Presented by: RN.com 12400 High Bluff Dr San Diego, CA 92130
 Lethal Arrhythmias: Advanced Rhythm Interpretation Presented by: RN.com 12400 High Bluff Dr San Diego, CA 92130 This course has been approved for five (5.0) contact hours. This course expires January 24,