JACKSON COUNTY, FLORIDA AND INCORPORATED AREAS
|
|
|
- Charity French
- 7 years ago
- Views:
Transcription
1 JACKSON COUNTY, FLORIDA AND INCORPORATED AREAS Community Name Community Number ALFORD, TOWN OF BASCOM, TOWN OF CAMPBELLTON, TOWN OF COTTONDALE, CITY OF GRACEVILLE, CITY OF GRAND RIDGE, TOWN OF GREENWOOD, TOWN OF JACKSON COUNTY (UNINCORPORATED AREAS) JACOB CITY, TOWN OF MALONE, TOWN OF MARIANNA, CITY OF SNEADS, TOWN OF Jackson County Revised: December 17, 2010 Federal Emergency Management Agency FLOOD INSURANCE STUDY NUMBER 12063CV000A

2 NOTICE TO FLOOD INSURANCE STUDY USERS Communities participating in the National Flood Insurance Program (NFIP) have established repositories of flood hazard data for floodplain management and flood insurance purposes. This Flood Insurance Study (FIS) may not contain all data available within the repository. It is advisable to contact the community repository for any additional data. Part or all of this FIS may be revised and republished at any time. In addition, part of this FIS may be revised by the Letter of Map Revision process, which does not involve republication or redistribution of the FIS. It is, therefore, the responsibility of the user to consult with community officials and to check the community repository to obtain the most current FIS components. Initial Countywide FIS Effective Date: December 15, 1990 Revised Countywide FIS Date: December 17, 2010 i

3 TABLE OF CONTENTS Page 1.0 INTRODUCTION Purpose of Study Authority and Acknowledgements Coordination AREA STUDIED Scope of Study Community Description Principal Flood Problems Flood Protection Measures ENGINEERING METHODS Hydrologic Analyses Hydraulic Analyses Vertical Datum FLOODPLAIN MANAGEMENT APPLICATIONS Floodplain Boundaries Floodways INSURANCE APPLICATION FLOOD INSURANCE RATE MAP OTHER STUDIES LOCATION OF DATA BIBLIOGRAPHY AND REFERENCES 13 ii

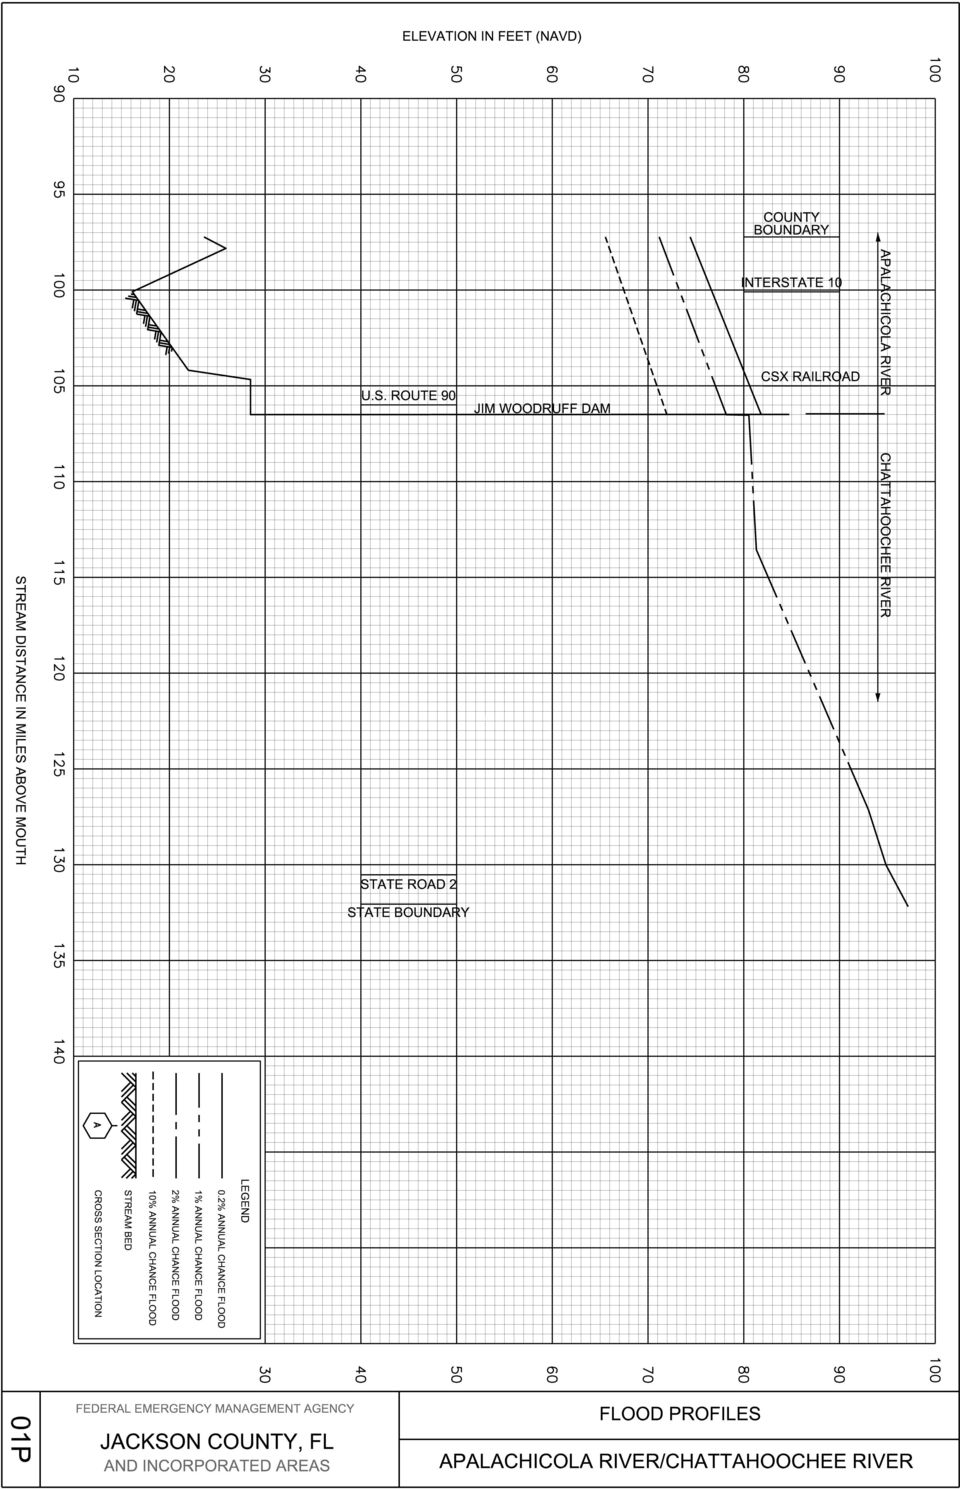
4 TABLE OF CONTENTS continued Page FIGURES Figure 1 - Floodway Schematic 12 TABLES Table 1 Scope of Revision (Limited Detailed Study) 3 Table 2 Summary of Discharges 6 Table 3 Summary of Elevations 7 Table 4 Floodway Data 11 Table 5 - Community Map History 14 Exhibit 1 Flood Profiles EXHIBITS Apalachicola River/Chattahoochee River Panel 01P Chipola River Panels 02P 04P Holmes Creek Panels 05P 07P Little Creek Panel 08P Stump Creek Panel 09P Exhibit 2 - Flood Insurance Rate Map Index Flood Insurance Rate Map iii

5 1.0 INTRODUCTION FLOOD INSURANCE STUDY JACKSON COUNTY, FLORIDA, AND INCORPORATED AREAS 1.1 Purpose of Study This Flood Insurance Study revises and updates information on the existence and severity of flood hazards in the geographic area of Jackson County, including the Towns of Alford, Bascom, Campbellton, Grand Ridge, Greenwood, Jacob City, Malone, and Sneads; the Cities of Cottondale, Graceville, and Marianna; and the unincorporated areas of Jackson County (referred to collectively herein as Jackson County), and aids in the administration of the National Flood Insurance Act of 1968 and the Flood Disaster Protection Act of This study has developed flood-risk data for various areas of the community that will be used to establish actuarial flood insurance rates and to assist the community in its efforts to promote sound floodplain management. Minimum floodplain management requirements for participation in the National Flood Insurance Program (NFIP) are set forth in the Code of Federal Regulations at 44 CFR, In some states or communities, floodplain management criteria or regulations may exist that are more restrictive or comprehensive than the minimum Federal requirements. In such cases, the more restrictive criteria take precedence and the State (or other jurisdictional agency) will be able to explain them. The Digital Flood Insurance Rate Map (DFIRM), and FIS Report for this countywide study have been produced in digital format. Flood hazard information was converted to meet the Federal Emergency Management Agency (FEMA) DFIRM database specifications and Geographic Information and is provided in a digital format so that it can be incorporated into a local GIS and be accessed more easily by the community. 1.2 Authority and Acknowledgments The sources of authority for this Flood Insurance Study are the National Flood Insurance Act of 1968 and the Flood Disaster Protection Act of The authority and acknowledgments prior to this countywide FIS have been compiled from the FIS reports for the previously identified floodprone jurisdictions within Jackson County and are shown below. For the Jackson County and Incorporated Areas FIS, dated December 15, 1990, hydrologic and hydraulic analyses for this study were performed by Engineering Methods and Applications (the Study Contractor) for the Federal Emergency Management Agency (FEMA), under Contract No. EMA-86-C This study was completed in October The hydrologic and hydraulic analyses for Holmes Creek and Little Creek in the vicinity of Graceville were performed by the U.S. Geological Survey (USGS) in August The hydrologic and hydraulic analyses for the Apalachicola River and the remainder of Holmes Creek were taken from the Flood Insurance Studies for Gadsden County and Holmes County, respectively (Reference 4 and 5). 1
, and aids in the administration of the National Flood Insurance Act of 1968 and the Flood Disaster Protection Act of 1973.")
6 For this revision, hydrologic and hydraulic analyses for this countywide study were performed by Watershed Concepts, a division of AECOM water, for the Northwest Florida Water Management District (NWFWMD), FEMA (CTP), under Contract No Task Order No. 06. This study was completed in May Base map information shown on this FIRM was derived from the Florida Department of Revenue produced at a scale of 1:24,000 from photography dated The projection used in the preparation of the Flood Insurance Rate Maps (FIRMs) was Florida State Plane HARN North zone. The horizontal datum was North American Datum of 1983, Geodetic Reference System of 1980 spheroid. 1.3 Coordination 2.0 AREA STUDIED For the Jackson County and Incorporated Areas FIS, dated December 15, 1990, the initial coordination meeting for Jackson County was held in the City of Marianna on February 4, Attending were representatives of FEMA, the Study Contractor, Soil Conservation Service (SCS), the Jackson County Civil Defense Department, the Jackson County Tax Collector s office and the Jackson County Building Department. On December 7, 1989, the results of this Flood Insurance Study were reviewed and accepted at a final coordination meeting attended by representatives of the Study Contractor, FEMA, and the communities. For this revision, an initial coordination meeting was held with representative of FEMA, NWFWMD, Jackson County, and the Study Contractor on April 22, Coordination with county officials and Federal, State, and regional agencies produced a variety of information pertaining to floodplain regulations, available community maps, flood history, and other hydrologic data. The results of the study were reviewed at the final Preliminary DFIRM Community Coordination [PDCC] meeting held on November 16, 2009, and attended by representatives of the State of Florida, the communities, FEMA, NWFWMD, and the Study Contractor. All problems raised at that meeting have been addressed in this study. 2.1 Scope of Study This Flood Insurance Study covers the geographic area of Jackson County, Florida, including the incorporated communities listed in Section 1.1. For the Jackson County and Incorporated Areas FIS, dated December 15, 1990, flooding caused by overflow of the Chipola River, Holmes Creek, Stump Creek, the Chattahoochee River, Little Creek and the Apalachicola River, Ocheesee Pond and Compass Lake was studied in detail. For this revision, No new detailed studies have been performed as part of this countywide study, and streams were studied by limited detailed methods are shown on Table 1. 2
 was Florida State Plane HARN North zone.")
7 Table 1. Scope of Revision (Limited Detailed Study) Flooding Source Downstream Limit Upstream Limit Buck Pelt Branch Chipola River Chipola River Trib 7 Dry Creek Long Branch Long Branch Trib 2 Long Branch Trib 3 Unnamed Stream 59 Unnamed Stream 59-1 Confluence with Chipola River Approximately 2,000 ft upstream of County Road 162 Confluence with Chipola River Approximately 14,000 ft upstream of confluence with Chipola River Confluence with Dry Creek Confluence with Long Branch Approximately 1,000 ft upstream of confluence with Long Branch Confluence with Unnamed Stream 59-1 Approximately 130 ft upstream of confluence with Unnamed Stream 59 Approximately 2,200 ft upstream of State Highway 73 Confluence with Marshall Creek Approximately 6,000 ft upstream of Penn Ave Just upstream of Mill Road Approximately 1,000 ft upstream of Old Airbase Rd Approximately 3,900 ft upstream of confluence with Long Branch Approximately 6,800 ft upstream of Thompson Rd Approximately 1,800 ft upstream of Stadsklev Rd Approximately 2,700 ft upstream of Bright Prospect Rd Approximate analyses were used to study those areas having a low development potential or minimal flood hazards. The scope and methods of study were proposed to, and agreed upon, by FEMA, Jackson County, NWFWMD, and the study contractor. 2.2 Community Description Jackson County was created by the Florida Territorial Council in 1822 out of Escambia County, along with Duval County out of St. Johns County, making them the third and fourth counties in the Territory. The county was named for Andrew Jackson, who had served as Florida s first military governor for six months in Jackson County originally extended from the Choctawhatchee River on the west to the Suwannee River on the east. The county seat is Marianna, Florida. According to the U.S. Census Bureau, Jackson occupies an area of 955 square miles (2,472 km²) in the Central Florida Panhandle. Nearly 916 square miles (2,372 km²) of it is land, and 39 square miles (101 km²) of it is water. The county is bordered on the north by Houston and Geneva Counties, Alabama; on the east by Seminole and Decatur Counties, Georgia and southeast by Gadsden and Liberty Counties, Florida; on the south by Calhoun and Bay Counties, Florida; and on the west by Holmes and Washington Counties, Florida. Interstate 10; U.S. Routes 90 and 231; and State Roads 2, 69, 71, and 77, serve Jackson County. The county is also served by CSX railroad and the Atlanta & St. Andrews Bay Railway. In the 2000 census, the population of Jackson County was 46,755. The 2008 population was estimated 49,656, which represents a 6.2 percent increase in 8 years (Reference 1). 3

8 The climate is characterized by long, warm, humid summers and mild winters. Maximum and minimum temperatures are moderated by the Gulf of Mexico. The daily average temperature being about 54 F in January and 81 F in July; the annual mean temperature is about 68 F (Reference 7). The average rainfall in the county is 58 inches with the heaviest period from early December through late April. Rainfall during this five-month period accounts for about 60-percent of the annual total. The months of least rainfall are generally October and November (Reference 7). The county includes four significant river valleys (the lower Chattahoochee River, the upper Apalachicola River, Holmes Creek, and the Chipola River) and three distinct physiographic regions: the Marianna River Valley Lowlands, the Delta Plain Highlands, and the Terraced Coastal Lowlands (Reference 7). The largest unit is the Marianna Lowlands formed by erosion and deposition of the Apalachicola, Chattahoochee, and the Chipola Rivers, as well as Holmes and Dry Creeks. 2.3 Principal Flood Problems In general, Jackson County is not highly flood prone, and riverine flooding is not considered a major problem (Reference 8). In fact, severe drought has been experienced as often as flooding, with recent droughts experienced from , and in 1968, and 1977 (Reference 8). The flooding that does occur in Jackson County results from the overflow of streams, local ponding, and sheetflow. Major rainfall events are associated with either tropical storms or frontal systems. Ninety percent of floods occur from December through April; March and April are the most hazardous months. The largest flood on record in the county occurred during March, More recent major floods occurred in April 1960 and April Rainfall associated with hurricanes can typically be as much as 12 inches in the area. Between 1915 and 1972, nine such hurricanes affected the county. Even greater rains are associated with frontal systems and thunderstorms. The maximum rainfall recorded for northwest Florida was 24.5 inches measured at Bonifay (about 10 miles west of Jackson County) in July The March 1929 storm caused the most severe general flooding in northwest Florida, with peak rainfall about 40 miles northwest of Jackson County amount to 30 inches. More recently, in 1979, a March storm brought 18 inches of rain in 18 hours to the Pensacola area, which is located southwest of the county (Reference 9). 2.4 Flood Protection Measures Structural flood protection measures in Jackson County are limited. The Jim Woodruff Dam regulates flow on the Apalachicola River in the southeast portion of the county. Flow on Holmes Creek near Graceville is only slightly regulated at the 100-year level by a limited earthen dike system. A small U.S. Army Corps of Engineers (COE) drainage control project includes eight canals between fifteen ponds in a lime sink region on agricultural lands. None of these measures are deemed to provide protection to the county from major events such as the 100-year flood. A levee exists in the study area that provides the community with some degree of protection against flooding. However, it has been ascertained that this levee may not protect the community from rare events such as the 100-year flood. The criteria used to evaluate 4
.")
9 protection against the 100-year flood are 1) adequate design, including freeboard, 2) structural stability, and 3) proper operation and maintenance. Levees that do not protect against the 100-year flood are not considered in the hydraulic analysis of the 100-year floodplain. 3.0 ENGINEERING METHODS For the flooding sources studied by detailed methods in the community, standard hydrologic and hydraulic study methods were used to determine the flood-hazard data required for this study. Flood events of a magnitude that are expected to be equaled or exceeded once on the average during any 10-, 50-, 100-, or 500-year period (recurrence interval) have been selected as having special significance for floodplain management and for flood insurance rates. These events, commonly termed the 10-, 50, 100-, and 500-year floods, have a 10-, 2-, 1-, and 0.2-percent chance, respectively, of being equaled or exceeded during any year. Although the recurrence interval represents the long-term, average period between floods of a specific magnitude, rare floods could occur at short intervals or even within the same year. The risk of experiencing a rare flood increases when periods greater than 1 year are considered. For example, the risk of having a flood that equals or exceeds the 100-year flood (1-percent chance of annual exceedence) in any 50-year period is approximately 40 percent (4 in 10); for any 90-year period, the risk increases to approximately 60 percent (6 in 10). The analyses reported herein reflect flooding potentials based on conditions existing in the community at the time of completion of this study. Maps and flood elevations will be amended periodically to reflect future changes. 3.1 Hydrologic Analyses Hydrologic analyses were carried out to establish peak discharge-frequency relationships for each flooding source studied by detailed methods affecting the community. For the Jackson County and Incorporated Areas FIS, dated December 15, 1990, the discharges for the Chipola River cannot be reliably estimated from the regional regression equations owing to the effects of underground caverns at the Florida Caverns State Park near the City of Marianna. This was demonstrated by failure of the regression equations to produce discharges within acceptable confidence limits of estimates obtained from a log- Pearson analysis of local gage data, the regression results being consistently high. An alternate technique adopted was based upon USGS gage data for the Chipola River at Altha and Oakdale, and for Cowarts Creek near Cottonwood, combined with SCS unit hydrograph methods (Reference 10). It was found that owing to storage in the Caverns, the observed times of concentration exceeded expected values by a factor of about four. Using this result, calculated discharges in good agreement with observation were obtained. Simple water budget analyses were performed for Ocheesee Pond and Compass Lake (Reference 11). The USGS gage at Ocheesee Pond was used to determine a starting elevation and for comparison with historical elevations. For Compass Lake, the initial elevation was taken from topographic maps (Reference 12). The peak discharges for Stump Creek, Holmes Creek and Little Creek were established using regional flow equations (Reference 13). Discharge data at USGS gage station No on the Apalachicola River at Chattahoochee have been collected since The 100-peak discharge was analyzed using 5

10 log-pearson Type III distribution as outlined in Bulletin No. 17B (Reference 14). Use of the entire period of record, including the highest observed floods 246,000 cubic feet per second (cfs) in 1925 and 293,000 cfs in 1929, was made because Jim Woodruff Dam has no flood control storage and the gates are opened during floods to pass the incoming peak flow (Reference 4). For this revision, the hydrology for Jackson County, FL limited detailed streams was calculated using HEC-HMS The precipitation distribution was based on the SCS Type III Storm (per TP-40), the loss method was based on SCS Curve Number, and routing was performed based on the Modified-Puls method. Rather than use the SCS Unit Hydrograph as the transform methodology, a user-specified unit hydrograph was used. Default SCS unit hydrograph are constructed assuming a standard Peak Rate Factor (PRF) of 484. A PRF of 484 is used in moderately hilly terrain. The terrain of northwestern Florida does not warrant the use of PRF of 484. Therefore, a PRF of 256 was used for flatter study streams to generate Unit Hydrographs, which resulted on, more reasonable flows in the study area. A PRF of 484 was used for steeper streams in the county. All streams discharges were compared to the regional regression equation estimates as an additional reasonability check. A summary of the drainage area-peak discharge relationships for new detailed streams and redelineation streams is shown in Table 2, Summary of Discharges. Flooding Source and Location Drainage Area (Square Miles) Table 2. Summary of Discharges Peak Discharges (cfs) 10-Percent- Annual-Chance 2-Percent- Annual-Chance 1-Percent- Annual-Chance 0.2-Percent- Annual-Chance APALACHICOLA RIVER At U.S. Route 90 17, , , , ,000 CHIPOLA RIVER At State Road 274 N/A N/A N/A 22,400 N/A At Iron Bridge Road ,900 17,700 20,000 29,800 HOLMES CREEK Just upstream of confluence of Fish Creek 37.8 N/A N/A 2,980 N/A Just downstream of Confluence of Little Creek 37.4 N/A N/A 2,950 N/A Just upstream of confluence of Little Creek 27.5 N/A N/A 2,220 N/A At State Road N/A N/A 2,100 N/A LITTLE CREEK At mouth 9.92 N/A N/A 1,900 N/A At State Road N/A N/A 1,590 N/A 6

11 Drainage Area (Square Miles) Table 2. Summary of Discharges Peak Discharges (cfs) 10-Percent- Annual-Chance 2-Percent- Annual-Chance 1-Percent- Annual-Chance 0.2-Percent- Annual-Chance Flooding Source and Location At Cliff Street 7.83 N/A N/A 1,420 N/A At County Road N/A N/A 1,380 N/A About 1.0 mile upstream of Cliff Street 6.92 N/A N/A 1,220 N/A STUMP CREEK At Daniels Road ,000 3,100 3,600 5,000 At Tennessee Street ,100 1,600 1,900 2,600 Still Water Elevations for 1%-annual-chance flood for Compass Lake and Ocheesee Pond are shown in Table 3. Table 3. Summary of Elevations Flooding Source and Location Elevation COMPASS LAKE (along shoreline) 187 OCHEESEE POND (along shoreline) 118 For approximate study, the National Flood-Frequency Program methods for estimating flood magnitude and frequency in region C for Unregulated Streams of Florida, 2000 (WRIR ) was used for the hydrology computations. Jackson County, FL is located in Region C, thereby determining the use of region C regression equations in hydrologic analyses for numerous flooding sources studied by the approximate methods. 3.2 Hydraulic Analyses Analyses of the hydraulic characteristics of flooding from the sources studied were carried out to provide estimates of the elevations of floods of the selected recurrence intervals. Users should be aware that flood elevations shown on the FIRM represent rounded whole-foot elevations and may not exactly reflect the elevations shown on the Flood Profiles or in the Floodway Data tables in the FIS report. For construction and/or floodplain management purposes, users are encouraged to use the flood elevation data presented in this FIS in conjunction with the data shown on the FIRM. Locations of selected cross sections used in the hydraulic analyses are shown on the Flood Profiles (Exhibit 1). For stream segments for which a floodway was computed (Section 4.2), selected cross section locations are also shown on the Flood Insurance Rate Map (Exhibit 2) For the Jackson County and Incorporated Areas FIS, dated December 15, 1990, roughness coefficients (Manning s n ) used in the hydraulic computations were selected on the basis of field observations, aerial photographs, and photographs of the streams and floodplain areas. Roughness values used for the main channels range from 0.03 to 0.06, with a range of floodplain roughness values from 0.06 to 0.15 for the overbank areas. Values for the 100-year profile on the downstream segment of the Chipola River were 7

12 obtained by interpolation using USGS gage data and topographic maps. Similarly, 100-year levels on the Chattahoochee River above Jim Woodruff Dam were obtained using COE estimates of the levels at Lake Seminole (Reference 15) and historical data to approximate the upstream surface slope. The 100-year profile for Holmes Creek downstream of the City of Graceville was interpolated from Graceville to the elevations established by detailed study at the City of Vernon (Reference 16). For the backwater analysis on Holmes Creek near Graceville and Little Creek, the E431 computer program was used (Reference 17). For this revision, Buck Pelt Branch, the Chipola River, Chipola River Trib 7, Dry Creek, Long Branch, Long Branch Trib 2, Long Branch Trib 3, Unnamed Stream 59, and Unnamed Stream 59-1 are limited detail study streams. Water surface elevations were computed using the USACE HEC-RAS step-backwater computer program version (USACE, 2005). Starting water surface elevations were calculated using the slope/area methods, except for those stream reaches that tie in directly with a detailed study where a known water surface elevation was used. Cross sections for all flooding sources studied by limited detailed methods were obtained from field surveys. For all flooding sources studied by limited detailed methods, roughness factors (Manning s n ) were chosen by engineering judgment and based on field observations of the stream and floodplain areas. Roughness coefficient for channel is ranged from to 0.05 and ranged from 0.1 to 0.15 for the overbanks. Approximate methods were used to determine the water-surface elevation of the 1-percentannual-chance flood. Water surface elevations were computed using the USACE HEC-RAS step-backwater computer program version (USACE, 2005). Starting water surface elevations were calculated using the slope/area methods, except for those stream reaches that tie in directly with a detailed study where a known water surface elevation was used. Default roughness factors (Manning s n ) values of 0.05 for the channel and 0.15 for the overbanks were used. (Reference 2) Flood profiles were drawn showing the computed water-surface elevations for floods of the selected recurrence intervals. In cases where the 2%- and 1%-annual-chance flood elevations are close together, due to limitations of the profile scale, only the 1%-annual-chance flood profile was shown. The hydraulic analyses for this study were based on the effects of unobstructed flow. The flood elevations shown on the profiles were thus considered valid only if hydraulic structures remain unobstructed, operate properly, and do not fail. Locations of selected cross sections used in the hydraulic analyses are shown on the Flood Profiles (Exhibit 1). For stream segments for which a floodway was computed (Section 4.2), selected cross section locations are also shown on the Flood Insurance Rate Map (Exhibit 2). 3.3 Vertical Datum All FIS reports and FIRMs are referenced to a specific vertical datum. The vertical datum provides a starting point against which flood, ground, and structure elevations can be referenced and compared. Until recently, the standard vertical datum in use for newly created or revised FIS reports and FIRMs was the National Geodetic Vertical Datum of
.")
13 (NGVD 29). With the finalization of the North American Vertical Datum of 1988 (NAVD 88), many FIS reports and FIRMs are being prepared using NAVD 88 as the referenced vertical datum. The average datum shift for Jackson County, Florida is feet. Flood elevations shown in this FIS report and on the FIRM are referenced to NAVD 88. These flood elevations must be compared to structure and ground elevations referenced to the same vertical datum. It is important to note that adjacent counties may be referenced to NGVD 29. This may result in differences in base flood elevations across county lines For information regarding conversion between the NGVD and NAVD, visit the National Geodetic Survey website at or contact the National Geodetic Survey at the following address: Vertical Network Branch, N/CG13 National Geodetic Survey, NOAA Silver Spring Metro Center East-West Highway Silver Spring, Maryland (301) Temporary vertical monuments are often established during the preparation of a flood hazard analysis for the purpose of establishing local vertical control. Although these monuments are not shown on the FIRM, they may be found in the Technical Support Data Notebook associated with the FIS report and FIRM for this community. Interested individuals may contact FEMA to access these data. 4.0 FLOODPLAIN MANAGEMENT APPLICATIONS The NFIP encourages State and local governments to adopt sound floodplain management programs. To assist in this endeavor, each FIS report provides 1-percent-annual-chance floodplain data, which may include a combination of the following: 10-, 2-, 1-, and 0.2-percent-annual-chance flood elevations; delineations of the 1- and 0.2-percent-annual-chance floodplains; and a 1-percent-annual-chance floodway. This information is presented on the FIRM and in many components of the FIS report. Users should reference the data presented in the FIS report as well as additional information that may be available at the local community map repository before making flood elevation and/or floodplain boundary determinations. 4.1 Floodplain Boundaries To provide a national standard without regional discrimination, the 1-percent-annual-chance (100-year) flood has been adopted by FEMA as the base flood for floodplain management purposes. The 0.2-percent-annual-chance (500-year) flood is employed to indicate additional areas of flood risk in the community. For each stream studied in detail, the 1- and 0.2- percent-annual-chance floodplain boundaries have been delineated using the flood elevations determined at each cross section. Between cross sections, the boundaries were interpolated using topographic maps at a scale of 1:24000 with a contour interval of 10 feet (Reference 6). The 1-percent annual chance and 0.2-percent annual chance floodplain boundaries are shown on the Flood Insurance Rate Map (Exhibit 2). On this map, the 1-percent annual chance floodplain boundary corresponds to the boundary of the areas of special flood hazards 9

14 (Zones A and AE,), and the 0.2-percent annual chance floodplain boundary corresponds to the boundary of areas of moderate flood hazards. In cases where the 1-percent annual chance and 0.2-percent chance floodplain boundaries are close together, only the 1-percent annual chance floodplain boundary has been shown. Small areas within the floodplain boundaries may lie above the flood elevations but cannot be shown due to limitations of the map scale and/or lack of detailed topographic data. For the streams studied by approximate methods, only the 1-percent annual chance floodplain boundary is shown on the Flood Insurance Rate Map (Exhibit 2). 4.2 Floodways Encroachment on floodplains, such as structures and fill, reduces flood-carrying capacity, increases flood heights and velocities, and increases flood hazards in areas beyond the encroachment itself. One aspect of floodplain management involves balancing the economic gain from floodplain development against the resulting increase in flood hazard. For purposes of the NFIP, a floodway is used as a tool to assist local communities in this aspect of floodplain management. Under this concept, the area of the 1-percent annual chance floodplain is divided into a floodway and a floodway fringe. The floodway is the channel of a stream, plus any adjacent floodplain areas, that must be kept free of encroachment so that the 1-percent annual chance flood can be carried without substantial increases in flood heights. Minimum Federal standards limit such increases to 1 foot, provided that hazardous velocities are not produced. The floodways in this study are presented to local agencies as minimum standards that can be adopted directly or that can be used as a basis for additional floodway studies. The floodways presented in this study were computed for certain stream segments on the basis of equal-conveyance reduction from each side of the floodplain. Floodway widths were computed at cross sections. Between cross sections, the floodway boundaries were interpolated. The results of the floodway computations are tabulated for selected cross sections (see Table 4, Floodway Data ). In cases where the floodway and 100-year floodplain boundaries are either close together or collinear, only the floodway boundary is shown. Floodways are computed on the basis of equal-conveyance reduction from each side of the floodplain. Floodway widths are computed at cross sections. Between cross sections, the floodway boundaries are interpolated. The results of the floodway computations are tabulated for selected cross sections. In cases where the floodway and 1-percent-annualchance floodplain boundaries are either close together or collinear, only the floodway boundary is shown. Encroachment into areas subject to inundation by floodwaters having hazardous velocities aggravates the risk of flood damage and heightens potential flood hazards by further increasing velocities. To reduce the risk of property damage in areas where the stream velocities are high, the community may wish to restrict development in areas outside the floodway. Near the mouths of streams studied in detail, floodway computations are made without regard to flood elevations on the receiving water body. Along streams where floodways have not been computed, the community must ensure that the cumulative effect of development in the floodplain will not cause more than a 1.0-foot 10
. 4.")
15 BASE FLOOD WATER SURFACE ELEVATION FLOODING SOURCE FLOODWAY INCREASE WITH FLOODWAY (NAVD) WITHOUT FLOODWAY (NAVD) REGULATORY (NAVD) MEAN VELOCITY (FEET PER SECOND) SECTION AREA (SQUARE FEET) WIDTH (FEET) DISTANCE CROSS SECTION CHIPOLA RIVER A 80, ,380 27, B 83, ,315 49, C 86, ,583 30, D 97, , E 104, ,020 28, F 110, ,082 31, G 114, , H 117, , I 121, ,576 23, J 126, ,882 30, K 128, ,828 25, L 133, ,331 33, STUMP CREEK A , B 6, , C 10, D 12, E 12, F 15, Feet above County Boundary 2 Feet above Mill Road FEDERAL EMERGENCY MANAGEMENT AGENCY FLOODWAY DATA JACKSON COUNTY, FL AND INCORPORATED AREAS CHIPOLA RIVER - STUMP CREEK TABLE 4

16 increase in the BFEs at any point within the community. The area between the floodway and 1-percent annual chance floodplain boundaries is termed the floodway fringe. The floodway fringe encompasses the portion of the floodplain that could be completely obstructed without increasing the water-surface elevation of the 1- percent annual chance flood more than 1 foot at any point. Typical relationships between the floodway and the floodway fringe and their significance to floodplain development are shown in Figure INSURANCE APPLICATION Figure 1. Floodway Schematic For flood insurance rating purposes, flood insurance zone designations are assigned to a community based on the results of the engineering analyses. These zones are as follows: Zone A Zone A is the flood insurance rate zone that corresponds to the 1-percent-annual-chance floodplains that are determined in the Flood Insurance Study by approximate methods. Because detailed hydraulic analyses are not performed for such areas, no base (1-percent-annual-chance) flood elevations (BFEs) or depths are shown within this zone. Zone AE Zone AE is the flood insurance rate zone that corresponds to the 1-percent-annual-chance floodplains that are determined in the Flood Insurance Study by detailed methods. Whole-foot BFEs derived from the detailed hydraulic analyses are shown at selected intervals within this zone. Zone X Zone X is the flood insurance rate zone that corresponds to areas outside the 0.2-percent-annual- 12

17 chance floodplain, areas within the 0.2-percent-annual-chance floodplain, areas of 1-percent-annualchance flooding where average depths are less than 1 foot, areas of 1-percent-annual-chance flooding where the contributing drainage area is less than 1 square mile, and areas protected from the 1- percent-annual-chance flood by levees. No BFEs or depths are shown within this zone. 6.0 FLOOD INSURANCE RATE MAP The Flood Insurance Rate Map is designed for flood insurance and floodplain management applications. For flood insurance applications, the map designates flood insurance rate zones as described in Section 5.0 and, in the 1-percent-annual-chance floodplains that were studied by detailed methods, shows selected whole-foot BFEs or average depths. Insurance agents use the zones and BFEs in conjunction with information on structures and their contents to assign premium rates for flood insurance policies. For floodplain management applications, the map shows by tints, screens, and symbols, the 1- and 0.2-percent-annual-chance floodplains, floodways, and the locations of selected cross sections used in the hydraulic analyses and floodway computations. The countywide Flood Insurance Rate Map presents flooding information for the entire geographic area of Jackson County. Previously, Flood Insurance Rate Maps were prepared for each incorporated community and the unincorporated areas of the County identified as flood-prone. This countywide Flood Insurance Rate Map also includes flood-hazard information that was presented separately on Flood Boundary and Floodway Maps, where applicable. Historical data relating to the maps prepared for each community are presented in Table 5, Community Map History. 7.0 OTHER STUDIES Because it is based on more up-to-date analyses, this countywide FIS supersedes the previously printed FISs for all jurisdictions within Jackson County. 8.0 LOCATION OF DATA Information concerning the pertinent data used in the preparation of this FIS can be obtained by contacting FEMA, Federal Insurance and Mitigation Administration, Koger Center - Rutgers Building, 3003 Chamblee Tucker Road, Atlanta, Georgia BIBLIOGRAPHY AND REFERENCES 1. U.S. Department of Commerce, Bureau of the Census, 2000 Census, Fact Sheet, Jackson County, Florida. 2. U.S. Army Corps of Engineers, Hydrologic Engineering Center, River Analysis System, HEC- RAS, Version Computer Program, revised May Federal Emergency Management Agency, Flood Insurance Study, Jackson County, Florida And Incorporated Areas Washington, D.C., December 15, Federal Emergency Management Agency, Flood Insurance Study, Gadsden County, Florida And Incorporated Areas Washington, D.C., February 4, Federal Emergency Management Agency, Flood Insurance Study, Holmes County, Florida And Incorporated Areas Washington, D.C., December 5,

18 FIRM REVISIONS DATE FIRM EFFECTIVE DATE FLOOD HAZARD BOUNDARY MAP REVISIONS DATE INITIAL IDENTIFICATION COMMUNTIY NAME Alford, Town of December 15, 1990 December 15, 1990 Bascom, Town of December 17, 2010 December 17, 2010 Campbellton, Town of September 6, 1974 January 30, 1976 December 15, 1990 October 26, 1979 Cottondale, City of November 24, 1978 December 15, 1990 Graceville, City of January 16, 1974 February 13, 1976 December 15, 1990 January 11, 1980 Grand Ridge, Town of August 2, 1974 January 9, 1976 December 15, 1990 Greenwood, Town of December 17, 2010 December 17, 2010 Jackson County December 13, 1974 September 1, 1978 December 15, 1990 (Unincorporated Area) Jacob City, Town of December 17, 2010 December 17, 2010 Malone, Town of December 15, 1990 December 15, 1990 Marianna, City of June 28, 1974 June 11, 1976 December 15, 1990 Sneads, Town of August 2, 1974 May 21, 1976 December 15, 1990 FEDERAL EMERGENCY MANAGEMENT AGENCY COMMUNITY MAP HISTORY JACKSON COUNTY, FL AND INCORPORATED AREAS TABLE 5
 Jacob City, Town of December 17, 2010 December 17, 2010 Malone, Town of December 15, 1990 December 15, 1990")
19 6. Florida Department of Revenue, North West Florida Water Management District, 2007 FDOR 1' true color, Jackson County, Florida, U.S. Department of Agriculture, Soil Conservation Service, Soil Survey of Jackson County, Florida, July U.S. Army Corps of Engineers, Mobile District, Water Resources Study, Summary Report, May U.S. Army Corps of Engineers, Mobile District, Water Resources Study, Apalachicola River Basin, May U.S. Department of Agriculture, Soil Conservation Service, National Engineering Handbook, Section 4 Hydrology, August Chow, Vent Te, Handbook of Applied Hydrology, New York: McGrawHill Book Company, Inc., U.S. Geological Survey, 7.5 Minute Series Topographic Maps, Scale 1:24000, Contour Interval 10 Feet: Graceville, Florida, Campbellton, Florida, Sills, Florida, Malone, Florida, Bascom, Florida, Steam Mill, Georgia-Florida, Chipley, Florida, Cottondale West, Florida: Cottondale East, Florida; Marianna, Florida; Dellwood, Florida; Fairchild, Florida-Georgia; Alford, Florida; Kynesville, Florida; Oakdale, Florida; Cypress, Florida; Sneads, Florida-Georgia; Compass Lake, Florida; Alford SE., Florida; Altha West, Florida; Altha East, Florida; Rock Bluff, Florida, 1982; Chattahoochee, Florida-Georgia, 1955; Cottonwood, Alabama-Florida, 1980; Grangeburg, Alabama-Florida, 1970; Saffold, Alabama-Florida, U.S. Geological Survey, Water-Resources Investigations , Techniques for Estimating Magnitude and Frequency of Floods on Natural-Flow Streams in Florida, U.S. Department of the Interior, Geological Survey, Interagency Advisory Committee on Water Data Office of Water Data Coordination, Hydrology Subcommittee, Bulletin No. 17B, Guidelines for Determining Flood Flow Frequency, September 1981, revised March U.S. Army Corps of Engineers, Mobile District, personal communication from G.B. McDonald, Chief, Hydraulic Data and Sedimentation Section, Federal Emergency Management Agency, Flood Insurance Study, Washington County, Florida And Incorporated Areas Washington, D.C., June 17, U.S. Department of the Interior, Geological Survey, Open-File Report , Computer Program E431, User s Manual, Computer Applications for Step-Backwater and Floodway Analyses, J.O. Shearman, Washington, D.C.,

20
21
22
23
24
25
26
27
28
CHICKASAW COUNTY, MISSISSIPPI, AND INCORPORATED AREAS
 CHICKASAW COUNTY, MISSISSIPPI, AND INCORPORATED AREAS Chickasaw County Community Name Community Number CHICKASAW COUNTY 280269 (UNINCORPORATED AREAS) HOUSTON, CITY OF 280030 NEW HOULKA, TOWN OF 280067
GRADY COUNTY, GEORGIA AND INCORPORATED AREAS
 GRADY COUNTY, GEORGIA AND INCORPORATED AREAS Community Name Community Number CAIRO, CITY OF 130097 GRADY COUNTY (UNINCORPORATED AREAS) 130096 WHIGHAM, CITY OF 130674 Grady County EFFECTIVE: August 18,
UNION COUNTY, FLORIDA AND INCORPORATED AREAS
 UNION COUNTY, FLORIDA AND INCORPORATED AREAS COMMUNITY NAME COMMUNITY NUMBER LAKE BUTLER, CITY OF 120595 RAIFORD, TOWN OF 120593 UNION COUNTY 120422 (UNINCORPORATED AREAS) WORTHINGTON SPRINGS, CITY OF
PUTNAM COUNTY, FLORIDA AND INCORPORATED AREAS
 PUTNAM COUNTY, FLORIDA AND INCORPORATED AREAS PUTNAM COUNTY Community Name Community Number CRESCENT CITY, CITY OF 120408 INTERLACHEN, TOWN OF 120391 PALATKA, CITY OF 120273 POMONA PARK, TOWN OF 120418
LAFAYETTE COUNTY, FLORIDA AND INCORPORATED AREAS
 LAFAYETTE COUNTY, FLORIDA AND INCORPORATED AREAS COMMUNITY NAME COMMUNITY NUMBER LAFAYETTE COUNTY 120131 (UNINCORPORATED AREAS) MAYO, TOWN OF 120132 Lafayette County SEPTEMBER 29, 2006 Federal Emergency
ROSEAU COUNTY, MINNESOTA
 Roseau County ROSEAU COUNTY, MINNESOTA AND INCORPORATED AREAS Community Name Community Number BADGER, CITY OF 270412 GREENBUSH, CITY OF 270413 *ROOSEVELT, CITY OF 270781 ROSEAU, CITY OF 270414 ROSEAU COUNTY
How To Study Floodway
 FLOOD INSURANCE STUDY ARLINGTON COUNTY, VIRGINIA COMMUNITY NAME COMMUNITY NUMBER ARLINGTON COUNTY (UNINCORPORATED AREAS) 515520 Arlington County Effective: August 19, 2013 Federal Emergency Management
How to Read a Flood Insurance Rate Map Tutorial. Developed September 2000 Updated June 2003
 How to Read a Flood Insurance Rate Map Tutorial Developed September 2000 Updated June 2003 Learning Objectives: The Objectives of the tutorial are: 1. To show the various types of flood maps, 2. To describe
URBAN DRAINAGE CRITERIA
 URBAN DRAINAGE CRITERIA I. Introduction This division contains guidelines for drainage system design and establishes a policy for recognized and established engineering design of storm drain facilities
TENNESSEE GAS PIPELINE COMPANY, L.L.C.
 TENNESSEE GAS PIPELINE COMPANY, L.L.C. HYDROLOGIC & HYDRAULIC CALCULATIONS FOR WATERBODIES CROSSED BY CONNECTICUT PIPELINE EXPANSION PROJECT CONNECTICUT LOOP Submitted by: Tennessee Gas Pipeline Company,
ROSE CREEK WATERSHED HYDROLOGIC, HYDRAULIC, SEDIMENT TRANSPORT, AND GEOMORPHIC ANALYSES TASK 1 EXISTING DATA AND INFORMATION SUMMARY REPORT BACKGROUND
 ROSE CREEK WATERSHED HYDROLOGIC, HYDRAULIC, SEDIMENT TRANSPORT, AND GEOMORPHIC ANALYSES TASK 1 EXISTING DATA AND INFORMATION SUMMARY REPORT BACKGROUND The Rose Creek Watershed (RCW) consists of three planning
Stream Channel Cross Sections for a Reach of the Boise River in Ada County, Idaho
 U.S. Department of the Interior U.S. Geological Survey In cooperation with Federal Emergency Management Agency, City of Boise, City of Garden City, City of Eagle, and Ada County Stream Channel Cross Sections
A Flood Warning System for City of Findlay, Ohio
 A Flood Warning System for City of Findlay, Ohio Matt Whitehead US Geological Survey, Ohio Water Science Center 6480 Doubletree Avenue Columbus, Ohio 43229 Abstract The U.S. Geological Survey (USGS) and
MAP TYPES FLOOD HAZARD BOUNDARY MAP MAP READING & FLOOD INSURANCE STUDIES. FHBM Flood Hazard Boundary Map. FIRM Flood Insurance Rate Map
 FLOODPLAIN MANAGEMENT 101 MAP READING & FLOOD INSURANCE STUDIES MAP TYPES FHBM Flood Hazard Boundary Map FIRM Flood Insurance Rate Map FBFM Flood Boundary and Floodway Map DFIRM Digital Flood Insurance
7.0 OTHER STUDIES 8.0 LOCATION OF DATA
 7.0 OTHER STUDIES Johnson Engineering prepared the Lee County Surface Water Management Plan for the Board of Lee County Commissioners in 1992. Johnson reviewed and modeled hydrology and hydraulics for
NATIONAL FLOOD INSURANCE PROGRAM TRANSITION TO NAVD 88. Elmer C Knoderer, P. E. Dewberry & Davis 8401 Arlington Boulevard Fairfax, VA 22031-4666
 NATIONAL FLOOD INSURANCE PROGRAM TRANSITION TO NAVD 88 Elmer C Knoderer, P. E. Dewberry & Davis 8401 Arlington Boulevard Fairfax, VA 22031-4666 BIOGRAPHICAL SKETCH Elmer C Knoderer received his B. S. in
FEMA Flood Zone Designations
 Note: SFHA "Special Flood Hazard Area" FEMA Flood Zone Designations Zone VE Zone A Zone AE Zone X Zone X500 UNDES along coasts subject to inundation by the 100-year flood with additional hazards due to
5.14 Floodplains and Drainage/Hydrology
 I-70 East Final EIS 5.14 Floodplains and Drainage/Hydrology 5.14 Floodplains and Drainage/Hydrology This section discusses floodplain and drainage/hydrology resources and explains why they are important
JEFFERSON COUNTY, FLORIDA
 JEFFERSON COUNTY, FLORIDA AND INCORPORATED AREAS Jefferson County COMMUNITY NAME COMMUNITY NUMBER JEFFERSON COUNTY (UNINCORPORATED AREAS) 120331 MONTICELLO, CITY OF 120365 EFFECTIVE: February 5, 2014 Federal
F L O O D STRAFFORD COUNTY, NEW HAMPSHIRE. Federal Emergency Management Agency. (ALL JURISDICTIONS) Strafford County. PRELIMINARY April 9, 2014
 Strafford County. PRELIMINARY April 9, 2014") F L O O D INSURANCE STUDY STRAFFORD COUNTY, NEW HAMPSHIRE (ALL JURISDICTIONS) Strafford County COMMUNITY NAME COMMUNITY NUMBER BARRINGTON, TOWN OF 330178 DOVER, CITY OF 330145 DURHAM, TOWN OF 330146 FARMINGTON,
F L O O D INSURANCE STUDY STRAFFORD COUNTY, NEW HAMPSHIRE (ALL JURISDICTIONS) Strafford County COMMUNITY NAME COMMUNITY NUMBER BARRINGTON, TOWN OF 330178 DOVER, CITY OF 330145 DURHAM, TOWN OF 330146 FARMINGTON,
Shooks Run Drainage Study Basic Terminology
 Shooks Run Drainage Study Basic Terminology PREPARED FOR: PREPARED BY: City of Colorado Springs CH2M DATE: April 9, 2015 Introduction This document is intended to provide an introduction to Colorado Springs
CASS COUNTY, NORTH DAKOTA ALL JURISDICTIONS
 CASS COUNTY, NORTH DAKOTA ALL JURISDICTIONS Cass County Community Name Community Number ALICE, CITY OF 1 380363 AMENIA, CITY OF 1 380019 AMENIA, TOWNSHIP OF 1 380686 ARGUSVILLE, CITY OF 2 380639 ARTHUR,
Flooding in the Middle Koyukuk River Basin, Alaska August 1994
 Flooding in the Middle Koyukuk River Basin, Alaska August 1994 By David F. Meyer U.S. GEOLOGICAL SURVEY Water-Resources Investigations Report 95-4118 Prepared in cooperation with the FEDERAL EMERGENCY
The answers to some of the following questions are separated into two major categories:
 Following the recent flooding events for Front Range communities in Colorado, property owners, communities, and the National Flood Insurance Program are being presented with some new challenges in the
Madison Preliminary Flood Map Open House Community Meeting
 Madison Preliminary Flood Map Open House Community Meeting December 9, 2010 INTRODUCTION Welcome to the Madison County, AL Preliminary Flood Map Open House Meeting The Office of Water Resources (OWR),
Criteria for Appeals of Flood Insurance Rate Maps
 Criteria for Appeals of Flood Insurance Rate Maps November 30, 2011 This document outlines the criteria for appealing proposed changes in flood hazard information on Flood Insurance Rate Maps (FIRMs)
Charles R. Gamble TENNESSEE DEPARTMENT OF TRANSPORTATION CANE CREEK FLOOD-FLOW CHARACTERISTICS AT STATE ROUTE 30 NEAR SPENCER, TENNESSEE
 CANE CREEK FLOOD-FLOW CHARACTERISTICS AT STATE ROUTE 30 NEAR SPENCER, TENNESSEE Charles R. Gamble U.S. GEOLOGICAL SURVEY Open-File Report 83-267 Prepared in cooperation with the TENNESSEE DEPARTMENT OF
FLOOD PROTECTION BENEFITS
 IV. (340 points) Flood Protection Benefits A. Existing and potential urban development in the floodplain (50) 1. Describe the existing and potential urban development at the site and the nature of the
Lower Raritan Watershed Management Area Stormwater & Flooding Subcommittee Strategy Worksheet LRSW-S3C1
 Strategy Name: Reduce Existing Potential for Flood Damages LRSW-S3C1. Develop and implement a program to: Minimize flood damages through the use of structural measures. Minimize flood damages through the
Multi-Jurisdictional Hazard Mitigation Plan
 Flooding General Flooding is the leading cause of death among all types of natural disasters throughout the United States, with its ability to roll boulders the size of cars, tear out trees, and destroy
BREVARD COUNTY, FLORIDA AND INCORPORATED AREAS
 BREVARD COUNTY, FLORIDA AND INCORPORATED AREAS Community Name Community Number BREVARD COUNTY (UNINCORPORATED AREAS) 125092 CAPE CANAVERAL PORT AUTHORITY 120619 CAPE CANAVERAL, CITY OF 125094 COCOA, CITY
SANTA ROSA COUNTY, FLORIDA AND INCORPORATED AREAS
 SANTA ROSA COUNTY, FLORIDA AND INCORPORATED AREAS Santa Rosa County REVISED: Federal Emergency Management Agency FLOOD INSURANCE STUDY NUMBER 12113CV000A NOTICE TO FLOOD INSURANCE STUDY USERS Communities
Federal Emergency Management Agency
 ORANGE COUNTY, TEXAS AND INCORPORATED AREAS COMMUNITY NAME BRIDGE CITY, CITY OF ORANGE, CITY OF ORANGE COUNTY UNINCORPORATED AREAS PINE FOREST, CITY OF PINEHURST, CITY OF ROSE CITY, CITY OF VIDOR, CITY
EDDY COUNTY, NEW MEXICO AND INCORPORATED AREAS
 EDDY COUNTY, NEW MEXICO AND INCORPORATED AREAS Community Name Community Number ARTESIA, CITY OF 350016 CARLSBAD, CITY OF 350017 EDDY COUNTY, UNINCORPORATED AREAS 350120 * HOPE, VILLAGE OF 350120 LOVING,
Appendix F Benefit-Cost Analysis of Flood Protection Measures
 Appendix F Benefit-Cost Analysis of Flood Protection Measures Acronyms used in Appendix F: AA B AA C AA D BC BFE EAD FEMA NED O&M PV RED USACE Average Annual Benefits Average Annual Cost Average Annual
A. Flood Management in Nevada
 Nevada Division of Water Planning A. Flood Management in Nevada Introduction Flooding has been a concern for Nevada communities since the first settlers moved to the territory in the mid-1800 s. Fourteen
Travel Time. Computation of travel time and time of concentration. Factors affecting time of concentration. Surface roughness
 3 Chapter 3 of Concentration and Travel Time Time of Concentration and Travel Time Travel time ( T t ) is the time it takes water to travel from one location to another in a watershed. T t is a component
NEW CASTLE COUNTY, DELAWARE AND INCORPORATED AREAS
 NEW CASTLE COUNTY, DELAWARE AND INCORPORATED AREAS Community Name Community Number ARDEN, VILLAGE OF 100052 *AREDENCROFT, VILLAGE OF 100057 ARDENTOWN, VILLAGE OF 100058 *BELLEFONTE, TOWN OF 100021 DELAWARE
VOLUSIA COUNTY, FLORIDA AND INCORPORATED AREAS
 VOLUSIA COUNTY, FLORIDA AND INCORPORATED AREAS VOLUSIA COUNTY Community Name Community Number DAYTONA BEACH, CITY OF 125099 DAYTONA BEACH SHORES, CITY OF 125100 DeBARY, CITY OF 120672 DELAND, CITY OF 120307
Section 5 Floodplain Management Tools
 5.1 Floodprone Areas One of the major elements of the Master Plan is the updated 100-year floodplain and floodway boundary maps. This information provided the most up-to-date tools to protect homes and
Elevations Certificates: Update 2009 Presented by Wendy Lathrop, PLS, CFM
 Elevations Certificates: Update 2009 Presented by Wendy Lathrop, PLS, CFM The objectives of the National Flood Insurance Program (NFIP): Reduce the exposure to flood damages through the use of minimum
This paper provides a concise description of
 13 UNIVERSITIES COUNCIL ON WATER RESOURCES ISSUE 130, PAGES 13-19, MARCH 2005 Overview of Flood Damages Prevented by U.S. Army Corps of Engineers Flood Control Reduction Programs and Activities James J.
CITY OF PHILADELPHIA, PENNSYLVANIA PHILADELPHIA COUNTY
 CITY OF PHILADELPHIA, PENNSYLVANIA PHILADELPHIA COUNTY CITY OF PHILADELPHIA The Preliminary FIS report does not include unrevised Floodway Data Tables or unrevised Flood Profiles. These unrevised components
The Mississippi River & Tributaries Project
 The Mississippi River & Tributaries Project The Mississippi River & Tributaries (MR&T) project was authorized by the 1928 Flood Control Act. Following the devastating 1927 flood, the nation was galvanized
CHAPTER 9 CHANNELS APPENDIX A. Hydraulic Design Equations for Open Channel Flow
 CHAPTER 9 CHANNELS APPENDIX A Hydraulic Design Equations for Open Channel Flow SEPTEMBER 2009 CHAPTER 9 APPENDIX A Hydraulic Design Equations for Open Channel Flow Introduction The Equations presented
Guidance for Flood Risk Analysis and Mapping. Changes Since Last FIRM
 Guidance for Flood Risk Analysis and Mapping Changes Since Last FIRM May 2014 This guidance document supports effective and efficient implementation of flood risk analysis and mapping standards codified
CITY UTILITIES DESIGN STANDARDS MANUAL
 CITY UTILITIES DESIGN STANDARDS MANUAL Book 2 (SW) SW9 June 2015 SW9.01 Purpose This Chapter provides information for the design of open channels for the conveyance of stormwater in the City of Fort Wayne.
Salem County, New Jersey Flood Hazard Mapping Status Report for Property Owners
 Salem County, New Jersey Flood Hazard Mapping Status Report for Property Owners Salem County, New Jersey Flood Hazard Mapping Status Report for Property Owners FLOOD INSURANCE Who Should Purchase Flood
TABLE OF CONTENTS. This document was prepared by. URS Group, Inc. 200 Orchard Ridge Drive, Suite 101 Gaithersburg, MD 20878. In Association with:
 Delaware and Susquehanna River Basin Flood Data Assessment Pennsylvania May 2008 Federal Emergency Management Agency Department of Homeland Security 500 C Street, SW Washington, DC 20472 TABLE OF CONTENTS
TROPICAL STORM ALLISON. Prepared by: John P. Ivey, PE, CFM Halff Associates, Inc. ASCE
 TROPICAL STORM ALLISON June 5-9, 5 2001 Prepared by: John P. Ivey, PE, CFM Halff Associates, Inc. ASCE Spring 2002 Meeting Arlington, Texas March 27-30, 2002 Tropical Storm Allison (TSA) The most extensive
FRANKLIN COUNTY, FLORIDA
 FRANKLIN COUNTY, FLORIDA AND INCORPORATED AREAS COMMUNITY NAME COMMUNITY NUMBER APALACHICOLA, CITY OF 120089 CARRABELLE, CITY OF 120090 FRANKLIN COUNTY (UNINCORPORATED AREAS) 120088 REVISED: FEBRUARY 5,
Changes to Alabama Flood Maps Impacts to Flood Insurance. Presented By: Leslie A. Durham, P.E. ADECA Office of Water Resources
 Changes to Alabama Flood Maps Impacts to Flood Insurance Presented By: Leslie A. Durham, P.E. ADECA Office of Water Resources January 23, 2014 1 Impacts of Flood Events Flooding is not just a coastal concern.
APPENDIX G FLOOD WARNING RESPONSE PLAN
 ESCAMBIA COUNTY, FLORIDA DEPARTMENT OF PUBLIC SAFETY POLICY/PROCEDURE-Division of Emergency Management RE: Flood Warning Response Plan Approved by: Effective Date: August 27, 2007 Revised/Reviewed Date:
2D Modeling of Urban Flood Vulnerable Areas
 2D Modeling of Urban Flood Vulnerable Areas Sameer Dhalla, P.Eng. Dilnesaw Chekol, Ph.D. A.D. Latornell Conservation Symposium November 22, 2013 Outline 1. Toronto and Region 2. Evolution of Flood Management
Land Disturbance, Erosion Control and Stormwater Management Checklist. Walworth County Land Conservation Department
 Land Disturbance, Erosion Control and Stormwater Management Checklist Walworth County Land Conservation Department The following checklist is designed to assist the applicant in complying with the Walworth
HYDROLOGIC/HYDRAULIC MODELING OF WESTMINSTER WATERSHED ORANGE COUNTY, CALIFORNIA
 HYDROLOGIC/HYDRAULIC MODELING OF WESTMINSTER WATERSHED ORANGE COUNTY, CALIFORNIA James Chieh, Ph.D., P.E., Senior Hydraulic Engineer, USACE, Los Angeles, California, Shih.H.Chieh@usace.army.mil; Jay Pak,
Computing Stormwater Runoff Rates and Volumes
 New Jersey Stormwater Best Management Practices Manual February 2004 C H A P T E R 5 Computing Stormwater Runoff Rates and Volumes This chapter discusses the fundamentals of computing stormwater runoff
Prattsville Berm Removal Project. 1.0 Project Location
 Prattsville Berm Removal Project 1.0 Project Location The project site is located between the New York State Route 23 Bridge over the Schoharie Creek and the Schoharie Reservoir. The restoration plan encompassed
FLOOD INSURANCE STUDY
 FLOOD INSURANCE STUDY SANTA FE COUNTY, NEW MEXICO AND INCORPORATED AREAS Santa Fe County COMMUNITY NAME COMMUNITY NUMBER COCHITI, PUEBLO OF 350152 EDGEWOOD, TOWN OF 350018 ESPANOLA, CITY OF 350052 NAMBE,
FINAL TECHNICAL MEMORANDUM AWD-00002 FLOWS THROUGH FLOOD DAMAGE REDUCTION AREA July 16, 2012
 FINAL TECHNICAL MEMORANDUM AWD-00002 FLOWS THROUGH FLOOD DAMAGE REDUCTION AREA July 16, 2012 Table of Contents TABLE OF CONTENTS Table of Contents... 1 Executive Summary... 2 1 Objective... 4 2 Study Approach...
ST. CLAIR COUNTY, ILLINOIS
 ST. CLAIR COUNTY, ILLINOIS AND INCORPORATED AREAS St. Clair County Community Community Community Community Name Number Name Number ALORTON, VILLAGE OF 170617 MARISSA, VILLAGE OF 171058 BELLEVILLE, CITY
Post-Flood Assessment
 Page 1 of 7 Post-Flood Assessment CHAPTER 4 AGENCY COORDINATION Agency coordination is an essential element for the operation of the flood management systems in the Central Valley. Due to the nature of
The Alternatives of Flood Mitigation in The Downstream Area of Mun River Basin
 The Alternatives of Flood Mitigation in The Downstream Area of Mun River Basin Dr.Phattaporn Mekpruksawong 1, Thana Suwattana 2 and Narong Meepayoong 3 1 Senior Civil Engineer, Office of Project Management,
DANIELS RUN STREAM RESTORATION, FAIRFAX, VIRGINIA: FLOODPLAIN ANALYSIS REPORT
 DANIELS RUN STREAM RESTORATION, FAIRFAX, VIRGINIA: FLOODPLAIN ANALYSIS REPORT By: Conor C. Shea Stream Habitat Assessment and Restoration Program U.S. Fish and Wildlife Service CBFO-S07-01 Prepared in
CHAPTER 2 HYDRAULICS OF SEWERS
 CHAPTER 2 HYDRAULICS OF SEWERS SANITARY SEWERS The hydraulic design procedure for sewers requires: 1. Determination of Sewer System Type 2. Determination of Design Flow 3. Selection of Pipe Size 4. Determination
How To Develop A Flood Risk Map
 Recommended Procedures for Flood Velocity Data Development November 2012 Federal Emergency Management Agency Department of Homeland Security 500 C Street, SW Washington, DC 20472 This document was prepared
Town of Chatham Department of Community Development
 Town of Chatham Department of Community Development TOWN ANNEX 261 GEORGE RYDER ROAD 02633 CHATHAM, MA TELEPHONE (508) 945-5168 FAX (508) 945-5163 FEMA FLOOD MAP UPDATE & PROPOSED ZONING BYLAW AMENDMENT
Frequently-Asked Questions about Floodplains and Flood Insurance FLOOD INSURANCE
 Frequently-Asked Questions about Floodplains and Flood Insurance What is a floodplain? The floodplain is any area covered by water during normal water flows, and which could be inundated as a result of
ORDINANCE NO. 2013 -
 ORDINANCE NO. 2013 - AN ORDINANCE OF BREVARD COUNTY, FLORIDA AMENDING CHAPTER 62, LAND DEVELOPMENT REGULATIONS SECTION 62-2891, LOT DRAINAGE, AND CHAPTER 22 BUILDINGS AND BUILDING REGULATIONS, SECTION
DOÑA ANA COUNTY DESIGN STORM CRITERIA GUIDELINES FOR COMMERCIAL AND RESIDENTIAL SITES. Run-off Analysis Methods
 DOÑA ANA COUNTY DESIGN STORM CRITERIA GUIDELINES FOR COMMERCIAL AND RESIDENTIAL SITES Run-off Analysis Methods This document sets forth the minimum design, technical criteria and specifications for the
ECONOMIC ANALYSIS FLOOD DAMAGE REDUCTION. Lower Carmel River Floodplain Restoration and Enhancement Project
 ECONOMIC ANALYSIS FLOOD DAMAGE REDUCTION Lower Carmel River Floodplain Restoration and Enhancement Project I. Description of the Project and its Relationship to Other Projects in the Proposal The Lower
Chapter 4. Flood Risk Assessment
 Chapter 4 Flood Risk Assessment Chapter Overview Any floodplain management program must be established on a sound technical and scientific basis in order to be effective, whether for flood loss reduction
GLOSSARY OF TERMS CHAPTER 11 WORD DEFINITION SOURCE. Leopold
 CHAPTER 11 GLOSSARY OF TERMS Active Channel The channel that contains the discharge Leopold where channel maintenance is most effective, sediment are actively transported and deposited, and that are capable
Interpreting Federal Emergency Management Agency Flood Maps and Studies in the Coastal Zone
 Interpreting Federal Emergency Management Agency Flood Maps and Studies in the Coastal Zone Publication Date: October 2015 Table of Contents FEMA Flood Insurance Rate Maps and Flood Insurance Studies.
Catchment Scale Processes and River Restoration. Dr Jenny Mant Jenny@therrc.co.uk. The River Restoration Centre therrc.co.uk
 Catchment Scale Processes and River Restoration Dr Jenny Mant Jenny@therrc.co.uk The River Restoration Centre therrc.co.uk 3 Main Catchment Elements Hydrology Energy associated with the flow of water affects
Evaluation of Open Channel Flow Equations. Introduction :
 Evaluation of Open Channel Flow Equations Introduction : Most common hydraulic equations for open channels relate the section averaged mean velocity (V) to hydraulic radius (R) and hydraulic gradient (S).
Flood Risk Management
 Flood Risk Management Value of Flood Risk Management Every year floods sweep through communities across the United States taking lives, destroying property, shutting down businesses, harming the environment
Flood Risk Management
 Flood Risk Management Value of Flood Risk Management Value to Individuals and Communities Every year floods sweep through communities across the United States taking lives, destroying property, shutting
Environmental Data Management Programs
 Hydrologic Engineering Centre (HEC) Software CD Collection of programs, developed by the U.S. Army Corps of Engineers Environmental Data Management Programs Name: HEC-DSS Package Purpose: Data Storage
The Basics of Chapter 105 Waterways and Wetlands Permitting in PA
 The Basics of Chapter 105 Waterways and Wetlands Permitting in PA April 17, 2013 Goal To develop a basic understanding of PA Department of Environmental Protection (DEP) and US Army Corps of Engineers
Request for Proposals for Topographic Mapping. Issued by: Teton County GIS and Teton County Engineering Teton County, Wyoming
 Request for Proposals for Topographic Mapping Issued by: Teton County GIS and Teton County Engineering Teton County, Wyoming Proposals due: 2:00PM MDT July 1, 2015 Proposals may be delivered to: Teton
Floodplain Development Land Use Review
 COMMUNITY DEVELOPMENT DEPARTMENT Planning Division P.O. Box 490 333 Broadalbin Street SW Albany, OR 97321 Phone 541-917-7550 Fax 541-791-0150 www.cityofalbany.net Floodplain Development Land Use Review
AUTOMATION OF FLOOD HAZARD MAPPING BY THE FEDERAL EMERGENCY MANAGEMENT AGENCY ABSTRACT INTRODUCTION
 AUTOMATION OF FLOOD HAZARD MAPPING BY THE FEDERAL EMERGENCY MANAGEMENT AGENCY Daniel M. Cotter Federal Emergency Management Agency Federal Insurance Administration Office of Risk Assessment 500 C Street,
Section 19. Basin-wide Mitigation Action Plans
 Section 19. Basin-wide Mitigation Action Plans This Mitigation Plan identifies twelve specific hazards that could affect the Basin. Section 20 of this Plan set forth mitigation action plans to be carried
Hydrologic Engineering Techniques for Regional Water Resources Planning
 US Army Corps of Engineers Hydrologic Engineering Center Hydrologic Engineering Techniques for Regional Water Resources Planning October 1969 Approved for Public Release. Distribution Unlimited. TP-17
Methods for Determination of Safe Yield and Compensation Water from Storage Reservoirs
 US Army Corps of Engineers Hydrologic Engineering Center Methods for Determination of Safe Yield and Compensation Water from Storage Reservoirs October 1966 Approved for Public Release. Distribution Unlimited.
Division of Water Frequently asked floodplain questions
 Division of Water Frequently asked floodplain questions Q: Where can I find copies of the floodplain mapping? A: Local floodplain administrators will have copies of the FEMA mapping. (Generally the local
NYSDEC Optional Additional Language Model Local Law for Flood Damage Prevention Optional Additional Language
 NYSDEC General Comments. The contains language that complies with the floodplain management requirements of the National Flood Insurance Program (NFIP) contained in federal regulations 44 CFR 60.3 through
CLEARWATER DAM BLACK RIVER, MISSOURI MAJOR REHABILITATION STUDY
 US Army Corps of Engineers Little Rock District CLEARWATER DAM BLACK RIVER, MISSOURI MAJOR REHABILITATION STUDY HYDROLOGIC AND HYDRAULIC ANALYSES NOTES: 1) All elevations listed in this report are referenced
DEVELOPING AN INUNDATION MAP STANDARD FOR THE U.S. ARMY CORPS OF ENGINEERS
 DEVELOPING AN INUNDATION MAP STANDARD FOR THE U.S. ARMY CORPS OF ENGINEERS Will Breitkreutz, Geographer, U.S. Army Corps of Engineers Kansas City District, Kansas City, Missouri, will.l.breitkreutz@usace.army.mil
Frequently Asked Questions (FAQs) 1. Why is the City of Tucson getting new flood hazard maps? 2. Who is responsible for modernizing the maps?
 1. Why is the City of Tucson getting new flood hazard maps? 2. Who is responsible for modernizing the maps?") Frequently Asked Questions (FAQs) 1. Why is the City of Tucson getting new flood hazard maps? 2. Who is responsible for modernizing the maps? 3. What is a Flood Hazard Map? 4. What are the benefits of
Frequently Asked Questions (FAQs) 1. Why is the City of Tucson getting new flood hazard maps? 2. Who is responsible for modernizing the maps? 3. What is a Flood Hazard Map? 4. What are the benefits of
SIMPLIFIED INUNDATION MAPS FOR EMERGENCY ACTION PLANS. National Dam Safety Review Board Emergency Action Plan Workgroup
 SIMPLIFIED INUNDATION MAPS FOR EMERGENCY ACTION PLANS National Dam Safety Review Board Emergency Action Plan Workgroup EXECUTIVE SUMMARY Development of Emergency Action Plans (EAPs) for all high and significant
CHAPTER 3 page 69 LOCAL FLOODPLAIN REGULATIONS AND NFIP STANDARDS
 CHAPTER 3 page 69 LOCAL FLOODPLAIN REGULATIONS AND NFIP STANDARDS LOCAL FLOODPLAIN REGULATIONS AND NFIP STANDARDS, page 69 THE PARTICIPATION OF A COMMUNITY IN THE NFIP IS MADE POSSIBLE BY ITS ADOPTION
Tookany Creek Flood Damage Reduction Feasibility Study Section 205 Continuing Authorities Program
 Tookany Creek Flood Damage Reduction Feasibility Study Section 205 Continuing Authorities Program Field Inspection Notes 27 29 September 2012 Introduction The U.S. Army Corps of Engineers (Corps), in
Flood Emergency Response Planning: How to Protect Your Business from a Natural Disaster RIC005
 Flood Emergency Response Planning: How to Protect Your Business from a Natural Disaster RIC005 Speakers: Tom Chan, CEO, Global Risk Miyamoto Greg Bates, Principal, Global Risk Consultants Learning Objectives
University of MT Helena College of Technology Helena, MT July 21, 2010. Image Courtesy Watershed Sciences, Inc.
 University of MT Helena College of Technology Helena, MT July 21, 2010 Image Courtesy Watershed Sciences, Inc. WELCOME INTRODUCTIONS Image Courtesy Watershed Sciences, Inc. Target Audience: Engineers,
CITY OF CHARLOTTE STORM WATER SERVICES CREDIT APPLICATION INSTRUCTION MANUAL
 CITY OF CHARLOTTE STORM WATER SERVICES CREDIT APPLICATION INSTRUCTION MANUAL March 2008 A note to recipients of the Charlotte-Mecklenburg Storm Water Services Credit Application Manual: This is the second
Risk MAP Project Coordination Meeting: Burlington County, NJ. FEMA REGION II May 8, 2013 Westampton, New Jersey
 Risk MAP Project Coordination Meeting: Burlington County, NJ FEMA REGION II May 8, 2013 Westampton, New Jersey Agenda Introductions Purpose of this Meeting Risk MAP Program Overview Anticipated Project
11 Flooding 11.1 HISTORICAL FLOODS
 11 Flooding Flood hazards in Humboldt County are attributable to rivers, dam failure, and coastal high water hazards (tsunamis and flood tides), with river flooding being by far the most prevalent. Flooding
The Mississippi River & Tributaries Project
 Following the Great Mississippi River Flood of 1927, the nation galvanized in its support for a comprehensive and unified system of public works within the lower Mississippi Valley that would provide enhanced