A Candlestick Primer. By Tom Bierovic
|
|
|
- Cameron Harmon
- 9 years ago
- Views:
Transcription
1 A Candlestick Primer By Tom Bierovic
2 Introduction Although centuries old, Japanese candlestick charts are relatively new to the West: Steve Nison introduced them here in 1991 in his book, Japanese Candlestick Charting Techniques. The candles provide the same price information (open, high, low, and close) that bar charts do, but they display that information in a more visually appealing, more meaningful way. In this e-book, you ll learn how to read candlesticks and how to identify the most important candlestick patterns. The first slide presents a daily candlestick chart, the second introduces the terminology for a candlestick s components, and the third shows how to read a candlestick. The rest of the e- book describes and illustrates many useful candlestick patterns.

3 Japanese Candlestick Chart

4 Components of Japanese Candlesticks

5 Reading Japanese Candlesticks

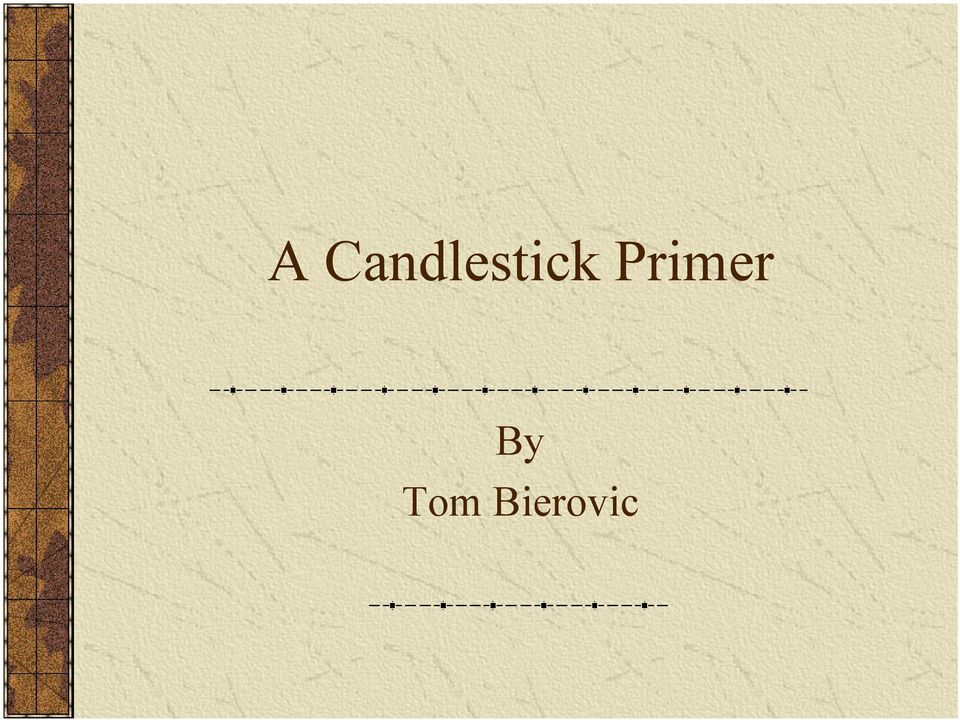
6 Bullish and Bearish Engulfing Lines A bullish engulfing line, which occurs in a downtrend, is a tall, white real body that engulfs the previous session s smaller, black real body. The bullish engulfing line opens below the previous session s close and closes above the previous session s open. A bearish engulfing line occurs in an uptrend. Its tall, black real body engulfs the previous session s smaller, white real body. In other words, a bearish engulfing line opens above the previous session s close and closes below the previous session s open.

7 Bullish Engulfing Line
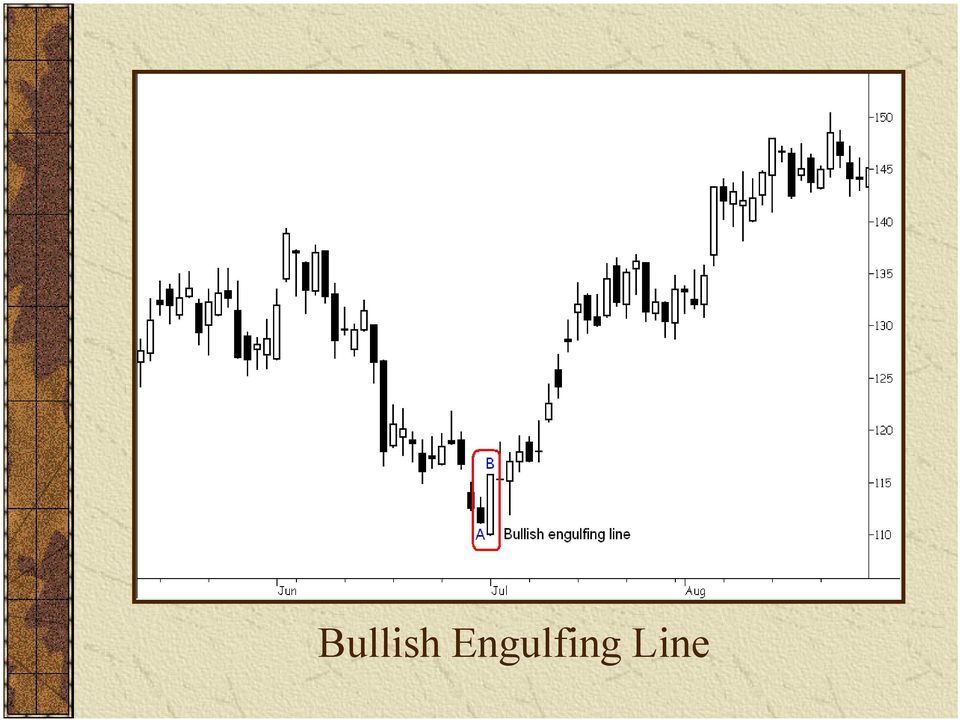
8 Bearish Engulfing Line
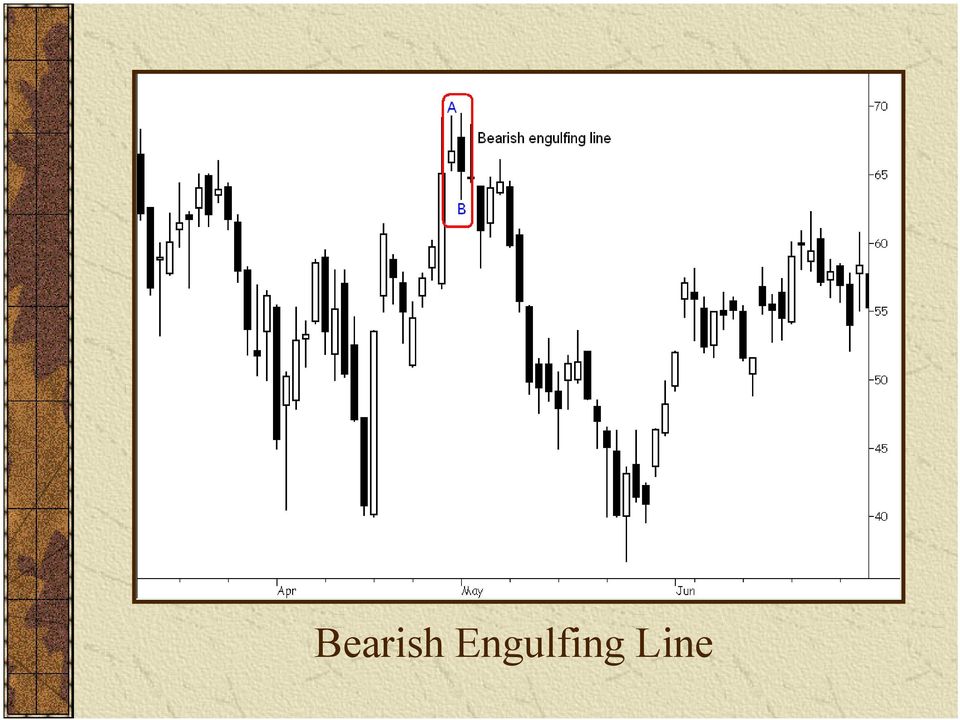
9 Piercing Line and Dark Cloud Cover A piercing line is a tall white candle that follows a tall black candle in a downtrend. It opens below the previous candle s low but closes at least halfway into the previous candle s real body. A dark cloud cover is a tall black candle that follows a tall white candle in an uptrend. It opens above the previous candle s high but closes at least halfway into the previous candle s real body. A piercing line is bullish, and a dark cloud cover is bearish.

10 Piercing Line

11 Dark Cloud Cover
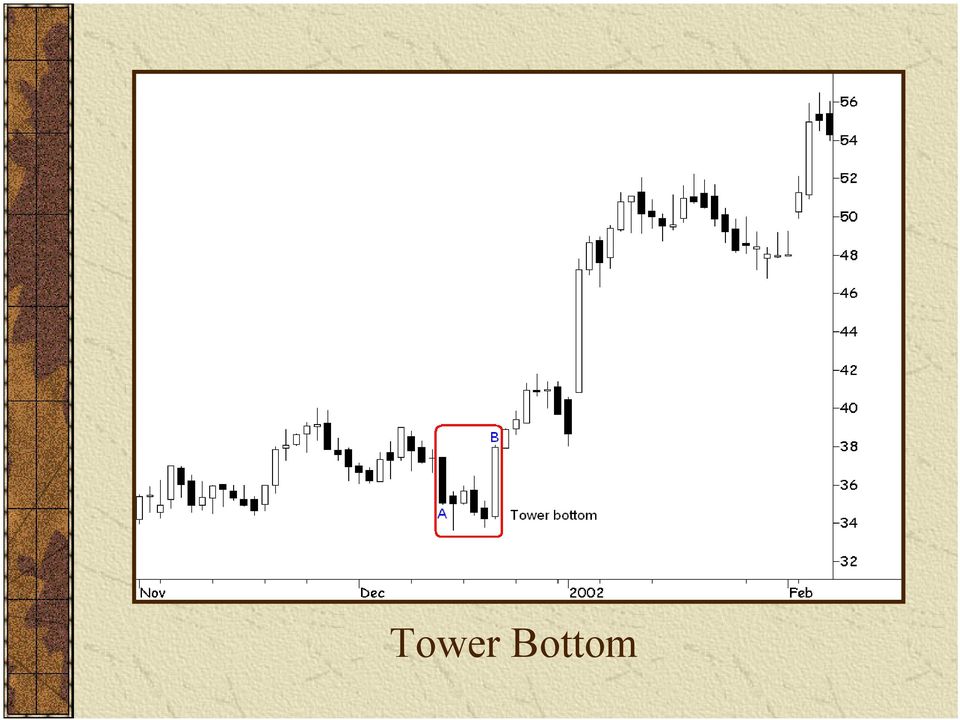
12 Tower Bottoms and Tower Tops A tower bottom begins with a tall black candle in a downtrend. It s followed by a series of smaller real bodies that trade sideways. Finally, a tall white candle forms the second tower, completing the pattern. A tower top begins with a tall white candle in an uptrend. It s followed by a series of smaller real bodies that trade sideways. Finally, a tall black candle forms the second tower, completing the pattern. A tower bottom is bullish, and a tower top is bearish.

13 Tower Bottom
14 Tower Top

15 Rising Three and Falling Three A rising three pattern begins with a tall white candle in an uptrend. It s followed by three small real bodies (usually black) that hold within the white candle s range. A tall white candle that closes above the high of the first white candle completes the pattern. A falling three pattern begins with a tall black candle in a downtrend. It s followed by three small real bodies (usually white) that hold within the black candle s range. A tall black candle that closes below the low of the first black candle completes the pattern. A rising three pattern is bullish; a falling three pattern is bearish.

16 Rising Three

17 Falling Three

18 Morning Star and Evening Star A morning star, which occurs in a downtrend, consists of three candles: a tall, black real body, a small real body (either white or black) that gaps open below the real body of the first candle, and a tall white candle with a strong close at least halfway into the first candle s real body. An evening star is a three-candle pattern in an uptrend: a tall, white real body, a small real body (either white or black) that gaps open above the real body of the first candle, and a tall black candle with a close at least halfway into the first candle s real body. A morning star is bullish; an evening star is bearish.

19 Morning Star

20 Evening Star

21 Three White Soldiers and Three Black Crows The three white soldiers pattern is composed of three consecutive tall white candles that close near their highs. Upper and lower shadows are usually absent or small. The three black crows pattern is composed of three consecutive tall black candles that close near their lows. Upper and lower shadows are usually absent or small. A three white soldiers pattern is bullish. A three black crows pattern is bearish.
22 Three White Soldiers
23 Three Black Crows
24 Hammer and Hanging Man A hammer, which occurs in a downtrend, has a small real body (either black or white) at the top of its range. A hammer has little or no upper shadow, but its lower shadow must be at least twice as tall as the real body. A hanging man is identical to a hammer, with one exception: a hanging man is found in an uptrend, while a hammer is found in a downtrend. A hammer is bullish; a hanging man is bearish.
25 Hammer
26 Hanging Man
27 Harami, Doji, and Harami Cross A harami is a small real body that is within the previous candle s real body. Although the color of the harami s real body is usually the opposite color of the previous candle, it can be either white or black. A doji represents a trading session in which the open and close occur at the same (or nearly the same) price; therefore, a doji has a very small real body. A harami cross is a combination of a harami and a doji, i.e., its real body, which represents an open and close at the same (or nearly the same price), is contained within the previous candle s real body. In a downtrend, these three patterns are bullish; in an uptrend, they re bearish.
28 Harami
29 Doji
30 Harami Cross
31 Conclusion By now you should have learned to identify the most important candlestick patterns. Your next step will be learning to integrate the patterns into your own trading strategy. Look for ways to combine candles with Western technical tools like gaps, trendlines, support and resistance, moving averages, and classic chart patterns (e.g., flags and triangles). There are as many ways to trade with candles as there are grains of rice in a bushel basket. Let the candles light your way!
New Trendlens Indicators & Functions
 New Trendlens Indicators & Functions There are 83 new indicators and functions available in TrendLens. Formation Functions Highest Value The Highest Value formation function looks back bar count number
Golden Penny Stock Millionaires Golden Market Secrets For Trading Penny Stocks:
 Golden Penny Stock Millionaires Golden Market Secrets For Trading Penny Stocks: Introduction: Greetings; Hey, I m William Bell, stock analyst with the Golden Penny Stock Millionaires Financial Trading
CHART PATTERNS. www.tff-onlinetrading.com
 CHART PATTERNS Technical analysis, as you have seen in our Trading Academy videos so far, is not just about charts. It does, however, rely heavily on them and often uses chart patterns to assist in making
USING CANDLESTICK CHARTS TO TRADE FOREX
 CONTENTS Disclaimer Introduction Candlestick Chart Origins Candlestick Chart Definition Single Candlestick Patterns Multiple Candlestick Chart Patterns Two Candlestick Pattern Formations Three Candlestick
Identifying Short Term Market Turns Using Neural Networks and Genetic Algorithms
 Identifying Short Term Market Turns Using Neural Networks and Genetic Algorithms Donn S. Fishbein, MD, PhD Neuroquant.com On March 26, 2008, in the Wall Street Journal page one article Stocks Tarnished
12 Signals to Master any Market'
 12 Signals to Master any Market' Master these Major Candlestick Signals if you want to Master the Market. Copyright Stephen W. Bigalow 2007 May not be duplicated or distributed Published by The Candlestick
Candlesticks. Bar Charts CANDLESTICK CORNER. When you look at your charts, do you understand everything they re telling you? by Rudy Teseo BEARISH
 Stocks & ommodities V. 20:2 (65-69): andlesticks Vs. ar harts by Rudy Teseo NLESTIK ORNER VS andlesticks ar harts When you look at your charts, do you understand everything they re telling you? by Rudy
CHART TRADING GUIDE 1
 CHART TRADING GUIDE 1 How to understand chart trading This guide is designed to teach you the basics of chart trading- the chart patterns that are covered in this booklet can be used for short and medium
The Candlestick Summit Reaching the top levels of Nison candlesticks- Day 1
 The Candlestick Summit Reaching the top levels of Nison candlesticks- Day 1 Candlestick Charting Strategies Candlesticks + Western Indicators Candlesticks + Trade Management Approximate Time Line Day 1
by Mark Rose Read candlestick charts accurately Spot patterns quickly and easily Use that information to make profitable trading decisions
 Everything you wanted to know about candlestick charts by Mark Rose Read candlestick charts accurately Spot patterns quickly and easily Use that information to make profitable trading decisions Contents
What You Don t Know About Candlesticks
 Researching candlesticks yields some surprises. In When Candles Work Best What You Don t Know About Candlesticks by Thomas N. Bulkowski writing my latest book, Encyclopedia Of Candlestick Charts, I made
Swing Trading Using Candlestick charting with Pivot Point Analysis. Written by John L. Person
 Swing Trading, pg. 1 Swing Trading Using Candlestick charting with Pivot Point Analysis Written by John L. Person Introduction: This booklet was written with the intention of enlightening your knowledge
3 POWERFUL FOREX PRICE PATTERNS
 3 POWERFUL FOREX PRICE PATTERNS RANGE PRICE ACTION Defined To Interpret what the OPEN, HIGH, LOW, and CLOSE did on a Particular Bar and compare that criteria to the Previous Price Bar s Action, in order
Alerts & Filters in Power E*TRADE Pro Strategy Scanner
 Alerts & Filters in Power E*TRADE Pro Strategy Scanner Power E*TRADE Pro Strategy Scanner provides real-time technical screening and backtesting based on predefined and custom strategies. With custom strategies,
The Power And Finesse of Japanese Candlestick Charting
 The Power And Finesse of Japanese Candlestick Charting Presented by: Brad L. Matheny Over three centuries ago, one Japanese man began developing a technical analysis tool that was directly related to the
PCF s for TC2000 and TCNet Users 3 MAJOR SIGNALS. The Hanging Man. The Inverted Hammer. The Piercing Pattern. The Dark Cloud
 PCF s for TC2000 and TCNet Users 3 MAJOR SIGNALS The Hanging Man The Inverted Hammer The Piercing Pattern The Dark Cloud A Candlestick Forum publication Years of Candlestick Analysis made available in
A Day Trader Search for Profits Written By: John L. Person, CTA www.nationalfutures.com
 Buy low sell high, buy high and sell higher or sell low and buy lower. Whatever your method is, the results need to be profitable or a trader s career will be cut short. Most investors, whether that is
Intra-Day Trading Techniques
 Pristine.com Presents Intra-Day Trading Techniques With Greg Capra Co-Founder of Pristine.com, and Co-Author of the best selling book, Tools and Tactics for the Master Day Trader Copyright 2001, Pristine
Trendline Tips And Tricks
 Tantalizing! Trendline Tips And Tricks How do you capture those medium- to longer-term moves when trying to enter and exit trades quickly? D by Sylvain Vervoort aydreaming about trading? Get in a trade
The Art of Japanese Candlestick Charting
 The Art of Japanese Candlestick Charting By Brett Fogle Want to see more pro tips even better than Candlesticks? Click the button below to learn more. - 1 - Index The Art of Japanese Candlestick Charting...
Definitions to Basic Technical Analysis Terms. www.recognia.com
 Definitions to Basic Technical Analysis Terms www.recognia.com A Alert An alert is a notification sent when a significant event occurs in one or more investments of importance to a trader. Recognia sends
Intra-Day Trading Techniques. Pristine.com Presents. Greg Capra. book, Tools and Tactics for the Master Day Trader
 Pristine.com Presents Intra-Day Trading Techniques With Greg Capra Co-Founder of Pristine.com, and Co-Author of the best selling book, Tools and Tactics for the Master Day Trader Copyright 2001, Pristine
Ed Heath s Guerilla Swing Trading Plan (as of 1/22/13)
") Ed Heath s Guerilla Swing Trading Plan (as of 1/22/13) Synopsis: I call my trading style Guerilla Swing Trading. I trade upward momentum stocks that have pulled back for a buying opportunity and my goal
Ed Heath s Guerilla Swing Trading Plan (as of 1/22/13) Synopsis: I call my trading style Guerilla Swing Trading. I trade upward momentum stocks that have pulled back for a buying opportunity and my goal
Stock Investing Basics of Japanese Candlesticks.
 Stock Investing Basics of Japanese Candlesticks. Candlestick trading analysis does not require knowing intricate formulas or ratios. Candlestick analysis does not require massive amounts of education to
Action Forex Company Limited 2010
 1 2 Sponsored by 3 TABLE OF CONTENTS TABLE OF CONTENTS... 4 INTRODUCTION... 5 CHAPTER 1 CHART ANALYSIS IN CURRENCY TRADING... 6 1.1 - IMPORTANCE OF CHART ANALYSIS IN CURRENCY TRADING... 6 1.2 - BASIC CHART
WELCOME TO Trading Boot Camp Day 2
 Icoachtrader Consulting Service www.icoachtrader.weebly.com WELCOME TO Trading Boot Camp Day 2 David Ha Ngo Trading Coach Phone: 1.650.899.1088 Email: [email protected] The information presented is
The NYSE Tick Index And Candlesticks
 INDICATORS The NYSE Tick Index And Candlesticks The tick index may appear to be one of the simplest of market indicators, but it also offers insight into market psychology. As a stand-alone indicator,
Table of Contents. Preface. Chapter 1: TRADING BASICS. Chapter 2: BASIC TOOLS. Chapter 3: ADX. Chapter 4: ACCUMULATION LINE
 Table of Contents Preface Chapter 1: TRADING BASICS Chapter 2: BASIC TOOLS Chapter 3: ADX Chapter 4: ACCUMULATION LINE Chapter 5: AVERAGE TRUE RANGE Chapter 6: CANDLESTICKS Chapter 7: MACD Chapter 8: MOVING
JAPANESE CANDLESTICK CHARTING TECHNIQUES
 JAPANESE CANDLESTICK CHARTING TECHNIQUES JAPANESE CANDLESTICK CHARTING TECHNIQUES u-v 7 ( "Candles Exhaust Themselves to Give Light to Men" Acknowledgements Like having ice cream after a tonsillectomy,
Online Tutorial. Table of contents
 Table of contents I. Forex Online Trading... 5 1. What is Forex?... 5 2. Technical and Fundamental Analysis... 6 a. Technical analysis... 6 b. Fundamental Analysis... 6 3. Psychology of Trading... 8 4.
FOREX analysing made easy
 FOREX analysing made easy UNDERSTANDING TECHNICAL ANALYSIS An educational tool by Blackwell Global Contents Technical Analysis 2 Line Chart 3 Bar Chart 4 Candlestick Chart 5 Support and Resistance 6 Fibonacci
Class 2: Buying Stock & Intro to Charting. Buying Stock
 Class 2: Buying Stock & Intro to Charting Today s Class Buying Stock Intro to Charting Real World Analysis Buying Stock What Is a Stock? Share of ownership in a company Publicly traded Holds monetary value
Expert- Forex- Systems.com
 Expert- Forex- Systems.com Profit From The Forex Market Andrew Fields 1 2 Expert-Forex-Systems.com www.expert-forex-systems.com This book has been written in order to provide Forex traders with two tried
Candlesticks For Support And Resistance
 NOVICE TRADER Candlesticks For Support And Resistance Even as you read this, the candlestick charting technique, with its origins in Japan, is being absorbed into the ways of Western technical analysis.
8 Day Intensive Course Lesson 3
 8 Day Intensive Course Lesson 3 A) What are Fibonacci Retracements? Fibonacci Retracements What are Fibonacci retracements? Levels at which the market is expected to retrace to after a strong trend. Based
Technical Analysis Module NATIONAL STOCK EXCHANGE OF INDIA LIMITED
 Technical Analysis Module NATIONAL STOCK EXCHANGE OF INDIA LIMITED Test Details: Sr. No. Name of Module * Candidates have the option to take the tests in English, Gujarati or Hindi languages. # Candidates
Action Forex Company Limited 2012
 1 TABLE OF CONTENTS TABLE OF CONTENTS... 2 INTRODUCTION... 3 CHAPTER 1 - USE OF CANDLESTICK CHARTS... 4 1.1 MORE BULLISH PATTERNS... 5 Piercing Line... 5 Three White Soldiers... 6 Rising Three Methods...
Learning and Remembering the Signals Fast and Easy
 Learning and Remembering the Signals Fast and Easy The Candlestick Forum E- Book Series For Teaching Investors High Probability Investment Methods Candlestick Forum LLC Copyrighted Information January
21 CANDLESTICKS EVERY TRADER SHOULD KNOW. Dr. Melvin Pasternak
 21 CANDLESTICKS EVERY TRADER SHOULD KNOW Dr. Melvin Pasternak Working Title: 21 Candlesticks Every Trader Should Know Author: Dr. Melvin Pasternak Publisher: Marketplace Books Release Date: January 2006
Keywords: Forecasting, S&P CNX NIFTY 50, Fuzzy-logic, Fuzzy rule-base, Candlesticks, Fuzzycandlesticks, Figure 1.2: White Candle
 American International Journal of Research in Science, Technology, Engineering & Mathematics Available online at http://www.iasir.net ISSN (Print): 2328-3491, ISSN (Online): 2328-3580, ISSN (CD-ROM): 2328-3629
Stochastic Oscillator.
 Stochastic Oscillator. By Jay Lakhani www.4x4u.net George Lane was the originator of the stochastic indicator in the 1960 s; the indicator tracks the market momentum. Lane observed that as prices rise
How To Use A Japanese Roenko Chart To Create A Trading Strategy
 TIPS. 10 SKYSCRAPER. Menara Carigali, Kuala Lumpur. The todays third tallest building in Malaysia on the scale of 267 metres high. 1/ 3 ALGORITHMIC TRADING WITH RENKO CHARTS. PART 1: How to define trend
Pattern Recognition and Prediction in Equity Market
 Pattern Recognition and Prediction in Equity Market Lang Lang, Kai Wang 1. Introduction In finance, technical analysis is a security analysis discipline used for forecasting the direction of prices through
How To Use TC2000 To Find The Best Candlestick Trades
 How To Use TC2000 To Find The Best Candlestick Trades The Inside Secrets of a Professional Investor Developed Over a 15-Year Time Period to Achieve At Least a 10% Return Per Month in Common Stocks A Candlestick
TRADING CFDS. Learn how to make money with trading
 Learn how to make money with trading Index Why trading? 2 The Basics 3 The Trend Strategy 7 Money Management 9 Closing Remarks 11 1 Why trading? Everyday financial products worth billions of dollars are
Sunday, September 15, 13. Trade E-mini Futures without Indicators
 Trade E-mini Futures without Indicators Keep It Simple Simple systems work better Simple is more robust What You Need To Know Logical market structure Entry patterns and rules Trade management Recording
Understanding the market
 Understanding the market Technical Analysis Approach: part I Xiaoguang Wang President, Purdue Quantitative Finance Club PhD Candidate, Department of Statistics Purdue University [email protected] Outline
Additional details >>> HERE <<<
 Additional details >>> HERE http://dbvir.com/forexmys/pdx/cc85/ Tags: karachi automated trading system :: df7p getting free reveal the
School of Pipsology. Copyright 2006 BabyPips.com LLC
 School of Pipsology Copyright 2006 BabyPips.com LLC If you wish to share this document with someone, please direct them to www.babypips.com/donate.html and ask them to donate and help support BabyPips.com
Fuzzy Candlestick Approach to Trade S&P CNX NIFTY 50 Index using Engulfing Patterns
 Fuzzy Candlestick Approach to Trade S&P CNX NIFTY 50 Index using Engulfing Patterns Partha Roy 1, Sanjay Sharma 2 and M. K. Kowar 3 1 Department of Computer Sc. & Engineering 2 Department of Applied Mathematics
FXAlTareeq.com (c) Copyright 2015 AMAL Enterprises LLC
 Copyright 2015 AMAL Enterprises LLC") The Big Shadow Trade FXAlTareeq.com (c) Copyright 2015 AMAL Enterprises LLC The Big Shadow is a two candlestick formation. Its name says it all. It is a candlestick that overshadows the previous candle.
The Big Shadow Trade FXAlTareeq.com (c) Copyright 2015 AMAL Enterprises LLC The Big Shadow is a two candlestick formation. Its name says it all. It is a candlestick that overshadows the previous candle.
INTRODUCTORY MANUAL. The 10 Keys to Successful Trading A Forex Tutorial
 INTRODUCTORY MANUAL The 10 Keys to Successful Trading A Forex Tutorial Authored By: Jared F. Martinez Visit Market Traders Institute s - Forex Home Study Courses (link) Legal Notices: The 10 Keys to Successful
Elliott-Wave Fibonacci Spread Trading
 Elliott-Wave Fibonacci Spread Trading Presented by Ryan Sanden The inevitable disclaimer: Nothing presented constitutes a recommendation to buy or sell any security. While the methods described are believed
FOREXOMETRY.COM. Presents. Forex Profit Hawk
 FOREXOMETRY.COM Presents Forex Profit Hawk Forexometry Published by Alaziac Trading CC Suite 509, Private Bag X503 Northway, 4065, KZN, ZA www.forexometry.com Copyright 2014 by Alaziac Trading CC, KZN,
Technical Analysis SAmple InveSTIng plans 1
 Technical Analysis Sample Investing Plans 1 Important Information All investing plans and rules are provided for informational purposes only, and should not be considered a recommendation of any security,
Advanced Trading Systems Collection FOREX TREND BREAK OUT SYSTEM
 FOREX TREND BREAK OUT SYSTEM 1 If you are a part time trader, this is one system that is for you. Imagine being able to take 20 minutes each day to trade. A little time at night to plan your trades and
Swing Trading Tactics
 Pristine.com Presents Swing Trading Tactics With Oliver L. Velez Founder of Pristine.com, and Author of the best selling book, Tools and Tactics for the Master Day Trader Copyright 2001, Pristine Capital
TECHNICAL ANALYSIS GLOSSARY
 TECHNICAL ANALYSIS GLOSSARY A ABC: Elliott Wave terminology for a three-wave countertrend price movement. Wave A is the first price wave against the trend of the market. Wave B is a corrective wave to
Building an Equity Portfolio using Mutual Funds. H. Gayathri Dean Administration & Professor-Marketing
 Building an Equity Portfolio using Mutual Funds Ashutosh Prasad Sharma PGDM Number: 11008 H. Gayathri Dean Administration & Professor-Marketing 2 3 Comments by the Faculty The present paper makes an attempt
START-UP MANUAL FOR MTI 4.0 TECHNICAL ANALYSIS CHARTING
 START-UP MANUAL FOR MTI 4.0 TECHNICAL ANALYSIS CHARTING Introduction Thank you for your subscription to the MTI 4.x Technical Analysis Charting Program, the only true Multiple Time Frame Analysis Platform.
Presents. The Trading Information Revealed Here is not the Same as the WizardTrader.com Methods -- But Together They Pack a Powerful Punch
 Presents Killer Patterns Now You Can Have These Trading Gems -- Free! The Trading Information Revealed Here is not the Same as the WizardTrader.com Methods -- But Together They Pack a Powerful Punch 1
Timing the Trade How to Buy Right before a Huge Price Advance
 Timing the Trade How to Buy Right before a Huge Price Advance By now you should have read my first two ebooks and learned about the life cycle of a market, stock, or ETF, and discovered the best indicators
2:... 12 14 NYSE 2 15 NYSE
 1 Contents Introduction:... 4 Philosophy:... 5 Trading strategies an overview:... 6 Introduction to direct access trading:... 8 The US stock markets:... 9 Bids and offers:... 10 NASDAQ and level 2:...
Technical analysis. Course 11
 Course 11 Technical analysis Topic 1: Introduction to technical analysis... 3 Topic 2: Chart types... 4 Line charts... 4 Bar chart... 4 Candle stick charts... 5 Topic 3: Trend analysis... 6 Defining an
Chapter 2.1. Charting Basics
 Chapter 2.1 Charting Basics 0 Contents CHARTING BASICS Charts are a forex trader s best friend. As a Forex trader, you will most likely utilize your price charts more than any other available tool. Since
This library is included for Platinum Club members, and may be purchased separately for the Gold version of Trade Navigator.
 Planetary 2 Library I C H I M O K U C L O U D L I B R A R Y Introduction: In 1969, Goichi Hosada, a journalist in Tokyo, developed a very versatile indicator that has withstood the test of time. The Ichimoku
The Use of Trend Lines and Charting Patterns in Trading the Forex Markets
 The Use of Trend Lines and Charting Patterns in Trading the Forex Markets The use of Trends and Trend Lines forms the basis of establishing the support and resistance levels and charting patterns that
Analyzing Gaps for Profitable Trading Strategies
 Analyzing Gaps for Profitable Trading Strategies By Julie R. Dahlquist, Ph.D., CMT and Richard J. Bauer, Jr., Ph.D., CFA, CMT Gaps have attracted the attention of market technicians since the earliest
Simple & Consistent Fibonacci Method Prepared by: Simone Guy. {Free learning resource: NOT FOR RESALE}
 Simple & Consistent Fibonacci Method Prepared by: Simone Guy {Free learning resource: NOT FOR RESALE} 3/13/2010 Overview This is a mechanical trading method that is based on Support and Resistance. The
www.60seconds2profit.com
 TABLE OF CONTENTS I. 60 Second Binary Options- Make 75% a Minute II. Binary Options Basics III. Why Trade Binary Options IV. What are 60 Second Binary Options V. How to Trade 60 Second Binary Options VI.
The Best-Kept Secret of Forex
 The Best-Kept Secret of Forex Many traders go through trading system after trading system, only to find that most of them don t work. The truth of the matter is that there are many effective trading systems
Technical Analysis. Chart Formations. Brought to you by: FX-ebooks.com. Forex ebooks Library
 Technical Analysis Chart Formations Brought to you by: FX-ebooks.com Forex ebooks Library 1 Forex Mentor by Peter Bain The new Leading Professional Currency Trading System shows you how to trade currencies
Getting Started with Recognia Intraday Trader
 Getting Started with Recognia Intraday Trader Copyright 2011 Recognia Page 1 www.recognia.com Table of Contents Introduction... 3 Selecting a Pre-defined Event Set-up... 4 Creating a Custom Event Set-up...
Candlestick Charting Explained
 Candlestick Charting Explained An Introduction To Candlesticks Brought to you by: FX-ebooks.com Forex ebooks Library 1 Forex Mentor by Peter Bain The new Leading Professional Currency Trading System shows
High Probability Trading Triggers for Gold & Silver
 Welcome to a CBOT Online Seminar High Probability Trading Triggers for Gold & Silver Presented by: John Person Sponsored by Interactive Brokers Live Presentation Starts at 3:30 PM Chicago Time NOTE: Futures
Swing Trading Tactics
 Pristine.com Presents Swing Trading Tactics With Oliver L. Velez Founder of Pristine.com, and Author of the best selling book, Tools and Tactics for the Master Day Trader Copyright 2001, Pristine Capital
Handbook of Technical Analysis For Phil s Stock World. By Pharmboy
 Handbook of Technical Analysis For Phil s Stock World By Pharmboy 1 Table of Contents Table of Contents 2 Table of Figures 4 Introduction 6 Understanding Market Cycles: The Art of Market Timing 7 Stages
A Primer On Technical Analysis. Written by. Available at
 A Primer On Technical Analysis Written by Available at Page 1 of 23 Overview Technical Analysis (Versus Fundamental Analysis) Technical analysis is a method of forecasting price movements by looking at
Heikin-Ashi-two-Bar-Strategy Guide to Strategic and Tactical Forex Trading Pull the Trigger and Hit your Targets
 Heikin-Ashi-two-Bar-Strategy Guide to Strategic and Tactical Forex Trading Pull the Trigger and Hit your Targets Currency: EUR/JPY, GBP/JPY Time frame: 5 min Indicators: BB 14, 2, ADX 14, SSD 5, 3, 3,
Chart Patterns Tutorial - Forex Trading, Currency Forecast, FX Trading Signal, Forex Training Course, E...
 Page 1 Chart Patterns Tutorial Technical Analysis Articles Written by TradingEducation.com Chart Patterns Tutorial Traders have debated the merits of "technical analysis" versus "fundamental analysis"
ELITECURRENSEA FREE RANGE BAR STRATEGY. www.elitecurrensea.com. Forex Range Bars Pro Scalping system. How to use it: ( MT4 build 600+)
") ELITECURRENSEA FREE RANGE BAR STRATEGY www.elitecurrensea.com Forex Range Bars Pro Scalping system How to use it: ( MT4 build 600+) 1.Put indicators in MQL4/indicators folder of your Mt4 2.Put the script
ELITECURRENSEA FREE RANGE BAR STRATEGY www.elitecurrensea.com Forex Range Bars Pro Scalping system How to use it: ( MT4 build 600+) 1.Put indicators in MQL4/indicators folder of your Mt4 2.Put the script
Disclaimer: The authors of the articles in this guide are simply offering their interpretation of the concepts. Information, charts or examples
 Disclaimer: The authors of the articles in this guide are simply offering their interpretation of the concepts. Information, charts or examples contained in this lesson are for illustration and educational
MATHEMATICAL TRADING INDICATORS
 MATHEMATICAL TRADING INDICATORS The mathematical trading methods provide an objective view of price activity. It helps you to build up a view on price direction and timing, reduce fear and avoid overtrading.
How To Understand The Seven S Framework Of Trading
 TINA LOGAN S SEVEN S FRAMEWORK - 1 Tina Logan s Seven S Framework A free e-book for Traders TINA LOGAN Trader s Roadmap Training and Coaching for Traders PO Box 2046, La Jolla, CA 92038 Phone: (858) 232-3879
Can Price Anomalies been Obtained by Using Candlestick. Patterns?
 Can Price Anomalies been Obtained by Using Candlestick Patterns? Tsung-Hsun Lu Post-Doctoral Fellow, Department of Economics, National Tsing Hua University, Taiwan No. 101, Section 2, Kuang-Fu Road, Hsinchu,
Guide to Trading Indices
 Guide to Trading Indices About Logic Investments Logic Investments was founded in 2009 to provide a relationship-based advisory investment service to clients who want a more traditional, reliable and personal
Chart Patterns Trader. Trader SUPPLEMENT. Understanding and Trading Classic Chart Patterns. By: Kevin Matras Zacks Investment Research, Inc
 Chart Patterns Trader Trader SUPPLEMENT Understanding and Trading Classic Chart Patterns By: Kevin Matras Zacks Investment Research, Inc Table of Contents Introduction.........................................................................
THE A-Z GUIDE TO E-MINI FUTURES TRADING
 THE A-Z GUIDE TO E-MINI FUTURES TRADING 1.800.800.3840 2 PAST PERFORMANCE IS NOT NECESSARILY INDICATIVE OF FUTURE PERFORMANCE. THE RISK OF LOSS IN TRADING FUTURES CONTRACTS OR COMMODITY OPTIONS CAN BE
Autochartist Intro Guide
 Autochartist Intro Guide CONTENT 1. 2. 3. 4. 5. 6. 7. 8. 9. 10. Getting Started with Autochartist Autochartist Pattern Results Column Headings Creating Custom Searches Trending Pattern Types Trending Pattern
Aggressive Day Trading Strategy for Forex
 Aggressive Day Trading Strategy for Forex By Markus Heitkoetter Please note: THE RISK OF LOSS IN TRADING COMMODITIES CAN BE SUBSTANTIAL. YOU SHOULD THEREFORE CAREFULLY CONSIDER WHETHER SUCH TRADING IS
均 衡 表 Ichimoku Kinkō Hyō
 均 衡 表 Ichimoku Kinkō Hyō Hello Forex Winners! On this book we will talk about Ichimoku Kinko Hyo indicator and will show many pictures to make it easy for you. Ichimoku Winners e-book is free on ForexWinners.Net
atching Currency Moves with The Schaff Trend Cycle Indicator
 JULY/AUGUST 2002. VOLUME 4 CRunning a trend indicator through a cycle oscillator creates an effective entry technique into today s strongly trending currency markets, says Doug Schaff, a 20-year veteran
Inductive Reasoning Free Sample Test 1
 Inductive Reasoning Free Sample Test 1 Solutions Booklet Difficulty Rating: Difficult Instructions This inductive reasoning test comprises 22 questions. You will have 25 minutes in which to correctly answer
Tessellations. Practice 1 Identifying Tessellations. In each tessellation, color the repeated shape. Example
 Name: Chapter Date: Practice 1 Identifying In each tessellation, color the repeated shape. Example 1. 2. 3. Lesson 14.1 Identifying 133 Is each pattern a tessellation of a single repeated shape? Write
Day Trade System EZ Trade FOREX
 Day Trade System The EZ Trade FOREX Day Trading System is mainly used with four different currency pairs; the EUR/USD, USD/CHF, GBP/USD and AUD/USD, but some trades are also taken on the USD/JPY. It uses
Profitable Candlestick Trading Pdf
 Profitable Trading Pdf Free PDF ebook Download: Profitable Trading Pdf Download or Read Online ebook profitable candlestick trading pdf in PDF Format From The Best User Guide Database correctly, the majority
DISCLAIMER. This guide may contain links to external websites. The publisher is not responsible for any content of those websites.
 DISCLAIMER Trading any financial market involves a high level of risk and may not be suitable for everyone. You should only trade with money you can afford to lose. You should fully understand the risks