Elliott-Wave Fibonacci Spread Trading
|
|
|
- Gordon McCormick
- 9 years ago
- Views:
Transcription
1 Elliott-Wave Fibonacci Spread Trading Presented by Ryan Sanden The inevitable disclaimer: Nothing presented constitutes a recommendation to buy or sell any security. While the methods described are believed to be effective in the long run, no guarantee of efficacy is being made. Trading involves risk. I will in no way be responsible for any decisions or trades made as a direct or indirect result of this material. Full understanding of all trading instruments and exchanges is the sole responsibility of the trader. Ryan owns positions in the following related securities discussed herein: SDS

2 Principles of Market Trends Markets move in trends. Movements with the trend are called impulses. Movements against the trend are called corrections. Trends eventually change. correction impulse correction impulse correction impulse Trend is UP 2

3 Principles of Market Trends Trends depend on their time frame. Green = uptrend Red = downtrend 6 Trends 3

4 Principles of Market Trends Trends depend on their time frame. Green = uptrend Red = downtrend 48 Trends 4

5 Principles of Market Trends Trends depend on their time frame. Green = uptrend Red = downtrend 1 Trend 5

6 Principles of Market Trends Trends depend on their time frame. Green = uptrend Red = downtrend Which is correct? They all are. Which you trade is up to you. Planning to trade one trend while acting on movements in another trend is called a trend relativity error. It is one of the most common trading mistakes. 6

7 Principles of Elliott Wave Theory Markets tend to advance in 5 waves, and retrace (correct) in 3 waves. 3 5 B 1 4 A C 2 Larger-degree uptrend (higher time frame trend is up) 7

8 Principles of Elliott Wave Theory Markets tend to advance in 5 waves, and retrace (correct) in 3 waves. 3 5 B 1 4 A C 2 Larger-degree uptrend (higher time frame trend is up) 8

9 Principles of Elliott Wave Theory Markets tend to advance in 5 waves, and retrace (correct) in 3 waves A C 3 5 B Larger-degree downtrend (higher time frame trend is down) 9

10 Principles of Elliott Wave Theory Markets tend to advance in 5 waves, and retrace (correct) in 3 waves A C 3 5 B Larger-degree downtrend (higher time frame trend is down) 10

11 A B C These structures repeat.. That is, they connect together: A B C A B C If I take away the colors and labels.. It really looks like the stock market. Yet, the underlying order is there if you know what to look for.

12 They don t just infinitely repeat. That would be too easy. Really, they combine to make higher degree waves. So, what looks like repetition is really just larger degree waves unfolding v 4 iii b i iv a 2 ii c 2 12

13 i ii iii iv v a b c 1 2 i ii iii iv v a b c 3 4 i ii iii iv v 5 A B C i ii iii iv v a b c i ii iii iv v A B C

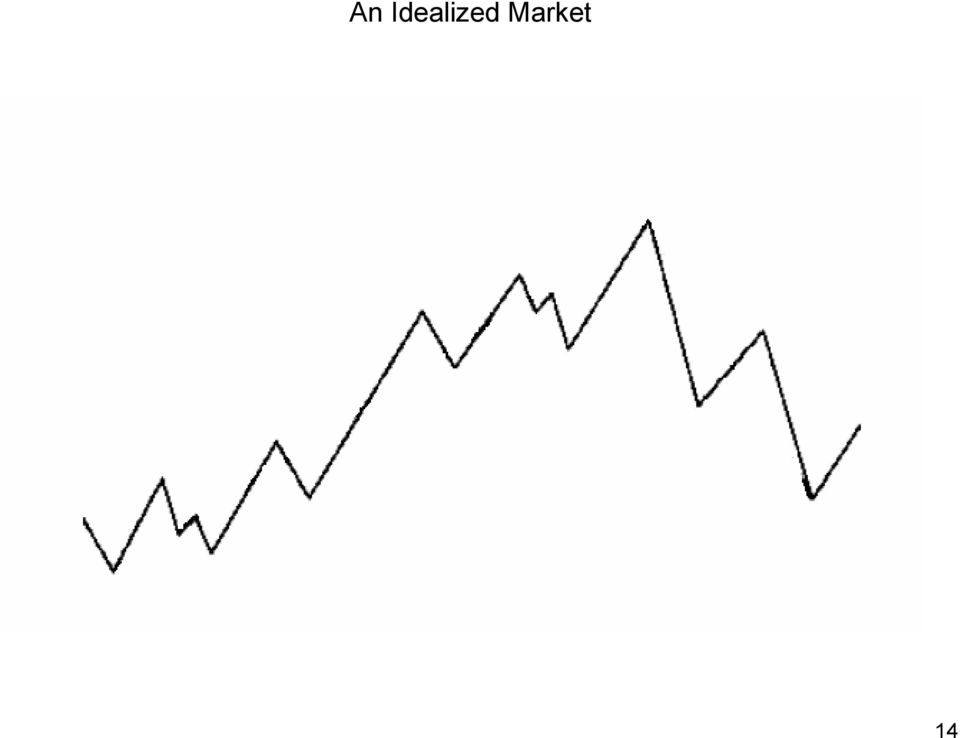
14 An Idealized Market 14
15 Major Degree Waves The Big Trend 15

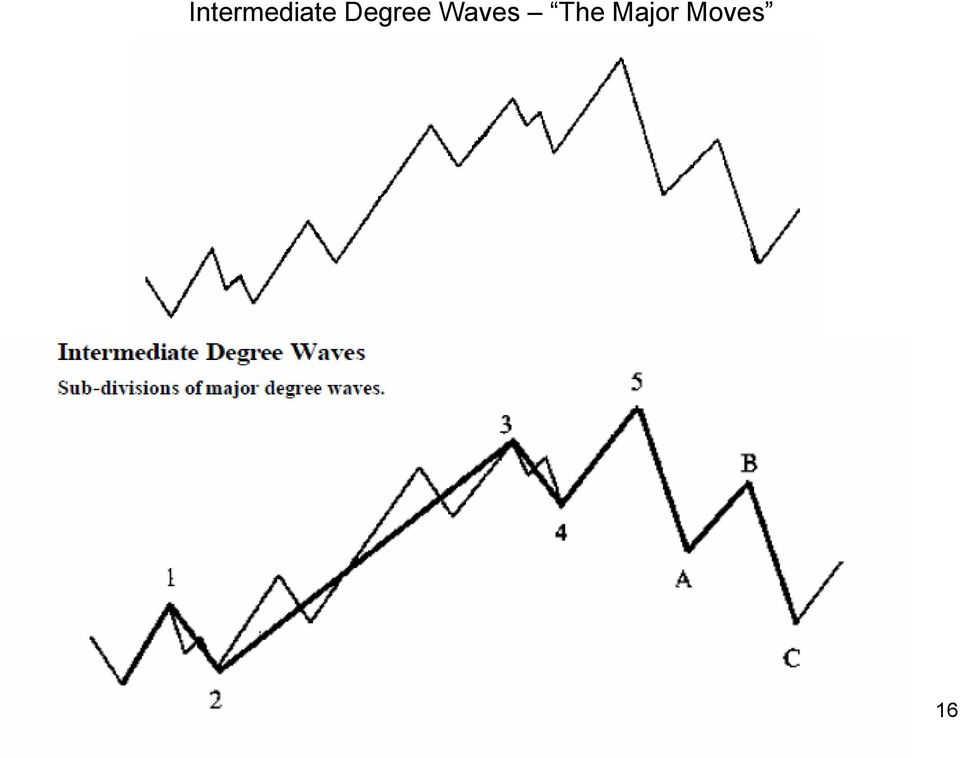
16 Intermediate Degree Waves The Major Moves 16
17 Minor Degree Waves The Daily Wiggles 17

18 Nested Waves. Elliott-Wave map of the market. 18

19 Nested Waves. Elliott-Wave map of the market. Intermediate B of Major 2 Intermediate 1 of Major 1 Minor 4 of Intermediate 3 of Major 1 Minor A of intermediate 2 of Major 1 19

20 S&P 500 Example: (Market Top) Daily Bars. September 2007 through January 2008 ii iv a 2 c ii i iii v 1 b i iii iv a 4 c b v 3 20

21 Q: That s Wonderful. How can I use this knowledge? A: The better we can predict where we are in the structure, the better we can predict the next move in the market. For example, let s pretend that the above chart is now. We can see enough to clearly identify the above wave count. We just finished a 2 of the of the green waves, and now we expect a 3 of the green waves. Therefore, we are bearish. This is true even though the casual observer looks at the chart and sees a bottom! 21
22 Q: How do we know when we re wrong? A: This is a very important question. When we don t have a firm opinion of the market anymore, we should exit the trade. This becomes a stop loss. The waves offer natural stop loss points!? (stop) So, we can draw the waves as best as we think. Then, if the market hits our stop loss, then we will wait until we have a new clear picture to trade. Sometimes we re wrong about the wave count. That s OK. We re right often enough to make this methodology worthwhile. 22
23 Fibonacci To make life easier, each wave has a target region for where it should end. We use Fibonacci relationships to plot these on the chart in advance. For example, Wave 2 target is 50%-78.6% of Wave 1: % retracement 61.8% retracement 50.0% retracement 1 23
24 Green Wave 1 down is finished. Currently in Green Wave 2 up. 24 This wave should end somewhere between $ and $ ($ is best.)
25 C A B Getting an ABC from here would be ideal 25
26 That would be a reversal. 26
27 Now, we have to project a likely extent for Wave 3: Wave 3 is generally to of Wave 1, projected from the end of Wave 2. This is technically named an alternate price projection % 161.8% 27
28 Although it s a little more tricky, we can project time the same way: Wave 3 is generally or so (in time) of Wave 1, projected from the end of Wave 2. This is technically named an alternate time projection
29 Combining these, we can get a general idea for price and time: % 161.8% 29
30 Looks like we re shooting for 123 to 133 sometime in the middle of January. 30
31 Price and Time Targets for Various Waves Note: There are others! I am just presenting basic ideas here. Wave Wave 1 Wave 2 Wave 3 Wave 4 Wave 5 Wave A Wave B Wave C Price Can t be projected. This wave is created by fundamentals and is how fundamentals drive the market. 50% to 78.6% of Wave 1 100% to 161.8% of Wave 1, projected from end of Wave % to 61.8% of Wave 3 100% of Wave 1, projected from end of Wave 4 Can t be projected. This wave is created by fundamentals and is how fundamentals drive the market. 50% to 78.6% of Wave A 61.8% to 161.8% of Wave A, projected from end of Wave B Time Can t be projected. This wave is created by fundamentals and is how fundamentals drive the market. Around 61.8% of Wave 1 Around 100% of Wave 1, projected from end of Wave 2 Around 61.8% of Wave 3 Around 100% of Wave 1, projected from end of Wave 4 Can t be projected. This wave is created by fundamentals and is how fundamentals drive the market. Around 61.8% of Wave A Around 100% of Wave A, 31 projected from end of Wave B
32 How it played out: 32
33 33
34 34
35 35
36 36
37 37
38 38
39 39
40 40
41 41
42 Review of Process (thus far) 1. Label Waves Determine Bullish or Bearish Determine Stop Loss 2. Perform Price and Time Projections Get an idea for approximately where and when we should expect trend reversal. 42
43 Entries Projected Resistance Reversal Day Close below today s open (red candle day) Close below yesterday s close (down day) Stronger signal if it made a new high as well. 43
44 Entries Projected Resistance Stop Risk Sell Short on Close 44
45 Entries Projected Resistance Stop Loss Stopped Out 45
46 Entries Projected Resistance 46
47 Entries Projected Resistance Reversal Day 47
48 Entries Projected Resistance Stop Risk Sell Short on Close 48
49 Entries Stop Risk on Principal Paper Profit 49
50 Entries Stop Loss :-( Credit crisis was actually a novice accounting mistake. Oops. 50
51 N-Day high or N-Day low. N is a number. Trailing Stops For example: 3-Day high 1-Day High 2-Day Low 3-Day High: Highest high of last 3 days prior to and including the extreme point, non-inclusive of inside days. Inside Day: A day whose range is inside the previous day s range. Extreme Point 51
52 N-Day high or N-Day low. N is a number. Trailing Stops For example: 3-Day high 1-Day High 2-Day Low 3-Day High: Highest high of last 3 days prior to and including the extreme point, non-inclusive of inside days. 1 Extreme Point 52
53 Trailing Stops N-Day high or N-Day low. N is a number. For example: 3-Day high 1-Day High 2-Day Low 3-Day High: Highest high of last 3 days prior to and including the extreme point, non-inclusive of inside days. 1 Extreme Point Inside Day. Its range is inside the previous day s range. 53
54 Trailing Stops N-Day high or N-Day low. N is a number. For example: 3-Day high 1-Day High 2-Day Low 3-Day High: Highest high of last 3 days prior to and including the extreme point, non-inclusive of inside days. 2 1 Extreme Point Inside Day. Its range is inside the previous day s range. 54
55 Trailing Stops N-Day high or N-Day low. N is a number. For example: 3-Day high 1-Day High 2-Day Low Day High: Highest high of last 3 days prior to and including the extreme point, non-inclusive of inside days. 1 Extreme Point Inside Day. Its range is inside the previous day s range. 55
56 N-Day high or N-Day low. N is a number. Trailing Stops For example: 3-Day high 1-Day High 2-Day Low 3-Day High: Highest high of last 3 days prior to and including the extreme point, non-inclusive of inside days. 3 3-Day High Extreme Point 56
57 Exits Stop Risk 57
58 Exits Stop Risk Nearest Minor Pivot 58
59 Exits Stop Risk Nearest Minor Pivot 59
60 Exits Stop Risk Nearest Minor Pivot exceeded 60
61 Exits Old Stop Profit New Stop (3-day High) Paper Profit Exceeded Pivot Move to Trailing Stop 61
62 Exits Trailing Stop (3-day High) Profit Paper Profit 62
63 Exits Profit :-/ 63
64 Exits Towards Price Target Projected Support Levels 64
65 Exits Towards Price Target Trailing Stop (3-day High) Projected Support Levels 65
66 Exits Towards Price Target Trailing Stop (3-day High) Projected Support Levels 66
67 Exits Towards Price Target 3-Day High 2-Day High Getting Close: Switch to 2-day high. Projected Support Levels 67
68 Exits Towards Price Target Region Hit: Switch to 1-day High Projected Support Levels 68
69 Exits Towards Price Target Region Hit: Switch to 1-day High Projected Support Levels 69
70 Exits Towards Price Target If this is a major collapse, we want to hang around for it. Therefore, we continue with the tight trailing stop instead of just taking profit immediately. Region Hit: Switch to 1-day High Projected Support Levels 70
71 Exits Towards Price Target Projected Support Levels Reversal Day- Close trade. Go long? 71
72 Trend-Continuation Entries Projected Resistance Levels Reversal Day But we missed it. Should have sold short, but I didn t see it. Still good profit potential left though. What now? Potential profit. However, risk is too large to enter now (stop loss too far away). Projected Support Levels 72
73 Trend-Continuation Entries Inside Day Trend-Continuation Entry Stop loss goes here Sell Short if price exceeds this Inside day. This day s range is inside the previous day s range. 73
74 Trend-Continuation Entries Outside Day Trend-Continuation Entry Stop loss goes here Sell Short if price exceeds this Outside day. This day s range is outside the previous day s range. 74
75 Trend-Continuation Entries Projected Resistance Levels Reversal Day that we missed Projected Support Levels 75
76 Trend-Continuation Entries Projected Resistance Levels Reversal Day that we missed Projected Support Levels 76
77 Trend-Continuation Entries Projected Resistance Levels Outside Day Reversal Day that we missed Projected Support Levels 77
78 Trend-Continuation Entries Projected Resistance Levels Stop loss will go here Enter if we go below this Projected Support Levels 78
79 Trend-Continuation Entries Projected Resistance Levels Stop loss will go here Enter if we go below this Projected Support Levels 79
80 Trend-Continuation Entries Projected Resistance Levels Stop loss will go here Enter if we go below this Projected Support Levels 80
81 Trend-Continuation Entries Projected Resistance Levels Stop Entered here Projected Support Levels 81
82 Trend-Continuation Entries Projected Resistance Levels Stop Projected Support Levels 82
83 Trend-Continuation Entries Projected Resistance Levels Stop Projected Support Levels 83
84 Trend-Continuation Entries Projected Resistance Levels Stopped Out Figures. Projected Support Levels 84
85 Trend-Continuation Entries Projected Resistance Levels Projected Support Levels 85
86 Trend-Continuation Entries Projected Resistance Levels Projected Support Levels 86
87 Trend-Continuation Entries Projected Resistance Levels Inside Day Projected Support Levels 87
88 Trend-Continuation Entries Projected Resistance Levels Stop loss will go here Enter if we go below this Projected Support Levels 88
89 Trend-Continuation Entries Projected Resistance Levels Stop loss will go here Enter if we go below this Projected Support Levels 89
90 Trend-Continuation Entries Projected Resistance Levels Stop loss will go here Enter if we go below this Another Inside Day! Projected Support Levels 90
91 Trend-Continuation Entries Projected Resistance Levels Stop loss will go here Enter if we go below this Projected Support Levels 91
92 Trend-Continuation Entries Projected Resistance Levels Stop loss will go here Enter if we go below this Entered at the open Projected Support Levels 92
93 Trend-Continuation Entries Projected Resistance Levels Stop Projected Support Levels 93
94 Trend-Continuation Entries Projected Resistance Levels Stop Projected Support Levels 94
95 Trend-Continuation Entries Projected Resistance Levels Stop Projected Support Levels 95
96 Trend-Continuation Entries Projected Resistance Levels Stop Projected Support Levels 96
97 Trend-Continuation Entries Projected Resistance Levels New Stop 3-day High Projected Support Levels 97
98 Trend-Continuation Entries Projected Resistance Levels New Stop 3-day High Projected Support Levels 98
99 Trend-Continuation Entries Projected Resistance Levels New Stop 3-day High Projected Support Levels 99
100 Trend-Continuation Entries Projected Resistance Levels New Stop 3-day High Projected Support Levels 100
101 Trend-Continuation Entries Projected Resistance Levels New Stop 3-day High Projected Support Levels 101
102 Trend-Continuation Entries Projected Resistance Levels Getting Close: 2-day high Projected Support Levels 102
103 Trend-Continuation Entries Projected Resistance Levels Reversal Day- Exit Projected Support Levels 103
104 Trend-Continuation Entries Projected Resistance Levels McDonalds files Chapter 11 on credit losses. Projected Support Levels 104
105 Bear Market S&P 500 Activity We will now go through a step-by step walkthrough of the entire Bear Market, from the beginning. It will begin very detailed, but eventually just show the method is working. 105
106 106
107 107
108 108
109 109
110 110
111 111
112 112
113 113
114 114
115 115
116 116
117 117
118 118
119 Note: I am deliberately counting this section differently from at the beginning of this presentation. And it still works! This shows the versatility of these techniques. 119
120 Note: I am deliberately counting this section differently from at the beginning of this presentation. And it still works! This shows the versatility of these techniques. 120
121 121
122 122
123 123
124 124
125 125
126 126
127 127
128 128
129 129
130 130
131 131
132 132
133 133
134 134
135 135
136 136
137 137
138 138
139 139
140 140
141 141
142 142
143 143
144 144
145 145
146 146
147 147
148 148
149 149
150 150
151 151
152 152
153 153
154 154
155 155
156 156
157 157
158 Choosing the Spread Here s our example from before. We said we are expecting approximately $123 to $133 sometime in the middle of January. Always target the worst-case scenario: Assume the stock goes to $133. We therefore want a bear put spread with the short put at $133. For long put, choose an ITM option with strike above stop loss. The more ITM, the better.
159 Choosing the Spread So, we have established a bear put position: $ (Dec 11, 2007). $150 Long Put: Jan 2008 $160 Short Put: Jan 2008 $133 At VIX = 30, the following are the most likely prices: Long Put: $16.37 Short Put: $1.44 If we hit stop at expiration (worst-case scenario): Long Put: $10.00 Short Put: $0.00 Put Spread: $14.93 Put Spread: $10.00 (Spread is better when extrinsic value in short option is greater than extrinsic value in long option) If we hit profit target tomorrow (again, not as good as if it happens next month): Long Put: $27.15 Short Put: $5.13 Put Spread: $
160 Choosing the Spread If we hit profit target at expiration: Long Put: $27.00 Short Put: $0.00 Put Spread: $27.00 So, if we are right, spread will be worth between $22.02 and $27.00, which, considering the original spread cost was $14.93, represents profits of 47% and 81%. If wrong, spread will be worth $10 and will represent a loss of 33%. If we hit stop tomorrow (not as bad): Long Put: $12.26 Short Put: $0.70 Put Spread: $11.56 (loss of 23%) 160
161 Risk Management If we risk our whole account every time, eventually we ll be wrong three times in a row and lose 50% three times (thus losing 87.5% of the account). That s not good. We solve this by only risking 3% of our account on any trade. We said the risk in the spread was 33%. To position size, simply divide 3% by 33%: 0.03 / 0.33 = 9.1% Therefore, we can buy 9.1% of the account on this option spread. The rest should be held in cash. On a $100,000 account, we buy $9100 of this spread. Since the original spread price was $14.93, we buy a 6-contract spread. If we are right, we should get a return between 47% to 81%. We ll say 65% for sake of argument. 65% return on 9.1% of your account is 5.9%. For intermediate-term investing, you will trade a spread around 10 times per year. (Wrong 10 times: -26%). 161
162 Dynamic Trading, by Robert Miner Special Thanks To: Little of anything presented today is original. I now credit my primary source And direct you to this book for more detailed instruction if you are still interested. 162
163 163
164 5 2 C A B A C 3 5 B 164
Retracement Or Reversal. Kennsei Trading, Inc. Chief Trader Dinger [email protected] www.hotstocksforincome.com
 Retracement Or Reversal Kennsei Trading, Inc. Chief Trader Dinger [email protected] www.hotstocksforincome.com Retracement Or Reversal Most of us have wondered, at some point, whether a decline
Advanced Trading Systems Collection FOREX TREND BREAK OUT SYSTEM
 FOREX TREND BREAK OUT SYSTEM 1 If you are a part time trader, this is one system that is for you. Imagine being able to take 20 minutes each day to trade. A little time at night to plan your trades and
Sunil Mangwani www.fibforex123.com
 The 123 chart pattern. The 123 pattern is a reversal chart pattern which occurs very frequently and has a very high success ratio. 123 s occur at the end of trends and swings, and they are an indication
Class 2: Buying Stock & Intro to Charting. Buying Stock
 Class 2: Buying Stock & Intro to Charting Today s Class Buying Stock Intro to Charting Real World Analysis Buying Stock What Is a Stock? Share of ownership in a company Publicly traded Holds monetary value
Swing Trading Tactics
 Pristine.com Presents Swing Trading Tactics With Oliver L. Velez Founder of Pristine.com, and Author of the best selling book, Tools and Tactics for the Master Day Trader Copyright 2001, Pristine Capital
Presents. The Trading Information Revealed Here is not the Same as the WizardTrader.com Methods -- But Together They Pack a Powerful Punch
 Presents Killer Patterns Now You Can Have These Trading Gems -- Free! The Trading Information Revealed Here is not the Same as the WizardTrader.com Methods -- But Together They Pack a Powerful Punch 1
What You Don t Know About Candlesticks
 Researching candlesticks yields some surprises. In When Candles Work Best What You Don t Know About Candlesticks by Thomas N. Bulkowski writing my latest book, Encyclopedia Of Candlestick Charts, I made
TOMORROW'S TRADING TECHNOLOGY. 100% automated Fibonacci support and resistance levels that you can count on every single trading day in an instant.
 TOMORROW'S TRADING TECHNOLOGY 100% automated Fibonacci support and resistance levels that you can count on every single trading day in an instant. ProTrader Table of Contents 1. Areas A. Fibonacci Confluence
CHART TRADING GUIDE 1
 CHART TRADING GUIDE 1 How to understand chart trading This guide is designed to teach you the basics of chart trading- the chart patterns that are covered in this booklet can be used for short and medium
Heikin-Ashi-two-Bar-Strategy Guide to Strategic and Tactical Forex Trading Pull the Trigger and Hit your Targets
 Heikin-Ashi-two-Bar-Strategy Guide to Strategic and Tactical Forex Trading Pull the Trigger and Hit your Targets Currency: EUR/JPY, GBP/JPY Time frame: 5 min Indicators: BB 14, 2, ADX 14, SSD 5, 3, 3,
Simple & Consistent Fibonacci Method Prepared by: Simone Guy. {Free learning resource: NOT FOR RESALE}
 Simple & Consistent Fibonacci Method Prepared by: Simone Guy {Free learning resource: NOT FOR RESALE} 3/13/2010 Overview This is a mechanical trading method that is based on Support and Resistance. The
Stochastic Oscillator.
 Stochastic Oscillator. By Jay Lakhani www.4x4u.net George Lane was the originator of the stochastic indicator in the 1960 s; the indicator tracks the market momentum. Lane observed that as prices rise
The Best-Kept Secret of Forex
 The Best-Kept Secret of Forex Many traders go through trading system after trading system, only to find that most of them don t work. The truth of the matter is that there are many effective trading systems
The First Touch Trade
 The First Touch Trade The first touch trade is a trade I use after a very strong move. The First Touch has five important components, each of these components should be in place for a valid First Touch
New Trendlens Indicators & Functions
 New Trendlens Indicators & Functions There are 83 new indicators and functions available in TrendLens. Formation Functions Highest Value The Highest Value formation function looks back bar count number
The Moving Average. 2004 W. R. Booker II. All rights reserved forever and ever. And ever.
 The Moving Average By Rob Booker 2004 W. R. Booker II. All rights reserved forever and ever. And ever. The information contained in this ebook is designed to teach you methods of watching forex quotes
www.forexrobottrader.com
 The Steinitz Fractal Breakout Indicator (SFBI) was developed by Don Steinitz through rigorous research since 2003. Its unique properties make it far more advanced than any other indicator available on
Golden Penny Stock Millionaires Golden Market Secrets For Trading Penny Stocks:
 Golden Penny Stock Millionaires Golden Market Secrets For Trading Penny Stocks: Introduction: Greetings; Hey, I m William Bell, stock analyst with the Golden Penny Stock Millionaires Financial Trading
Disclaimer: The authors of the articles in this guide are simply offering their interpretation of the concepts. Information, charts or examples
 Disclaimer: The authors of the articles in this guide are simply offering their interpretation of the concepts. Information, charts or examples contained in this lesson are for illustration and educational
Alerts & Filters in Power E*TRADE Pro Strategy Scanner
 Alerts & Filters in Power E*TRADE Pro Strategy Scanner Power E*TRADE Pro Strategy Scanner provides real-time technical screening and backtesting based on predefined and custom strategies. With custom strategies,
CHART PATTERNS. www.tff-onlinetrading.com
 CHART PATTERNS Technical analysis, as you have seen in our Trading Academy videos so far, is not just about charts. It does, however, rely heavily on them and often uses chart patterns to assist in making
Chapter 2.3. Technical Analysis: Technical Indicators
 Chapter 2.3 Technical Analysis: Technical Indicators 0 TECHNICAL ANALYSIS: TECHNICAL INDICATORS Charts always have a story to tell. However, from time to time those charts may be speaking a language you
Trading Lessons from the Intraday Frame (study)
") 1 Daily "Idealized Trades" Report Trading Lessons from the Intraday Frame (study) 1 2 SPY's 1-min Power Trend Chart (Additional Trades) 2 3 Lessons to Learn from Today's Trading Day Let's start as usual
1 Daily "Idealized Trades" Report Trading Lessons from the Intraday Frame (study) 1 2 SPY's 1-min Power Trend Chart (Additional Trades) 2 3 Lessons to Learn from Today's Trading Day Let's start as usual
Candlesticks For Support And Resistance
 NOVICE TRADER Candlesticks For Support And Resistance Even as you read this, the candlestick charting technique, with its origins in Japan, is being absorbed into the ways of Western technical analysis.
Swing Trading Tactics
 Pristine.com Presents Swing Trading Tactics With Oliver L. Velez Founder of Pristine.com, and Author of the best selling book, Tools and Tactics for the Master Day Trader Copyright 2001, Pristine Capital
FOREXOMETRY.COM. Presents. Forex Profit Hawk
 FOREXOMETRY.COM Presents Forex Profit Hawk Forexometry Published by Alaziac Trading CC Suite 509, Private Bag X503 Northway, 4065, KZN, ZA www.forexometry.com Copyright 2014 by Alaziac Trading CC, KZN,
How to see the market context using CCI Written by Buzz
 How to see the market context using CCI Written by Buzz Towards the end of September 2003, I decided to stop trading the S&P e-mini for a while and focus on the Russell 2000 e-mini. The swings seemed to
Introduction to Options -- The Basics
 Introduction to Options -- The Basics Dec. 8 th, 2015 Fidelity Brokerage Services, Member NYSE, SIPC, 900 Salem Street, Smithfield, RI 02917. 2015 FMR LLC. All rights reserved. 744692.1.0 Disclosures Options
Timing the Trade How to Buy Right before a Huge Price Advance
 Timing the Trade How to Buy Right before a Huge Price Advance By now you should have read my first two ebooks and learned about the life cycle of a market, stock, or ETF, and discovered the best indicators
TRADING AND ANALYTICS GUIDE
 Objective information. Sytematic approach TRADING AND ANALYTICS GUIDE February 9, 2016 Part I TRADING AND ANALYTICS GUIDE Overview Page 1 GeckoiCapital Analytics (GiCA) is a research and analysis division
Understanding Options: Calls and Puts
 2 Understanding Options: Calls and Puts Important: in their simplest forms, options trades sound like, and are, very high risk investments. If reading about options makes you think they are too risky for
8 Day Intensive Course Lesson 3
 8 Day Intensive Course Lesson 3 A) What are Fibonacci Retracements? Fibonacci Retracements What are Fibonacci retracements? Levels at which the market is expected to retrace to after a strong trend. Based
CHAPTER 8. REVERSAL TRADING STRATEGIES
 CHAPTER 8. REVERSAL TRADING STRATEGIES Today you will Learn Reversal trading strategies are great or mid-day and afternoon trades, especially on days when momentum is a big slower. Why Is This Important?
Trading Intra-Day is All About Finding an Edge (May 2008)
") Trading Intra-Day is All About Finding an Edge (May 2008) Trading intra-day is exactly what it sounds like. It s sitting in front of a computer during the trading day and making a lot of trades for small
Trading Intra-Day is All About Finding an Edge (May 2008) Trading intra-day is exactly what it sounds like. It s sitting in front of a computer during the trading day and making a lot of trades for small
www.tradingeducators.com
 The following is provided by www.tradingeducators.com Trading Educators, Inc. 1814 Carriage Club Dr Cedar Park, TX 78613 USA Phone: 800-476-7796 or 512-249-6930 Fax: 512-249-6931 Email: [email protected]
Forex Success Formula
 Forex Success Formula WWW.ForexSuccessFormula.COM Complimentary Report!! Copyright Protected www.forexsuccessformula.com - 1 - Limits of liability/disclaimer of Warranty The author and publishers of this
Understanding the market
 Understanding the market Technical Analysis Approach: part I Xiaoguang Wang President, Purdue Quantitative Finance Club PhD Candidate, Department of Statistics Purdue University [email protected] Outline
marketsurvival.net guide: The advanced guide to fibonacci trading How to trade stocks and Forex with Fibonacci numbers
 marketsurvival.net guide: The advanced guide to fibonacci trading How to trade stocks and Forex with Fibonacci numbers Contents FOREWORD... 5 PART 1. INTRODUCTION...7 WHY IS USING THE FIBONACCI TOOLS BETTER
I Really Trade. Trading Patterns for Stocks & Commodities. Introducing The False Break Buy and Sell Pattern
 2008 Trading Patterns for Stocks & Commodities It doesn t matter if you are a longterm investor, short swing trader or day trader, you are always looking for an advantageous spot to enter your position.
Ed Heath s Guerilla Swing Trading Plan (as of 1/22/13)
") Ed Heath s Guerilla Swing Trading Plan (as of 1/22/13) Synopsis: I call my trading style Guerilla Swing Trading. I trade upward momentum stocks that have pulled back for a buying opportunity and my goal
Ed Heath s Guerilla Swing Trading Plan (as of 1/22/13) Synopsis: I call my trading style Guerilla Swing Trading. I trade upward momentum stocks that have pulled back for a buying opportunity and my goal
Technical Analysis Fibonacci Levels
 Technical Analysis Fibonacci Levels Retracements A retracement is a pullback within the context of a trend. Dip After a rise from 0 to 1, short term market participants start to take profit. This drives
Binary Options Trading Strategy. Professional Binary Trading Manual Strategy
 Binary Options Trading Strategy Professional Binary Trading Manual Strategy U.S. Government Required Disclaimer - Commodity Futures Trading Commission Futures and Options trading has large potential rewards,
Elliott Wave Ultimate Q & A
 Elliott Wave Ultimate Q & A Disclaimer Stocks, Options, Forex and Futures trading has large potential rewards, but also large potential risk. You must be aware of the risks and be willing to accept them
27PercentWeekly. By Ryan Jones. Part II in the Series Start Small and Retire Early Trading Weekly Options
 By Ryan Jones Part II in the Series Start Small and Retire Early Trading Weekly Options Important My 27% Option Strategy is one of the best option trading opportunities you will come across. When you see
My Favorite Futures Setups. By John F. Carter www.tradethemarkets.com
 My Favorite Futures Setups By John F. Carter www.tradethemarkets.com Recognizing Momentum Incredibly easy to do in hindsight. Get in Before the Move? I m a big believer in not chasing markets. By the time
Chapter 6 - Rahul Mohindar Oscillator System
 Chapter 6 - Rahul Mohindar Oscillator System The Rahul Mohindar Oscillator and its associated tools and indicators were developed by Mr. Rahul Mohindar of VIRATECH (viratechindia.com). In addition to being
Guidelines to use with Fibonacciqueen trade setups!!!
 Guidelines to use with Fibonacciqueen trade setups!!! Updated January 2014 As far as the price analysis that I run every day in the markets, there are three different types of Fibonacci price relationships
An Objective Leading Indicator Fibonacci Retracements
 An Objective Leading Indicator Fibonacci Retracements This article explains how to use Fibonacci as a leading indicator, combining it with other technical analysis tools to provide precise, objective entry
atching Currency Moves with The Schaff Trend Cycle Indicator
 JULY/AUGUST 2002. VOLUME 4 CRunning a trend indicator through a cycle oscillator creates an effective entry technique into today s strongly trending currency markets, says Doug Schaff, a 20-year veteran
Chapter 1.4 Trends 0
 Chapter 1.4 Trends 0 TECHNICAL ANALYSIS: TRENDS, SUPPORT AND RESISTANCE Charts, charts, charts. When most people think about trading Forex, they think about watching price movements flash by them on the
FOREX analysing made easy
 FOREX analysing made easy UNDERSTANDING TECHNICAL ANALYSIS An educational tool by Blackwell Global Contents Technical Analysis 2 Line Chart 3 Bar Chart 4 Candlestick Chart 5 Support and Resistance 6 Fibonacci
CONTENT 1. 2. 5-8 9 5. 6. 7.
 User Manual TM CONTENT 1. 2. 3. 4. 5. 6. 7. 8. 9. Introduction The Autochartist Interface Analysis Toolbar (A) Pattern Display (B) Search Pane (C) Results Pane (Completed Patterns) (D) Results Pane (Emerging
MATHEMATICAL TRADING INDICATORS
 MATHEMATICAL TRADING INDICATORS The mathematical trading methods provide an objective view of price activity. It helps you to build up a view on price direction and timing, reduce fear and avoid overtrading.
Determining Option Price. Target Price, Strike Price, Option Premium!
 Determining Option Price Target Price, Strike Price, Option Premium! Decide on Strategy Direction, magnitude, risk! Up! Buy Calls! or! Sell Puts! or! Combo! Direction! Down! Buy Puts! or! Sell Calls! or!
Elliott Wave Theory. Quick Start Guide. Traders Day Trading.com
 Elliott Wave Theory Learning about the Stock Market for Beginners & How to Start Day Trading - Successfully! Page 2 Preface This ebook is an original publication from TradersDayTrading.com A trader s guide
5min Forex Trade Strategy Imran Sait Version 1.2 updated on 16 th Nov 2007
 5min Forex Trade Strategy Imran Sait Version 1.2 updated on 16 th Nov 2007 ( Works on All Time Frames and for all Pairs - Best used on 5Min/15min/ for short term Trades and 30min/1Hr/4hr/daily for Long
www.60seconds2profit.com
 TABLE OF CONTENTS I. 60 Second Binary Options- Make 75% a Minute II. Binary Options Basics III. Why Trade Binary Options IV. What are 60 Second Binary Options V. How to Trade 60 Second Binary Options VI.
Mastering the Markets
 www.mastermindtraders.com Presents Mastering the Markets Your Path to Financial Freedom DISCLAIMER Neither MasterMind Traders or any of its personnel are registered broker-dealers or investment advisors.
Exit Strategies & Stop Loss Techniques
 Exit Strategies & Stop Loss Techniques Forex exit strategies are a very important part of Forex trading systems. In fact, it could be said, that out of all the components of a trading system, it is the
CURRENCY TRADING Using Swing Breakouts in Forex Trading
 CURRENCY TRADING Using Swing Breakouts in Forex Trading 28 MAY 2009 Doug Schaff discusses the use of intermediate swing highs and swing lows to develop a shortterm approach to trading the currency markets.
Let s Get to Know Spread Bets
 Let s Get to Know Spread Bets Spread betting is pretty cool. Here are three reasons why. Even if you ve never traded before, you probably know how the financial market works buy in and hope it goes up.
How to Collect a 162% Cash on Cash Return
 How to Collect a 162% Cash on Cash Return Today we are going to explore one of the most profitable, low-risk income strategies I ve come across in my 27 years of trading. This income strategy produced
Escalator to Pips Pipping Your Way to The Top
 Pipping Your Way to the Top Page 1 of 1 Escalator to Pips Pipping Your Way to The Top Presented April 4, 2007 To the reader s of Forex Factory May all your trades be successful ones DISCLAIMER: We accept
Nexgen Software Services
 Nexgen Software Services Trading Guide June 2016 2016 Nexgen Software Services Inc. Please read and understand the following disclaimers before proceeding: Futures, FX and SECURITIES and or options trading
Day Trade System EZ Trade FOREX
 Day Trade System The EZ Trade FOREX Day Trading System is mainly used with four different currency pairs; the EUR/USD, USD/CHF, GBP/USD and AUD/USD, but some trades are also taken on the USD/JPY. It uses
LET S GET TO KNOW FOREX
 LET S GET TO KNOW FOREX Introduction Whether you re a power trader or a financial newbie, you re likely to hear just about anything market movements, outlooks and stocks being described as bullish or bearish.
Advanced Trading Systems Collection 5 MINUTE SCALPING SYSTEM
 5 MINUTE SCALPING SYSTEM 1 This is a fairly simple method to squeeze money out of the market with short terms trades. With this one we trade the five minute charts, and we rarely hold a trade for longer
Trading Power Trends with ADX
 Trading Power Trends with ADX By Dr. Charles B. Schaap, Jr. International Trader s Expo New York City 18 February 2014 Disclaimer The information in this lecture is for educational purposes. No particular
Trading Medium-Term Divergences
 TRADING SYSTEMS Spotting Trend Reversals Trading Medium-Term Divergences Detect medium-term divergences by using the zero-lagging exponential moving average, support and resistance lines, and trendlines.
Building a Stock Trading Portfolio Wednesday, September 3 rd, 2014s
 Building a Stock Trading Portfolio Wednesday, September 3 rd, 2014s Jeff M. Roth Co-founder, SimplerStocks.com 1 Table of Contents Intro (1 min) Picking the right stocks for your portfolio (5 mins) Trading
Forex Success Formula. Presents. Secure Your Money. www.forexsuccessformula.com - 1 -
 Forex Success Formula Presents Secure Your Money www.forexsuccessformula.com - 1 - Risk Disclosure Statement The contents of this e-book are for informational purposes only. No Part of this publication
A Quick Tutorial in MACD: Basic Concepts. By Gerald Appel and Marvin Appel
 A Quick Tutorial in MACD: Basic Concepts By Gerald Appel and Marvin Appel The Moving Average Convergence-Divergence Indicator (MACD) has been a staple of technical analysis since Gerald invented it more
The Logic Of Pivot Trading
 Stocks & Commodities V. 6: (46-50): The Logic Of Pivot Trading by Jim White This methodology takes advantage of the short-term trends in the market and applies a pivot trading technique to earn superior
Trend Analysis From Fibonacci to Gann Ichimoku versus MACD Proprietary Signals
 Trend Analysis From Fibonacci to Gann Ichimoku versus MACD Proprietary Signals Cornelius Luca Luca Global Research Banco Best Lisbon 2010 From Fibonacci to Gann Who is Fibonacci? Leonardo of Pisa (1170s
Understanding the market with PVSRA
 Understanding the market with PVSRA PVSRA PVSRA stands for Price, Volume, Support, Resistance Analysis. Price includes consideration of individual candlestick configurations as well as the pattern, or
Technical analysis. Course 11
 Course 11 Technical analysis Topic 1: Introduction to technical analysis... 3 Topic 2: Chart types... 4 Line charts... 4 Bar chart... 4 Candle stick charts... 5 Topic 3: Trend analysis... 6 Defining an
ADX breakout scanning ADX breakouts can signal momentum setups as well as exit conditions for intraday and swing traders. FIGURE 1: AFTER ADX > 40
 TRADING STRATEGIES ADX breakout scanning ADX breakouts can signal momentum setups as well as exit conditions for intraday and swing traders. BY KEN CALHOUN FIGURE 1: AFTER ADX > 40 Spotting volatility
GMMA 2.0 User Guide. August 2010 Edition PF-30-01-02
 GMMA 2.0 User Guide GMMA 2.0 User Guide August 2010 Edition PF-30-01-02 Support Worldwide Technical Support and Product Information www.nirvanasystems.com Nirvana Systems Corporate Headquarters 7000 N.
[email protected]
 [email protected] 3 Part Now That I Am Bored in Retirement Series Part 1 Basics designed for those new to HGSI or those wanting a refresher of our unique indicator set Part 2 Putting the Tools
How To Know When A Market Is In A Strong Trending Phase
 The 3 Rules of Successful Swing Trading Trade with the Wind at Your Back The Rule That Hits Home Runs & Be In the Right Place at the Right Time by Michele Mish Schneider, Director of Trading Research &
Options Probability Calculator Trading Guide
 Options Probability Calculator Trading Guide Precision and Profits via Probability First Edition By Craig Severson Options Probability Calculator Trading Guide Precision and Profits via Probability By
Pin bars: advanced material
 Pin bars: advanced material Lincoln (a.k.a. lwoo034 at Forexfactory.com forums) This tutorial focuses on more advanced pin bar setups. It should only be read after the introductory tutorial as it continues
Chapter 18 STAYING WITH A TREND
 Chapter 18 STAYING WITH A TREND While we are on the subject of the possibility of a day trader holding overnight, let s also see a way to stay with the trend allowing price volatility to dictate an exit
Gundlach The Scariest Indicator in the World
 Gundlach The Scariest Indicator in the World November 19, 2015 by Robert Huebscher Those Federal Reserve governors who intend to vote for an increase in rates at their December meeting need to take a close
Building the Forex Traders Foundation. Greg Michalowski Email: [email protected] www.livestream.com/fxdd Twitter: gregmikefx
 Building the Forex Traders Foundation Greg Michalowski Email: [email protected] www.livestream.com/fxdd Twitter: gregmikefx Disclaimer Disclaimer High Risk Warning: All news, opinions, research, data, or other
Technical Analysis Workshop Series Session Seven Fibonacci Trading Part 1
 Technical Analysis Workshop Series Session Seven Fibonacci Trading Part 1 DISCLOSURES & DISCLAIMERS This research material has been prepared by NUS Invest. NUS Invest specifically prohibits the redistribution
Forex Success Formula Presents Forex Success Mini Forex Success Formula Presents Forex Success Mini
 Forex Success Formula Presents Forex Success Mini - 1 www.forexsuccessformula.com/forextradingblog Risk Disclosure Statement The contents of this e-book are for informational purposes only. No Part of
The Use of Trend Lines and Charting Patterns in Trading the Forex Markets
 The Use of Trend Lines and Charting Patterns in Trading the Forex Markets The use of Trends and Trend Lines forms the basis of establishing the support and resistance levels and charting patterns that
12 Signals to Master any Market'
 12 Signals to Master any Market' Master these Major Candlestick Signals if you want to Master the Market. Copyright Stephen W. Bigalow 2007 May not be duplicated or distributed Published by The Candlestick
Arbitrage spreads. Arbitrage spreads refer to standard option strategies like vanilla spreads to
 Arbitrage spreads Arbitrage spreads refer to standard option strategies like vanilla spreads to lock up some arbitrage in case of mispricing of options. Although arbitrage used to exist in the early days
Advanced Options Strategy Blueprint
 Advanced Options Strategy Blueprint Disclaimer Certus Trading Inc. provides education and training services only. The services and materials provided should not be interpreted as investment advice, an
Using Formations To Identify Profit Opportunities
 Using Formations To Identify Profit Opportunities Using Formations To Identify Profit Opportunities The concepts and strategies discussed may not be suitable for all investors. It is important that investors
I Day. article. In. you but. I just. Entry. Trend. I risk. 2.5% per. equity. a "runner" trading
 Emini Day Trading How I Day Trade for a Living I wish I had a simple answer for you but I don't. Trading is hard, very hard probably the hardest thing you' 'll ever try to do in your life and that's why
How I Trade Profitably Every Single Month without Fail
 How I Trade Profitably Every Single Month without Fail First of all, let me take some time to introduce myself to you. I am Kelvin and I am a full time currency trader. I have a passion for trading and
Expert- Forex- Systems.com
 Expert- Forex- Systems.com Profit From The Forex Market Andrew Fields 1 2 Expert-Forex-Systems.com www.expert-forex-systems.com This book has been written in order to provide Forex traders with two tried
THIS MONTH S STORY. Fibonacci Retracements The Classic
 THIS MONTH S STORY Fibonacci Retracements The Classic Author: Cornelius Luca, Eikon Charting Product Manager Tel: +1 646 223 4660 Welcome to the fourth edition of the charts newsletter! Brought to you
Trading with the Intraday Multi-View Indicator Suite
 Trading with the Intraday Multi-View Indicator Suite PowerZone Trading, LLC indicators can provide detailed information about the conditions of the intraday market that may be used to spot unique trading
Secrets for profiting in bull and bear markets Sam Weinstein
 Secrets for profiting in bull and bear markets Sam Weinstein 1. Check market indicators for overall direction 2. Scan the industry groups to know which one to zero in 3. Cull out the stocks with the most
Technical Analysis SAmple InveSTIng plans 1
 Technical Analysis Sample Investing Plans 1 Important Information All investing plans and rules are provided for informational purposes only, and should not be considered a recommendation of any security,