Expert- Forex- Systems.com
|
|
|
- Logan Washington
- 9 years ago
- Views:
Transcription
1 Expert- Forex- Systems.com Profit From The Forex Market Andrew Fields 1

2 2 Expert-Forex-Systems.com This book has been written in order to provide Forex traders with two tried and tested trading strategies which work extremely well. This is not a complicated book, but it is full of punch, and the systems you find in it are pure gold. I have purposely kept the book simple, straight-to-the-point and free of padding and information which you can find on other places on the net. These are truly expert systems which have proven track records and have been used by top Forex traders and fund managers all over the world. These two systems have been collected from the very best, through our close relationships with some of the expert traders in the Forex market. Many of the most brilliant traders work behind closed doors and are far from the limelight of Wall Street or London, and yet they achieve outstanding results often far surpassing the performance of The Street. These are the real experts, and these are their systems! You will find that these systems are surprisingly simple and easy to use. Simplicity is often the key to many successful ventures in life, and you will find that the same applies to trading. Good luck with this outstanding material, and I sincerely hope that the notes in this E-book will help you to become successful and wealthy from trading the largest market in the world the Foreign Exchange Market!

3 3 Expert-Forex-Systems.com Profits and drawdowns Both of the expert methods aim for pips per month, or more, with low risk and relatively low leverage. This enables you to enter the market with a higher degree of confidence and less risk of losing. However, with all trading systems, there are periods of drawdowns. (Losses in the market) This cannot be avoided, and the best traders realise that drawdowns are part of the trading business and they must be accommodated. Always allow for drawdowns equal to or slightly higher than the monthly profit average. If the system is gaining 400 pips per month on average, allow for periods when the drawdowns are up to 400 pips, or to be safe, 500 pips. A 500 pip drawdown at 1:1 leverage is equal to 5% of your account. Leverage is a double edged sword. Remember that a gain of 500 pips at 5:1 leverage is a 25% gain on your account. But conversely, a 500 pip drawdown is a loss of 25% of your account. We recommend never using more than 5:1 leverage, or lower. This allows you to gain up to 25% per month on your account, without risking more than 25% during any particular drawdown period. Read more about this in the chapter on money management below. Basics of trading The purpose of this book is to present two excellent trading methods without filling the book with basic trading teaching. However, if you are a new or inexperienced trader, I have written another book for you on the basics of Forex trading, which you can get for yourself at a 50% discount at This very comprehensive book will give you everything you need to learn the basics and to get trading yourself using the systems I teach here.

4 4 Expert-Forex-Systems.com If you are new to trading, I also recommend using an unlimited period demo account. These are trading accounts which look and feel exactly like real money accounts, except that the money is not real. Using a demo account will allow you to get the feel for the trading platform, the feel for how the market moves and a feel for how the trade methods work in real time. I highly recommend trading on a demo account for at least 1 month, but probably even longer (3-6 months). Many traders who graduate to real money accounts too soon lose money. This is because the demands of real money trading are so much greater in terms of stress and emotions, and if you have not mastered demo trading before that, the combination of new experiences can be overwhelming. You can visit or to get your own demo account free of charge. Free charts which are entirely suited to trading the expert systems can be downloaded at Essential reading material There are several books which I feel are essential for your growth and learning as a Forex trader. I have listed 5 books in order of importance below. They can all be obtained from and I would suggest reading one per month over the next 5 months. If you cannot afford to get all the books, start with the first two books and get the other ones when you can a little later on. Cornelius Luca: Trading in the Global Currency Markets Steve Nison: Japanese Candlestick Charting Techniques Marcel Link: High probability Trading Regina Meani: Charting An Australian Investor s Guide John Bollinger Bollinger on Bollinger Bands
. Many traders who graduate to real money accounts too soon lose money.")
5 5 Expert-Forex-Systems.com Money management Money Management and leverage, stop losses and targets This is one of the most important and most overlooked parts of trading. Many traders take huge risks with their capital in the hope that they will get rich quickly or recover previous losses with one good trade. I would like to suggest some simple guidelines for managing your trading account with the Expert Forex Systems, which will help you to reduce risk and maximize returns. 1. Never leverage more than 5:1 This means that for every dollar in your account, you should not trade more than 5 dollars per trade positions. For example, if your account size is $5000, you should trade no more than $25000 per position. This is 2.5 mini lots (a mini lot is worth $10,000) For example, with a standard account ($100k lot size), you should have at least $20k in your account to trade one standard lot of $100k. I prefer to leverage even lower than 5:1 with 1:1 2:1 being optimal. 2. Never risk more than 2% of your account on 1 trade. This is easily calculated. If the trade you want to enter requires a 40 pip stop loss for example, the risk to your account if stopped out is 40 pips x leverage/100%. In this case, if your leverage is 5:1 then the risk would be 40x5/100 = 2%. If the stop loss is higher, the leverage would have to be reduced. 3. Always aim for a 2:1 reward/risk ratio in your trades. If you are prepared to risk say 40 pips on a trade, ensure that the potential target for the trade is at least 80 pips. If you are prepared to risk 50 pips, make sure you have a possible target of 100 pips, and so on. Try to always aim for twice as much as you risk. The only exception to this rule is found in the Power Break method, and this will be clarified in that section.

6 6 Expert-Forex-Systems.com If you stick to these simple rules, you should be able to weather the storms and have a long lasting and relatively stress free Forex career! Good luck and enjoy! Andrew

7 7 Expert-Forex-Systems.com Expert Trading method #1 The Power Break Charts required: Trading times: Currencies traded: Skill level required: 15 minutes or 1 hour charts 06H00 08H00 London time GBP/USD and EUR/JPY Low intermediate Comment: This is a simple, yet powerful method which anyone can use to profit from the Forex market. Leverage recommended: Medium leverage maximum 5:1 Trading Philosophy This is an incredibly simple system which has exceptional results. The system is based on the principle that, although the Forex markets operate around the clock, 24 hours a day, there are certain phases on the market during the daily cycle. Because the World time zones begin in the East, the first large market to open is the Asian market, comprising mainly of China and Japan. Although this is a large market, it is smaller than the markets of Europe, London and the United States, and therefore tends to have less volatility and more consolidation than the other market periods. Once the Asian market drifts towards closing, and the European markets start opening, there is often an increase in volatility and a strong move in one direction or the other.

8 8 Expert-Forex-Systems.com The Power Break system aims to catch the increase in volatility and the break-out of the market, and to profit from the sizeable, quick moves which often (not always) take place. Simply put, the system identifies the range established during the Asian market period and sets limits for entering the market based on the range. Profit targets and stops are based on statistical observations of normal distributions of the movements. This system is simple to use, and takes less time to administer than other systems and will suit traders who cannot (or don t want to be) at the computer actively trading during the day. Currencies The Power Break system is ideally suited for trading the GBP/USD (Pound/Dollar) and the EUR/JPY (Euro/Yen). This is for four reasons: 1. Both of these currency pairs tend to have higher volatility than the other major or minor pairs, and this is essential for the break-out system employed by the Power Break method. Once a currency starts to move through the entry zones, I want it to continue for at least a minimum distance so that a healthy profit can be taken. 2. Both currencies tend to present good opportunities at the end of the Asian session. The Pound because it is traded actively during the European session (which follows the Asian session) and the EUR/JPY because if it has a small range during Asian trading, it will often explode at the start of the European session. And that s exactly what I want! 3. Both currencies tend to offer lengthy trends once they start moving in a direction, and this enables us to capture a significant profit without enduring frequent retracements. 4. These two currency pairs are non-correlated. This means that I am not trading two currencies against the US Dollar. When currencies are correlated, they tend to move in similar patterns at the same time. In this case, the GBP/USD might be rising, whereas the EUR/JPY might be static or falling. This helps to

9 9 Expert-Forex-Systems.com even out the trading performance and reduce risk and that is extremely important. Risk is the big killer of trading accounts and careers. Chart setup The chart setup is very simple. For each currency, I simply need the 1 hour or 15 minutes chart, with major support and resistance lines, Fibonacci lines and trend lines drawn in. Note that inexperienced traders might not be efficient in drawing these Fibonacci, support/resistance and trend lines, and they are not essential. However, experienced traders may like to use them to filter the trades and improve the profitability of the system. More on that later! Candle charts or Bar charts may be used, depending on your preference:

10 10 Expert-Forex-Systems.com Chart 1. EUR/JPY 60 minute bar chart

11 11 Expert-Forex-Systems.com Chart 2. EUR/JPY 60 minute candle chart

12 12 Expert-Forex-Systems.com Trading methodology Entering the trade: The trading entry method is very simple. I place two break-out orders outside of the Asian boundaries. There are two things that you need to note when using this strategy, first is the timing of trade and second is the value of the range. EUR/JPY Step 1 Firstly, I measure the high and low from 22:00 to 06:00 London time. This is called the power range Step 2 I then place long and short orders 10 pips outside this range, which are automatically triggered by your trading platform if the price reaches those levels. Important: If the power range exceeds 80 pips, I do not place any order. Step 3 I also set a stop loss of 40 pips and a profit target of 40 pips. If and when the price reaches the profit target or the stop loss, your trading platform should automatically trigger the trades for you. Step 4 Close the trade if neither of these is hit by 18:00 London time and repeat the process the next day.

13 13 Expert-Forex-Systems.com GBP/USD Step 1 GBPUSD: Firstly, I measure the high and low from 00:00 to 08:00 London time (the power range). This is called the power range Step 2 I then place long and short orders 10 pips outside this range, which are automatically triggered by your trading platform if the price reaches those levels. Important: If the power range exceeds 80 pips, I do not place any order. Step 3 I also set a stop loss of 40 pips and a profit target of 40 pips. If and when the price reaches the profit target or the stop loss, your trading platform should automatically trigger the trades for you. Step 4 Close the trade if neither of these is hit by 18:00 London time and repeat the process the next day. That really is the whole trading method. Incredibly simple, yet highly effective, relative safe and profitable and easy to administer! Let s have a look at a few examples: The simplest way to draw this on your charts is to create a box using vertical and horizontal lines like the chart below. This 15 minute chart for the EUR/JPY shows the power range (22:00 06:00 London time) on a particular day. I have drawn two blue vertical lines on the chart to box the power range period between them, and then I have drawn two horizontal red lines on the chart to show the high and the low of the price action during that period.

14 14 Expert-Forex-Systems.com In this case the power range was from to a range of 44 pips. As this was less than 80 pips, I could set two breakout entries: One at (to sell) with a stop loss at , and another at (to buy), with a stop loss at The targets in both cases are set at +40 pips. Chart 3. EUR/JPY power range
 with a stop loss at 165.38, and another at 165.")
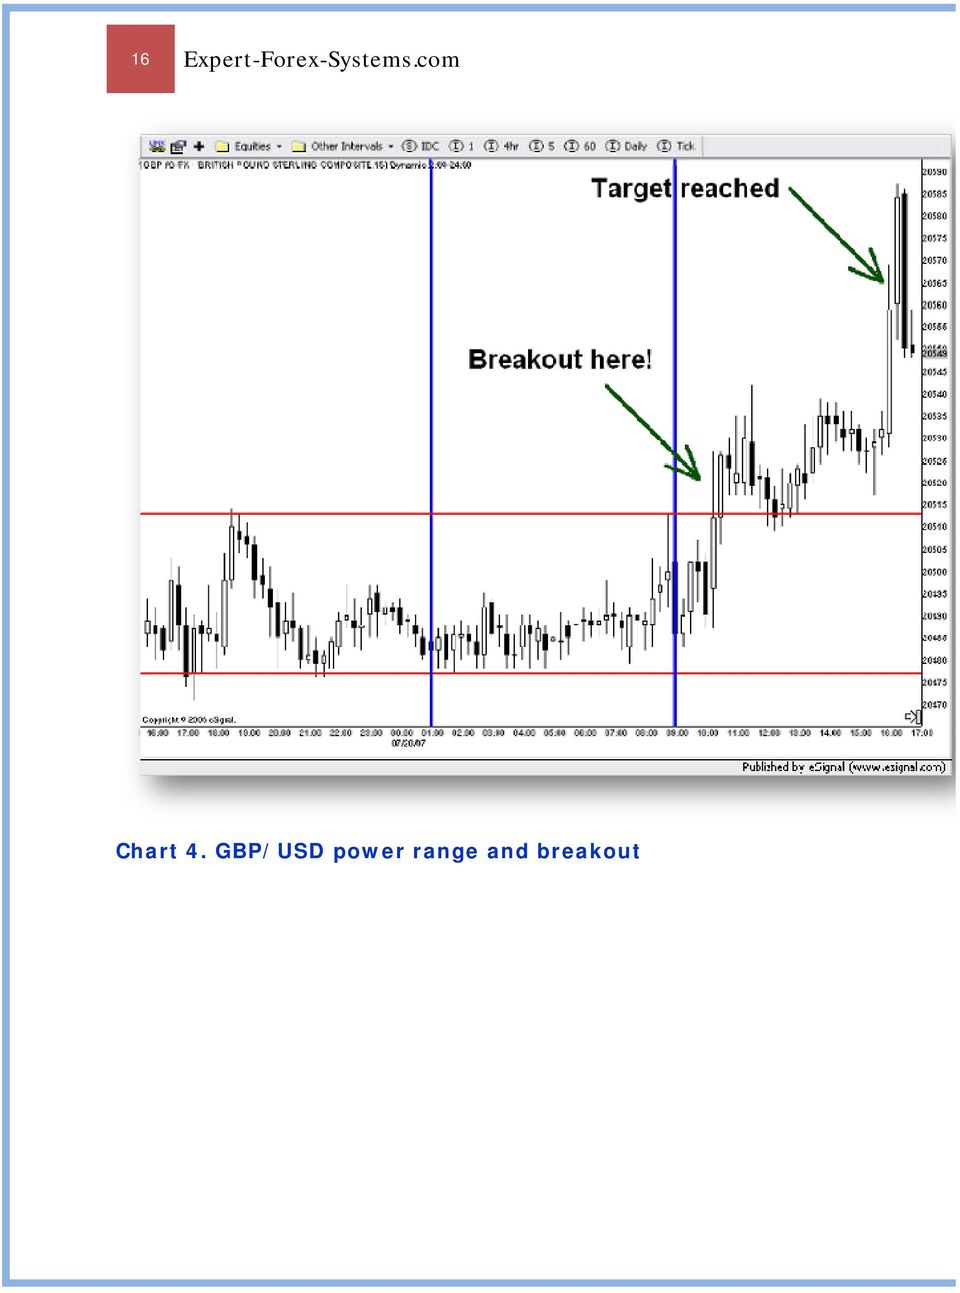
15 15 Expert-Forex-Systems.com Let s have a look at a GBP/USD example: This 15 minute chart for the GBP/USD shows the power range (00:00 08:00 London time) on a particular day. I have drawn two blue vertical lines on the chart to box the power range period between them, and then I have drawn two horizontal red lines on the chart to show the high and the low of the price action during that period. In this case the power range was from to a range of 39 pips. As this was less than 80 pips, I could set two breakout entries: One at (to sell) with a stop loss at , and another at (to buy), with a stop loss at The targets in both cases are set at +40 pips. In this example, it took the Pound another 8 hours to reach the 40 pip profit target, but eventually it did.
 with a stop loss at 2.0507, and another at 2.0523 (to buy), with a stop loss at 2.0483. The targets in both cases are set at +40 pips.")
16 16 Expert-Forex-Systems.com Chart 4. GBP/USD power range and breakout
17 17 Expert-Forex-Systems.com Here s a great example of the EUR/JPY. Notice how the power range held for several days, and even after the orders were set (when the box closed) the power range was tested on both sides before the price finally broke out upwards. The target of +40 pips was very quickly reached before the price began to drift lower again. Chart 5. EUR/JPY power range and breakout

18 18 Expert-Forex-Systems.com Here s one more example of the EUR/JPY. In this example, the power range was between and That means I would place a buy entry at and a sell entry at Notice how I got an entry to sell very shortly after the power range ended, and the price held down near the entry for some time after that: Chart 6. EUR/JPY power range and breakout

19 19 Expert-Forex-Systems.com The next chart shows the result: We moved all the way down to about a 70 pip move. I will discuss how to optimize profits in the next section (tips for experienced traders), but normally I would have taken the 40 pips the system advises: Chart 7. EUR/JPY power range and profit target

20 20 Expert-Forex-Systems.com Here s one more example on how to set up your charts for a Power Break Entry. The chart below shows the EUR/JPY power range. We study the chart at or just before 6AM London time, and draw in the power range box. We draw a red vertical line at 10PM London time the previous day and another red vertical line at 6AM London time today. Then we draw in the horizontal blue lines at the high and low during the same period. This gives us the chart with the box below: Chart 8. EUR/JPY power range

21 21 Expert-Forex-Systems.com Notice the high is at and the low is at This is less than 80 pips and therefore we can enter our Power Break orders. Now we can set the entry, stop loss and exit parameters. The entry to buy on the power break is at 10 pips above the high (plus spread) which means we enter a long trade order at plus the spread (let s say 5 pips) The buy entry is thus at The stop loss and target should both be 40 pips, which gives us an order which looks like this: BUY , stop , target On the opposite side of the power range, we have a sell entry 10 pips below the low of the power range. As the low is , we place the sell order at , with a stop loss at , and a target of SELL , stop , target Simple as that! Now we leave the orders in until 18H00 London time. At that time we either close the trades if they are still open, or we remove the orders if they have not been triggered. If the trades have already been triggered and reached either the stop loss or the target, there is nothing further to do. The next day we repeat the process. Here is one final example which is setting up as I write this book. The chart below shows the GBP/USD just as the power range is closing, and as it is time to set up our entry orders. Also interesting is the fact that today is the first Friday of the month, which experienced traders will know is the day of the US jobs report (the NFP). This report often makes the market move 100 pips or more in a matter minutes often in one direction without retracing. Ideal for a Power Break trade! We ll have a look at what happened to this trade a little later on, when the break occurs.
22 22 Expert-Forex-Systems.com Chart 9. GBP/JPY power range Notice here that the power range is between and a very narrow range, and much less than the maximum 80 pips. We can set up our orders as follows: (in fact I have just done so on my live trading account) BUY (10 pips plus 5 pip spread), stop , target And SELL , stop , target That s all there is to it. We remove any unopened order or close any open trades at 18:00 London time. Apart from that, the rest of the day
23 23 Expert-Forex-Systems.com is ours! (We will look at the result a little later in the book watch out for it) Let s move on to some possibilities for experienced traders to optimize the system further and achieve greater profits through their additional skills. Tips for experienced traders The Power Break system achieves good results if used exactly as it is written above. It has the benefits of being easy to use, less time consuming than other systems, the safety of non-correlated pairs and a very consistent equity curve. However, if you have some experience in trading, and have the time and will to monitor your charts more carefully during the European and NY trading sessions, then there are several ways to maximize the monthly profits of this system. 1. Observe major support or resistance zones, major Fibonacci levels and the previous day s high or low. Skilled traders will be able to gauge the risk/reward factors and probabilities at such key levels and will be able to remain sidelined if they judge that these key levels make the trade too risky. 2. Let the trade run if there's a strong break-out or hold it for several days with trailing stop if you are trading in the direction of the trend and exit only on signs of reversal or exhaustion. This will help you to maximize profits on those few days a month when the price movement runs for pips with little retracement. There are some notes on trailing stops lower down in the Extreme Swing Trading method, which apply equally well to the Power Break method. 3. The tighter the consolidation, the more powerful the break-out when it comes, so be prepared to let these run more readily. 4. Be careful not to trade on holidays or right before major news releases and remember to take profit quickly on Mondays and Fridays.
24 24 Expert-Forex-Systems.com 5. Note on money management: Generally, it is a good idea to employ the profit/stop loss ratio of 2:1 in most trading strategies, including the Extreme Swing method. The only exception I have come across and traded myself is the Power Break method, where the stop and target are equal. The reason this can be done is due to three factors: a. We use two non-correlated currencies and losses on one tend to be cancelled out by gains on the other b. The target is relatively small and the currencies used tend to respond to momentum breakouts, and therefore we can confidently go for the target whilst using a relatively large stop c. The win rate is relatively high, and this allows profits to absorb losses quite comfortably.
25 25 Expert-Forex-Systems.com Summary The Power Break method is extremely simple to use, and yet very effective. The technique is easy to master and there is little time required to manage the trades once the orders are placed. The results will vary with market volatility, and has been shown to produce pips per month with drawdowns of about the same magnitude.* This is a great system for experienced and novice traders alike and is a vital piece of every Forex trader s weaponry! *See disclaimer at the end of the book.
26 26 Expert-Forex-Systems.com Expert Trading method #2 Extreme Swing Charts required: Trading times: Currencies traded: Skill level required: Day charts with 50, 100 and 200 SMA and 100/200 Bollinger Band plus 14/7/3 Stochastic Once per day at NY close EUR/USD, GBP/USD, EUR/JPY, AUD/USD, USD/JPY, USD/CHF Intermediate to advanced Comment: This is an extremely powerful trading method which requires only 1-2 hours a day. It is well worth mastering! Leverage: Low leverage 2:1 Trading philosophy The Extreme Swing method is designed with several ideas in mind. Firstly, trading should be less time consuming than office jobs and therefore an end-of-day (EOD) system is ideal for people who want to enjoy a complete lifestyle. Trades are only entered once per 24 hours, at the end of the NY session, and then left to work themselves out for the following 24 hours. Secondly, the idea is to enter trades less frequently only on very high probability set-ups. This means the cost of trading (spreads and your time) is minimized and the winning percentage is maximized. Thirdly, in this method, six currency pairs are traded, covering a variety of markets and crosses, thus minimizing the potential for
27 27 Expert-Forex-Systems.com highly correlated pairs being traded together. Although six pairs are traded, usually the system will only place you into 1-3 pairs at the same time, as entries are highly selective. In short, this is an ideal method for intermediate to experienced traders who value their lifestyles and are not concerned with being in the market all the time, or actively trading in front of the screen. The idea behind the method is to pick entry zones of high probability and then to wait for clear entry signals through observing the daily chart price action at those zones. The trade is then entered in the opposite direction to the recent move a swing trade. An understanding of candlestick charting or other methods of assessing price action is recommended. Currencies As mentioned above, six pairs are traded; these being: EUR/USD GBP/USD USD/CHF USD/JPY EUR/JPY AUD/USD These pairs are chosen for very specific reasons. The first three (Euro, Pound and Swissy) are European currencies and are thus highly correlated. Ideally, only one of these three pairs will have an active trade open at any one time, with a maximum of two. Often an entry setup will only occur on one of them, but sometimes a signal will occur on 2-3 simultaneously. In this case, the best signal only should be selected.
28 28 Expert-Forex-Systems.com The next pair, the Dollar/Yen behaves differently to the European currencies, even though it is still a dollar-based cross. It reflects a different time zone (the Far East) and a different trading mentality. This pair often presents unique opportunities when the others might not be offering any entries. The EUR/JPY (Euro/Yen) is not dollar based and therefore offers a noncorrelated pair to trade. It also has different characteristics to the other pairs from a technical and psychology perspective. The final pair, the Aussie Dollar, also offers a different market, driven by different fundamental and technical factors and adds a useful weapon to your trading armory. Chart Setup The chart setup for the Extreme Swing system is actually very simple. I use various well known moving averages to identify support and resistance zones, plus Bollinger Bands to identify high probability zones for trend reversal. Bollingers are based on statistical measures of probability, applied to many fields of science, and are excellent tools for trading Forex and other markets. I also use a Stochastic indicator to help with timing of the trade entries (and sometimes exits) The chart setup is as follows: I use day charts only, one for each of the six pairs traded, and arranged on your screen with three at the top and three at the bottom. Each chart has either candles (I prefer this) or bars to denote price action, plus the following statistical indicators: 1. A 200 period simple moving average (SMA) (Based on close) 2. A 100 period SMA (Based on close) 3. A 50 period SMA (Based on close) 4. A 100 period Bollinger Band (BB) (Based on close with 2 standard deviations) 5. A 200 period BB as above 6. A 14/7/3 stochastic.
29 29 Expert-Forex-Systems.com The picture below shows the 6 charts on the screen together: Chart 10. Extreme Swing set up. This layout enables you to see all the currencies at a glance and it is easy to open any of the charts in its own window to fill the screen for a closer look. The individual charts look like this:
30 30 Expert-Forex-Systems.com Chart 11. Extreme Swing set up (2) There are no other charts used in this method, and all trading is done by observing the chart for each pair at the end of the trading day, when NY closes around 5PM Eastern Time (US) I prefer to use candle charts, and the following picture shows the same chart as above, zoomed in to show you how then candles are displayed:
31 31 Expert-Forex-Systems.com Chart 12. Extreme Swing candle charts It is important for this method to have a good grasp of candlestick trading, and the table below gives some of the basic formations which I observe in this system. Further, I recommend that you purchase Steve Nison s excellent book on Candle trading (see book list on page 1)
32 32 Expert-Forex-Systems.com Candlestick charting This section is a brief introduction to Japanese candlestick charting methods. If you are a new trader, please read through these carefully, and try to spot the patterns on your live Forex charts. If you are familiar with candlestick charting, skip this section and go straight to the rest of the system. Interpretation of candlestick charts is based on patterns. Currency traders use primarily the relationship of the highs and lows of the candlesticks over a given time period. However, some patterns can be identified to anticipate price movements. There are two types of candles: the bullish pattern candle and the bearish pattern candle. Bullish Candlestick Formations
33 33 Expert-Forex-Systems.com Piercing Line - This is a bullish pattern. The first candle is a long bear candle followed by a long bull candle. The bull candle opens lower than the bear s low but closes more than halfway above the middle of the bear candle s body. Hammer - The hammer is a bullish pattern if it occurs after a significant downtrend. If the line occurs after a significant uptrend, it is called a hanging man. A small body and a long wick identify a hammer. The body can be clear or filled in. Morning Star - This is a bullish pattern signifying a potential bottom. The star indicates a possible reversal and the bullish (blue) candle confirms this. The star can be a bullish (blue) or a bearish (red) candle.
34 34 Expert-Forex-Systems.com Bullish Engulfing Lines - This pattern is strongly bullish if it occurs after a significant downtrend (it may serve as a reversal pattern). It occurs when a small bearish (red) candle is engulfed by a large bullish (blue) candle. Bullish Doji Star - This star indicates a reversal and a doji indicates indecision. Thus, this pattern usually indicates a reversal following an indecisive period. You should wait for a confirmation before trading a doji star.
35 35 Expert-Forex-Systems.com Bearish Candlestick Formations Long Bearish Candle - A long bearish candle occurs when prices open near the high and close lower near the low. Dark Cloud Cover - This is a bearish pattern. The pattern is more significant if the second candle s body is below the center of the previous candle s body. Bearish Engulfing Lines - This pattern is strongly bearish if it occurs after a significant uptrend (it may serve as a reversal pattern). It occurs when a small bullish (blue) candle is engulfed by a large bearish (red) candle. Hanging Man - This pattern is bearish if it occurs after a significant uptrend. If this pattern occurs after a significant downtrend, it is called a hammer. A hanging man is identified by small candle bodies and a long wick below the bodies (can be either blue or red).
36 36 Expert-Forex-Systems.com Evening Star - This is a bearish pattern signifying a potential top. The star indicates a possible reversal and the bearish (red) candle confirms this. The star can be a bullish (blue) candle or a bearish (red) candle. Doji Star - This star indicates a reversal and a doji indicates indecision. Thus, this pattern usually indicates a reversal following an indecisive period. One should wait for a confirmation (like an evening star) before trading a doji star. Shooting Star - This pattern suggests a minor reversal when it appears after a rally. The star s body must appear near the low price, and the candle should have a long upper wick.
37 37 Expert-Forex-Systems.com Neutral Candlestick Formations Spinning Tops - This is a neutral pattern that occurs when the distance between the high and low, and the distance between the open and close, are relatively small. Doji - This candle implies indecision. The open and close are the same. Double Doji - This candle (two adjacent doji candles) implies that a forceful move will follow a breakout from the current indecision. Harami - This pattern indicates a decrease in momentum. It occurs when a candle with a small body falls within the area of a larger body. This example a bullish (blue) candle with a large body is followed by a small bearish (red) candle. This implies a decrease in the bullish momentum.
38 38 Expert-Forex-Systems.com Reversal Candlestick Formations Long-legged Doji - This candle often signifies a turning point. It occurs when the open and close are the same, and the range between the high and the low is relatively large. Dragonfly Doji - This candle also signifies a turning point. It occurs when the open and close are the same, and the low is significantly lower than the open, high and closing prices. Gravestone Doji - This candle also signifies a turning point. It occurs when the open, close and low prices are the same, and the high is significantly higher than the open, close and low prices. Stars - Stars indicate reversals. A star is a candle with a small real body that occurs after a candle with a much larger real body, where the real bodies do not overlap (the wicks may overlap).
39 39 Expert-Forex-Systems.com Trading methodology Essentially, I am looking for a strong move in a particular direction, before trading in the opposite direction in order to catch the swing or reversal. It is always easier to break any process down into a series of steps, and I have done that for you in this trading method. I will give you the rules of the method, and then put it all together for you at the end: Rule #1: Only ever trade when the price is touching or has pierced or is very close (say within pips) to a major indicator line on the chart. (50,100 or 200 SMA or 100,200 BB) If the price is not at or near any of the indicator lines, no trade may be considered. In this rule, I am saying the price must be at or near either the 50 SMA, 100 SMA, 200 SMA, 100BB or 200BB. At any other place on the chart, trading is not allowed. These indicators act as zones/levels or probability and they mean that the chance of a reaction has increased considerably. Important: in the case of the BB s only the price can sometimes travel a fair distance through the BB. No matter how far through it has gone, a trade may still be considered. The chart below gives examples of where trades might be considered in this example:
40 40 Expert-Forex-Systems.com Chart 13. Extreme Swing entry zones Rule #2: Trade entries may only be considered if/when the 14/7/3 stochastic is overbought (both lines above 80 on the stochastic chart) or oversold (both lines below 20 on the stochastic chart). Further, the stochastic lines must be turning and touching Let me explain this with the aid of the charts again:
41 41 Expert-Forex-Systems.com The chart below shows the stochastic approaching the 20 level, but not yet oversold (see the right side of the chart. Note also that the candle is almost touching the 100 SMA, but no signs of reversal. More on that later just a heads-up for you) Chart 14. Extreme Swing Stochastic almost oversold & Price near 100 SMA
42 42 Expert-Forex-Systems.com The next chart shows the same stochastic when it has become oversold, but not turning and touching (Notice the small bullish candle formed on the chart) Chart 15. Extreme Swing Stochastic now oversold & Price trying to reverse at 100 SMA
43 43 Expert-Forex-Systems.com The next chart shows the same stochastic when it has become oversold, and it is now turning and touching (Notice the series of small bullish candles formed on the chart) Chart 16. Extreme Swing Stochastic oversold & touching and turning and Price trying to reverse at 100 SMA
44 44 Expert-Forex-Systems.com The next chart shows the same stochastic when it has finished touching and turning and is now heading upwards. Note the reversal candles forming on the chart at the 100 SMA. Chart 17. Extreme Swing Stochastic oversold & turning and Price reversing at 100 SMA Rule #4: There must be a clear reversal candle (or bar) on the chart which occurs at one of the zones of probability and when the stochastic is touching and turning I have highlighted some of the common candle patterns in the pages above, and the most important patterns are spikes such as dojis, hammers and hanging man candles, engulfing candles, piercing patterns, dark cloud covers, full stops and morning/evening stars. I will discuss more on these later. Rule #5: The trade risk/reward ratio must be favourable, and the stop loss must be between pips and no more. The best way to explain this system is through several examples, and a step by step trade entry process, so let s begin with that!
45 45 Expert-Forex-Systems.com Step #1: Get prepared I firstly start up my charts near the end of the NY trading session around 5PM Eastern Time (US) Most traders tend to have their charts on all day, so if you have your charts ready, then switch to the Extreme Swing view. This is the 6 daily charts of the pairs I am trading. Reminder: EUR/USD, GBP/USD, USD/JPY, USD/CHF, EUR/JPY and AUD/USD. Step #2: Oversold & Overbought As I do not enter any currency unless the stochastic is overbought or oversold, it takes only a few seconds to scan the six charts and to find charts where this condition is met. In the screenshot below, you can quickly see that only the third pair along the top and the first pair along the bottom are worth considering (these are the USD/JPY and the EUR/JPY) For today, I can then ignore the other 4 currencies and focus on the two oversold pairs.
46 46 Expert-Forex-Systems.com Chart 18. Scanning for O/Sold & O/Bought stochastic Step #3: Identify Extreme Swing Levels Next I focus on the two charts I have picked out based on the stochastic. In this example, I only have two pairs to consider, and now I look for charts (from the two) where the price is touching or very close to the 50,100 or 200 SMA OR the 100 or 200 BB. Let s have a look at our examples:
47 47 Expert-Forex-Systems.com Chart 19. USD/JPY set up? The first chart (USD/JPY) above shows the price is below all three SMA s and not yet near the lower 100 or 200 BB s. (the 100BB on the chart is visible at around ) In this case there is no trade. If and when we drop lower towards the BB s, then I would move onto step 4, but in this case, there is no further action. Notice, however, that the stochastic is touching and turning which means a bottom may be formed in the near future. See step 4! Let s have a look at the second pair, the EUR/JPY
48 48 Expert-Forex-Systems.com Chart 20. EUR/JPY set up? Notice that in this pair, the price is below the 100 SMA (blue) but above the 200 SMA (purple) The stochastic is oversold, but not yet touching and turning (see step 4) The price is at about , and the 200 SMA is at , some 190 pips lower. In this case, I need to wait for the price to drop closer to the 200 SMA before considering a trade, and therefore there is no action to be taken. Let s look at an example where we ARE at a key level and the stochastic is overbought.
49 49 Expert-Forex-Systems.com Chart 21. EUR/JPY set up? (2) Here I see the EUR/JPY reaching up through the 200BB (green line) and the stochastic is overbought. This immediately means I can continue to consider a trade, and I move on to step 4. Remember that so far, the stochastic needs to be overbought or oversold, and the price needs to be touching or piercing, or very near one of the key levels. (SMA s or BB s) Now I can move onto the next step
50 50 Expert-Forex-Systems.com Step #4: "Touching and Turning" Now I look to see that the stochastic is touching and turning In the last chart example, this was not yet the case. However, at the very next candle (the next day), the stochastic did exactly that. See chart below: Chart 22. EUR/JPY stochastic now touching and turning
51 51 Expert-Forex-Systems.com As the price move lower, forming a bearish engulfing candle after the previous day s spike high the stochastic did what I wanted touched and turned! This is the signal I look for before moving to step 5. Note; Step 4 and step 5 might be reversed in real time, or may occur at the same time. Don t be too pedantic about the order of step 4 and 5. As long as they both occur within a day or two of each other, that is good enough. Sometimes the reversal candle happens before the touch and turn, sometimes on the same day, and sometimes afterwards. Be aware of that! Step #5: Reversal candles The most important (and sometimes most difficult step of all) is to identify the reversal candle which triggers the reversal I want to trade. There are many types of reversal patterns, some of which are identified in the section above on candle charting. I have found over the years that some patterns are more reliable and easier to spot than others and I will tell you all about them in the next paragraph. There are two simple rules of thumb here: 1. If in doubt stay out don t take the trade 2. Wait for the most glaring, obvious reversals before trading The most reliable candle patters are these, in order of importance: Obvious spike high and spike low (including dojis and shooting stars) Piercing patterns and dark cloud covers 8-10 consecutive rising/falling days, followed by a reversal day Morning/evening stars Engulfing patterns
52 52 Expert-Forex-Systems.com If all you know is these 5 patterns, you can do extremely well from this system. Get to learn them and know them intimately. You should be able to spot them in a few seconds on your charts. Again, read Steve Nison s book on candle charting. This will give you the best possible grounding in this powerful trading method. If and when you see a reversal candle/pattern, you then move onto the next step on planning the trade. First, let s have a look at some real examples of reversals which took place on our currency pairs: Chart 23 Small doji candles at the 200 BB
53 53 Expert-Forex-Systems.com Chart 24 Piercing pattern and dojis at 100 SMA
54 54 Expert-Forex-Systems.com Chart 25 Spike low and doji s at the 200 SMA and 100BB
55 55 Expert-Forex-Systems.com Chart 26 Spike low and bullish engulfing candle below the 100 BB
56 56 Expert-Forex-Systems.com Chart 27 Hammer and doji at the 100BB (grey) and below the 200BB (green)
57 57 Expert-Forex-Systems.com Chart 28 Dragonfly doji at top 200 BB
58 58 Expert-Forex-Systems.com Chart 29 Doji through and above both BB s
59 59 Expert-Forex-Systems.com Chart 30 Spike high at 200 SMA
60 60 Expert-Forex-Systems.com Chart 31 Spike low and bullish engulfing candles at lower 100BB
61 61 Expert-Forex-Systems.com Chart 32 Multiple reversal candles at lower 200BB and key support (see tips for experienced traders for notes on additional technical analysis.)
62 62 Expert-Forex-Systems.com Step #6: Entering the trade Once I have the chart setup with the price at a key level, the stochastic oversold/overbought, the stochastic touching and turning and a reversal pattern on the daily candle, I then consider entering the market. This is only possible either at the end of the trading day at 5PM EST or the next 1-2 days on a retracement. I will describe both of these. Entering at 5PM EST The trade can be entered as soon as the NY trading day is finished, at the close of the daily candle. This is the simplest method to enter the trade. Remember, I am looking to enter the trade in the opposite direction of the most recent move. In the 10 examples above, you will see that the trade is in the opposite direction to the move that took place before it. For example, in chart 32, the price moved down to the 200BB, and the trade was then to BUY the pair. In this case, the USD/CHF had been moving lower for the past days, and the trade was to BUY USD/CHF. In other words, I want to buy the US Dollar and sell the Swiss Franc. Reminder: More information on the basics of trading can be found at my other book at This is highly recommended if you are a new or learning trader and this special link will give you a 50% discount on the book. Entering the trade has several considerations. First I must assess the size of the stop loss required, then the potential profit target and thirdly, the size of position I want to place on the trade.
63 63 Expert-Forex-Systems.com General rule of thumb: 1. The stop loss must be above/below the daily candle which gave the reversal signal about 10 pips further. 2. The stop loss must be no greater than 150 pips and no less than 50 pips. If this conflicts with rule #1, then either the position size must be reduced to accommodate the larger stop loss, or the trade must not be taken. 3. The profit target should be at least 150 pips and preferably 200 pips. I will give you some good examples at the end, when I put it all together, so don t worry if you are finding this a little bit difficult right now! Entering on a retracement This can take place if you feel the stop is too large, or if you think the price will retrace a little bit and you can get a better entry price by waiting for this to happen. For this entry, I need to switch to hourly charts to examine the price action a little more closely before the entry. The best way to explain this is through an example:
64 64 Expert-Forex-Systems.com Chart 33 Example of a GBP trade entry off the 200 SMA This chart example is taken from chart 30 in the section above. The trade entry signal was given where the green arrow points to the doji candle against the 200 SMA. This candle is a daily candle which closed at 5PM EST and then the next candle began to form. Let us say that the closing price of the doji candle was , and the high of the doji candle was The rule of thumb above says that the stop loss should be above the high of the reversal candle. This means that the stop loss should be at (including the spread) this makes the total stop loss 145 pips close to the 150 pip maximum I have determined.
65 65 Expert-Forex-Systems.com I can either enter the trade with 145 pip stop loss (in that case I may want to reduce the position size I trade see more on that lower down), or I can wait for a retracement. Notice that the next day candle moves higher before moving lower. In fact, this candle went up to before moving down. This is called a retracement. The idea of this entry method is to determine an entry signal using the extreme swing method, and then to wait for the price to move higher the next day (a retracement in the opposite direction) before entering at a higher price. In this example I could have entered at say , with a stop at , giving us a 95 pip stop loss, instead of a 145 pip stop loss. This is much more in our favor! It reduces our risk of loss, and it reduces our risk/reward ratio (the ratio of amount risked vs. amount targeted for the trade) And this is exactly what I want! The biggest danger of waiting for a retracement is that the market may not retrace at all, and I might miss the trade entry. This risk is sometimes hard to determine, unless you are a skilled trader. As I mentioned before, the Extreme Swing Method is extremely rewarding, but can take some time to fully master. I encourage you to persevere because it is certainly worth it! Step #7: Stops and targets I have already covered this in the previous step, but it s worth repeating again. Stops should be ideally no more than 150 pips, and always at least 10 pips above/below the reversal candle you chose to signal the trade. Don t set stops too close either. I suggest no less than 50 pips, as anything smaller than that places you in danger of losing a trade simple due to random market noise) which happens every day in the region of pips in amplitude.
66 66 Expert-Forex-Systems.com The instinct is to try to make stops as small as possible, but we want to remain out of the noise of the market and also well above/below the reversal candle which we entered on. Note that this system can produce very good profits, but stops are often larger than other systems. In this case the traded leverage should be no higher than 3:1, and ideally 2:1 (See section on money management near the start of the book) With any trading system, the exit is always more difficult than the entry to the trade. Profit targets should be at least 100 pips, and ideally 200 pips or more especially if the price has reached a major high or low and has already moved a pips in one direction. There are two ways to set targets. Firstly, many traders will set the target at twice the size of the stop loss. For example, if the stop is 80 pips, the target becomes 160 pips. This is a good rule of thumb for the Extreme Swing method. More experienced traders can use technical targets and/or trailing stop losses, and I have covered this topic in brief in the section with the same heading below. Step #8: Money management Yet another reminded: This is an essential topic which is almost always overlooked in trading books. If you do not manage your account properly, you will not succeed that s a guarantee. I covered money management at the beginning of this book, and you should go back now to that section on page 3 and make sure that you understand and implement those three simple rules. Please do not ignore this! Trailing stops and technical targets Trailing stops can best be explained like a ratchet. Let s say we are long on a pair such as the EUR/USD and the price has move higher in our favour. Price action in the currency markets is usually like a wave pattern. The price will move higher for a while and then drop back
67 67 Expert-Forex-Systems.com down to say 38% or 50% of the move higher it has just completed. (For more learning on Fibonacci retracements visit Once it has retraced it moves higher again and makes a new high. It carries on higher for a while, and then retraces again, and so on, in a ratchet type of movement. The chart below gives an example of this wave or ratchet action of the EUR/USD during an uptrend: Chart 34 Example of ratchet-like rally in EUR/USD
68 68 Expert-Forex-Systems.com You can see in this example on an hourly chart, that, although the price was generally moving higher, there were frequent periods of correction (retracement) where the price fell back a little before moving higher again. The idea of using a trailing stop is to wait for the corrections/retracements and then to move the stop loss up underneath them once the price has moved higher. In this example there were 4 occasions where this could have been done. The next chart shows that eventually the price broke below the 4 th trailing stop level and stopped the trade out for a handsome profit. This method is very powerful when used with the Extreme Swing method, when the market is in a strong trend, and this trade would have gained over 450 pips! Using trailing stops is not as easy as it looks here and, once again, perseverance is required to master this technique. Again, it is well worth doing so!
69 69 Expert-Forex-Systems.com Chart 35 Example of ratchet-like rally and eventual profit taking by trailing stop in EUR/USD Below is the same trade on the daily chart, showing the entry and the trailing stop levels:
70 70 Expert-Forex-Systems.com Chart 36 Example of ratchet-like rally and eventual profit taking by trailing stop in EUR/USD (day chart view) Technical targets, on the other hand, are pre-chosen targets which the trade can decide upon using other forms of technical analysis. Once again, this comes with knowledge of basic technical analysis, with the key ingredients being Fibonacci retracements, Support and resistance lines and Trend lines. These are basic tools which every trader should master and are not part of this book. However, please visit to get the very best training available on this subject.
71 71 Expert-Forex-Systems.com Tips for experienced traders with a good knowledge of technical analysis When watching for entry signals and timing the trade entries, pay special attention to where the Extreme Swing entries coincide with the following: Fibonacci retracement levels(including 0.786) Horizontal lines of major support and resistance Major trend lines When an entry signal is seen using the Extreme Swing method, and the entry level/timing coincides with any of the above technical levels, a very powerful entry signal is generated. The probability of winning becomes much higher than normal and these are the entries which should be particularly important in your trading month. The best way to illustrate the Extreme Swing Method is through real trading examples, and I have included three in the section below:
72 72 Expert-Forex-Systems.com Extreme Swing Example 1 Short AUD/USD outside top 200 BB In this example, the AUD/USD was outside the top 200BB and gave a perfect entry signal for a sell. If you look back to a few weeks earlier, the chart shows two previous opportunities to sell, which were profitable, but with smaller profits (see chart below with green arrows) These were sell signals off the 200 BB, but only the second green arrow had a touching and turning signal from the stochastic. Chart 37 2 False swings in AUD/USD, followed by another entry Doji on the far left
73 73 Expert-Forex-Systems.com Then the price move higher and we got another reversal candle at the top 100 BB with a perfect doji candle. Note the overbought stochastic which is now touching and turning again The price at the close of the day was , and the high of the candle was a 38 pip gap. Chart 38 Perfect doji candle above the top 100 BB As the stop loss should be between pips in this trading system, I enter the trade short at , and set the stop at 90 pips, at The target is 200 pips at I don t wait for a retracement before entering, because the gap between the entry price and the candle high is so small. If it was
74 74 Expert-Forex-Systems.com greater than 100 pips, I would consider waiting for a retracement the next day or two before entering. (more on that in the next example) The price actually moves up over the next 3 days, but continues to make reversal candles in the process. The highest level reached was , some 12 pips below our stop loss: Chart 39 2 more doji s slightly higher than the first one, still above the top BB but we are already in the trade!
75 75 Expert-Forex-Systems.com And then the big collapse! The price drops through our profit target in 2 days, triggering the profit stop and banking 200 pips: Chart 40 The big pay off! Notice how the price dropped to the first SMA support at the 50 day SMA before pausing. This is a logical place to exit if the target is not preset at 200 pips.
76 76 Expert-Forex-Systems.com Extreme Swing Example 2 Long USD/CHF from lower 200 BB with retracement entry... In this example, there are several good illustrations of the trading method. On 19 th April, the Swissy approached the lower 200 BB, and formed a reversal candle. The stochastic is not quite oversold, and has certainly not touched and turned The closing price is No entry signal. Chart 41 USD/CHF getting close to an entry signal?
77 77 Expert-Forex-Systems.com The following day, the price rises quite sharply, and it seems as if the opportunity to buy the pair has been lost. In fact, the day after that, it rises further, now 80 pips away from the original reversal candle. Note interestingly, the stochastic is still dropping very close to the 20 level and threatening to touch and turn : Chart 42 USD/CHF getting close to an entry signal? (2)
78 78 Expert-Forex-Systems.com On the third day after the original reversal candle the price suddenly drops again, before rising again for two days after that. Still no clear reversal candles, but the stochastic is now oversold and touching and turning (incidentally, the level we are at is a major support level refer to notes for experienced traders): Chart 43 USD/CHF getting close to an entry signal? (3)
79 79 Expert-Forex-Systems.com Suddenly, the very next day, we get a clear reversal candle in the form of a spike low. All the requirements are in place. The price is near the lower 200 BB, the stochastic is oversold and touching and turning and the daily candle forms a spike low. Now we are ready for a trade! The next step is to look at the daily close price and the low of the reversal candle to decide whether we enter the trade at market or we wait for a retracement entry. Chart 44 USD/CHF eventually gives an entry signal spike low The candle closing price is and the original reversal candle low is some 70 pips away.
80 80 Expert-Forex-Systems.com Hint: In this case, don t use the low of the current reversal candle. (The one in chart 44) It makes much more sense to place the stop below the low of the original reversal candle 6 days earlier, as this is now the bottom of the previous move lower. In this case we can either enter at the close at , or wait for a retracement. Let s assume for this example that we prefer to get a better price and wait for a retracement entry before committing to a long position. We then switch to the hour chart to time the retracement. (Hint: this only needs to be done the next day after the European open time, as normally the Asian session is very quiet. The next chart shows a compressed view of the hour chart exactly where the daily chart entry candle was identified:
81 81 Expert-Forex-Systems.com Chart 45 USD/CHF hourly view of the reversal
82 82 Expert-Forex-Systems.com Let s expand that to a normal view now to see what happened the next day: (Hint: I have the same indicators on the hour chart, as they often give very helpful information similar to the day charts!) Chart 46 Expanded USD/CHF hourly view of the reversal We see here that, interestingly, the hour chart price is supported by the 50,100 and 200 SMA s which are all together on the chart! The green arrow shows how the price dips to , and makes an hourly spike low before consolidating for another hours and then rallying to put us into profit. The retracement entry could have been taken anywhere between and , giving us a pip advantage over the original end-of-day entry at 5PM EST.
83 83 Expert-Forex-Systems.com The trade target should be at least 100 pips, and preferably 200. Let s look back at the daily chart to see how we did with the trade: Chart 47 USD/CHF profit target reached. As can be seen, it took several days before the profit target of 200 pips was reached. I want to go through one more example of a typical trade entry set up from beginning to end. This should be enough to give you an excellent idea of how the method works in real time.
84 84 Expert-Forex-Systems.com Extreme Swing Example 3 Long EUR/JPY from 100 SMA -a 5 day set up The next example is an excellent example which is actually occurring as I write this book. We are looking at the daily chart of the EUR/JPY with the price reacting beautifully at the 100 Simple Moving Average (SMA): Chart 48 A beautiful entry set up for EUR/JPY. Notice the price is at the 200 SMA (having spiked through it but not closing below it on a daily basis this is a powerful signal. Secondly, the Stochastic is oversold and touching and turning and there are
85 85 Expert-Forex-Systems.com several reversal candles in the form of a bullish engulfing candle (5 th from the left) and a spike low (third from the left). This is indeed an enticing setup and one I would not hesitate to trade. I really entered this trade yesterday here is how: Let s scroll back a few days. The first chart shows the picture 5 days before, on Friday at the close of the day and the week. Chart 49 The pair is heading for oversold stochastic and is at 100 SMA support Although we are at support, the stochastic is not oversold and the daily candle is not a reversal candle. Action: None, but becoming interested!
86 86 Expert-Forex-Systems.com The following trading day (Monday) this is what we got: Chart 50 The pair is heading for oversold stochastic and is at 100 SMA support, PLUS we have a huge bullish engulfing candle at the close of Monday s session. Still not all the requirements are in place. I need the stochastic a little lower and to touch and turn and I need a retracement as the bullish candle is over 200 pips long above my 150 pip limit for stop losses.
87 87 Expert-Forex-Systems.com On Tuesday, the price collapsed back to , and the stochastic was still not quite correct. The bearish candle formed means I now had a shot at getting the stochastic lower, but it also meant I needed another bullish/reversal candle to place me back in the hunt for an entry. Chart 51 Collapse back to , but stochastic is becoming oversold.
88 88 Expert-Forex-Systems.com On Wednesday, I got what I was looking for another reversal candle this time a spike low down to and a perfect reversal signal. Notice how the stochastic is now also touching and turning : Chart 52 Spike low to gives us a reversal signal and an entry opportunity. The next questions I had to address were: Where do the stop loss and targets need to be and should I wait for a retracement entry or enter at market? Well, these are easily answered The low of the entry candle was and the close of the day price was at a 200 pip gap. This is above the maximum stop loss of 150 pips, so I needed to wait for a retracement of at least 50 pips (down to at least ) before entering the trade the next day. I simply turned off my charts and
89 89 Expert-Forex-Systems.com resolved to watch the hour chart the next day to grab a retracement entry. The next chart shows exactly this: Chart 53 Thursday s entry on the hourly retracement This hourly chart shows the spike low on the reversal day, as well as the hourly lows the following day. The price actually dropped to below the required minimum drop to Interestingly, notice that I kept the same indicators on my hourly chart they work in the same way to give me an entry signal! Notice the hourly spikes to and the oversold stochastic when the daily spike low occurred. I entered the trade on Thursday after the spike to , at , giving me a 150 pip stop loss, and a target of pips ( ) A study of the daily chart shows that this is easily achievable,
90 90 Expert-Forex-Systems.com but now that I am in the trade, I will try to trail the stop loss, as I am an experienced trader. Alternatively, I could simply set a pip target and leave it to work itself out. My entry looks like this: Long at , stop loss , target (min) or Now back to the day chart to see how it looks and how we are going on Friday: Chart 54 Potential targets Note the price has already begun to move higher, and we have a target just below the 50 day SMA a logical place to exit on a technical basis. A perfect trade! We will have to wait and see how it turns out, as this trade is still open as I write.
91 91 Expert-Forex-Systems.com In the chart below, I have added a solid blue horizontal line and a Fibonacci retracement grid to further assist me in profit targets. Experienced traders will see that logical profit targets are and If I see that the price is heading up there with a good trailing stop system in place, I might even aim for 250 or 350 pips from this trade. If you are not experienced in these techniques, I suggest reading some of the books on my book list in the beginning of this book, and getting hold of my Forex book for learners at Chart 55 Potential targets (2) Fibonacci and S/R lines
92 92 Expert-Forex-Systems.com Summary The Extreme Swing Forex trading method is very simple, yet requires some study to fully master. Once you have mastered it, it is very profitable, relatively stress-free and requires little time. Remember, you need to get a good grasp of candle charting, and would do well to learn the basics of technical analysis. I hope this book helps you to join the rest of us who are able to make a living from trading the Forex market. There is no reason you should not succeed with application, study and hard work. The systems in this book will go a long way towards making you successful and I sincerely hope that you will find many, many rewarding trade setups and additions to your bank account from it! All the best and good luck! A.F Andrew Fields Professional trader and author. P.S. Remember the trade we entered in the GBP/USD on page 21 of this book, using the Power Break method? Well the result is in, and here is how it went: Recap
93 93 Expert-Forex-Systems.com Chart 56 GBP/USD power range before the move Remember that the power range was between and We set up our orders as follows: BUY , stop , target And SELL , stop , target
94 94 Expert-Forex-Systems.com Here is the chart at the close of trading in NY: Chart 57 GBP/USD after the move Notice that the first move was slightly lower to , narrowly missing our entry order to sell! The next move was higher, triggering our buy order at , and moving up through our profit target at , and banking us 40 pips! A profitable trading day. At 18:00 GMT we removed the sell order, and closed the trading station.
95 95 Expert-Forex-Systems.com P.S. Remember the trade we entered in the EUR/JPY on page 89 of this book, using the Extreme Swing method? Well the result is in, and here is how it went: (Remember this was a real time example) Chart 58. Target reached at (The 50 day SMA)! That s +320 pips in 5 days. Good luck! Disclaimer By using this book or any of its resources, you unconditionally accept and agree to the disclaimers below: CFTC RULE HYPOTHETICAL OR SIMULATED PERFORMANCE RESULTS HAVE CERTAIN LIMITATIONS. UNLIKE AN ACTUAL PERFORMANCE RECORD, SIMULATED RESULTS DO NOT REPRESENT
96 96 Expert-Forex-Systems.com ACTUAL TRADING. ALSO, SINCE THE TRADES HAVE NOT BEEN EXECUTED, THE RESULTS MAY HAVE UNDER-OR-OVER COMPENSATED FOR THE IMPACT, IF ANY, OF CERTAIN MARKET FACTORS, SUCH AS LACK OF LIQUIDITY. SIMULATED TRADING PROGRAMS IN GENERAL ARE ALSO SUBJECT TO THE FACT THAT THEY ARE DESIGNED WITH THE BENEFIT OF HINDSIGHT. NO REPRESENTATION IS BEING MADE THAT ANY ACCOUNT WILL OR IS LIKELY TO ACHIEVE PROFIT OR LOSSES SIMILAR TO THOSE SHOWN All user experiences are unique and you may do better or worse than those shown. No representation is being made that these results can or will be obtained in the future, or that losses were not incurred subsequent to the date on which the testimonial was provided. There is a substantial risk of loss associated with trading futures, forex, stocks, and options. Only risk capital should be used. Trading performance displayed herein is hypothetical. Hypothetical performance results have many inherent limitations, some of which are described below. No representation is being made that any account will or is likely to achieve profits or losses similar to those shown. In fact, there are frequently sharp differences between hypothetical performance results and the actual results subsequently achieved by any particular trading program. One of the limitations of hypothetical performance trading results is that they are generally prepared with the benefit of hindsight. In addition, hypothetical trading does not involve financial risk, and no hypothetical trading record can completely account for the impact of financial risk in actual trading. For example, the ability to withstand losses or to adhere to a particular trading program in spite of trading losses are material points which can also adversely affect actual trading results. There are numerous other factors related to the markets in general or to the implementation of any specific trading program which cannot be fully accounted for in the preparation of hypothetical performance results and all of which can adversely affect actual trading results. Trading any financial market involves risk. The E-book we sell and website and its contents is neither a solicitation nor an offer to Buy/Sell any financial market. The contents of this site are for general information purposes only. Although every attempt has been made to assure accuracy, we do not give any express or implied warranty as to its accuracy. We do not accept any liability for error or omission.
97 97 Expert-Forex-Systems.com Examples are provided for illustrative purposes and should not be construed as investment advice or strategy. No representation is being made that any account or trader will or is likely to achieve profits or loses similar to those discussed on this web site. Past performance is not indicative of future results. By purchasing the E-book, subscribing to our mailing list or using the website you will be deemed to have accepted these terms in full. This website, and its representatives do not and cannot give investment advice or invite customers to engage in investments through this web site. The intent of the E-book, newsletter, and website is for educational purposes only. This book contains references to 3rd party websites which are not our property. By providing a link to those websites it does not mean that we endorse or make any representation as to the content of those websites which you may access through the links. In no event shall and its representatives be liable, directly or indirectly, to anyone for any damage or loss arising from or occasioned by the creation, use or reliance on third party websites or the information, advertising, products, resources or material accessed through the E-book or website. The information provided on this site is not intended for distribution to, or use by any person or entity in any jurisdiction or country where such distribution or use would be contrary to law or regulation or which would subject us to any registration requirement within such jurisdiction or country. The content of this site and E-book are copyright and may not be copied or reproduced. For example, the ability to withstand losses or to adhere to a particular trading program in spite of the trading losses are material points, which can also adversely affect trading results. There are numerous other factors related to the market in general or to the implementation of any specific trading program which cannot be fully accounted for in the preparation of hypothetical performance results and all of which can adversely affect actual trading results.
98 98 Expert-Forex-Systems.com We reserve the right to change these terms and conditions without notice.
Advanced Trading Systems Collection FOREX TREND BREAK OUT SYSTEM
 FOREX TREND BREAK OUT SYSTEM 1 If you are a part time trader, this is one system that is for you. Imagine being able to take 20 minutes each day to trade. A little time at night to plan your trades and
CHART TRADING GUIDE 1
 CHART TRADING GUIDE 1 How to understand chart trading This guide is designed to teach you the basics of chart trading- the chart patterns that are covered in this booklet can be used for short and medium
New Trendlens Indicators & Functions
 New Trendlens Indicators & Functions There are 83 new indicators and functions available in TrendLens. Formation Functions Highest Value The Highest Value formation function looks back bar count number
CHART PATTERNS. www.tff-onlinetrading.com
 CHART PATTERNS Technical analysis, as you have seen in our Trading Academy videos so far, is not just about charts. It does, however, rely heavily on them and often uses chart patterns to assist in making
SPOT FX Trading Strategies. Copyright Powerup Capital Sdn Bhd
 SPOT FX Trading Strategies Currency Codes USD = US Dollar EUR = Euro JPY = Japanese Yen GBP = Great Britian Pound CHF = Swiss Franc CAD = Canadian Dollar AUD = Australian Dollar NZD = New Zealand Dollar
The Best-Kept Secret of Forex
 The Best-Kept Secret of Forex Many traders go through trading system after trading system, only to find that most of them don t work. The truth of the matter is that there are many effective trading systems
The Moving Average. 2004 W. R. Booker II. All rights reserved forever and ever. And ever.
 The Moving Average By Rob Booker 2004 W. R. Booker II. All rights reserved forever and ever. And ever. The information contained in this ebook is designed to teach you methods of watching forex quotes
Heikin-Ashi-two-Bar-Strategy Guide to Strategic and Tactical Forex Trading Pull the Trigger and Hit your Targets
 Heikin-Ashi-two-Bar-Strategy Guide to Strategic and Tactical Forex Trading Pull the Trigger and Hit your Targets Currency: EUR/JPY, GBP/JPY Time frame: 5 min Indicators: BB 14, 2, ADX 14, SSD 5, 3, 3,
Advanced Trading Systems Collection MACD DIVERGENCE TRADING SYSTEM
 MACD DIVERGENCE TRADING SYSTEM 1 This system will cover the MACD divergence. With this trading system you can trade any currency pair (I suggest EUR/USD and GBD/USD when you start), and you will always
Methods to Trade Forex Successfully for Quick Profits
 Methods to Trade Forex Successfully for Quick Profits This article is devoted to the techniques that are used to trade Forex on an intraday basis for quick profits. The aim is to make the trading a successful
Alerts & Filters in Power E*TRADE Pro Strategy Scanner
 Alerts & Filters in Power E*TRADE Pro Strategy Scanner Power E*TRADE Pro Strategy Scanner provides real-time technical screening and backtesting based on predefined and custom strategies. With custom strategies,
How I Trade Profitably Every Single Month without Fail
 How I Trade Profitably Every Single Month without Fail First of all, let me take some time to introduce myself to you. I am Kelvin and I am a full time currency trader. I have a passion for trading and
Subscriber s Guide The DT Daily Forex Report How To Access The Reports DT Just-In-Time Service For The Intermediate and Long Term Position
 Subscriber s Guide The DT Daily Forex Report The DT Daily Forex Report is for swing and short term traders who look for positions that typically last at least a few days and day traders who key off the
8 Day Intensive Course Lesson 3
 8 Day Intensive Course Lesson 3 A) What are Fibonacci Retracements? Fibonacci Retracements What are Fibonacci retracements? Levels at which the market is expected to retrace to after a strong trend. Based
THE SIMPLE PIPS GENERATING MACHINE
 THE SIMPLE PIPS GENERATING MACHINE THIRD EDITION The Brain By EKONYE G. KINGX d_analyst www.loooopfx.blogspot.com F o l l o w t h e r u l e s a n d b e s u c c e s s f u l Page 1 SPGM-3 THE BRAIN My initial
Golden Penny Stock Millionaires Golden Market Secrets For Trading Penny Stocks:
 Golden Penny Stock Millionaires Golden Market Secrets For Trading Penny Stocks: Introduction: Greetings; Hey, I m William Bell, stock analyst with the Golden Penny Stock Millionaires Financial Trading
Day Trade System EZ Trade FOREX
 Day Trade System The EZ Trade FOREX Day Trading System is mainly used with four different currency pairs; the EUR/USD, USD/CHF, GBP/USD and AUD/USD, but some trades are also taken on the USD/JPY. It uses
Technical Analysis Fibonacci Levels
 Technical Analysis Fibonacci Levels Retracements A retracement is a pullback within the context of a trend. Dip After a rise from 0 to 1, short term market participants start to take profit. This drives
Intra-Day Trading Techniques
 Pristine.com Presents Intra-Day Trading Techniques With Greg Capra Co-Founder of Pristine.com, and Co-Author of the best selling book, Tools and Tactics for the Master Day Trader Copyright 2001, Pristine
Trade Forex with Support and Resistance Strategies. By Walter Peters, Phd. BestMetatraderBroker.com
 Trade Forex with Support and Resistance Strategies By Walter Peters, Phd. BestMetatraderBroker.com 1 Important Risk Disclaimer ALL INFORMATION CONTAINED IN THIS COURSE IS FOR EDUCATIONAL PURPOSES ONLY
atching Currency Moves with The Schaff Trend Cycle Indicator
 JULY/AUGUST 2002. VOLUME 4 CRunning a trend indicator through a cycle oscillator creates an effective entry technique into today s strongly trending currency markets, says Doug Schaff, a 20-year veteran
A Candlestick Primer. By Tom Bierovic
 A Candlestick Primer By Tom Bierovic Introduction Although centuries old, Japanese candlestick charts are relatively new to the West: Steve Nison introduced them here in 1991 in his book, Japanese Candlestick
How To Make 1000 Pips Per Month And Keep It
 How To Make 1000 Pips Per Month And Keep It disclaimer The information provided in this report is for educational purposes only. It is not a recommendation to buy or sell nor should it be considered investment
Stock Breakout Profits Strategy
 Stock Breakout Profits Strategy Introduction Welcome and thank you for downloading the Stock Breakout Profits system. The Stock Breakout Profits is a complete trading strategy for trading not only the
Timing the Trade How to Buy Right before a Huge Price Advance
 Timing the Trade How to Buy Right before a Huge Price Advance By now you should have read my first two ebooks and learned about the life cycle of a market, stock, or ETF, and discovered the best indicators
Forex Success Formula. Presents. Secure Your Money. www.forexsuccessformula.com - 1 -
 Forex Success Formula Presents Secure Your Money www.forexsuccessformula.com - 1 - Risk Disclosure Statement The contents of this e-book are for informational purposes only. No Part of this publication
The First Touch Trade
 The First Touch Trade The first touch trade is a trade I use after a very strong move. The First Touch has five important components, each of these components should be in place for a valid First Touch
Candlesticks For Support And Resistance
 NOVICE TRADER Candlesticks For Support And Resistance Even as you read this, the candlestick charting technique, with its origins in Japan, is being absorbed into the ways of Western technical analysis.
Intra-Day Trading Techniques. Pristine.com Presents. Greg Capra. book, Tools and Tactics for the Master Day Trader
 Pristine.com Presents Intra-Day Trading Techniques With Greg Capra Co-Founder of Pristine.com, and Co-Author of the best selling book, Tools and Tactics for the Master Day Trader Copyright 2001, Pristine
Chapter 2.3. Technical Analysis: Technical Indicators
 Chapter 2.3 Technical Analysis: Technical Indicators 0 TECHNICAL ANALYSIS: TECHNICAL INDICATORS Charts always have a story to tell. However, from time to time those charts may be speaking a language you
MATHEMATICAL TRADING INDICATORS
 MATHEMATICAL TRADING INDICATORS The mathematical trading methods provide an objective view of price activity. It helps you to build up a view on price direction and timing, reduce fear and avoid overtrading.
The Magic Momentum Method of Trading the Forex Market
 The Magic Momentum Method of Trading the Forex Market WELCOME! Welcome to one of the easiest methods of trading the Forex market which you can use to trade most currencies, most time frames and which can
8 Day Intensive Course Lesson 5 Stochastics & Bollinger Bands
 8 Day Intensive Course Lesson 5 Stochastics & Bollinger Bands A)Trading with Stochastic Trading With Stochastic What is stochastic? Stochastic is an oscillator that works well in range-bound markets.[/i]
FOREX analysing made easy
 FOREX analysing made easy UNDERSTANDING TECHNICAL ANALYSIS An educational tool by Blackwell Global Contents Technical Analysis 2 Line Chart 3 Bar Chart 4 Candlestick Chart 5 Support and Resistance 6 Fibonacci
Ed Heath s Guerilla Swing Trading Plan (as of 1/22/13)
") Ed Heath s Guerilla Swing Trading Plan (as of 1/22/13) Synopsis: I call my trading style Guerilla Swing Trading. I trade upward momentum stocks that have pulled back for a buying opportunity and my goal
Ed Heath s Guerilla Swing Trading Plan (as of 1/22/13) Synopsis: I call my trading style Guerilla Swing Trading. I trade upward momentum stocks that have pulled back for a buying opportunity and my goal
Copyright 2010 by Kelvin Lee
 All rights reserved. No part of this publication may be reproduced, stored in a retrieval system, or transmitted, in any form or by any means, electronic, mechanical, photocopying, recording or otherwise,
TOMORROW'S TRADING TECHNOLOGY. 100% automated Fibonacci support and resistance levels that you can count on every single trading day in an instant.
 TOMORROW'S TRADING TECHNOLOGY 100% automated Fibonacci support and resistance levels that you can count on every single trading day in an instant. ProTrader Table of Contents 1. Areas A. Fibonacci Confluence
Building the Forex Traders Foundation. Greg Michalowski Email: [email protected] www.livestream.com/fxdd Twitter: gregmikefx
 Building the Forex Traders Foundation Greg Michalowski Email: [email protected] www.livestream.com/fxdd Twitter: gregmikefx Disclaimer Disclaimer High Risk Warning: All news, opinions, research, data, or other
By Josh Taylor FIND US ON: Visit our web site for TONS of training articles and videos
 By Josh Taylor FIND US ON: Visit our web site for TONS of training articles and videos This information is meant to be a guide to help you learning how to be a better Forex trader. In this guide there
Subscriber s Guide The DT Daily Forex Report How To Access The Reports DT Just-In-Time Service For The Intermediate and Long Term Position
 Subscriber s Guide The DT Daily Forex Report The DT Daily Forex Report is for swing traders who look for positions that typically last at least a few days or more and day traders who key off the short
CHAPTER 8. REVERSAL TRADING STRATEGIES
 CHAPTER 8. REVERSAL TRADING STRATEGIES Today you will Learn Reversal trading strategies are great or mid-day and afternoon trades, especially on days when momentum is a big slower. Why Is This Important?
Escalator to Pips Pipping Your Way to The Top
 Pipping Your Way to the Top Page 1 of 1 Escalator to Pips Pipping Your Way to The Top Presented April 4, 2007 To the reader s of Forex Factory May all your trades be successful ones DISCLAIMER: We accept
Elliott-Wave Fibonacci Spread Trading
 Elliott-Wave Fibonacci Spread Trading Presented by Ryan Sanden The inevitable disclaimer: Nothing presented constitutes a recommendation to buy or sell any security. While the methods described are believed
4 Hour MACD Forex Strategy
 4 Hour MACD Forex Strategy Welcome to the 4 Hour MACD Forex Strategy. This strategy is aimed at simplicity as well as high probability trades. I have been in the equity market for almost ten years now
An Objective Leading Indicator Fibonacci Retracements
 An Objective Leading Indicator Fibonacci Retracements This article explains how to use Fibonacci as a leading indicator, combining it with other technical analysis tools to provide precise, objective entry
AN INTRODUCTION TO TRADING CURRENCIES
 The ins and outs of trading currencies AN INTRODUCTION TO TRADING CURRENCIES A FOREX.com educational guide K$ $ kr HK$ $ FOREX.com is a trading name of GAIN Capital - FOREX.com Canada Limited is a member
Candlesticks. Bar Charts CANDLESTICK CORNER. When you look at your charts, do you understand everything they re telling you? by Rudy Teseo BEARISH
 Stocks & ommodities V. 20:2 (65-69): andlesticks Vs. ar harts by Rudy Teseo NLESTIK ORNER VS andlesticks ar harts When you look at your charts, do you understand everything they re telling you? by Rudy
USING CANDLESTICK CHARTS TO TRADE FOREX
 CONTENTS Disclaimer Introduction Candlestick Chart Origins Candlestick Chart Definition Single Candlestick Patterns Multiple Candlestick Chart Patterns Two Candlestick Pattern Formations Three Candlestick
DAY TRADING WITH THE INSTITUTIONS by Jay Wireman
 DAY TRADING WITH THE INSTITUTIONS by Jay Wireman Welcome everyone to my top day trading setups. Below you will find my powerful techniques using my proprietary symmetry software package that I have developed
FOREX PROFIT MASTER USER GUIDE. http://www.forexprofitmaster.com
 FOREX PROFIT MASTER USER GUIDE http://www.forexprofitmaster.com DISCLAIMER Please be aware of the loss, risk, personal or otherwise consequences of the use and application of this book s content. The author
12 Signals to Master any Market'
 12 Signals to Master any Market' Master these Major Candlestick Signals if you want to Master the Market. Copyright Stephen W. Bigalow 2007 May not be duplicated or distributed Published by The Candlestick
Understanding the market
 Understanding the market Technical Analysis Approach: part I Xiaoguang Wang President, Purdue Quantitative Finance Club PhD Candidate, Department of Statistics Purdue University [email protected] Outline
Using Formations To Identify Profit Opportunities
 Using Formations To Identify Profit Opportunities Using Formations To Identify Profit Opportunities The concepts and strategies discussed may not be suitable for all investors. It is important that investors
marketsurvival.net guide: The advanced guide to fibonacci trading How to trade stocks and Forex with Fibonacci numbers
 marketsurvival.net guide: The advanced guide to fibonacci trading How to trade stocks and Forex with Fibonacci numbers Contents FOREWORD... 5 PART 1. INTRODUCTION...7 WHY IS USING THE FIBONACCI TOOLS BETTER
Take it E.A.S.Y.! Dean Malone 4X Los Angeles Group - HotComm January 2007
 Take it E.A.S.Y.! Dean Malone 4X Los Angeles Group - HotComm January 2007 Dean Malone Partner of Compass Foreign Exchange, LLC. Co-Founder of Forex Signal Service.com. Previous Senior National for 4X Made
Stochastic Oscillator.
 Stochastic Oscillator. By Jay Lakhani www.4x4u.net George Lane was the originator of the stochastic indicator in the 1960 s; the indicator tracks the market momentum. Lane observed that as prices rise
6. Get Top Trading Signals with the RSI
 INTERMEDIATE 6. Get Top Trading Signals with the RSI The Relative Strength Index, or RSI, is one of the most popular momentum indicators in technical analysis. The RSI is an oscillator that moves between
Forex Success Formula
 Forex Success Formula WWW.ForexSuccessFormula.COM Complimentary Report!! Copyright Protected www.forexsuccessformula.com - 1 - Limits of liability/disclaimer of Warranty The author and publishers of this
Forex Volatility Patterns
 Spotting Early Breakouts Forex Volatility Patterns BRUCE WALDMAN Want to catch 40 to 00 pips in each trade? Here s how you can find those entry and exit signals to make your forex trading a success. C
CURRENCY TRADING Using Swing Breakouts in Forex Trading
 CURRENCY TRADING Using Swing Breakouts in Forex Trading 28 MAY 2009 Doug Schaff discusses the use of intermediate swing highs and swing lows to develop a shortterm approach to trading the currency markets.
Disclaimer: The authors of the articles in this guide are simply offering their interpretation of the concepts. Information, charts or examples
 Disclaimer: The authors of the articles in this guide are simply offering their interpretation of the concepts. Information, charts or examples contained in this lesson are for illustration and educational
THIS IS THE TRADING METHOD FOR THE STEALTH FOREX TRADING SYSTEM V10
 THIS IS THE TRADING METHOD FOR THE STEALTH FOREX TRADING SYSTEM V10 YOU SHOULD HAVE ALREADY READ AND APPLIED THE INFORMATION IN THE SET-UP DOCUMENT. IF YOU HAVE NOT ALREADY DONE SO - PLEASE COMPLETE SET
My Techniques for making $150 a Day Trading Forex *Note for my more Advanced Strategies check out my site: Click Here
 My Techniques for making $150 a Day Trading Forex *Note for my more Advanced Strategies check out my site: Click Here The Strategy We will be looking at 2 different ways to day trade the Forex Markets.
Forex Basics brought to you by MatrasPlatform.com
 Forex Basics brought to you by MatrasPlatform.com Table of Content What is FOREX... 3 FOREX Basics... 4 Trading Hours... 4 What Is Traded on FOREX?... 4 The Six Majors... 4 Currency Pair Distribution...
TRAITS OF SUCCESSFUL TRADERS: a four part series
 TRAITS OF SUCCESSFUL TRADERS: a four part series Research & Analysis: DailyFX Over the past several months, the DailyFX research team and the DailyFX trading instructors have been closely studying the
Introduction to Forex Trading
 Introduction to Forex Trading The Leader in Rule-Based Trading 1 Important Information and Disclaimer: TradeStation Securities, Inc. seeks to serve institutional and active traders. Please be advised that
ForexIndicator.org. Presents. Written By Kelvin Lee
 ForexIndicator.org Presents Written By Kelvin Lee All rights reserved. No part of this publication may be reproduced, stored in a retrieval system, or transmitted, in any form or by any means, electronic,
Forex Success Formula Presents Forex Success Mini Forex Success Formula Presents Forex Success Mini
 Forex Success Formula Presents Forex Success Mini - 1 www.forexsuccessformula.com/forextradingblog Risk Disclosure Statement The contents of this e-book are for informational purposes only. No Part of
Trading System: BatFink Daily Range (A) Investment Market: Forex
 Investment Market: Forex") 1. Level Trading System: BatFink Daily Range (A) Investment Market: Forex Daily-Range trading technique used to capitalise on high daily range price moving pairs Author MarkJ Related Thread Reference Version
1. Level Trading System: BatFink Daily Range (A) Investment Market: Forex Daily-Range trading technique used to capitalise on high daily range price moving pairs Author MarkJ Related Thread Reference Version
The Blade Forex Strategies
 The Blade Forex Strategies The Blade Forex Strategies and every word, sentence, and paragraph contained within are copyrighted under he UK Copyright Service and protected under UK and international law.
The Forex Profit System :
 The Forex Profit System : How to Earn $50 to $500 a day Forex Trading from the Comfort of Your Own Home! OVERVIEW Dear Friend, Thanks for your interest in my Forex Profit System. The Forex Profit System
Master Candle E-book
 Master Candle E-book Copyright 2009 www.forexbunker.com Page 1 ALL RIGHTS RESERVED. No part of this publication may be reproduced, stored in a retrieval system, or transmitted in any form or by any means,
www.60seconds2profit.com
 TABLE OF CONTENTS I. 60 Second Binary Options- Make 75% a Minute II. Binary Options Basics III. Why Trade Binary Options IV. What are 60 Second Binary Options V. How to Trade 60 Second Binary Options VI.
Understanding the market with PVSRA
 Understanding the market with PVSRA PVSRA PVSRA stands for Price, Volume, Support, Resistance Analysis. Price includes consideration of individual candlestick configurations as well as the pattern, or
The Art of Ichimoku. By James Stanley Trading Coach DailyFX EDU [email protected]
 1 The Art of Ichimoku By James Stanley Trading Coach DailyFX EDU [email protected] This information is provided to you for educational purposes only. This article does not suggest that you will experience
DAY TRADING WITH THE INSTITUTIONS by Jay Wireman
 DAY TRADING WITH THE INSTITUTIONS by Jay Wireman Welcome everyone to my top day trading setups. Below you will find my powerful techniques using my proprietary symmetry software package that I have developed
Chapter 1.4 Trends 0
 Chapter 1.4 Trends 0 TECHNICAL ANALYSIS: TRENDS, SUPPORT AND RESISTANCE Charts, charts, charts. When most people think about trading Forex, they think about watching price movements flash by them on the
Action Forex Company Limited 2012
 1 TABLE OF CONTENTS TABLE OF CONTENTS... 2 INTRODUCTION... 3 CHAPTER 1 - USE OF CANDLESTICK CHARTS... 4 1.1 MORE BULLISH PATTERNS... 5 Piercing Line... 5 Three White Soldiers... 6 Rising Three Methods...
by Mark Rose Read candlestick charts accurately Spot patterns quickly and easily Use that information to make profitable trading decisions
 Everything you wanted to know about candlestick charts by Mark Rose Read candlestick charts accurately Spot patterns quickly and easily Use that information to make profitable trading decisions Contents
Forex Scalping Cheat Sheets
 Forex Scalping Cheat Sheets By Jason Fielder IMPORTANT: As an added bonus for downloading this report, you also received additional Forex trading reports and videos. To access your bonuses, go to: http://www.triadformula.com/blog/download-cheat-sheets/
RISK DISCLOSURE STATEMENT / DISCLAIMER AGREEMENT
 RISK DISCLOSURE STATEMENT / DISCLAIMER AGREEMENT Trading any financial market involves risk. This report and all and any of its contents are neither a solicitation nor an offer to Buy/Sell any financial
SYNERGY Trading Method. CompassFX, 2009 www.compassfx.com Rev. 81009
 SYNERGY Trading Method SYNERGY Method INSTALLATION Basic Synergy is designed to automatically download onto the C: drive of your computer. If your local drive is not the C: drive, please send an email
A Primer On Technical Analysis. Written by. Available at
 A Primer On Technical Analysis Written by Available at Page 1 of 23 Overview Technical Analysis (Versus Fundamental Analysis) Technical analysis is a method of forecasting price movements by looking at
More informed trading Technical Analysis: Trading Using Multiple Time-frames
 Technical Analysis: Trading Using Multiple Time-frames Intermediate Level Introduction 1 Stock markets worldwide function because, at any given time, some traders want to buy whilst others want to sell.
OPENING RANGE BREAKOUT (ORB- Advanced)
") OPENING RANGE BREAKOUT (ORB- Advanced) Weekly volatility breakout strategy. On Monday morning check the London opening price, 08.00 GMT. The difference between this weekly ORB Basic and this ORB Advanced
OPENING RANGE BREAKOUT (ORB- Advanced) Weekly volatility breakout strategy. On Monday morning check the London opening price, 08.00 GMT. The difference between this weekly ORB Basic and this ORB Advanced
Simple & Consistent Fibonacci Method Prepared by: Simone Guy. {Free learning resource: NOT FOR RESALE}
 Simple & Consistent Fibonacci Method Prepared by: Simone Guy {Free learning resource: NOT FOR RESALE} 3/13/2010 Overview This is a mechanical trading method that is based on Support and Resistance. The
THE MOST POWERFUL DAY TRADING SETUP PERIOD!
 THE MOST POWERFUL DAY TRADING SETUP PERIOD! In this pdf I will show you how I combine my institutional numbers with my 40-60 number count 9 and 13 setups. Below you will find my concrete rules on when
Intro to Forex and Futures
 Intro to Forex and Futures 1 Forex Trading Forex is a term meaning foreign exchange, and refers to trading the currency of one country against the currency from another country simultaneously. Over $1.4
My Favorite Futures Setups. By John F. Carter www.tradethemarkets.com
 My Favorite Futures Setups By John F. Carter www.tradethemarkets.com Recognizing Momentum Incredibly easy to do in hindsight. Get in Before the Move? I m a big believer in not chasing markets. By the time
Nexgen Software Services
 Nexgen Software Services Trading Guide June 2016 2016 Nexgen Software Services Inc. Please read and understand the following disclaimers before proceeding: Futures, FX and SECURITIES and or options trading
LET S GET TO KNOW FOREX
 LET S GET TO KNOW FOREX AN INTRODUCTION TO TRADING CURRENCIES A FOREX.COM EDUCATIONAL GUIDE LET S GET TO KNOW FOREX AN INTRODUCTION TO TRADING CURRENCIES 4 INTRODUCTION: THE BULLS & THE BEARS 6 WHAT IS
The Day Trade Forex System: The ULTIMATE Step-By-Step Guide to Online Currency Trading
 The Day Trade Forex System: The ULTIMATE Step-By-Step Guide to Online Currency Trading How You Can Earn $50 to $500 A Day Currency Trading From The Comfort of Your Own Home! By Erol Bortucene and Cynthia
The Truth About 60 Second Binary Options TABLE OF CONTENTS. I. 60 Second Binary Options- Make 75% a Minute. Binary Options Basics
 TABLE OF CONTENTS I. 60 Second Binary Options- Make 75% a Minute II. Binary Options Basics III. Why Trade Binary Options IV. What are 60 Second Binary Options V. How to Trade 60 Second Binary Options VI.
Trend Determination - a Quick, Accurate, & Effective Methodology
 Trend Determination - a Quick, Accurate, & Effective Methodology By; John Hayden Over the years, friends who are traders have often asked me how I can quickly determine a trend when looking at a chart.
START-UP MANUAL FOR MTI 4.0 TECHNICAL ANALYSIS CHARTING
 START-UP MANUAL FOR MTI 4.0 TECHNICAL ANALYSIS CHARTING Introduction Thank you for your subscription to the MTI 4.x Technical Analysis Charting Program, the only true Multiple Time Frame Analysis Platform.
Action Forex Company Limited 2010
 1 2 Sponsored by 3 TABLE OF CONTENTS TABLE OF CONTENTS... 4 INTRODUCTION... 5 CHAPTER 1 CHART ANALYSIS IN CURRENCY TRADING... 6 1.1 - IMPORTANCE OF CHART ANALYSIS IN CURRENCY TRADING... 6 1.2 - BASIC CHART
SECRETS OF FOREX SCALPING: Cheat Sheets
 SECRETS OF FOREX SCALPING: Cheat Sheets Reviewed and recommended by Rita Lasker & Green Forex Group Disclaimer Please be aware of the loss, risk, personal or otherwise consequences of the use and application
LET S GET TO KNOW FOREX
 LET S GET TO KNOW FOREX Introduction Whether you re a power trader or a financial newbie, you re likely to hear just about anything market movements, outlooks and stocks being described as bullish or bearish.
均 衡 表 Ichimoku Kinkō Hyō
 均 衡 表 Ichimoku Kinkō Hyō Hello Forex Winners! On this book we will talk about Ichimoku Kinko Hyo indicator and will show many pictures to make it easy for you. Ichimoku Winners e-book is free on ForexWinners.Net
FOREXOMETRY.COM. Presents. Forex Profit Hawk
 FOREXOMETRY.COM Presents Forex Profit Hawk Forexometry Published by Alaziac Trading CC Suite 509, Private Bag X503 Northway, 4065, KZN, ZA www.forexometry.com Copyright 2014 by Alaziac Trading CC, KZN,