Only by high growth rates sustained for long periods of time.
|
|
|
- Albert Campbell
- 7 years ago
- Views:
Transcription
1 Chapter 1 IntroductionandGrowthFacts 1.1 Introduction In 2000, GDP per capita in the United States was $32500 (valued at 1995 $ prices). This high income level reflects a high standard of living. In contrast, standard of living is much lower in many other countries: $9000 in Mexico, $4000 in China, $2500 in India, and only $1000 in Nigeria (all figures adjusted for purchasing power parity). How can countries with low level of GDP per person catch up with the high levels enjoyed by the United States or the G7? Only by high growth rates sustained for long periods of time. Small differences in growth rates over long periods of time can make huge differences in final outcomes. 1
. How can countries with low level of GDP per person catch up with the high levels enjoyed by the United States or the G7?")
2 George-Marios Angeletos US per-capita GDP grew by a factor 10 from 1870 to 2000: In 1995 prices, it was $3300 in 1870 and $32500 in Average growth rate was 1.75%. If US had grown with.75% (like India, Pakistan, or the Philippines), its GDP would be only $8700 in 1990 (i.e., 1/4 of the actual one, similar to Mexico, less than Portugal or Greece). If US had grown with 2.75% (like Japan or Taiwan), its GDP would be $ in 1990 (i.e., 3.5 times the actual one). At a growth rate of 1%, our children will have 1.4 our income. At a growth rate of 3%, our children will have 2.5 our income. Some East Asian countries grew by 6% over ; this is a factor of 6 within just one generation!!! Once we appreciate the importance of sustained growth, the question is natural: What candotomakegrowthfaster? Equivalently: What are the factors that explain differences in economic growth, and how can we control these factors? In order to prescribe policies that will promote growth, we need to understand what are the determinants of economic growth, as well as what are the effects of economic growth on social welfare. That s exactly where Growth Theory comes into picture... 1 Let y 0 be the GDP per capital at year 0, y T the GDP per capita at year T, and x the average annual growth rate over that period. Then, y T =(1+x) T y 0. Taking logs, we compute ln y T ln y 0 = T ln(1 + x) Tx, or equivalenty x (ln y T ln y 0 )/T. 2

3 Lecture Notes 1.2 The World Distribution of Income Levels and Growth Rates As we mentioned before, in 2000 there were many countries that had much lower standards of living than the United States. This fact reflects the high cross-country dispersion in the level of income. Figure 1 2 shows the distribution of GDP per capita in 2000 across the 147 countries in the Summers and Heston dataset. The richest country was Luxembourg, with $44000 GDP per person. The United States came second, with $ The G7 and most of the OECD countries ranked in the top 25 positions, together with Singapore, Hong Kong, Taiwan, and Cyprus. Most African countries, on the other hand, fell in the bottom 25 of the distribution. Tanzania was the poorest country, with only $570 per person that is, less than 2% of the income in the United States or Luxemburg! Figure 2 shows the distribution of GDP per capita in 1960 across the 113 countries for which data are available. The richest country then was Switzerland, with $15000; the United States was again second, with $13000, and the poorest country was again Tanzania, with $450. The cross-country dispersion of income was thus as wide in 1960 as in Nevertheless, there were some important movements during this 40-year period. Argentina, Venezuela, Uruguay, Israel, and South Africa were in the top 25 in 1960, but none made it to the top 25 in On the other hand, China, Indonesia, Nepal, Pakistan, India, and Bangladesh grew fast enough to escape the bottom 25 between 1960 and Figures 1, 2 and 3 are reproduced from Barro (2003). 3

4 George-Marios Angeletos These large movements in the distribution of income reflects sustained differences in therateofeconomicgrowth. Figure 3 shows the distribution of the growth rates the countries experienced between 1960 and Just as there is a great dispersion in income levels, there is a great dispersion in growth rates. The mean growth rate was 1.8% per annum; that is, the world on average was twice as rich in 2000 as in The United States did slightly better than the mean. The fastest growing country was Taiwan, with a annual rate as high as 6%, which accumulates to a factor of 10 over the 40-year period. The slowest growing country was Zambia, with an negative rate at 1.8%; Zambia s residents show their income shrinking to half between 1960 and Most East Asian countries (Taiwan, Singapore, South Korea, Hong Kong, Thailand, China, and Japan), together with Bostwana (an outlier as compared to other sub- Saharan African countries), Cyprus, Romania, and Mauritus, had the most stellar growth performances; they were the growth miracles of our times. Some OECD countries (Ireland, Portugal, Spain, Greece, Luxemburg and Norway) also made it to the top 20 of the growth-rates chart. On the other hand, 18 out of the bottom 20 were sub-saharan African countries. Other notable growth disasters were Venezuela, Chad and Iraq. 1.3 Unconditional versus Conditional Convergence There are important movements in the world income distribution, reflecting substantial differences in growth rates. Nonetheless, on average income and productivity differences are very persistent. 4

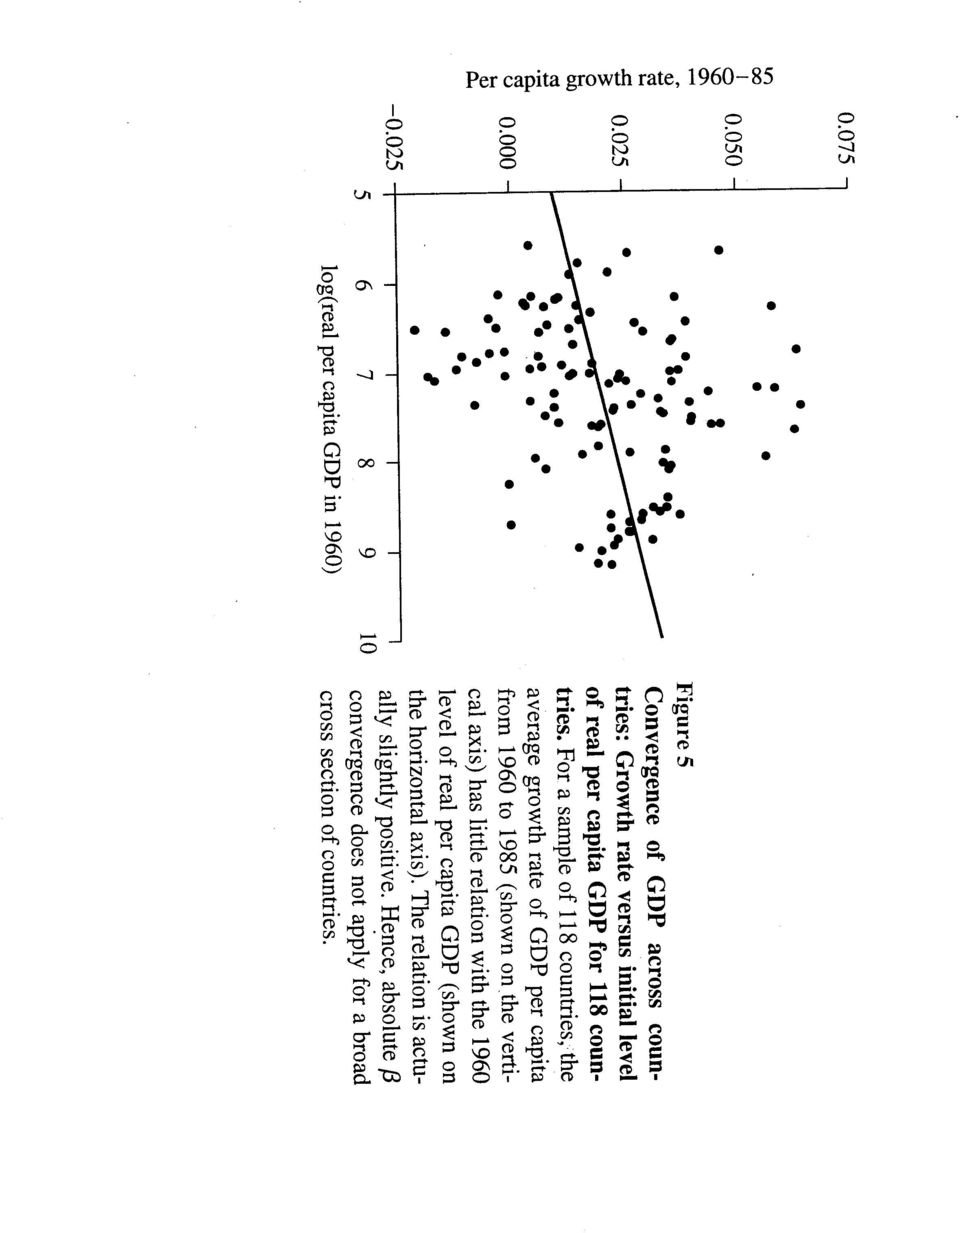
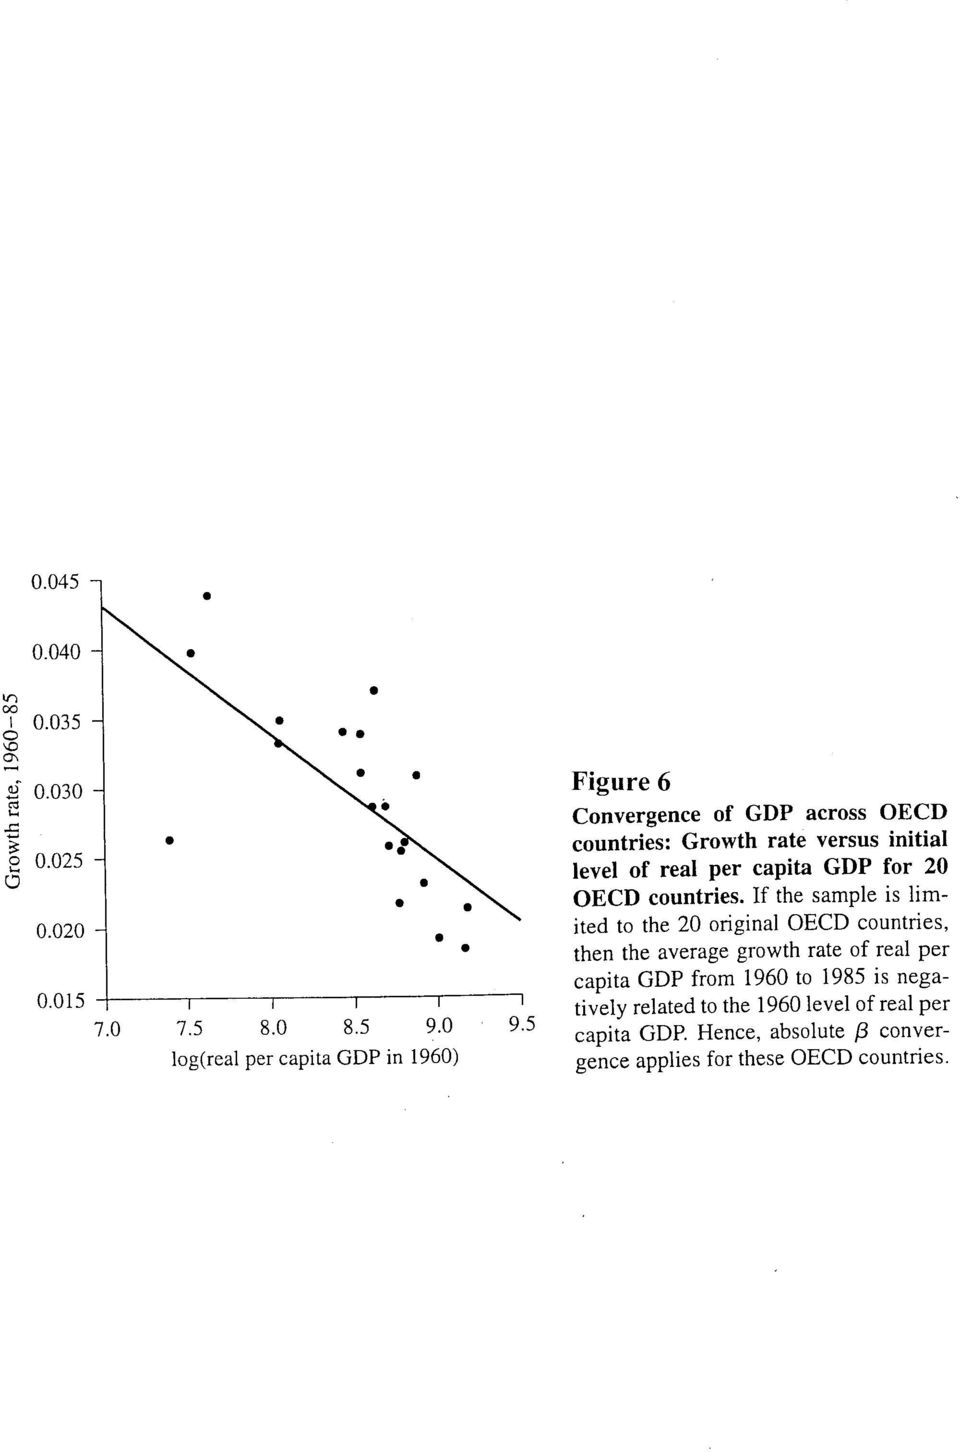
5 Lecture Notes Figure 4 3 graphs a country s GDP per worker in 1988 (normalized by the US level) against the same country s GDP per worker in 1960 (again normalized by the US level). Most observations close to the 45 o -line, meaning that most countries did not experienced a dramatic change in their relative position in the world income distribution. In other words, income differences across countries are very persistent. This also means that poor countries on average do not grow faster than rich countries. And another way to state the same fact is that unconditional convergence is zero. That is, if we ran the regression ln y = α + β ln y 1960, the estimated coefficient β is zero. On the other hand, consider the regression ln y = α + β ln y γ X 1960 where X 1960 is a set of country-specific controls, such as levels of education, fiscal and monetary policies, market competition, etc. Then, the estimated coefficient β turns to be positive (in particular, around 2% per annum). Therefore, if we look in a group of countries that share similar characteristics (as measured by X), the countries with lower intial income tend to grow faster than their rich counterparts, and therefore the poor countries tend to catch up with the rich countries in the same group. This is what we call conditional convergence. Conditional convergence is illustrated in Figures 5 and 6, for the group of OECD countries and the group of US states, respectively. 3 Figure 4 is reproduced from Jones (1997). 5

6 1.4 Stylized Facts George-Marios Angeletos The following are stylized facts that should guide us in the modeling of economic growth (Kaldor, Kuznets, Romer, Lucas, Barro, Mankiw-Romer-Weil, and others): 1. In the short run, important fluctuations: Output, employment, investment, and consumptio vary a lot across booms and recessions. 2. Inthelongrun,balancedgrowth: Output per worker and capital per worker (Y/L and K/L) grow at roughly constant, and certainly not vanishing, rates. The capital-tooutput ratio (K/Y ) is nearly constant. The return to capital (r ) is roughly constant, whereas the wage rate (w) grows at the same rates as output. And, the income shares of labor and capital (wl/y and rk/y ) stay roughly constant. 3. Substantial cross-country differences in both income levels and growth rates. 4. Persistent differences versus conditional convergence. 5. Formal education: Highly correlated with high levels of income (obviously two-direction causality); together with differences in saving rates can explain a large fraction of the cross-country differences in output; an important predictor of high growth performance. 6. R&D and IT: Most powerful engines of growth (but require high skills at the first place). 7. Government policies: Taxation, infrastructure, inflation, law enforcement, property rights and corruption are important determinants of growth performance. 8. Democracy: An inverted U-shaped relation; that is, autarchies are bad for growht, and democracies are good, but too much democracy can slow down growth. 6
 is roughly constant, whereas the wage rate (w) grows at the same rates as output. And, the income shares of labor and capital (wl/y and rk/y ) stay roughly constant. 3.")
7 Lecture Notes 9. Openness: International trade and financial integration promote growth (but not necessarily if it is between the North and the South). 10. Inequality: The Kunzets curve, namely an inverted U-shaped relation between income inequality and GDP per capita (growth rates as well). 11. Ferility: High fertility rates correlated with levels of income and low rates of economic growth; and the process of development follows a Malthus curve, meaning that fertility rates initially increase and then fall as the economy develops. 12. Financial markets and risk-sharing: Banks, credit, stock markets, social insurance. 13. Structural transformation: agriculture manifacture services. 14. Urbanization: family production organized production; small vilages big cities; extended domestic trade. 15. Other institutional and social factors: colonial history, ethnic heterogeneity, social norms. The theories of economic growth that we will review in this course seek to explain how all the above factors interrelate with the process of economic growth. Once we understand better the mechanics of economic growth, we will be able, not only to predict economic performance for given a set of fundamentals (positive analysis), but also to identify what government policies or socio-economic reforms can promote social welfare in the long run (normative analysis). 7

8 20 16 China Peru Brazil Russia France Japan UK 12 Nigeria Uganda Bangladesh Haiti Colombia Iran Portugal S. Korea 8 4 Malawi Zambia Honduras Pakistan Indonesia Philippines Mexico Poland Israel Spain Hong Kong Singapore USA Ethiopia Tanzania 0 Kenya Mozambique Bolivia India Argentina Hungary GDP per person in 2000 Luxembourg Figure 1 The World s Distribution of GDP per Person in 2000 (reproduced from Barro, 2003) The graph shows the distribution of gross domestic product (GDP) per person for 147 countries in The horizontal axis is in 1995 U.S. dollars and uses a logarithmic scale. Representative countries are indicated for the various ranges of GDP per person.
 per person for 147 countries in 2000. The horizontal axis is in 1995 U.S. dollars and uses a logarithmic scale.")
9 20 number of countries Tanzania 0 China Indonesia Ethiopia Uganda India Nigeria Romania Thailand S. Korea Taiwan Iran Zimbabwe Brazil Singapore Turkey Greece Hong Kong Japan Mexico Spain Israel Venezuela Argentina France Canada W. Germany UK Australia USA Switzerland GDP per person in 1960 Figure 2 The World s Distribution of GDP per Person in 1960 (reproduced from Barro, 2003) The graph shows the distribution of GDP per person for 113 countries in The horizontal axis is in 1995 U.S. dollars and uses a logarithmic scale. Representative countries are indicated for the various ranges of GDP per person. 2

10 28 number of countries Bolivia Ghana Nigeria Venezuela Mozambique Nicaragua Cent. Afr. Rep. Zambia Argentina New Zealand S. Africa Switzerland Australia Canada Chile Mexico UK USA Brazil France India Israel Italy Mauritius China Indonesia Ireland Japan Malaysia Spain Botswana Cyprus Hong Kong S. Korea Singapore Taiwan g r o w t h rate of GDP per person, Figure 3 The World s Distribution of Growth Rates of GDP per Person, (reproduced from Barro, 2003) The graph shows the distribution of the annual growth rate of GDP per person for 111 countries from 1960 to Representative countries are indicated for the various ranges of growth rates. 3
 The graph shows")
11

12
13
14

FDI performance and potential rankings. Astrit Sulstarova Division on Investment and Enterprise UNCTAD
 FDI performance and potential rankings Astrit Sulstarova Division on Investment and Enterprise UNCTAD FDI perfomance index The Inward FDI Performance Index ranks countries by the FDI they receive relative
Bangladesh Visa fees for foreign nationals
 Bangladesh Visa fees for foreign nationals No. All fees in US $ 1. Afghanistan 5.00 5.00 10.00 2. Albania 2.00 2.00 3.00 3. Algeria 1.00 1.00 2.00 4. Angola 11.00 11.00 22.00 5. Argentina 21.00 21.00 42.00
Global AML Resource Map Over 2000 AML professionals
 www.pwc.co.uk Global AML Resource Map Over 2000 AML professionals January 2016 Global AML Resources: Europe France Italy Jersey / Guernsey 8 Ireland 1 Portugal 7 Luxembourg 5 United Kingdom 1 50 11 Spain
How To Calculate The Lorenz Curve
 FACT SHEET 1. Overview 1.1 Developed by an Italian statistician Corrado in the 1910s, is commonly used to indicate income inequality in a society. is a number which has a value between zero and one. As
List of tables. I. World Trade Developments
 List of tables I. World Trade Developments 1. Overview Table I.1 Growth in the volume of world merchandise exports and production, 2010-2014 39 Table I.2 Growth in the volume of world merchandise trade
Appendix 1: Full Country Rankings
 Appendix 1: Full Country Rankings Below please find the complete rankings of all 75 markets considered in the analysis. Rankings are broken into overall rankings and subsector rankings. Overall Renewable
World Consumer Income and Expenditure Patterns
 World Consumer Income and Expenditure Patterns 2014 14th edi tion Euromonitor International Ltd. 60-61 Britton Street, EC1M 5UX TableTypeID: 30010; ITtableID: 22914 Income Algeria Income Algeria Income
MAUVE GROUP GLOBAL EMPLOYMENT SOLUTIONS PORTFOLIO
 MAUVE GROUP GLOBAL SOLUTIONS PORTFOLIO At Mauve Group, we offer a variety of complete employee management services such as Global Employment Solutions (GES), Professional Employment Outsourcing (PEO),
Dividends Tax: Summary of withholding tax rates per South African Double Taxation Agreements currently in force Version: 2 Updated: 2012-05-22
 Dividends Tax: Summary of withholding tax rates per South African Double Taxation Agreements currently in force Version: 2 Updated: 2012-05-22 Note: A summary of the rates and the relevant provisions relating
Contact Centers Worldwide
 A Contact Centers Worldwide Country Tel.no. Supported lang. Contact Center Albania Algeria 852 665 00 +46 10 71 66160 Angola 89900 +34 91 339 2121 (Port) and Portuguese +34 913394044 +34 913394023 (Por)
International Financial Reporting Standards
 International Financial Reporting Standards Of Growing Importance for U.S. Companies Assurance Services there is no longer a choice Three factors may influence your need to consider IFRS. First, many organizations
Foreign Taxes Paid and Foreign Source Income INTECH Global Income Managed Volatility Fund
 Income INTECH Global Income Managed Volatility Fund Australia 0.0066 0.0375 Austria 0.0045 0.0014 Belgium 0.0461 0.0138 Bermuda 0.0000 0.0059 Canada 0.0919 0.0275 Cayman Islands 0.0000 0.0044 China 0.0000
I. World trade developments
 I. World trade developments The value of world merchandise exports increased by 20 per cent in 2011 while exports of commercial services grew by 11 per cent. Key developments in 2011: a snapshot Trade
The big pay turnaround: Eurozone recovering, emerging markets falter in 2015
 The big pay turnaround: Eurozone recovering, emerging markets falter in 2015 Global salary rises up compared to last year But workers in key emerging markets will experience real wage cuts Increase in
DSV Air & Sea, Inc. Aerospace Sector. DSV Air & Sea, Inc. Aerospace
 DSV Air & Sea, Inc. Aerospace Sector DSV Air & Sea, Inc. Aerospace Introduction to DSV DSV is a global supplier of transport and logistics services. We have offices in more than 70 countries and an international
Global Effective Tax Rates
 www.pwc.com/us/nes Global s Global s April 14, 2011 This document has been prepared pursuant to an engagement between PwC and its Client. As to all other parties, it is for general information purposes
HAS BRAZIL REALLY TAKEN OFF? BRAZIL LONG-RUN ECONOMIC GROWTH AND CONVERGENCE
 HAS BRAZIL REALLY TAKEN OFF? BRAZIL LONG-RUN ECONOMIC GROWTH AND CONVERGENCE COUNTRY PROFILE: A COUNTRY IN TRANSFORMATION POLICY RECOMENDATIONS COUNTRY PROFILE Brazilian Equivalent Population in The World
Quantitative significance of growth Inequality and poverty. Sources of growth Global imbalance Tensions and risks
 The Role of Growth in Development by Danny Quah Economics Department, LSE Wednesday 13 February 28 Overseas Development Institute, London Conclusions Quantitative significance of growth Inequality and
From Wikipedia, the free encyclopedia http://en.wikipedia.org/wiki/gini_coefficient
 Gini coefficient From Wikipedia, the free encyclopedia http://en.wikipedia.org/wiki/gini_coefficient Graphical representation of the Gini coefficient The Gini coefficient is a measure of inequality of
Carnegie Mellon University Office of International Education Admissions Statistics for Summer and Fall 2013
 Carnegie Mellon University Admissions Statistics for and Fall 2013 New International Students and Fall 2012 Undergraduate 270 14.3% Master's 1301 68.7% Doctorate 192 10.1% Exchange 99 5.2% 31 1.6% Total
Logix5000 Clock Update Tool V2.00.36. 12/13/2005 Copyright 2005 Rockwell Automation Inc., All Rights Reserved. 1
 Logix5000 Clock Update Tool V2.00.36. 1 Overview Logix5000 Clock Update Tool 1. 1. What is is it? it? 2. 2. How will it it help me? 3. 3. How do do I I use it? it? 4. 4. When can I I get get it? it? 2
Carnegie Mellon University Office of International Education Admissions Statistics for Summer and Fall 2010
 Carnegie Mellon University Admissions Statistics for and Fall 2010 New International Students and Fall 2010 Undergraduate 208 16.1% Master's 799 61.7% Doctorate 177 13.7% Exchange 80 6.2% 31 2.4% Total
Consolidated International Banking Statistics in Japan
 Total (Transfer Consolidated cross-border claims in all currencies and local claims in non-local currencies Up to and including one year Maturities Over one year up to two years Over two years Public Sector
Senate Committee: Education and Employment. QUESTION ON NOTICE Budget Estimates 2015-2016
 Senate Committee: Education and Employment QUESTION ON NOTICE Budget Estimates 2015-2016 Outcome: Higher Education Research and International Department of Education and Training Question No. SQ15-000549
Chapter 4A: World Opinion on Terrorism
 1 Pew Global Attitudes Project, Spring 2007 Now I m going to read you a list of things that may be problems in our country. As I read each one, please tell me if you think it is a very big problem, a moderately
EMEA BENEFITS BENCHMARKING OFFERING
 EMEA BENEFITS BENCHMARKING OFFERING COVERED COUNTRIES SWEDEN FINLAND NORWAY ESTONIA R U S S I A DENMARK LITHUANIA LATVIA IRELAND PORTUGAL U. K. NETHERLANDS POLAND BELARUS GERMANY BELGIUM CZECH REP. UKRAINE
2015 Growth in data center employment continues but the workforce is changing
 Published in Conjunction with MARKET BRIEFING GLOBAL DATA CENTER EMPLOYMENT 2015 2015 Growth in data center employment continues but the workforce is changing Globally, the number of people working in
Composition of Premium in Life and Non-life Insurance Segments
 2012 2nd International Conference on Computer and Software Modeling (ICCSM 2012) IPCSIT vol. 54 (2012) (2012) IACSIT Press, Singapore DOI: 10.7763/IPCSIT.2012.V54.16 Composition of Premium in Life and
Brandeis University. International Student & Scholar Statistics
 1 Brandeis University International Student & Scholar Statistics 2014 2 TABLE OF CONTENTS OVERVIEW OF INTERNATIONAL STUDENT & SCHOLAR POPULATION 3 DETAILED INFORMATION ON INTERNATIONAL STUDENT POPULATION
ISRAEL S ECONOMIC GROWTH: AN INTERNATIONAL COMPARISON 1 ELHANAN HELPMAN *
 ISRAEL S ECONOMIC Israel GROWTH: Economic AN Review INTERNATIONAL 1 (2003), 1 10 COMPARISON 1 ISRAEL S ECONOMIC GROWTH: AN INTERNATIONAL COMPARISON 1 ELHANAN HELPMAN * I examine the growth rate of GDP
Triple-play subscriptions to rocket to 400 mil.
 Triple-play criptions to rocket to 400 mil. Global triple-play criptions will reach 400 million by 2017; up by nearly 300 million on the end-2011 total and up by 380 million on the 2007 total, according
2015 Global Feed Survey
 2015 Global Feed Survey 2015 ALLTECH GLOBAL FEED EXECUTIVE SUMMARY 2015 marks the fourth consecutive year that Alltech has conducted this global feed survey. This undertaking has required a significant
Digital TV Research. http://www.marketresearch.com/digital-tv- Research-v3873/ Publisher Sample
 Digital TV Research http://www.marketresearch.com/digital-tv- Research-v3873/ Publisher Sample Phone: 800.298.5699 (US) or +1.240.747.3093 or +1.240.747.3093 (Int'l) Hours: Monday - Thursday: 5:30am -
BT Premium Event Call and Web Rate Card
 BT Managed Event and BT Self-Managed Event (also referred to as Express, Plus and Premium) Conference Bridge and Call for Booked Audio Conferencing Services will comprise the following for each phone-conference:
41 T Korea, Rep. 52.3. 42 T Netherlands 51.4. 43 T Japan 51.1. 44 E Bulgaria 51.1. 45 T Argentina 50.8. 46 T Czech Republic 50.4. 47 T Greece 50.
 Overall Results Climate Change Performance Index 2012 Table 1 Rank Country Score** Partial Score Tendency Trend Level Policy 1* Rank Country Score** Partial Score Tendency Trend Level Policy 21 - Egypt***
Global Education Office University of New Mexico MSC06 3850, Mesa Vista Hall, Rm. 2120 Tel. 505 277 4032, Fax 505 277 1867, geo@unm.
 Global Education Office University of New Mexico MSC06 3850, Mesa Vista Hall, Rm. 220 Tel. 505 277 4032, Fax 505 277 867, geo@unm.edu Report on International Students, Scholars and Study Abroad Programs
89% 96% 94% 100% 54% Williams 93% financial aid at Williams. completion statistics $44,753 76% class of 2013 average four-year debt: $12,749
 financial aid at Average - $, financial aid is comprehensive, covering books, health insurance, study abroad costs, travel, and personal expenses % % % % cost met by average % of with demonstrated need
Global Economic Briefing: Global Inflation
 Global Economic Briefing: Global Inflation August 7, Dr. Edward Yardeni -97-7 eyardeni@ Debbie Johnson -- djohnson@ Mali Quintana -- aquintana@ Please visit our sites at www. blog. thinking outside the
Fall 2015 International Student Enrollment
 Fall 2015 International Student Enrollment Prepared by The Office of International Affairs Nova Southeastern University Nova Southeastern University International Student Statistics Fall 2015 International
Mineral Industry Surveys
 4 Mineral Industry Surveys For information contact: Robert L. Virta, Asbestos Commodity Specialist U.S. Geological Survey 989 National Center Reston, VA 20192 Telephone: 703-648-7726, Fax: (703) 648-7757
Cisco Global Cloud Index Supplement: Cloud Readiness Regional Details
 White Paper Cisco Global Cloud Index Supplement: Cloud Readiness Regional Details What You Will Learn The Cisco Global Cloud Index is an ongoing effort to forecast the growth of global data center and
Know the Facts. Aon Hewitt Country Profiles can help: Support a decision to establish or not establish operations in a specific country.
 Aon Hewitt Country Profiles Your eguide to employment requirements and practices Profiles for nearly 90 countries worldwide Risk. Reinsurance. Human Resources. Know the Facts Whether you are a newcomer
Carnegie Mellon University Office of International Education Admissions Statistics for Summer and Fall 2015
 Carnegie Mellon University Admissions Statistics for and Fall 2015 New International Students and Fall 2015 Undergraduate 344 15.2% Master's 1599 70.6% Doctorate 167 7.4% Exchange 73 3.2% 81 3.6% Total
2015 Country RepTrak The World s Most Reputable Countries
 2015 Country RepTrak The World s Most Reputable Countries July 2015 The World s View on Countries: An Online Study of the Reputation of 55 Countries RepTrak is a registered trademark of Reputation Institute.
Shell Global Helpline - Telephone Numbers
 Shell Global Helpline - Telephone Numbers The Shell Global Helpline allows reports to be submitted by either a web-based form at https://shell.alertline.eu or by utilising one of a number of telephone
Reporting practices for domestic and total debt securities
 Last updated: 4 September 2015 Reporting practices for domestic and total debt securities While the BIS debt securities statistics are in principle harmonised with the recommendations in the Handbook on
relating to household s disposable income. A Gini Coefficient of zero indicates
 Gini Coefficient The Gini Coefficient is a measure of income inequality which is based on data relating to household s disposable income. A Gini Coefficient of zero indicates perfect income equality, whereas
Migration and Remittances: Top Countries
 Migration and Remittances: Top Countries Top Immigration Countries a, 010 number of immigrants, millions United States b Russian Federation b Germany b Saudi Arabia b Canada b United Kingdom b Spain b
MERCER S COMPENSATION ANALYSIS AND REVIEW SYSTEM AN ONLINE TOOL DESIGNED TO TAKE THE WORK OUT OF YOUR COMPENSATION REVIEW PROCESS
 MERCER S COMPENSATION ANALYSIS AND REVIEW SYSTEM AN ONLINE TOOL DESIGNED TO TAKE THE WORK OUT OF YOUR COMPENSATION REVIEW PROCESS MERCER S COMPENSATION ANALYSIS AND REVIEW SYSTEM www.imercer.com/cars Mercer
The World Market for Medical, Surgical, or Laboratory Sterilizers: A 2013 Global Trade Perspective
 Brochure More information from http://www.researchandmarkets.com/reports/2389480/ The World Market for Medical, Surgical, or Laboratory Sterilizers: A 2013 Global Trade Perspective Description: This report
UNHCR, United Nations High Commissioner for Refugees
 Belgium 22 Jul 1953 r 08 Apr 1969 a Belize 27 Jun 1990 a 27 Jun 1990 a Benin 04 Apr 1962 s 06 Jul 1970 a Bolivia 09 Feb 1982 a 09 Feb 1982 a Bosnia and Herzegovina 01 Sep 1993 s 01 Sep 1993 s Botswana
Consumer Credit Worldwide at year end 2012
 Consumer Credit Worldwide at year end 2012 Introduction For the fifth consecutive year, Crédit Agricole Consumer Finance has published the Consumer Credit Overview, its yearly report on the international
How To Get A New Phone System For Your Business
 Cisco Phone Systems Telemarketing Script Cold Call 1. Locate Contact: Name listed Owner General Manager / Office Manager Chief BDM (Business Decision Maker) Note: Avoid talking to IT since this is not
Excerpt Sudan Fixed Telecommunications: Low Penetration Rates Get a Boost from Broadband Internet and VoIP Services
 Excerpt Sudan Fixed Telecommunications: Low Penetration Rates Get a Boost from Broadband Internet and VoIP Services This report is part of Pyramid Research s series of Africa & Middle East Country Intelligence
Region Country AT&T Direct Access Code(s) HelpLine Number. Telstra: 1 800 881 011 Optus: 1 800 551 155
 HelpLine Number. Telstra: 1 800 881 011 Optus: 1 800 551 155") Mondelēz International HelpLine Numbers March 22, 2013 There are many ways to report a concern or suspected misconduct, including discussing it with your supervisor, your supervisor s supervisor, another
Mondelēz International HelpLine Numbers March 22, 2013 There are many ways to report a concern or suspected misconduct, including discussing it with your supervisor, your supervisor s supervisor, another
Introducing GlobalStar Travel Management
 Introducing GlobalStar Travel Management GlobalStar is a worldwide travel management company owned and managed by local entrepreneurs. In total over 80 market leading enterprises, representing over US$13
International aspects of taxation in the Netherlands
 International aspects of taxation in the Netherlands Individuals resident in the Netherlands are subject to income tax on their worldwide income. Companies established in the Netherlands are subject to
How do you manage the brain of the business in a way that supports the opportunities your organisation wants to take advantage of?
 As the world becomes a more competitive place, businesses need to respond at lightning speed to take advantage of new opportunities or avoid risks. To enable this, the data centre needs to be a dynamic
NITROGEN CHARGING KIT type PCM 11.2 E 04-11
 NITROGEN CHARGING KIT type PCM 11.2 E 04-11 11.2.1 TECHNICAL DATA MAX OPERATING PRESSURE (PS): 400 BAR PRESSURE TEST (PT): 1.43 PS SCALE OF PRESSURE GAUGE: 4-10 - 16-25 - 60-100 - 250 (std.) - 400 bar
Introducing Clinical Trials Insurance Services Ltd
 Introducing Clinical Trials Insurance Services Ltd Important Staff Richard Kelly Managing Director Richard joined CTIS in 2006 having previously managed the Pharmaceutical wholesale division at Heath Lambert
Global Downturn s Heavy Toll
 Global Downturn s Heavy Toll Bruce Stokes Director, Global Economic Attitudes Pew Research Center June 2013 Spring 2013 Pew Global Attitudes Survey Economic Sentiment 2 Crisis Soured Economic Views % Say
Fiscal Rules and Fiscal Responsibility Frameworks for Growth in Emerging and Low-Income Countries
 Fiscal Affairs Department Effects of Good Government, by Ambrogio Lorenzetti, Siena, Italy, 1338-39 Fiscal Rules and Fiscal Responsibility Frameworks for Growth in Emerging and Low-Income Countries Martine
Argentina s Economy: A death foretold again, or a surprise rescue? Claudio M. Loser Centennial- Latin America March 2014
 Argentina s Economy: A death foretold again, or a surprise rescue? Claudio M. Loser Centennial- Latin America March 214 Argentine performance tended to be ahead the world and even the Emerging Economies
GLOBAL. 2014 Country Well-Being Rankings. D Social (% thriving) E Financial (% thriving) F Community (% thriving) G Physical (% thriving)
 E Financial (% thriving) F Community (% thriving) G Physical (% thriving)") 0 0 GLOBAL 0 Country Rankings 0 0 0 0 0 0 0 0 0 0 0 0 0 0 0 0 0 : >0.0% 0.% 0.0% 0.% 0.0% 0.% 0.0% 0.0% A Country s global rank B in three or more elements of well-being C (% thriving) D (% thriving) E
0 0 GLOBAL 0 Country Rankings 0 0 0 0 0 0 0 0 0 0 0 0 0 0 0 0 0 : >0.0% 0.% 0.0% 0.% 0.0% 0.% 0.0% 0.0% A Country s global rank B in three or more elements of well-being C (% thriving) D (% thriving) E
FACT SHEET Global Direct Selling
 Global 2011 Global Retail Sales: USD $153,727 million Global Sales Force The 91.5 million Direct Sellers who represent companies around the world are: 3 2 16% 9% 2% 3% 2% 3% 2% 3% Care 42% 2% 56% 3% 2
BIS CEMLA Roundtable on Fiscal Policy, public debt management and government bond markets: issues for central banks
 BIS CEMLA Roundtable on Fiscal Policy, public debt management and government bond markets: issues for central banks Is monetary policy constrained by fiscal policy? by Carlos Montoro 26-27 November 212
An introduction to the World Federation of Occupational Therapists (WFOT)
") An introduction to the World Federation of Occupational Therapists (WFOT) WHAT IS THE WORLD FEDERATION OF OCCUPATIONAL THERAPISTS? The key international representative for occupational therapists and occupational
An introduction to the World Federation of Occupational Therapists (WFOT) WHAT IS THE WORLD FEDERATION OF OCCUPATIONAL THERAPISTS? The key international representative for occupational therapists and occupational
OCTOBER 2010. Russell-Parametric Cross-Sectional Volatility (CrossVol ) Indexes Construction and Methodology
 Indexes Construction and Methodology") OCTOBER 2010 Russell-Parametric Cross-Sectional Volatility (CrossVol ) Indexes Construction and Methodology SEPTEMBER 2010 Russell-Parametric Cross-Sectional Volatility (CrossVol) Indexes Construction
OCTOBER 2010 Russell-Parametric Cross-Sectional Volatility (CrossVol ) Indexes Construction and Methodology SEPTEMBER 2010 Russell-Parametric Cross-Sectional Volatility (CrossVol) Indexes Construction
Global Dynamism Index (GDI) 2013 summary report. Model developed by the Economist Intelligence Unit (EIU)
 2013 summary report. Model developed by the Economist Intelligence Unit (EIU)") Global Dynamism Index (GDI) 2013 summary report Model developed by the Economist Intelligence Unit (EIU) What is the Global Dynamism Index (GDI)? the GDI assesses the dynamism of 60 of the world's largest
Global Dynamism Index (GDI) 2013 summary report Model developed by the Economist Intelligence Unit (EIU) What is the Global Dynamism Index (GDI)? the GDI assesses the dynamism of 60 of the world's largest
International Student Population A Statistical Report by The International Office
 International Student Population A Statistical Report by The International Office CURRENT STUDENTS: 2,362 F-1 OPT & STEM OPT STUDENTS: 313 F-2/J-2 DEPENDENTS: 303 TOTAL: 2,978 Basic Information: There
Overview menu: ArminLabs - DHL Medical Express Online-Pickup: Access to the Online System
 Access to the Online System Overview menu: Create shipment: Preselected - Here you can order your shipment including the Pickup 0049 821 78093150 ArminLabs DHL Medical Express Online-Pickup-Manual DHL
January 2016 Cybersecurity Snapshot Global Results www.isaca.org/2016-cybersecurity-snapshot Number of respondents (n) = 2,920
 = 2,920") January 2016 Cybersecurity Snapshot Global Results www.isaca.org/2016-cybersecurity-snapshot Number of respondents (n) = 2,920 Media Inquiries: Kristen Kessinger, ISACA, +1.847.660.5512, news@isaca.org
January 2016 Cybersecurity Snapshot Global Results www.isaca.org/2016-cybersecurity-snapshot Number of respondents (n) = 2,920 Media Inquiries: Kristen Kessinger, ISACA, +1.847.660.5512, news@isaca.org
Schedule of Accreditation issued by United Kingdom Accreditation Service 21-47 High Street, Feltham, Middlesex, TW13 4UN, UK
 Schedule of United Kingdom Service 21-47 High Street, Feltham, Middlesex, TW13 4UN, UK ISO/IEC 17021:2011 to provide environmental management systems certification Kitemark Court Davy Avenue Knowlhill
July 2015. Figure 1. 1 The index is set to 100 in 2000. House prices are deflated by country CPIs in most cases.
 July 2015 Globally, house prices continue a slow recovery. The Global House Price Index, an equally weighted average of real house prices in nearly 60 countries, inched up slowly during the past two years
YTD 2015-27 CS AWARDS IN AMERICAS
 YTD 2015-27 CS AWARDS IN AMERICAS Argentina Bolivia Brazil Frontline Customer Service Team of the Year, All Industries (Bronze) Customer Service Department of the Year, Airlines, Distribution & Transportation
Countries Ranked by Per Capita Income A. IBRD Only 1 Category iv (over $7,185)
") Page 1 of 5 Note: This OP 3.10, Annex C replaces the version dated September 2013. The revised terms are effective for all loans that are approved on or after July 1, 2014. Countries Ranked by Per Capita
Page 1 of 5 Note: This OP 3.10, Annex C replaces the version dated September 2013. The revised terms are effective for all loans that are approved on or after July 1, 2014. Countries Ranked by Per Capita
Entrepreneurs Among the Happiest People in the World
 EMBARGOED until 12:01 a.m., January 21, 2014 Contact: Entrepreneurs Among the Happiest People in the World Global Entrepreneurship Monitor report finds entrepreneurship a satisfying career choice worldwide
2012 Country RepTrak Topline Report
 2012 Country RepTrak Topline Report The World s View on Countries: An Online Study of the Reputation of 50 Countries RepTrak is a registered trademark of Reputation Institute. Global Reputation Knowledge
ADVOC. the international network of independent law firms
 ADVOC the international network of independent law firms About ADVOC ADVOC is an international network of independent law firms, sharing international expertise in jurisdictions across the globe Our member
GfK PURCHASING POWER INTERNATIONAL
 GfK PURCHASING POWER INTERNATIONAL 1 Agenda 1. Europe 3 2. Americas 45 3. Asia & Near East 54 4. Afrika 66 5. Australia 68 6. Overview of countries and available levels 70 2 2 EUROPE 4 GfK
NORTHERN TRUST GLOBAL TRADE CUT OFF DEADLINES
 Argentina T+3 Only Govt Tsy Bills (Letes) have a settlement cycle of T+1, other fixed income securities have a T+3 settlement cycle. T+0 OTC Market (MAE) SD 1200 9amSD-2 9am SD T+3 T+0 SD 1500 9am SD 9am
Raveh Ravid & Co. CPA. November 2015
 Raveh Ravid & Co. CPA November 2015 About Us Established in 1986 by Abir Raveh, CPA & Itzhak Ravid, CPA 6 Partners, 80 employees Located in Tel Aviv, Israel wide range of professional services highly experienced
AN INTERNATIONAL COMPARISON OF INSOLVENCY LAWS. Meeting held on 27-28 April 2006
 AN INTERNATIONAL COMPARISON OF INSOLVENCY LAWS by Wang Huaiyu Meeting held on 27-28 April 2006 This document reproduces a report by Mr. Wang Huaiyu written after the Fifth Forum for Asian Insolvency Reform
FOR IMMEDIATE RELEASE CANADA HAS THE BEST REPUTATION IN THE WORLD ACCORDING TO REPUTATION INSTITUTE
 FOR IMMEDIATE RELEASE CANADA HAS THE BEST REPUTATION IN THE WORLD ACCORDING TO REPUTATION INSTITUTE Study reveals interesting developments in countries reputations amidst the Euro crisis, the rise of Asia
What Proportion of National Wealth Is Spent on Education?
 Indicator What Proportion of National Wealth Is Spent on Education? In 2008, OECD countries spent 6.1% of their collective GDP on al institutions and this proportion exceeds 7.0% in Chile, Denmark, Iceland,
Motion Graphic Design Census. 10 hrs. motiongraphicdesigncensus.org. 9 hrs.
 8 h 2010 Motion Graphic Design Census 10 hrs. motiongraphicdesigncensus.org 9 hrs. A Note on the Survey. First, let me apologize for the delay in getting this actually done and out to you. I bit off much
Chart 1: Zambia's Major Trading Partners (Exports + Imports) Q4 2008 - Q4 2009. Switzernd RSA Congo DR China UAE Kuwait UK Zimbabwe India Egypt Other
 Q4 2008 - Q4 2009. Switzernd RSA Congo DR China UAE Kuwait UK Zimbabwe India Egypt Other") Bank of Zambia us $ Million 1. INTRODUCTION This report shows Zambia s direction of merchandise trade for the fourth quarter of 2009 compared with the corresponding quarter in 2008. Revised 1 statistics,
Bank of Zambia us $ Million 1. INTRODUCTION This report shows Zambia s direction of merchandise trade for the fourth quarter of 2009 compared with the corresponding quarter in 2008. Revised 1 statistics,
I can finally afford UC without making a huge upfront investment. COO, market leader in the health care industry
 1 I can finally afford UC without making a huge upfront investment. COO, market leader in the health care industry 2 Contents 01 Investing in an anytime, anywhere, connected workforce 02 On-premise, hybrid,
Australia s position in global and bilateral foreign direct investment
 Australia s position in global and bilateral foreign direct investment At the end of 213, Australia was the destination for US$592 billion of global inwards foreign direct investment (FDI), representing
What Is the Total Public Spending on Education?
 What Is the Total Public Spending on Education? Indicator On average, OECD countries devote 12.9% of total public expenditure to, but values for individual countries range from less than 10% in the Czech
The Role of Banks in Global Mergers and Acquisitions by James R. Barth, Triphon Phumiwasana, and Keven Yost *
 The Role of Banks in Global Mergers and Acquisitions by James R. Barth, Triphon Phumiwasana, and Keven Yost * There has been substantial consolidation among firms in many industries in countries around
Cities THE GLOBAL CREATIVITY INDEX 2015
 Cities THE GLOBAL CREATIVITY INDEX 2015 The Cities Project at the Martin Prosperity Institute focuses on the role of cities as the key economic and social organizing unit of global capitalism. It explores
Sulfuric Acid 2013 World Market Outlook and Forecast up to 2017
 Brochure More information from http://www.researchandmarkets.com/reports/2547547/ Sulfuric Acid 2013 World Market Outlook and Forecast up to 2017 Description: Sulfuric Acid 2013 World Market Outlook and
Long-term macroeconomic forecasts Key trends to 2050
 A special report from The Economist Intelligence Unit www.eiu.com Contents Overview 2 Top ten economies in 5 at market exchange rates 3 The rise of Asia continues 4 Global dominance of the top three economies
U.S. Trade Overview, 2013
 U.S. Trade Overview, 213 Stephanie Han & Natalie Soroka Trade and Economic Analysis Industry and Analysis Department of Commerce International Trade Administration October 214 Trade: A Vital Part of the
Report on Government Information Requests
 Report on Government Information July 1 - December 31, 2015 Apple takes our commitment to protecting your data very seriously and we work incredibly hard to deliver the most secure hardware, software and
Governance, Risk and Compliance Assessment
 Governance, Risk and Compliance Assessment Information security is a pervasive business requirement and one that no organisation can afford to get wrong. If it s not handled properly, your business could
GLOBAL DATA CENTER INVESTMENT 2013
 2013 CENSUS REPORT: Global Data Center Investment 2013 GLOBAL DATA CENTER INVESTMENT 2013 2013 - Healthy Growth in Data Center Investment Globally Globally, the data center industry has continued to maintain
Accuracy counts! SENSORS WITH ANALOG OUTPUT
 Accuracy counts! SENSORS WITH ANALOG OUTPUT OTHER APPLICATIONS: KEY ADVANTAGES: Distance measurement Positioning Profile detection Deformation monitoring Vibration monitoring Process monitoring Detection
International investment continues to struggle
 FDI IN FIGURES December 2014 International investment continues to struggle Figures for the first half of 2014 point to stalled FDI flows Findings FDI fell in the first quarter of 2014 before rebounding