Chapter 5 Organic Spectrometry
|
|
|
- Eustace Kelley
- 9 years ago
- Views:
Transcription
1 Chapter 5 Organic Spectrometry from Organic Chemistry by Robert C. Neuman, Jr. Professor of Chemistry, emeritus University of California, Riverside [email protected] < Chapter Outline of the Book ************************************************************************************** I. Foundations 1. Organic Molecules and Chemical Bonding 2. Alkanes and Cycloalkanes 3. Haloalkanes, Alcohols, Ethers, and Amines 4. Stereochemistry 5. Organic Spectrometry II. Reactions, Mechanisms, Multiple Bonds 6. Organic Reactions *(Not yet Posted) 7. Reactions of Haloalkanes, Alcohols, and Amines. Nucleophilic Substitution 8. Alkenes and Alkynes 9. Formation of Alkenes and Alkynes. Elimination Reactions 10. Alkenes and Alkynes. Addition Reactions 11. Free Radical Addition and Substitution Reactions III. Conjugation, Electronic Effects, Carbonyl Groups 12. Conjugated and Aromatic Molecules 13. Carbonyl Compounds. Ketones, Aldehydes, and Carboxylic Acids 14. Substituent Effects 15. Carbonyl Compounds. Esters, Amides, and Related Molecules IV. Carbonyl and Pericyclic Reactions and Mechanisms 16. Carbonyl Compounds. Addition and Substitution Reactions 17. Oxidation and Reduction Reactions 18. Reactions of Enolate Ions and Enols 19. Cyclization and Pericyclic Reactions *(Not yet Posted) V. Bioorganic Compounds 20. Carbohydrates 21. Lipids 22. Peptides, Proteins, and α Amino Acids 23. Nucleic Acids ************************************************************************************** *Note: Chapters marked with an (*) are not yet posted. 0
 7. Reactions of Haloalkanes, Alcohols, and Amines. Nucleophilic Substitution 8. Alkenes and Alkynes 9. Formation of Alkenes and Alkynes. Elimination Reactions 10.")
2 5: Organic Spectrometry Preview Spectrometry in Organic Chemistry 5-4 Types of Spectrometry (5.1A) 5-5 Mass Spectrometry (MS) Nuclear Magnetic Resonance Spectrometry (NMR) Infrared Spectrometry (IR) Ultraviolet-Visible Spectrometry (UV-Vis) 5.2 Mass Spectrometry (MS) 5-6 Formation of Molecular and Fragment Ions (5.2A) 5-6 Molecular Ion Fragment Ions Molecular and Fragment Ions from Methane. The Mass Spectrometer and Mass Spectrum (5.2B) 5-8 Mass Spectrometer Mass Spectrum Mass-to-Charge Ratios (m/z Values Peaks for the Molecular Ion and Fragment Ions Hexane (5.2C) 5-10 Molecular Ion and Fragment Ions from Hexane Exact Mass Values M+1 Peaks and Isotopes Mass Spectra of Hexane Structural Isomers (5.2D) 5-13 The Molecular Ion Peaks Fragmentation Mass Spectra of Compounds with Functional Groups (5.2E) 5-17 General Features 1-Pentanol (Y = OH) 1-Pentanamine (Y = NH 2 ) 1-Chloropentane (Y = Cl 1-Bromopentane (Y = Br) 1-Iodopentane (Y = I) Mass Spectrometry Summary (5.2F) Spectrometry Using Electromagnetic Radiation 5-22 Electromagnetic Spectrum (5.3A) 5-22 Photons of Electromagnetic Radiation Frequency and Wavelength of Electromagnetic Radiation Units of Frequency or Wavelength Basic Spectrometer Design (5.3B) 5-25 Spectrometer Components Spectral Peaks 1
 5-8 Mass Spectrometer Mass Spectrum Mass-to-Charge Ratios (m/z Values Peaks for the Molecular Ion and Fragment Ions Hexane (5.")
3 5.4 Nuclear Magnetic Resonance Spectrometry 5-26 The NMR Spectrometer (5.4A) H and 13 C are NMR Active Nuclei (5.4B) C NMR Spectrometry 5-27 General Considerations (5.5A) 5-27 Some 13 C NMR Spectra (5.5B) 5-28 Methanol versus Ethanol The Other Alcohols 13 C NMR Chemical Shifts (δ) (5.5C) 5-28 Generalizations for these Alcohols Chemical Shifts Depend on Electron Prediction of 13 C δ Values Calculations for 1-Hexanol δ Values and Electronegativity Chemically Equivalent Carbons Additional Details about NMR Spectra (5.5D) 5-36 Shielding High and Low Field The TMS Reference in 13 C NMR Solvents Used in NMR Spectrometry. Qualitative Predictions of 13 C Spectra (5.5E) H NMR Spectrometry H versus 13 C NMR Chemical Shifts (5.6A) H NMR Spectrum of Bromoethane (5.6B) 5-39 The Origin of the 1 H NMR Signals The Shapes of the Signals Signal Splitting in 1 H NMR Spectra (5.6C) Bromoethane 2-Bromopropane 1-Bromopropane The Origin of 1 H NMR Signals The Origin of Signal Splitting in 1 H NMR Spectra The Relative Intensity of NMR Signals (5.6D) 5-48 Signal Intensities in 1 H NMR Spectra Signal Intensities in 13 C NMR Spectra 1 H NMR Chemical Shift (δ) Values (5.6E) 5-49 The TMS Reference in 1 H NMR. 2
 5-36 Shielding High and Low Field The TMS Reference in 13 C NMR Solvents Used in NMR Spectrometry. Qualitative Predictions of 13 C Spectra (5.5E) 5-37 5.")
4 5.7 Infrared Spectrometry 5-50 Infrared Energy Causes Molecular Vibrations (5.7A) 5-52 The Infrared Spectrometer (5.7B) 5-52 IR Sample Cells Solvents for IR Samples. IR Spectra (5.7C) 5-53 The Horizontal Axis The Vertical Axis. IR Stretching and Bending Signals (5.7D) 5-54 Characteristic IR Regions Alkanes Amines More IR Later 5.8 UV-Visible Spectrometry 5-58 Structural Requirements for UV-Vis Spectra (5.8A) 5-58 UV and Visible Radiation Excites Electrons (5.8B) 5-59 The UV-Vis Spectrometer (5.8C) 5-59 UV-Vis Sample Cells Solvents for UV-Vis Spectrometry UV-Vis Spectra (5.8D) 5-61 The Horizontal Axis The Vertical Axis More UV-Vis Later Chapter Review
 5-59 The UV-Vis Spectrometer (5.8C) 5-59 UV-Vis Sample Cells Solvents for UV-Vis Spectrometry UV-Vis Spectra (5.")
5 5: Organic Spectrometry Spectrometry in Organic Chemistry Mass Spectrometry Spectrometry Using Electromagnetic Radiation Nuclear Magnetic Resonance Spectrometry 13 C NMR Spectrometry 1 H NMR Spectrometry Infrared Spectrometry UV-Visible Spectrometry Preview This chapter describes four instrumental methods that organic chemists routinely use to determine the structures of organic compounds. They are Mass Spectrometry (MS), Nuclear Magnetic Resonance Spectrometry (NMR), Infrared Spectrometry (IR), and Ultraviolet- Visible Spectrometry (UV-Vis). These four methods use electronic instruments called spectrometers to generate spectra that contain the structural information about molecules. We will describe these spectrometers only in the most general terms. This chapter is primarily designed to introduce you to the utility and limitations of these four instrumental methods, and to illustrate how organic chemists use their spectral data to determine structures of organic molecules. Analytical chemistry is the branch of chemistry that deals with the development and use of instrumental techniques such as these to determine structures of molecules, and it is the subject of other courses in the undergraduate chemistry curriculum. However, these four instrumental methods are of such great importance to organic chemists that we give this early introduction to show the kinds of structural information they provide. 5.1 Spectrometry in Organic Chemistry Organic chemists must determine structures of the organic compounds that they use in chemical reactions, that form in these chemical reactions, and that they isolate from living organisms. They accomplish this using several instrumental techniques collectively described as organic spectrometry. Organic spectrometry makes use of electronic instruments called spectrometers 4

6 that provide energy to molecules and then measure how the molecules respond to that applied energy. In order to fully understand spectrometry, we should learn about the design and construction of spectrometers. However we can develop a practical understanding of how these different types of organic spectrometry provide information about molecular structure without a detailed knowledge of spectrometers. We illustrate this in the following sections using as examples the classes of organic molecules introduced in Chapters 2 and 3. Types of Spectrometry (5.1A) The four most important types of spectrometry that organic chemists routinely use are: Mass Spectrometry (MS) Nuclear Magnetic Resonance Spectrometry (NMR) Infrared Spectrometry (IR) Ultraviolet-Visible Spectrometry (UV-Vis) Each of these methods provides unique information about organic molecular structure because each monitors the response of an organic molecule to a different type of energy input. In MS, a molecule is bombarded with a beam of high energy electrons, in NMR it is irradiated with radio waves, in IR it is subjected to heat energy, while in UV-Vis spectrometry the molecule is placed in a beam of ultraviolet or visible light. We discuss mass spectrometry (MS) first since it is fundamentally different from the other three types of spectrometry. Of the other three methods, we consider NMR in much greater detail than either IR or UV-Vis because of its overwhelming importance to organic chemists as an aid in structure determination. Our discussions of IR and UV-Vis in this chapter are brief because these methods are best suited to analyzing types of molecules that we have not yet introduced. We discuss them in more detail in later chapters. Spectrometry versus Spectroscopy. You may see other books refer to the techniques in this chapter as organic spectroscopy rather than organic spectrometry. This is not technically correct, but it is done so often that it has become accepted practice. Chemical spectroscopy actually involves the study of the interaction of electromagnetic energy, described later in this chapter, with molecules. In contrast, chemical spectrometry is the practical use of instruments, including those based on spectroscopy, to probe molecular structure. 5

7 5.2 Mass Spectrometry (MS) Mass spectrometry provides information about the molecular mass of an organic compound, and about how the organic compound fragments when it is has a large amount of excess energy. Formation of Molecular and Fragment Ions (5.2A) A mass spectrometer bombards a small sample of an organic compound with a beam of high energy electrons (e - ) leading to the formation of positively charged molecular ions that subsequently decompose into fragment ions. Organic Compound + e - Molecular Ions Fragment Ions The mass spectrometer detects the mass of the molecular ions as well as the masses of the fragment ions. Molecular Ion. A molecular ion (M + ) forms when a high energy electron (e - ) collides with a molecule (M) in the sample causing it to lose one of its own electrons. e - + M M + + 2e - The two electrons (2e - ) that are products of this "reaction" include the electron from the electron beam that hit the molecule as well as the electron ejected from the molecule. The molecular ion (M + ) is positive because it has lost an electron and therefore has one less electron than it has protons. Besides its positive (+) charge, we specifically show using the symbol ( ) that the molecular ion has one unpaired (unshared) electron. Molecules have even numbers of electrons that exist as pairs in chemical bonds, as pairs of unshared electrons, or as pairs in inner shell atomic orbitals (see Chapter 1). As a result, the loss of one electron (fig?) not only causes M to become (+), but also to have an odd number of electrons so that one is unpaired (. ). Fragment Ions. Molecular ions (M + ) possess a large amount of excess energy when they form. This causes many of them to decompose into smaller fragments that are positively charged cations and uncharged (neutral) species called radicals. We illustrate molecular ion formation and its subsequent fragmentation in a mass spectrometer using a generic molecule R 1 -R 2 in which the chemical bond between R 1 and R 2 breaks during fragmentation. 6

8 e - + R1-R2 (R1-R2) + + 2e - (M) (M) + (R1-R2) + R1 + + R2 and/or R1 + R2 + (M) + Mass spectrometers detect the presence of positively charged ions and measure their masses. As a result, a mass spectrometer provides masses of molecular ions ((R1-R2) + ) as well as masses of the positive fragment ions (R 1 + and R 2 + ) that result from fragmentation of the molecular ion. Fragment ions are like pieces of a jig saw puzzle that chemists can often fit back together to give part or all of the detailed molecular structure of the original organic molecule. Molecular and Fragment Ions from Methane. We use methane (CH 4 ) to illustrate molecular ion formation and fragmentation because all of its chemical bonds are identical. (a) Electron bombardment (formation of the molecular ion) e - + CH4 CH e - 10p 10p 1e 10e 9e 2e (b) Fragmentation (formation of radical and cation) CH4 + CH3 + H + or 10p 9p 1p 9e 9e CH4 + CH3 + + H 10p 9p 1p 9e 8e 1e Each of these equations is chemically and electrically balanced. Both the total number of protons (p) as well as the total number of electrons (e) are the same on both sides of each equation, and the same is true for the net electrical charge on both sides of each equation. The relative numbers of protons (p) and numbers of electrons (e) for each species show you why a species has a negative (-) charge, a positive (+) charge, and/or an unpaired electron ( ). The species with single (+) charges have one more p than e, while those labelled with a ( ) have an odd number of e's. (By convention, we do not show a ( ) on e - even though it is simply a single electron.) 7
 to illustrate molecular ion formation and fragmentation because all of its chemical bonds are identical.")
9 This detailed analysis is a useful exercise, but you will not need to do it routinely in order to interpret results of MS structure determinations of organic compounds. The two important points are that a mass spectrometer (a) generates and detects positively charged ions (molecular and fragment ions) from the original compound, and (b) determines their masses. We describe this in more detail in the following sections. The Mass Spectrometer and Mass Spectrum (5.2B) There are several different designs for mass spectrometers, but all of them form, detect, and measure the mass of positively charged species formed by electron bombardment. Mass Spectrometer. We show the typical component parts of these mass spectrometers using the simple "block" diagram in Figure 5.4. Figure 5.4 The mass spectrometer bombards the organic sample in the sample chamber (Figure 5.4) with high energy electrons from the source, and detects the resulting positive ions in the analyzer/detector region of the spectrometer. The analyzer and detector are usually separate components, but some mass spectrometers, used for routine mass spectral analysis in organic laboratories, analyze and detect positive ions in the sample chamber where they form. Mass Spectrum. The mass spectrometer determines the amount and mass of each positively charged species, stores these data in a computer, and subsequently prints out these results in a table or displays them as a mass spectrum (Figure 5.5). Figure 5.5 A mass spectrum consists of a collection of lines at different m/z values (described below) along the horizontal axis or base line of the spectrum. Each line corresponds to a positively charged species detected by the spectrometer. Mass-to-Charge Ratios (m/z Values). The m/z values (mass-to-charge ratios) on the horizontal axis of the spectrum correspond to the mass (m) (amu) of each positively charged species divided by its electrical charge (z). Most positive species formed in a mass spectrometer have a charge of +1 (z = +1), so their m/z values usually are the same as their masses (m/z = m/(+1) = m). The m/z values for the taller lines in the mass spectrum often appear as labels at the top of those lines. The height of each line (or signal or peak) corresponds to the relative amount formed of the positive species with a particular m/z value. We call the tallest peak in any mass spectrum the 8
 There are several different designs for mass spectrometers, but all of them form, detect, and measure the mass of positively charged species formed by electron bombardment. Mass Spectrometer.")
10 9

11 base peak and usually assign it a value of 100% on the vertical axis. In the spectrum in Figure 5.5, the base peak is the line at m/z = 42. We describe the heights of the other peaks in the spectrum as a percentage of the base peak. We will see below that the positive ion giving the base peak is usually not the molecular ion, but is a particularly stable fragment ion whose structure depends on the particular compound giving the mass spectrum. Peaks for the Molecular Ion and Fragment Ions. One of the most important lines in a mass spectrum is that of the molecular ion since its m/z value gives the molecular mass of the original compound. Fragment ions are pieces of the original molecule, but a knowledge of their structures is important in deducing the structure of the original molecule since we can often piece them together like pieces of a jigsaw puzzle. Their masses (m/z values) and an understanding of the reactivity of molecules helps us figure out the structures of fragment ions. We illustrate these points and other aspects of the use of MS by considering mass spectral results for several different organic compounds. Hexane (5.2C) Our first example is the mass spectrum of the linear alkane hexane. CH3-CH2-CH2-CH2-CH2-CH3 Hexane Mass Spectrum of Hexane. The hexane mass spectrum (Figure 5.6) has major lines (peaks) at m/z values of 15, 27, 29, 39, 41, 42, 43, 56, and 57, and smaller peaks at other m/z values including 71 and 86. Figure 5.6 These m/z values all result from rounding off exact m/z values to unit resolution (e.g. an m/z value of 35.1 rounded off to unit resolution is 35). What positive ions give these different peaks? Let's first look at the structure of hexane and consider how its molecular ion might fragment to form different fragment ions, and then see if the masses of these fragments are present in the spectrum. Molecular Ion and Fragment Ions from Hexane. Bombardment of hexane (C 6 H 14 ) with high energy electrons forms the molecular ion (C 6 H 14 ) + (Figure 5.7). Figure

12 11

13 This molecular ion might then fragment by breaking any of its C-C bonds (Figure 5.7) and we show the molecular ion and possible fragment ions in Table 5.1 along with their unit resolution and exact m/z values. Table 5.1. Exact and Unit Resolution m/z Values for Cations formed from Hexane in a Mass Spectrometer. m/z Value (amu) Ion Structure Exact Unit Resolution (C6H14) + (CH3CH2CH2CH2CH2CH3) C5H11 + (CH3CH2CH2CH2CH2+) C4H9 + (CH3CH2CH2CH2+) C3H7 + (CH3CH2CH2+) C2H5 + (CH3CH2+) CH3 + (CH3+) You can see peaks at all of these m/z values in the hexane mass spectrum (Figure 5.6). In addition, there are prominent peaks for fragments that have m/z values other than those in Table 5.1. Some are 1 or 2 amu less than those mentioned in Table 5.1 and they correspond to ions with one or two fewer H atoms than the ions shown in Table 5.1. It is also important to note that there are several "groups" of peaks made up of individual peaks that are each 14 amu (the mass of a CH 2 group) larger or smaller than individual peaks in a neighboring group. Exact Mass Values. The mass values of these peaks are shown at unit resolution in Figure 5.6, but high resolution mass spectrometers give their exact mass values. The exact mass of the hexane molecular ion (C 6 H 14 ) + is virtually identical to the exact mass of a hexane molecule (C 6 H 14 ) since (C 6 H 14 ) + differs from (C 6 H 14 ) by just one electron that has negligible mass. However, if you use atomic masses from a periodic table or the Handbook of Chemistry and Physics to calculate the molecular mass of hexane, you obtain a value of amu rather than the exact mass value of ( rounded off to 4 significant figures). These two values of and may seem very close to each other, but their difference of 0.07 amu is greater than any experimental or calculational error. A clue that we may have overlooked something in this analysis of hexane masses is the observation that the mass 86 peak is not the highest mass peak in this mass spectrum. If you look closely at Figure 5.6 you will see a very small peak at mass 87 that is not due to an impurity in our sample. We explain below both the origin of this M+1 peak, and why we cannot calculate exact mass values using atomic mass data from a periodic table. 12
 29.0391 29 CH3 + (CH3+) 15.0235 15 You can see peaks at all of these m/z values in the hexane mass spectrum (Figure 5.6).")
14 M+1 Peaks and Isotopes. The exact mass values of all of the cations in Table 5.1 are slightly less than we would calculate using atomic mass values from a periodic table. This is because atomic masses of C and H from periodic tables are weighted averages of exact mass values of their naturally occurring isotopes. In contrast, mass spectrometers detect individual ions that do not have "average" isotopic distributions as we describe below. The amu atomic mass of C from a periodic table is a weighted average based on the 99% natural abundance of 12 C (6 protons, 6 neutrons, atomic mass amu) and 1% 13 C (6 protons, 7 neutrons, atomic mass amu). Similarly, the amu atomic mass of H from a periodic table is a weighted average based on the % natural abundance of 1 H (1 proton, 0 neutrons, atomic mass amu) and % 2 H (1 proton, 1 neutron, atomic mass amu). However, the detector of the mass spectrometer determines the masses of individual molecular fragments that cannot contain a statistical distribution of isotopes. While most hexane molecular ions contain only 12 C and 1 H and are ( 12 C 6 1 H 14 ) +., there are also molecular ions in which one 12 C is replaced by a 13 C to give ( 13 C 1 12 C 5 1 H 14 ) +. that we call the M+1 peak. Their masses are both different from that calculated for (C 6 1 H 14 ) +. using atomic masses from a periodic table. In any sample we also expect a few molecular ions of hexane to contain two or more 13 C atoms, but their number is so small that they are not visible in the spectrum. While an M+1 peak in the hexane spectrum could also reflect the presence of a 2 H atom in the molecular ion ( 12 C 6 2 H 1 1 H 13 ) +., the natural abundance of 2 H (0.015%) is so small that such ions constitute a trivial part of the M+1 peak. Most fragment ions also contain just 12 C and 1 H, so their exact masses in Table 5.1 are also less than we would calculate using weighted average masses from a periodic table. However like the molecular ion, fragment ions with relatively intense peaks also have neighboring isotopic peaks one mass unit higher due to replacement of a 12 C by 13 C. Mass Spectra of Hexane Structural Isomers (5.2D) In order to see how mass spectra can provide information to help distinguish between isomers with the same molecular formula, we compare the mass spectrum of hexane with those of its isomers 2-methylpentane, and 2,2-dimethylbutane that are all C 6 H 14 ( Figure 5.8). Figure 5.8 The Molecular Ion Peaks. One of the most obvious differences between these spectra in Figure 5.8 is the molecular ion peak at 86. It is much weaker in the spectrum of 2-methylpentane 13

15 14

16 15
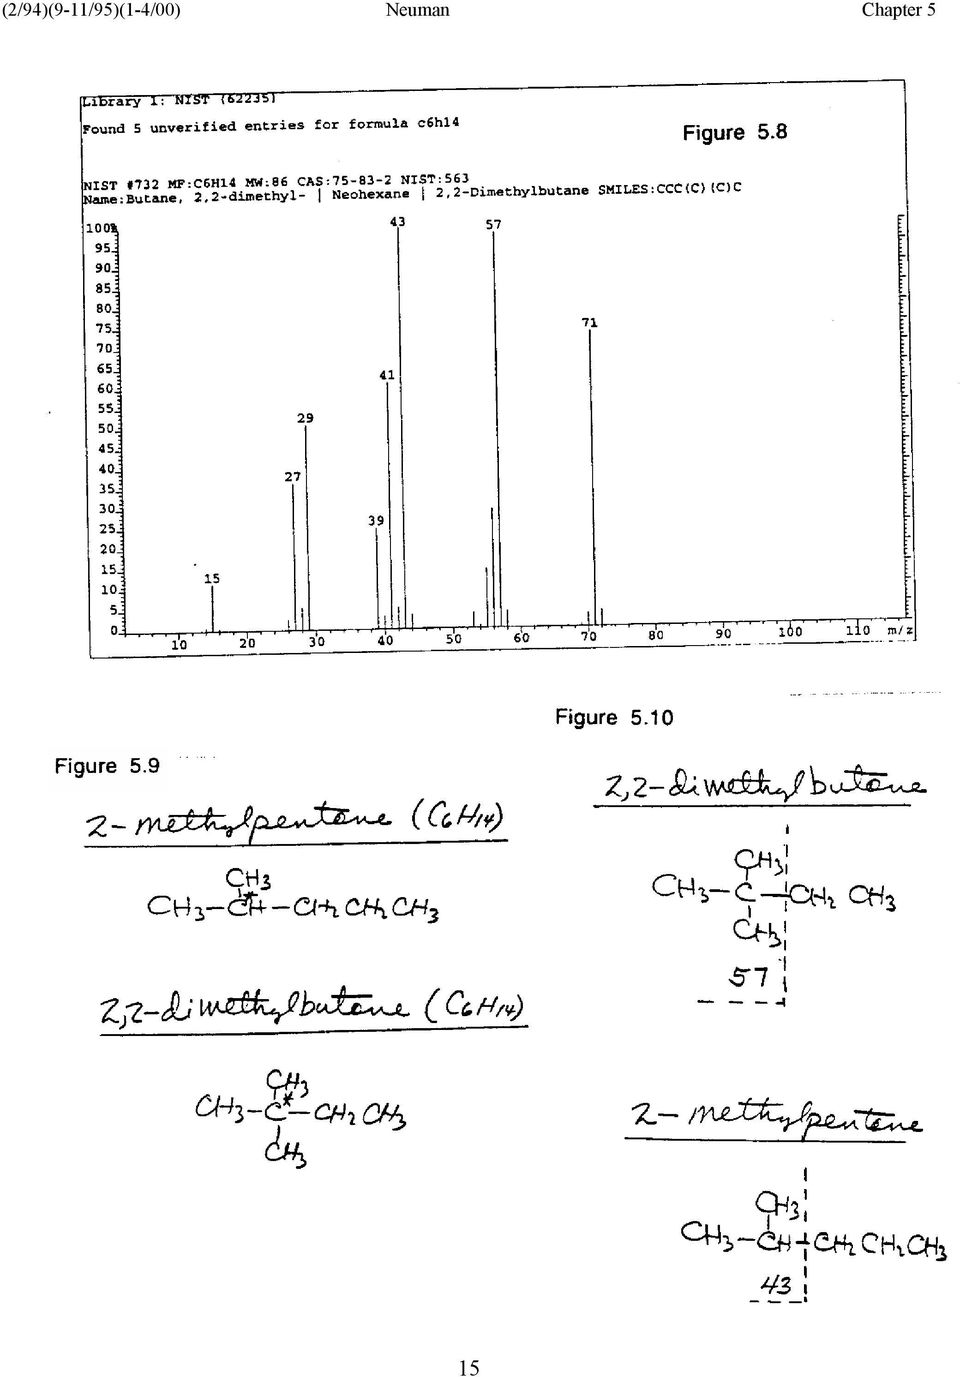
17 than in that of hexane, and we cannot see it at all in the spectrum of 2,2-dimethylbutane. This is an example of a general phenomenon in mass spectrometry that increasing branching in a molecule increases the probability of fragmentation of its molecular ion. An increase in ease of fragmentation of a molecular ion decreases its lifetime and decreases the possibility of observing it in a mass spectrum as we describe below. Fragmentation. Fragmentation of the molecular ion due to branching occurs primarily at the points of branching. We mark these points of branching in 2-methylpentane and 2,2- dimethylbutane with the symbol (*) in Figure 5.9 Figure 5.9 If CH 3 is lost from C* in either of those compounds, we expect to see a mass 71 fragment (C 5 H 11 + ). Figure 5.8 shows that this mass 71 peak is largest for the most highly branched isomer 2,2-dimethylbutane, less intense for 2-methylpentane, and smallest for hexane since it is unbranched. We show other possible C-C fragmentations in Figure 5.10 for 2,2-dimethylbutane and for 2- methylpentane at the branch points C*. Figure 5.10 For 2,2-dimethylbutane, we might expect to see a mass 57 peak (C 4 H 9 + ), while we might expect to see a mass 43 peak (C 3 H 7 + ) from 2-methylpentane. We observe each of these in their respective spectra and they illustrate how mass spectra can distinguish between structural isomers. Mass spectral results are not always easy to interpret in terms of simple fragmentation reactions. For example, while the mass 57 peak (C 4 H 9 + ) for 2-methylpentane is very small confirming that a C 4 fragment cannot be formed by cleavage at C*, the mass 43 peak (C 3 H 7 + ) from 2,2- dimethylbutane is unexpectedly large even though there is no obvious way of forming a C 3 fragment by a simple fragmentation reaction at any C-C bond. The molecule "knows what it is doing" and obviously wants to form this ion, but its origin is not easy to understand. Mass spectrometrists say that such unexpected peaks arise by random rearrangements. Why Branching Increases Fragmentation. You will learn later in the text that substitution of an alkyl group for an H on a C+ center increases the stability of that C+ center. This is the major reason why the positively charged species formed by C-C cleavage at branch points are so prominent in the mass spectra of branched alkanes. 16

18 Mass Spectra of Compounds with Functional Groups (5.2E) Molecules with functional groups such as OH, NH 2, or a halogen (X) have characteristic mass spectral features that help identify the presence of these functional groups. We illustrate these characteristic features using mass spectra of 1-pentanol, 1-pentanamine, 1-chloropentane, 1- bromopentane, and 1-iodopentane (Figure 5.11). Figure 5.11 General Features. All of these compounds in Figure 5.11 have the general structure CH 3 CH 2 CH 2 CH 2 CH 2 -Y where Y is OH, NH 2, Cl, Br, or I. Electron bombardment in the mass spectrometer first gives molecular ions (CH 3 CH 2 CH 2 CH 2 CH 2 -Y) + and these fragment into smaller cations and radicals. These fragments form by cleavage at C-C bonds as we saw for isomeric hexanes, but the functional group Y influences this fragmentation. We will focus on the molecular ion peaks, on the fragment peaks corresponding to + CH 2 -Y, and on fragment peaks at mass values 55 (C 4 H 7 + ) and 70 (C 5 H 10 + ) that form as we show in Figure Figure 5.12 Each Y group causes an unusually large amount of fragmentation at its adjacent C-C bond giving the characteristic + CH 2 -Y fragment. The peak at m/z = 70 is due to the cation arising from loss of the molecular species H-Y (that is H-OH, H-NH 2, or H-X), while that at m/z = 55 arises from loss of both H-Y and CH 3. We briefly highlight each functional group below. 1-Pentanol (Y = OH). The molecular ion peak (m/z = 88) in the mass spectrum of 1- pentanol (CH 3 CH 2 CH 2 CH 2 CH 2 -OH) is very small and this is characteristic of alcohols (ROH). In contrast, the + CH 2 -OH peak at m/z = 31 ( + CH 2 -Y where Y = OH) is intense and so are the peaks at m/z = 55 (loss of H-OH and CH 3 ) and m/z = 70 (loss of H-OH). 1-Pentanamine (Y = NH 2 ). The molecular ion peak (m/z = 87) for 1-pentamine (CH 3 CH 2 CH 2 CH 2 CH 2 -NH 2 ) is relatively more intense than the molecular ion peak from 1- pentanol and this is generally true for amines (RNH 2 ) compared to alcohols(roh). The M +. line is sufficiently intense that its 13 C isotopic M+1 peak is also visible in the spectrum. Although the peaks at m/z = 55 and 70 due to loss of H-NH 2 (ammonia) are barely visible, the + CH 2 -NH 2 peak ( + CH 2 -Y where Y = NH 2 ) is so intense that it is the base peak in the spectrum. All of these observations are characteristic of the mass spectra of amines. 1-Chloropentane (Y = Cl). Molecular ions of chloroalkanes undergo extensive fragmentation, so the M + peak at m/z = 106 for 1-chloropentane (CH 3 CH 2 CH 2 CH 2 CH 2 -Cl) is 17

19 18

20 19

21 20
22 just barely visible. Consistent with this, the fragment peaks at m/z = 55 due to loss of both H-Cl and CH 3, and at m/z = 70 due to loss of H-Cl, are very intense. The + CH 2 -Cl fragment ( + CH 2 -Y where Y = Cl) is also visible in this spectrum, but you may be surprised to learn that it corresponds to the two separate peaks at m/z = 49 and 51. Natually occurring Cl is a mixture of the isotopes 35 Cl (76%) and 37 Cl (24%) so + CH 2 -Cl is an equivalent % mixture of + CH 2-35 Cl (m/z = 49) and + CH 2-37 Cl m/z = 51). The isotopic mixture for Cl also causes every cation containing Cl to give two peaks separated by 2 amu. The molecular ion with the isotope 37 Cl (m/z =108) is not visible because it would be only one-fourth the size of the already tiny peak for the 35 Cl molecular ion at mass 106, but pairs of fragment ions with 35 Cl and 37 Cl appear at m/z = 63 and 65 (C 2 H 4 Cl + ), and at m/z = 91 and 93 (C 4 H 8 Cl + ). 1-Bromopentane (Y = Br). Since naturally occurring Br is almost an equimolar mixture of 79 Br (51%) and 81 Br (49%), cations containing Br also give two mass spectral peaks with almost equal intensities such as the two weak molecular ion peaks from 1-bromopentane (CH 3 CH 2 CH 2 CH 2 CH 2 -Br) at m/z =150 and 152. You can see other such isotopic pairs of peaks separated by 2 amu including those for + CH 2 -Br ( + CH 2 -Y where Y = Br) at m/z = 93 and 95. The characteristic fragment peaks at m/z = 55 and 70 for C 4 H 7 + and C 5 H 10 + are present, but significantly less intense than those from 1-chloropentane. 1-Iodopentane (Y = I). In contrast to Cl or Br, naturally occuring iodine (I) is almost entirely the single isotope 127 I. As a result, 1-iodopentane (CH 3 CH 2 CH 2 CH 2 CH 2 -I) gives just a single molecular ion peak at m/z = 198 along with its small M+1 peak at m/z = 199 due to 13 C. The mass spectrum of 1-iodopentane also illustrates that fragmentation is much less important for iodoalkanes than for bromoalkanes or chloroalkanes. The characteristic fragment peaks at m/z = 55 and 70, and at m/z = 141 for + CH 2 -I ( + CH 2 -Y where Y = I) are all relatively small. However, you can see an intense peak at m/z = 71 in the mass spectrum of 1-iodopropane due to C 5 H This m/z = 71 peak is also present in the mass spectrum of 1-bromopentane and is due to molecular ion fragmentation at C-I or C-Br bonds forming C 5 H 11 + and I. or Br. atoms. We will see in a later chapter that the relative stability of halogen atoms is I. > Br. > Cl. and this explains the very small m/z = 71 peak in the mass spectrum of 1-chloropentane. Mass Spectrometry Summary (5.2F) If you look back at the mass spectra that we have shown here, you may wonder how a chemist can possibly identify the compound giving that spectrum without knowing the answer in 21
23 advance. Each spectrum has many peaks and it is not always clear how some of them formed. These are valid feelings on your part, but chemists who use mass spectrometry as an analytical tool have had extensive training in which they have seen and studied thousands of mass spectra of a variety of different compounds. Like any other skill, the ability to use this technique requires extensive practice. We have illustrated only a few of the basic concepts that chemists use to interpret mass spectra. It is important to emphasize again that one of the most important uses of mass spectal data by organic chemists is the determination of a molecular mass for a compound from the m/z value of its molecular ion. Fragment ions are also important clues to molecular structure, that chemists use in conjunction with other spectrometric techniques that we describe in the remainder of this chapter. Organic chemists often have some idea of the likely structure of an organic compound before they obtain its mass spectrum so mass spectrometry frequently provides confirmation of a suspected structure. The fragmentation reactions that we have described will be more meaningful after we have studied the reactions of organic molecules in later chapters. 5.3 Spectrometry Using Electromagnetic Radiation We devote the rest of this chapter to discussions of NMR, IR and UV-Vis spectrometry that rank along with MS as the most important spectrometric methods used by organic chemists for molecular structure determination. In contrast with mass spectrometry that uses high energy electrons as its energy source, these additional three methods use electromagnetic radiation from different regions of the electromagnetic spectrum as their source of energy. Electromagnetic Spectrum (5.3A) The electromagnetic spectrum includes very high energy gamma rays and x-rays, intermediate energy visible light and infrared radiation, and very low energy radio and television waves. We illustrate the regions of the electromagnetic energy spectrum used for NMR, IR, and UV-Vis spectrometry in Figure Figure 5.13 You may have learned about the electromagnetic energy spectrum in other courses such as general physics or general chemistry. It is important for you to be aware that all electromagnetic energy, whether from X-rays, UV light, microwaves, or radio and television waves, is provided by packets of energy called photons that have no mass or charge. Photons of Electromagnetic Radiation. What distinguishes X-rays from visible light, for example, is the amount of energy associated with a photon of that particular type of 22
24 23
25 electromagnetic radiation. Radio and television waves are made up of photons with very low energy, while X-rays and γ-rays are made up of photons with very high energy. You can see from Figure 5.13 that the relative energy of photons used in the three types of spectrometry that we discuss here decreases in the order E UV-Vis > E IR > E NMR. Mass Spectrometry Does Not Use Electromagnetic Radiation. It is important to state again that mass spectrometry (MS) does not use energy from the electromagnetic spectrum! It employs a beam of high energy electrons, not photons, to interact with molecules as we have described earlier. While the MS electron beam destroys the molecular sample in the mass spectrometer, NMR, IR, and UV-Vis spectrometry are non-destructive analytical methods. The energy provided by their photons leads to changes in the molecules, but these changes are almost always rapidly reversible as we will describe in the sections below. Frequency and Wavelength of Electromagnetic Radiation. We can assign energies in kj to the photons from different regions of the electromagnetic spectrum (Figure 5.13), but this is not done in practice. Organic chemists typically characterize electromagnetic radiation used in NMR, IR, and UV-Vis spectrometry in terms of its frequency or wavelength. As a result, you need to understand the general relationships between energy (E), frequency (ν), and wavelength (λ) of electromagnetic radiation (Figure 5.14). Figure 5.14 Our first lesson is that energy (E) and frequency (ν) are directly proportional to each other as we show in equation (1) where h is a proportionality constant called Planck's constant. E = hν (1) Photons with high energy (like X-rays and γ-rays) have high frequencies, while photons with low energy (like microwaves and radiowaves) have low frequencies. As a result, the order of relative energies of the photons used in UV-Vis, IR, and NMR spectrometry (E UV-Vis > E IR > E NMR ) is the same as the order of their relative frequencies (ν UV-Vis > ν IR > ν NMR ). Our second lesson is that the wavelength (λ) of photons is inversely proportional to the frequency (ν) of those photons as we show in equation 2 where the proportionality constant c is the velocity of light. ν = c/λ (2) Electromagnetic radiation of higher frequency (higher energy) has shorter wavelengths than electromagnetic radiation of lower frequency (lower energy). This means that the relative order of energies of photons used in NMR, IR, and UV-Vis (E UV-Vis > E IR > E NMR ) is opposite to that of their photon wavelengths (λ UV-Vis < λ IR < λ NMR ). The wavelengths of electromagnetic 24
26 radiation used in UV-Vis spectrometry are shorter than those used in IR, while those of NMR are the longest. Units of Frequency or Wavelength. We could use a single set of units to describe the full range of frequencies (or wavelengths) for the whole electromagnetic spectrum, but again this is not done in practice. Each type of spectrometry traditionally has its own set of units and conventions that describe its portion of the electromagnetic spectrum. This may seem confusing, but these methods evolved during different periods of time and in the laboratories of different types of scientists. This is a fact of organic spectrometry that may never change, so we describe their units and conventions as we present and discuss each of these types of spectrometry. Nevertheless, it is very important for you to keep in mind the relative energy, frequency, and wavelength relationships between UV-Vis, IR, and NMR that we show in Figure 5.13 even if you have difficulty seeing the relationship between the different units of frequency or wavelength that are used for each type of spectrometry. Basic Spectrometer Design (5.3B) Each spectrometric technique uses a spectometer to (a) provide the electromagnetic energy to the organic compound, and (b) monitor the results of that application of electromagnetic energy. Spectrometer Components. The detailed design, construction, and overall appearance of NMR, IR, and UV-Vis spectrometers differ greatly, but they share common features that we show using the "block" diagram in Figure Figure 5.16 The source provides photons of electromagnetic energy to the sample that is enclosed in a sample chamber. The detector senses energy absorbed (or transmitted) by the sample, and this absorption (or transmission) of energy is displayed on a spectrum generated by a computer that processes data from the detector. Spectral Peaks. The names of the components of these spectrometers sound similar to those of mass spectrometers, but there is a major difference in the nature of the data displayed in spectra from UV-Vis, NMR, and IR spectrometers compared to mass spectra. Individual peaks in a mass spectrum correspond to different molecular species (cations) that have different mass values. In contrast, all of the individual peaks (or signals) in an NMR, IR, or UV-Vis spectrum are due to a single molecular species when a single compound is placed in the sample chamber. 25
27 The multiple peaks that we will see in most NMR, IR, or UV-Vis spectra show the response of the molecule to irradiation with energy of a value that corresponds to the position of each peak in the spectrum. As a result, the horizontal axes of NMR, IR, and UV-Vis spectra correspond to the range of energy values for the electromagnetic radiation used in each of these specific types of spectrometry. 5.4 Nuclear Magnetic Resonance Spectrometry From the standpoint of an organic chemist, probably the single most important tool for structure determination of organic molecules is Nuclear Magnetic Resonance Spectrometry (NMR) that uses low energy radiation in the radio/television frequency region of the electromagnetic spectrum. We begin with a qualitative description of the technique, and follow this with an extensive discussion of the information about molecular structure that NMR spectra provide. The NMR Spectrometer (5.4A) The block diagram of an NMR spectrometer in Figure 5.17 is comparable to the generic spectrometer diagram in Figure 5.16, but it has a number of specialized features. Figure 5.17 We call the sample chamber in the NMR spectrometer the probe, and it contains coils of wire that (a) transmit radio frequency radiation to the sample, and (b) detect how the sample deals with that electromagnetic radiation. Since the radiation is radio waves (radio frequency energy) (rf), the source and detector are usually called the transmitter and receiver, respectively. A special feature of an NMR spectrometer is that the probe is surrounded by a powerful magnet. A liquid sample of an organic compound (usually in dilute solution in a solvent), is placed in a glass sample tube (sealed on one end like a test tube) that has overall dimensions comparable to a thin ball point pen or pencil (its diameter is typically 5 mm or about 3/8"). This sample tube is placed in the probe of the NMR spectrometer and irradiated with rf energy. A magnet surrounds the probe because organic compounds do not absorb radio frequency (rf) radiation unless they are in a magnetic field. When surrounded by the magnetic field, only certain types of atomic nuclei in a molecule are able to absorb rf radiation. The specific energy of the absorbed rf radiation gives information about the type of nucleus absorbing the radiation and where it is located in a molecule. 26
28 1 H and 13 C are NMR Active Nuclei (5.4B) Atomic nuclei that absorb radio frequency radiation when placed in a magnetic field include 1 H and 13 C atoms (isotopes). Since organic compounds are primarily composed of carbon (C) and hydrogen (H), NMR identifies the various types of H and C atoms in organic molecules. Organic chemists study 1 H atoms and 13 C atoms in different NMR experiments. When we study H atoms by NMR, we call the spectrum that we obtain a Hydrogen NMR spectrum, or a Proton NMR spectrum. When we examine C atoms by NMR, we refer to the resulting spectrum as a Carbon-13 (or 13 C) NMR spectrum. Since 1 H isotopes of hydrogen have a natural abundance of %, almost every hydrogen atom in an organic compound is 1 H. In contrast, the 13 C isotope of carbon has a natural abundance of only about 1% so most carbon atoms are 12 C that do not absorb rf energy. In spite of this, any sample of an organic compound contains many molecules with 13 C atoms randomly distributed at all possible carbon locations. We will show and discuss 13 C and 1 H NMR spectra for a variety of different types of organic compounds in the following sections and focus on how organic chemists use these spectra both to determine and to confirm molecular structure. Other Nuclei that Absorb Radio Frequency Energy. (F, P, B, N, etc)(magnetically active) C NMR Spectrometry We begin with 13 C NMR spectrometry, but much of what we learn in this section applies directly to the discussion of 1 H NMR that will follow. General Considerations (5.5A) A typical 13 C NMR spectrum of a compound contains a series of lines (also called peaks or signals) that correspond to each type of C atom in the compound. The locations of these signals in the spectrum depend on the molecular structure of the organic compound and the types of atoms that are directly and indirectly bonded to each C. We illustrate how these bonded atoms affect the location of 13 C NMR signals using 13 C spectra of several specific compounds as examples. We present and discuss these spectra before we explain all of the information that they contain. In particular, we will defer our discussion of the horizontal axis labelled chemical shift (δ) until later in this section. For now it is enough to know that the chemical shift δ values ("delta" values) on the horizontal axis are related to the frequency (or energy) of the rf radiation that each 13 C atom absorbs. 27
29 Some 13 C NMR Spectra (5.5B) We show 13 C NMR spectra for six unbranched alcohols in Figure 5.18 along with their chemical structures. Figure 5.18 When we ignore the peak at δ 0, and the group of three peaks at about δ 77 that are not due to these alcohols, as we explain later, we see that the spectrum of each alcohol contains the same number of peaks as there are C's in the alcohol. This occurs because each C atom in each alcohol is in a unique environment compared to the other C's in that same alcohol. Methanol versus Ethanol. Since each methanol (CH 3 -OH) molecule contains just one C atom, its 13 C NMR spectrum has only a single 13 C NMR peak or signal and it is located at δ In contrast, each ethanol molecule (CH 3 -CH 2 -OH) has two C's that are in different molecular environments from each other. Both C's of ethanol are bonded to each other by a C-C bond, but one is bonded to an O atom while the other has only C-H bonds. This results in a 13 C NMR spectrum for ethanol that shows two signals that are located at δ 58.0 and δ 18.2, respectively. The Other Alcohols. Since C atoms in different molecular environments give discrete signals, we should not be surprised that 1-propanol (CH 3 -CH 2 -CH 2 -OH) has a 13 C NMR spectrum with three separate signals ( δ 64.3, δ 25.8, and δ 10.2). Successive additions of CH 2 groups to 1-propanol to give 1-butanol, 1-pentanol, and finally 1-hexanol increases the number of signals by one per CH 2 group so that the 13 C spectrum for each of these alcohols contains the same number of signals as there are C's in the alcohol. 13 C NMR Chemical Shifts (δ) (5.5C) The chemical shift value (δ) value) of each peak in these alcohols reflects the chemical environment of the C atom giving the peak. Generalizations for these Alcohols. Besides the fact that 13 C NMR spectra for these alcohols have the same number of signals as they have C atoms, you can see that 1-propanol, 1- butanol, 1-pentanol, and 1-hexanol each have one signal at about δ 60, and another just below δ 15. Organic chemists have determined that the δ 60 signals for these four alcohols correspond to C bonded to O in CH 2 -OH, while the signals below δ 15 are each due to C in CH 3. From these observations, we can conclude that a 13 C NMR signal near δ 60 in a spectrum of a molecule could be due to a CH 2 -OH group in the molecule, while the presence of a peak below δ 15 could indicate that the molecule contains a CH 3. 28
30 29
31 30
32 The signals for the other C's in these molecules have δ values between δ 15 and δ 60. Although each signal corresponds to a C in a CH 2 group between two carbons (C-CH 2 -C), the δ value depends on the number of bonds that separate them from the OH group. Because the chemical environment of a C in a molecule determines its 13 C δ value, chemists refer to δ values, and the separation between the individual signals in an NMR spectrum, as chemical shifts. Chemical Shifts Depend on Electron Density. The chemical shift of the C in C-CH 2 -OH is greater than that of the C in any C-CH 2 -C because the electron density at the C in C-CH 2 -OH is less than that at the C in C-CH 2 -C. The highly electronegative O of OH (Chapter 3) decreases electron density on adjacent atoms so that a C directly bonded to O experiences lower electron density than the C's not directly bonded to O. This is reflected in the polar character of C-O bonds that we described in Chapter 3 and show again in Figure Figure 5.19 The effect of O on the electron density at a C decreases as the the number of bonds increases between an O and C as you can see in Figure 5.20 from the chemical shift values for the various C's in hexanol. Figure 5.20 The CH 3 group in 1-hexanol has the lowest δ value and is separated from the OH group by the most bonds. However this is not the only reason that it has a low δ value. While the δ value for CH 3 increases (?check this versus figs?) going from methanol to ethanol, and then to 1-propanol, it is essentially constant in 1-butanol, 1-pentanol, and 1-hexanol even though it's separation from oxygen continues to increase from 4 to 6 C's (Figure 5.18). Although its chemical shift is partly determined by its relationship to O, a major difference is that it is CH 3 rather than CH 2. The number of C's bonded to a C also influences its electron density contributing to the observed chemical shift difference between CH 2 and CH 3 groups. Other Factors Effect δ Values. Other structural changes affect the δ values of CH3 and other C containing groups. We show several alkanes and cycloalkanes in Figure 5.20a and the approximate δ values for each of their C's. Figure 5.20a From these δ values, you can see that the chemical shift for a CH3 group also depends on the number of C's attached to its directly adjacent C. For example, the δ value for the CH3 groups labelled (a) increases from 14 to 22 to 29 as the branching increases on the C to which it is attached. 31
33 32
34 Prediction of 13 C δ Values. The data in Table 5.2 show how different functional groups affect the chemical shifts of C atoms. We can use them in combination with δ values for unsubstituted compounds, such as those shown in Figure 5.20a, to estimate δ values of 13 C in compounds with halogens (X), OR, or NR 2 groups. Table 5.2. Additive Effects of Y Groups on 13 C Chemical Shift Values of C's in Compounds with the General Structure C(γ) C(β) C(α) Y Y C(α) C(β) C(γ) CH O H O R NH NHR NR F Cl Br I We can approximate the δ value of C atoms in simple molecules containing these functional groups (Y) by adding the appropriate number from Table 5.2 to the δ value for a comparable C in the corresponding unsubstituted compound where Y = H. Calculations for 1-Hexanol. (aside?)as an illustration, let's use the data in Table 5.2 and Figure 5.20a to estimate δ values for the C's in 1-hexanol and then compare them to those actually observed. We can imagine that 1-hexanol originates from hexane if we replace an H on one of its CH 3 groups by an OH group. We show these two compounds in Figure 5.20b along with experimentally measured δ values for each C atom from 13 C NMR spectra (the numbers not in parentheses), and δ values that we calculate (the numbers in parentheses) as we illustrate below. Figure 5.20b The C of CH 3 in hexane, and the C with the OH group in 1-hexanol, are α carbons and their bonded C's are β, and γ, respectively. When we add the appropriate numbers from the C(α), C(β), and C(γ) columns for the OH group to the δ values for C(α), C(β), and C(γ) in hexane, we predict a chemical shift for C(α) in hexanol of δ 59 ( ), for C(β) of δ 33 ( ), and for C(γ) of δ 27 (32 + (- 5)). You see that these predicted δ values are very close to those actually observed. You can also see that the observed δ values for C's further from the OH group than C(γ) are the same as those on hexane 33
35 since correction for a functional group is usually unnecessary at C atoms more than three C's away from it. δ Values and Electronegativity. The data in Table 5.2 show that the magnitude of the effect of a functional group on δ values depends on the electronegativity of the atom of that functional group directly bonded to the C skeleton. The effects of OH or OR are greater than those of NH 2, NHR, and NR 2, while they all have greater effects than CH 3 consistent with the order of relative electronegativities O > N > C. F has the biggest effect since it is the most electronegative atom in the periodic table, and the effect of a halogen on δ values decreases in the electronegativity order F > Cl > Br > I. The magnitude of the effects for Cl, Br, and I are smaller than we might expect based on their actual electronegativity values. The very small effect of I on the δ value on C(α) is particularly striking and there is no simple explanation for this observation. Chemically Equivalent Carbons. Each C atom in each alcohol in Figure 5.18 gives a separate 13 C NMR signal because each C is in a different environment compared to the others in the same molecule. However, when two or more C's in a molecule are chemically equivalent they do not give separate peaks. We illustrate this by comparing the 13 C NMR spectra of bromoethane, 1-bromopropane and 2-bromopropane in Figure Figure 5.22 Although bromoethane with two C's gives two 13 C NMR signals and 1-bromopropane with three C's gives three signals (remember that the small peaks at δ 0 and δ 77 are not due to these bromoalkanes), the spectrum of 2-bromopropane has only two signals even though it has three C atoms. This occurs because the two CH 3 groups in 2-bromopropane are chemically equivalent! They each have exactly the same relationship to the Br functional group, and the rest of the molecule, and you can even consider them to be mirror images of each other as we illustrate in Figure Figure 5.23 We can identify the C or C's giving rise to each signal in these spectra from their chemical shift values. In each spectrum the signal with the highest δ value corresponds to the C directly attached to the electronegative Br, while those with the lowest δ values are for CH 3 groups analogous to what we observed with the alcohols. The C-CH 2 -C signal for 1-bromopropane has an intermediate chemical shift for the same reasons as the C-CH 2 -C groups in alcohols (Figure 5.18). 34
36 35
37 Additional Details about NMR Spectra (5.5D) In order to complete our discussion of 13 C NMR spectrometry we introduce some additional terminology and explain those extra signals at δ 0 and δ 77 that we mentioned earlier and have seen in these spectra. Shielding. When two 13 C atoms have different chemical shifts, we say that the C with the smaller δ value is shielded compared to the C with the larger δ value. We use this term because electron density that shields the C atom is higher at the C with the lower δ value. In any NMR spectrum, the smaller the δ value of a signal, the more the atom giving that signal is shielded. Conversely, the larger the δ value, the more the atom is deshielded. NMR spectra display signals with larger δ values on your left as you face the spectrum and those with smaller δ values on your right (the δ 0 value is at the far right). As a result, signals on the left hand side of the spectrum correspond to atoms that are deshielded while those on the right hand side of the spectrum correspond to atoms that are shielded (Figure 5.21). Figure 5.21 High and Low Field. For historical reasons, chemists call the region of the spectrum with low δ values (the right hand side of a spectrum) the high field or upfield region of the spectrum( Figure 5.21). Conversely, the region of the spectrum with large δ values (the left hand side of a spectrum) is the low field or downfield region. These terms arose because of the way that early NMR spectrometers operated. Although these descriptions no longer make sense in terms of the way modern spectrometers operate, chemists continue to routinely use them to describe NMR spectra. The TMS Reference in 13 C NMR. We mentioned at the beginning of our discussion of 13 C NMR, that δ values for 13 C atoms are related to the amount of rf energy absorbed by 13 C atoms. We provide an exact definition of δ values in Appendix xx where we present basic theory for NMR spectrometry. For our purposes here, you simply need to know that a δ value is the difference in the spectral location of the signal for a 13 C atom in our compound of interest and the single 13 C signal of tetramethylsilane (TMS) (Figure 5.23a) that we call an internal reference standard. The small peak at δ 0 that we have seen in each spectrum is due to TMS. Figure 5.23a TMS gives a single 13 C NMR signal because all four of its C's are chemically equivalent. This signal appears at very high field because Si has a lower electronegativity than C so its bonded C atoms are highly shielded. Chemists define the chemical shift of the TMS 13 C signal as δ 0 and 36
38 reference the chemical shifts of all other 13 C signals to it since its 13 C signal is at higher field than those of most other C atoms in organic compounds. The δ scale increases from the righthand end (the high field end) to the left-hand end (the low field end) on the spectrum so that 13 C signals for C's in other compounds have positive chemical shift values. TMS is called an internal reference standard because it is added to samples whose NMR spectra are being determined and because it defines the δ scale for their spectra. Organic chemists chose TMS as the internal reference standard because it has four chemically equivalent C atoms that are highly shielded, and because it does not react with most organic compounds or solvents. It has a low boiling point of 27 C so it is easily removed from most NMR samples. Solvents Used in NMR Spectrometry. The set of three small peaks at δ 77 that we have seen in NMR spectra, is due to the 13 C atom in DCCl 3 (deuterochloroform) used as a solvent for the organic compound. This C atom gives 3 peaks in 13 C NMR spectra because of the deuterium (D) atom. Deuterium (D) is the common name for the 2 H isotope of H that we mentioned along with 1 H in our earlier discussion of mass spectrometry. We will explain in our subsequent discussion of 1 H NMR why D causes the 13 C signal of DCCl 3 to be three peaks. Chemists use DCCl 3 ( 2 HCCl 3 ) as an NMR solvent (rather than the less expensive and readily available undeuterated chloroform ( 1 HCCl 3 )) because of its D ( 2 H) atom. 13 C NMR spectrometers use the magnetic characteristics of deuterium (D) as a reference point for their electronic systems in a way that is vital to obtaining NMR spectra but not necessary for us to understand at this level. We will see another benefit of the presence of D ( 2 H) instead of 1 H in this solvent when we discuss 1 H NMR. While DCCl 3 is an excellent solvent for a wide variety of organic compounds, it is not always the best choice. Sometimes other deuterated organic solvents are used and examples are shown in Table 5.xx. Their 1 H atoms are replaced by D for the same reasons that we described for DCCl 3. Table 5.xx. Qualitative Predictions of 13 C Spectra (5.5E) With practice, you will be able to look at the structure of a molecule and predict which C's are chemically equivalent (give the same NMR signal) or non-equivalent (give different signals). Two carbons are nonequivalent if at least one group on one C differs from one group on the other 37
39 C. This difference can occur some distance from the actual C giving rise to the NMR signal as we illustrate with the alcohol 5-undecanol in Figure Figure 5.24 Although the two terminal C's of this compound are each in CH 3 groups, they are non-equivalent even though both are bonded to several CH 2 groups. C1 is separated from the C-OH group by 3 CH 2 groups, while C11 is separated from that same C-OH by 4 CH 2 groups. In this case the C- OH group is far away from either CH 3 group, so their chemical environments differ only slightly and their δ values are very similar. In order to predict the chemical shift of a 13 C NMR signal for a specific C atom in a molecule, organic chemists make use of extensive chemical shift data that have been compiled in tables and in libraries of NMR spectra. We summarize some of these data in Table 5.yy and include a more extensive compilation with references to other sources of this information in Appendix xx. Table 5.yy H NMR Spectrometry We have just seen that 13 C NMR spectra show a series of signals that correspond to each chemically non-equivalent C in a molecule, so we should not be surprised that 1 H NMR (or Proton NMR) spectra show signals for each chemically non-equivalent H atom in a molecule. We illustrate this using examples of Proton NMR spectra that we present and discuss below. 1 H versus 13 C NMR Chemical Shifts (5.6A) Before we examine 1 H NMR spectra of different organic compounds, it is important for you to understand that these 1 H NMR spectra only show signals for 1 H atoms. The NMR signals corresponding to 13 C atoms do not appear on these spectra since the range of radio frequency (rf) energy that 1 H atoms in a magnetic field absorb is significantly different than that absorbed by 13 C atoms in the same magnetic field. It is necessary to use different rf transmitters on the spectrometer, or even different spectrometers, to obtain both 1 H and 13 C NMR spectra. This difference in radio frequency range for 13 C and 1 H NMR spectrometry is not apparent from their spectra since both use the symbol δ for the horizontal chemical shift axis and both types of spectra have δ 0 on their far right end of the chemical shift scale. You will see below that δ values in 1 H NMR spectra fall in the range of δ 0 to δ 10, and you have already seen that 13 C NMR spectra have δ values ranging from δ 0 to δ xx. While it looks like the δ range from 0 to 10 of an 1 H NMR spectrum might overlap the δ 0 to δ 10 range on a 13 C spectrum, this is not the case since these δ scales are separately defined for 13 C and 1 H NMR spectrometry. We have 38
40 discussed the δ scale for 13 C spectra above and will describe the 1 H δ scale later in this section. We present a more detailed discussion relating these δ scales to absolute rf frequency values in Appendix xx. 1 H NMR Spectrum of Bromoethane (5.6B) We illustrate the basic fundamentals of 1 H NMR using the 1 H NMR spectrum of bromoethane that we show in Figure Figure 5.25 The Origin of the 1 H NMR Signals. This spectrum is more complex than the 13 C NMR spectrum of the same compound shown in Figure When you count the number of peaks (excluding that at δ 0 for the internal reference standard), you see 7 peaks although there are only 5 H's in the molecule. In reality, these 7 individual peaks actually make up only two 1 H NMR signals in this 1 H NMR spectrum due to the two chemically non-equivalent types of H in 1- bromoethane. One signal is the group of 3 peaks centered at about δ 1.7 and the other signal is the group of 4 peaks centered at about δ 3.4. The signal (group of 3 peaks) centered at δ 1.7 is due to the H's of the CH 3 group, and the other signal centered at δ 3.4 (group of 4 peaks) is due to the H's of the CH 2 Br group, as we show on the spectrum in Figure These chemical shift values of δ 1.7 and δ 3.4 result from an effect of Br on electron density at these H's that is analogous to the effect of Br on 13 C NMR signals that we described earlier. The more electronegative Br atom causes the H's on CH 2 Br to be deshielded and to appear downfield from those of the CH 3 group. The Shapes of the Signals. Even though there are 3 peaks centered at δ 1.7 for the CH 3 hydrogens, and 3 H's on that carbon, the number of peaks in that signal is not the result of the number of H's on CH 3. Note that there are 4 peaks centered at δ 3.4 for just 2 H's of the CH 2 Br group. All three H's on CH 3 are chemically equivalent to each other because of rapid C-C rotation, so they should give the same NMR signal, and the same is true for the two H's on CH 2 Br. We will see in the next section that the 3 peaks in the CH 3 signal are the result of the 2 H's on the adjacent CH 2 Br group, and that the 4 peaks in the CH 2 Br signal result from the 3 H's on its adjacent CH 3 group. 39
41 40
42 C-C Rotation and Chemical Equivalency. The reason for chemical equivalency of the 3 H's of CH 3, and of the 2 H's of CH 2, is rapid rotation about the C-C bond that we described in Chapter 2 and illustrate in Figure Figure 5.26 If C-C rotation did not occur, each of the H's on CH3 would be in a different environment in the molecule. For example, in the first structure H(a) is anti to Br, while both H(b) and H(c) are gauche to Br. We would expect anti H(a) to give one NMR signal, and gauche H(b) and H(c), to give a separate NMR signal. However C-C rotation is rapid compared to the time required for the NMR spectrometer to detect absorption of rf energy by H's, so the environment of each H on CH3 is averaged and appears to be the same. The same is true for the H's in the CH 2 group. Signal Splitting in 1 H NMR Spectra (5.6C) In 1 H NMR spectra the NMR signal for an H, or group of chemically equivalent H's on the same C (such as the three H's on a CH 3 group), is split into multiple peaks by one or more chemically different H atoms on directly bonded C atoms. We call the rule that governs how H's on adjacent C's split a 1 H NMR signal the n+1 rule, and we illustrate it below using 1 H NMR spectra of bromoethane, 1-bromopropane, and 2-bromopropane. 1-Bromoethane. The n+1 rule predicts that the 1 H NMR signal for the H's on CH 3 of 1- bromoethane (Figure 5.25) will be split into a signal of n+1 peaks by the n equivalent H's on the CH 2 Br group. Since there are 2 chemically equivalent H's on CH 2 Br (n = 2), we expect the CH 3 signal to be 3 peaks (n+1 = 2+1 = 3) and that is what we observe (Figure 5.25). This triplet signal for CH 3 has a characteristic shape, that we discuss later in the chapter, where the central peak is about twice the height of each of the outer two peaks (Figure 5.27). Figure 5.27 The n+1 rule also predicts that the 1 H NMR signal for the chemically equivalent H's on CH 2 Br should be split into 4 peaks by the 3 equivalent H's on the adjacent CH 3 into 4 peaks (n+1 = 3+1 = 4). We call this group of four peaks a quartet and it has a characteristic shape where each of the two inner peaks is about three times higher than each of the two outer peaks (Figure 5.28). Figure Bromopropane. The compound 2-bromopropane has two different types of H atoms (Figure 5.29). Figure 5.29 While the H on CHBr is in a different chemical environment than any of the H's on the two CH 3 groups, the two CH 3 groups are chemically identical as we saw earlier from its 13 C NMR 41
43 42
44 spectrum (Figure 5.22). Since C-C rotation makes all of the CH 3 H's chemically equivalent, we expect the 1 H NMR spectrum of 2-bromopropane to have separate signals for CHBr and CH 3 CBr at chemical shift values similar to those of the analogous H's in the spectrum of bromoethane (Figures 5.27 or 5.28). You can see that in addition to the internal reference peak at δ 0, the 1 H NMR spectrum of 2- bromopropane in Figure 5.30 shows the expected two signals. The signal at about δ 1.7 is a doublet, while the other signal at about δ 4.3 has seven peaks (a septet). Figure 5.30 The δ 1.7 chemical shift is consistent with that for CH 3 -CBr (see the spectrum for bromoethane in Figure 5.xx) while the downfield signal at δ 4.3 is deshielded as we would expect for CHBr. The splitting of these two signals follows the n+1 rule and supports their assignment. The H on CHBr is a septet (n+1 = 6+1 = 7) because there are 6 (n = 6) chemically equivalent adjacent H's (those on the two CH 3 groups). In contrast, the two CH 3 groups are chemically equivalent, so they give only one NMR signal that is a doublet (n+1 = 1+1 = 2) because of the single H (n = 1) on the adjacent CHBr group. 1-Bromopropane. Based on our analyses of bromoethane and 2-bromopropane, we would predict that 1-bromopropane (Figure 5.31) should give a 1 H NMR spectrum with three signals that correspond to the H's in the CH 3 -C, C-CH 2 -C, and CH 2 Br groups. Figure 5.31 We also expect Br to affect chemical shifts as we previously observed for bromoethane and 2- bromopropane causing H's on CH 2 Br to appear at lowest field (largest δ). Those on CH 3 -C furthest from Br should appear at the highest field (smallest δ), while those on C-CH 2 -C should be between these other two signals. The spectrum of 1-bromopropane in Figure 5.31a confirms these predictions. Figure 5.31a The highest field signal is for CH 3 (about δ 1.0) and it is split into a triplet by the 2 (n = 2) adjacent chemically equivalent H's on its bonded CH 2 group. Similarly, the lowest field signal, for CH 2 Br (about δ 3.4), is also split into a triplet by the 2 H's of the same CH 2 group. Note that the chemical shift of this lowest field signal (δ 3.4) is virtually identical to that of CH 2 Br in bromoethane. In contrast, the chemical shift for CH 3 in 1-bromopropane (δ 1.0) is significantly less than that for CH 3 in bromoethane or 2-bromopropane (both about δ 1.7). The 43
45 44
46 high electronegativity of Br has less influence on CH 3 in 1-bromopropane than in these other two compounds because Br is further from CH 3 in 1-bromopropane. The splitting pattern for the CH 2 group results from the H's on both the adjacent CH 3 and CH 2 Br groups. While the pattern turns out to be a sextet (n+1 = 5+1 = 6) consistent with the total of 5 (n = 5) adjacent H's on these two groups, the n+1 rule cannot generally be applied in this way to this type of splitting situation. When the 1 H NMR signal of an H (or set of chemically equivalent H's) on a C is split by H's on two or more adjacent C atoms that are chemically different, the observed splitting pattern may not always appear to follow the n+1 rule. We discuss this further in Appendix xx.(?) Aside about this (?) xxxx The Origin of 1 H NMR Signals. 1 H atoms in organic molecules absorb rf energy and give NMR signals because each 1 H atom has two different nuclear spin states that have different energy values in a magnetic field (Figure 5.xx). Figure 5.xx The number of 1 H nuclei in each spin state is almost equal because the energy difference between these states is small, but slightly more nuclei are in the lower energy spin state than in the higher energy spin state. The chemical shift of a peak in an NMR spectrum reflects the amount of energy (ΔE) required to excite the specific 1 H nucleus from its lower energy nuclear spin state to its higher energy nuclear spin state. ΔE depends not only on the magnitude of the magnetic field, but also on the chemical environment of each 1 H atom. As a result, chemically non-equivalent 1 H atoms give signals with different chemical shifts. The Origin of Signal Splitting in 1 H NMR Spectra. The two different spin states of 1 H atoms are also responsible for the n+1 splitting of 1 H NMR signals that we have just described. For example, HCCl 2 -CBr 2 H should give a 1 H NMR spectrum with two 1 H NMR signals since it has two chemically different H's, and the n+1 rule predicts that each signal should be a doublet (n+1 = 1+1 = 2) because each CH group has one H atom (n = 1) on its adjacent C. The doublet pattern for H a in H a CCl 2 -CBr 2 H b arises because H b has two spin states that we symbolize and. H b ( ) and H b ( ) have slightly different effects on the rf energy absorbed by H a so we see two different peaks (a doublet) for H a. Similarly, the H b doublet signal arises because H a ( ) has a slightly different effect than H a ( ) on the rf energy absorbed by H b. Since an NMR signal is due to the existence of nuclear spin states, for the atom giving the signal, and 45
47 since it is split due to different nuclear spin states of adjacent H atoms, this signal splitting phenomenon is generally referred to as spin-splitting or spin-spin-splitting. (do a triplet or quartet? as an aside?) Spin-Spin-Splitting in 13 C NMR Spectra Why did we see no spin-spin-splitting of signals in 13 C NMR spectra? 1 H- 13 C Spin-Spin-Splitting. 1 H atoms should split 13 C NMR signals in 13 C NMR spectra for the same reasons that they split 1 H peaks in 1 H NMR spectra. However we saw no splitting of peaks in the 13 C NMR spectra that we showed earlier. The reason that 1 H- 13 C spin-spin-splitting does not occur in these 13 C NMR spectra is because they were obtained using the proton decoupled mode of the 13 C NMR spectrometer. This electronic mode of operation prevents 1 H nuclei from splitting 13 C NMR signals of 13 C atoms in the same molecule. Sometimes it is useful to see this 1 H- 13 C spin-splitting and 13 C spectra can be obtained with proton decoupling turned off. We show an example of 13 C spectra obtained with and without proton decoupling in Figure Figure 5.32 Organic chemists use proton decoupling to obtain 13 C NMR spectra because 1 H- 13 C splitting is large and complicates a 13 C NMR spectrum (Figure 5.32). It is useful to see only one NMR signal for each chemically non-equivalent 13 C atom. Because the detailed structural information that spin-spin-splitting provides about neighboring atoms is also present in 1 H NMR spectra, the information from both 1 H and 13 C NMR spectra (along with the mass spectrum of a compound) often lets us determine the chemical structure of an organic compound. 13 C- 13 C Spin-Spin-Splitting in 13 C NMR Spectra. 13 C atoms in organic compounds give NMR signals because like 1 H atoms they have two nuclear spin states with different energies when they are in a magnetic field. This means that 13 C atoms should split NMR signals of their bonded 13 C atoms, but we do not see such splitting. Because the natural abundance of 13 C is only about 1%, each 13 C atom in an organic molecule is almost always bonded to 12 C atoms that have no nuclear spins. As a result, 12 C atoms do not affect the energy difference between the lower and higher spin states of 13 C atoms so we see only single peaks for 13 C atoms with chemical shifts that depend just on their chemical environment and the magnitude of the magnetic field of the NMR spectrometer (Figure 5.31b). Figure 5.31b 46
48 47
49 The Relative Intensity of NMR Signals (5.6D) So far we have not discussed the significance of the height or intensity of signals in NMR spectra. Signal Intensities in 1 H NMR Spectra. The signal intensity (the total area under a signal) in an 1 H NMR spectra is directly proportional to the number of H atoms giving rise to that signal. The computer in a 1 H NMR spectrometer that gathers the data also measures signal areas and can be programmed to display them as printed numbers and as integration curves on each NMR spectrum as we show in Figure 5.32a. Figure 5.32a The integration curve is the "stair-step" line superimposed on the normal spectrum. The relative height of each "step" corresponds to the relative area of each signal, and these relative areas are directly proportional to the relative numbers of H's giving rise to each NMR signal. Integration curves give relative ratios rather than absolute numbers of H atoms In order to use them to estimate the number of H's giving each NMR signal, we need to guess a value for the number of H's giving rise to a particular signal in the NMR spectrum. Based on that initial guess we can calculate a number of H's for each of the other signals from their relative areas. We often begin this process by guessing the number of CH 3 groups of a particular type since we can usually identify CH 3 signals as those with the highest field chemical shifts. An Example of the Use of Integration Data. We illustrate how organic chemists use an integration curve to calculate numbers of H atoms in a molecule with the 1 H NMR spectrum for 2-chlorobutane in Figure 5.32a. We have reproduced that spectrum again in Figure 5.33 showing the height (in mm) of each "stairstep" measured with a ruler. Figure 5.33 If the high field signal (a) is for a CH3 group, the 12 mm height of its "stair-step" corresponds to 3 H atoms. This means that one H should give a "stair-step height" of 4 mm in this spectrum. Based on this, signal (b) (12 mm) is also due to 3 H's (12 mm/4 mm = 3), signal (d) (4 mm) is due to 1 H (4 mm/4 mm = 1), while our calculations indicate that signal (c) (9 mm) corresponds to 2.25 H's (9 mm/ 4 mm = 2.25). This non-integral result for signal (c) can mean either our initial assumption of 3 H's for signal (a) was wrong, or there is inaccuracy in the measurement of the height of the stair-step for signal (c) (or for signal (a)) In this case, we know that the compound is 2-chlorobutane, and that we have correctly assigned the signals in Figure 5.32a, so one or both of our measurements is probably slightly off. If we hadn't known the structure, we would have to consider the possibility that signal (a) corresponds to 12 H's in a molecular formula because on that basis the integration data then gives the integral values of 48
50 12, 9, and 4 H's for signals (b), (c), and (d), respectively. This is a situation where mass spectral data should allow a clear choice between these two possibilities. We would expect the mass spectrum for 2- chlorobutane to show peaks at m/z values for C4H9Cl or its fragments, while mass spectral peaks for C16H36Cl4 would be observed at m/z values much greater than C4H9Cl. Signal Intensities in 13 C NMR Spectra. In contrast to signals in 1 H NMR spectra, the relative intensities of signals in 13 C NMR spectra are not quantitatively related to the number of 13 C atoms giving rise to a particular signal. The 13 C NMR signal intensities (areas) primarily depend on factors other than the number of atoms giving rise to that signal. These additional factors are relatively unimportant in 1 H NMR spectra, but they become dominant in 13 C NMR spectra causing 13 C NMR signal intensities to only crudely reflect the relative number of 13 C atoms giving rise to a particular 13 C NMR signal. 1 H NMR Chemical Shift (δ) Values (5.6E) We use the symbol δ for chemical shift values in both 1 H and 13 C NMR spectra even though chemical shift values in 13 C NMR and 1 H NMR are not directly related to each other. In spite of this, relative 1 H NMR δ values do reflect the same type of electronic shielding and deshielding that we described for 13 C NMR chemical shifts. For example, we have seen that signals for H's on C-Br carbons all have larger δ values than those for H's on C's without Br just as do the 13 C NMR shifts for these different types of C's. The relatively high electronegativity of Br pulls electron density from its bonded C that in turn borrows electron density from attached C-H bonds. We have summarized the effects of a variety of functional groups on 1 H chemical shifts in Table 5.3. Table 5.3. Chemical Shift Values (δ) for C-H Atoms in Molecules with Functional Groups. Y Group CH3-Y CH3-C-Y RCH2-Y RCH2-C-Y R2CH-Y R2CH-C-Y CH O H O R NH NR F Cl Br I
51 These δ values are for the H atoms in CH 3, RCH 2, and R 2 CH groups (the R's are simple alkyl groups) that have a functional group bonded directly to them (-Y) or are separated from the functional group by one C atom (-C-Y). The separating C atom in -C-Y is -CR 2 - where R's are H or simple alkyl groups. Chemical shift values for 1 H atoms on cycloalkanes depend on the size of the cycloalkane ring as we show for a series of cycloalkane rings in Figure 5.33a. Figure 5.33a We have provided more extensive tables of 1 H NMR δ values for a variety of organic compounds in Apppendix xx. The TMS Reference in 1 H NMR. A common feature of the δ scales for both 1 H and 13 C NMR spectra is that each uses tetramethylsilane (TMS) to define δ 0. The single 13 C signal of TMS is the δ 0 position for the 13 C NMR scale, while the signal for its H's is δ 0 for the 1 H NMR scale. TMS ((CH 3 ) 4 Si) has 12 H atoms that are all chemically equivalent just as all of its C's are chemically equivalent (see Figure 5.23a). As a result, these 12 H's give a single 1 H NMR signal with no spin-splitting. It is very convenient that the single internal standard TMS serves as the δ 0 reference point for both 13 C and 1 H NMR spectra. The Selectivity of NMR Spectrometry. Only nuclei with magnetic moments such as 13 C and 1 H absorb radio frequency energy and give NMR spectra. Furthermore, when we obtain an NMR spectrum for 13 C, we see no signals for 1 H and vice-versa. While this means that we have to take separate spectra to learn about both C and H atoms in an organic molecule, this restriction provides a selectivity that permits us to obtain the maximum amount of information about one type of nucleus with a minimum of competing extraneous information from other nuclei. Neither Infrared Spectrometry (IR) nor Ultraviolet-Visible Spectrometry (UV-Vis) that we now introduce in the rest of this chapter have this selectivity. 5.7 Infrared Spectrometry Before NMR spectrometry became routinely available in the late 1950's to study organic compounds, infrared spectrometry (IR) was the most important single instrumental method used by organic chemists for structure determination. While it continues to be a useful spectrometric technique, it now plays a decidely secondary role to NMR in organic structure determination. IR spectra are relatively complex and the structural information that they provide is much less specific than that obtained from NMR spectra. On the other hand, that complexity makes an IR spectrum a "molecular fingerprint" since no two organic compounds have exactly the same IR 50
52 51
53 spectra. As a result, when the IR spectrum of an unknown compound identically matches that of a pure sample of a known compound we can unambiguously conclude that our unknown compound has the same structure as the known compound. Infrared Energy Causes Molecular Vibrations (5.7A) We obtain infrared spectra of molecules by irradiating them with infrared energy of the electromagnetic spectrum (see Figure 5.13). This energy, associated with our sense of heat, causes molecular vibrations where chemical bonds in molecules bend and stretch as we illustrate in Figure Figure 5.34 Different kinds of chemical bonds, such as C-H and C-C bonds, require significantly different amounts of energy to stretch and/or bend. However, the energy required to stretch various C-H bonds at tetrahedral carbon, for example, shows only a small dependence on molecular structure. For this reason, while it is possible to identify signals in an IR spectrum as C-H stretching, it is difficult to distinguish between different kinds of C-H bonds making IR spectra much less selective than NMR spectra. The Infrared Spectrometer (5.7B) Chemists obtain IR spectra using an infrared spectrometer that has the same fundamental components that we illustrated in Figure While their physical appearance differs dramatically from those of NMR spectrometers, the basic components of IR spectrometers also include a source of electromagnetic energy, the sample chamber, a detector, and a computer. In contrast with NMR spectrometers, IR spectrometers do not have magnets since a magnetic field is not necessary for IR energy absorption by a molecule. IR Sample Cells. Because IR energy is "heat", the sample container cannot be made of glass. Glass does not absorb radio waves used in 13 C and 1 H NMR because it is primarily polymeric silicon dioxide ((SiO 2 ) x ) and has no C or H atoms. However it readily absorbs IR energy causing Si-O bonds to bend and stretch. You can convince yourself of this by touching a glass container filled with a hot liquid. As a result, IR sample cells are often made of inorganic salts such as solid NaCl, KCl, or KBr because these salts have no chemical bonds to absorb infrared radiation since they consist of cations (Na + and K + ) and anions (Cl - and Br - ) held together by electrostatic attraction. Solvents for IR Samples. Since NaCl, KCl, and KBr are partially soluble in a variety of organic solvents, and because organic solvents have chemical bonds that absorb IR radiation, 52
54 chemists often obtain IR spectra using pure solid or liquid samples of the organic compound. When this is not possible, they use solvents such as CHCl 3 or CCl 4 since they have only a few types of chemical bonds that absorb IR energy in regions of IR spectra that usually do not interfere with the most important spectral regions for other organic compounds. IR Spectra (5.7C) The detector in an IR spectrometer senses absorption of IR radiation by the organic compound in the sample cell and displays it as a series of "negative" or "upside-down" peaks at the specific energy values absorbed as we show in Figure 5.35 for the cyclic ether 1,4-dioxane. Figure 5.35 The Horizontal Axis. The range of electromagnetic radiation that the IR spectrometer uses is displayed on the horizontal axis of the spectrum using a quantity called the wavenumber (v ) that is defined by equation (3) where λ is the wavelength of the electromagntic radiation (see Figure 5.15). v = 1/λ (λ in units of cm) (3) Since λ in units of centimeters (cm) are used in this equation, wavenumbers have units of cm -1 that chemists call "reciprocal centimeters" or "centimeters to the -1". Wavenumbers are directly proportional to frequency (ν) because the frequency of electromagnetic radiation ν is equal to c/λ (c is the speed of light) as we show in equation (4). v = ν/c (4) Energy and frequency are also directly proportional (see equation (1)), so wavenumbers are also directly proportional to energy. Some IR spectra also show the wavelength λ of the electromagnetic radiation on their upper horizontal axis in units of micrometers (µm) that are also called microns. Since 1 cm = 10 4 µm, the relationship between v (in cm -1 ) and λ (in µm) is given by equation (5). v = 10 4 /λ (λ in units of µm) (5) The range of wavelengths (λ) for a typical IR spectrum is about 2.2 to 25 µm and this corresponds to a range of v values from 4600 to 400 cm -1. The highest energy IR radiation is at the left end of the IR spectrum as you view it and the lowest energy IR radiation is at its right 53
55 end. While horizontal axes of IR spectra are linear in v, they are usually divided into three separate regions that have different scale factors. This permits greater resolution of all of the IR signals that are closer together in some regions than in others. The Vertical Axis. The vertical axis of an IR spectrum is linear in a quantity called %- Transmittance (%T) as shown on the left-hand vertical axis in Figure 5.xx. %T is the percentage of IR radiation that passes through the sample at each value of λ or v. Organic chemists do not use %T values printed directly on the spectrum without correction because for practical reasons they adjust the spectrometer so that the 100%T baseline actually appears between the printed values of 90 to 95 %T. The right hand vertical axis of an IR spectrum is calibrated in Absorbance (A). Absorbance doesn't have specific units because it is defined in terms of logarithms as we show in equation (6) where T is Transmittance (T = %T/100).. A = log 10 (1/T) (6) For routine purposes, we do not describe the intensity of IR peaks in either %T or A, but simply as strong (s), medium (m), or weak (w). This is because relative peak intensity does not depend on the relative number of bonds that are stretching or bending. Relative peak intensities depend on a number of factors including changes in molecular dipole moments (Chapter 3) associated with molecular vibrations so they are not quantitatively useful in making specific structural assignments. IR Stretching and Bending Signals (5.7D) All chemical bonds bend and stretch, and there is region of infrared radiation corresponding to each of these types of motion for each chemical bond. Since these regions often overlap, IR spectra are complex even for relatively simple molecules. There are also discrete IR frequencies corresponding to coupled molecular vibrations that result from simultaneous motions of two or more bonds connected to the same atom. These aspects of IR spectra make it difficult to use them to assign specific molecular structures. However, types of chemical bonds or types of functional groups give characteristic IR absorption signals that appear in the same region of an IR spectrum more or less independent of the rest of the molecular structure. This allows us to use IR spectra to confirm the presence or absence of specific types of bonds and functional groups. 54
56 Characteristic IR Regions. We illustrate the IR spectral regions corresponding to stretching and bending of some specific types of chemical bonds in Figure Figure 5.38 We described molecules with C-H, N-H, and O-H single bonds in Chapters 1-3, and we briefly mentioned organic molecules that contain double bonds such as C=C, C=O, and C=N, and triple bonds such as C C, and C N, in Chapter 1. We will discuss molecules with multiple bonds in greater detail later in the text and discuss their IR spectral characteristics at that time. We will see that the distinct spectral regions for double and triple bond stretching vibrations make IR spectrometry particularly useful for identifying their presence in organic molecules. At this point we use IR spectra for some alkanes, alcohols, and amines to illustrate characteristic differences in C-H, N-H and O-H stretching frequencies that are observed for most of these types of compounds. Alkanes. The IR spectra of dodecane (CH 3 -(CH 2 ) 10 -CH 3 ) and of 2,2,4-trimethylpentane ((CH 3 ) 3 C-CH 2 -CH(CH 3 ) 2 ) in Figure 5.38a both show strong absorption between 3000 and 2800 cm -1 due to C-H stretching. Figure 5.38a In addition, they show C-H bending vibrations centered at about 1400 cm -1. There are other absorption peaks in each spectrum that we do not specifically identify that involve complex coupled vibrations specific to the individual molecules. Alcohols. The alcohol 2,2,4-trimethyl-1-pentanol in Figure 5.38b contains many C-H bonds similar to those in the two alkanes that we just discussed. Figure 5.38b As a result, its IR spectrum shows the characteristic C-H stretching vibrations around 2900 cm -1 and the C-H bending vibrations around 1400 cm -1. In addition, there is also a broad absorption band (or signal) centered near 3300 cm -1 that we did not see in the IR spectra of the alkanes. This band is the O-H stretching vibration that is characteristic of many O-H bonds as you can see in the IR spectra of methanol and ethanol (Figure 5.38c). Figure 5.38c 55
57 56
58 57
59 Although less useful for structure determination purposes, the C-O stretching vibration is relatively strong and appears in the vicinity of 1100 to 1000 cm -1 in these alcohol IR spectra. Amines. The IR spectrum of octanamine in Figure 5.38d shows two N-H stretching vibrations for the NH 2 group at about 3400 and 3300 cm -1, an N-H bend near 1600 cm -1, a weak C-N stretching band at about 1100 cm -1, and a broad band at about 800 cm -1 due to a vibration called the N-H wag. Figure 5.38d In addition to these bands, you should be able to pick out the characteristic C-H stretching and bending bands that we described earlier for alkanes and alcohols. More IR Later. It is important to repeat that some of the most powerful applications of IR spectrometry involve its use in studying compounds with multiple bonds. The features mentioned above are important and are often used to confirm structures, but they represent only a small sample of the utility of this spectrometric method. Detailed tabulations of IR absorption frequencies (and wavelengths) for all types of chemical bonds are given in a variety of books describing IR spectrometry and some are included in Appendix xx. 5.8 UV-Visible Spectrometry The final type of spectrometry that we discuss in this chapter uses electromagnetic radiation in the ultraviolet (UV) and visible (Vis) regions (Figure 5.13). In contrast with the complexity of IR spectra, and the detailed information provided by NMR and Mass spectra, UV-Vis spectra are often very simple and sometimes contain only a single broad peak. It is possible for different molecules to have virtually identical UV-Vis spectra, while many molecules have no UV-Vis spectra because they lack structural features required for a molecule to absorb electromagnetic radiation in the ultraviolet or visible frequency ranges. Structural Requirements for UV-Vis Spectra (5.8A) UV-Vis energy absorption occurs most often when a molecule contains two or more multiple bonds (C=C, C C, C=O, C=N, and/or C N) that alternate with single bonds (usually C-C bonds) in an arrangement such as C=C-C=C-C=C. We call molecules with such alternating single and multiple bonds conjugated, and they also have special physical and chemical properties, in addition to UV-Vis spectra, that we present and discuss in Chapter 11(?). Although we will defer our detailed discussion of UV-Vis spectrometry to Chapter 11, we outline its basic principles here so you can compare them with those of the three other major organic spectrometric methods that we have already studied. 58
60 UV and Visible Radiation Excites Electrons (5.8B) The source of a UV-Vis spectrometer emits electromagnetic energy ranging from visible to the more energetic ultraviolet (UV) radiation (Figure 5.13). UV or visible radiation excites electrons from bonding Π molecular orbitals (MO's) into antibonding Π MO's (Chapter 1). However UV or visible light energy of conventional UV-Vis spectrometers is not sufficiently energetic to excite electrons in most C-C, C-O, C-N, C-H, O-H, or N-H single bonds. While excitation of electrons in single bonds usually causes bond breakage and destruction of the molecule, electronic excitation processes involving conjugated multiple bonds are usually reversible. After excitation, the excited electrons return to their stable bonding orbitals so the process of taking the UV-Vis spectrum is non-destructive. The UV-Vis Spectrometer (5.8C) UV-Vis spectrometers have components analogous to those of other spectrometers using electromagnetic radiation (Figure 5.16) except, like IR spectrometers, they lack a magnet that is unique to NMR spectrometers. Their wavelength range extends from 200 nm (200 nanometers) to about 780 nm (1 nm = 10-9 meters (m)). The shorter wavelength region below 200 nm is also called UV radiation, but it is not routinely used by organic chemists because atmospheric oxygen absorbs UV radiation below 200 nm. The UV region of interest to organic chemists is between 200 and 380 nm, while radiation from 380 nm to 780 defines the visible region since the human eye can detect it. We show the colors associated with visible electromagnetic radiation in Figure 5.38e. Figure 5.38e UV-Vis Sample Cells. Since the full range of UV-Visible radiation passes through quartz glass without being absorbed this material is used for most UV-Vis cells. The more common Pyrex glass, that most laboratory glassware is made of, transmits electromagnetic radiation with wavelengths longer than 350 nm, but is not routinely used in UV-Vis sample cells because it absorbs light from 200 to 350 nm that is an important range of wavelengths for many organic compounds. Solvents for UV-Vis Spectrometry. Most organic compounds without multiple bonds do not absorb UV-Visible light, so many solvents are available that do not interfere with UV-Vis spectra of organic compounds. Three that dissolve a wide range of organic compounds are cyclohexane, "95% ethanol" (95% ethanol, 5% water), and 1,4-dioxane. Cyclohexane is nonpolar and dissolves non-polar compounds. In contrast, both ethanol and water are highly polar 59
61 60
62 so 95% ethanol dissolves polar compounds as we described in Chapter 3. Dioxane is intermediate in polarity and a choice between it or 95% ethanol often depends on whether or not the presence of OH groups in 95% ethanol is of concern. UV-Vis Spectra (5.8D) The detector of the UV-Vis spectrometer senses absorption of UV or visible radiation by the organic compound in the sample cell and displays this absorption in a spectrum like those in Figure Figure 5.39 The UV-Vis spectra in this figure are very similar even though they are for two very different molecules. This occurs because they depend primarily on the presence of the same conjugated multiple bond sequence O=C-C=C in each molecule. The Horizontal Axis. Unlike IR spectra where the baseline (100%-Transmittance of light) is at the top of the spectrum (see Figure 5.35), a typical UV-Vis spectrum has its baseline (100%-T) at the bottom. As a result, peaks increase in intensity as UV-Vis energy is absorbed by the sample. UV-Vis spectra usually display the wavelength of the UV or visible light on the horizontal axis in nanometers (nm) (1 nm = 10-9 meters = 10-3 µm). Angstroms. Older books and chemical literature often describe UV-Vis wavelengths in Å (angstroms). We defined the Å in Chapter 3 as 1 Å = 10-8 cm so 1 nm = 10 Å. As a result, the UV-Vis range of 200 to 780 nm is 2000 to 7800 Å. Since UV-Vis spectra are often very simple with large wavelength regions showing no absorption of UV or visible radiation, they do not have a standard spectral presentation such as those for NMR or IR spectra. NMR spectra always show the same chemical shift range (δ0 to δ10 for 1 H NMR or δ0 to δ200 for 13 C NMR), and IR spectra usually show the full wavenumber range of 4600 to 400 cm -1. In contrast, UV-Vis spectra generally show only the portion of the wavelength range where there is a significant absorption of electromagnetic radiation. The Vertical Axis. While IR spectra have vertical axes that are linear in %T, UV-Vis spectra usually have vertical axes that are linear either in absorbance (A) or log A. We previously showed the relationship between A and T in equation (6). The use of A or log A units facilitates our use of UV-Vis spectra to quantitatively measure the amount of a compound giving rise to a 61
63 particular peak since the concentration (c) of the compound is linearly related to A according to Beers Law (equation (7)). where A = absorbance A = ε c l (7) c = concentration of sample in mol/l l = pathlength of the cell ε = molar absorptivity Molar absorptivity (ε) is a proportionality constant that makes A at a particular wavelength equal to the product of c and l. The ε value at a particular wavelength is constant over a wide range of concentration values for the sample in a particular solvent so you can consider it a physical property of the sample. Chemists use log A values rather than absorbance (A) values as a matter of convenience to adjust the vertical scale for greater clarity in display. For organic chemists, important features of a UV-Vis spectrum include the wavelength positions of the peak maxima called the λ max values (pronounced "lambda max" values) for the compound, and the molar absorptivity values at each λ max (calculated from A or log A values), called the ε max values. Since UV-Vis spectra are usually simple, the absorption peaks for a compound are often reported simply as a series of pairs of λ max and ε max values. UV-Vis Spectrometry in Medicine. Because of the quantitative relationship between absorbance (A) and concentration (c), UV-Vis spectrometry is the basis of many clinical instruments used for diagnostic medical purposes to determine the presence and concentrations of a variety of substances in the body. This may seem surprising to you because not all compounds give UV-Vis spectra. However, analytical chemists, working with organic chemists and biochemists, have discovered a variety of specific chemical reactions that make medically important organic substances from the body visible by UV-Vis spectrometry. More UV-Vis Later. We will see later in this text, that both λ max and ε max values give information about the structure of organic compounds. However we do not yet have the necessary chemical background to use UV-Vis spectrometry as an aid to structure determination since its greatest use is with compounds that have conjugated multiple bonds. After we introduce these compounds in Chapter 12, we will present and discuss their UV-Vis spectra along with those of other molecules. At that time we will also provide a more detailed presentation of the physical phenomena that occur when a molecule absorbs UV-Vis radiation. 62
64 Chapter Review Spectrometry in Organic Chemistry (1) Mass spectrometry (MS), nuclear magnetic resonance spectrometry (NMR), infrared spectrometry (IR), and ultraviolet-visible spectrometry (UV-Vis) are used to determine molecular structures of organic compounds. (2) Analysis of a compound using one of these methods of spectrometry generates a spectrum with peaks or signals that give information about molecular structure. Mass Spectrometry (1) A mass spectrometer bombards molecules with high energy electrons causing them to lose one electron and become positively charged molecular ions (M +. ). (2) Molecular ions have excess energy and fragment to lower mass positive ions (fragment ions) and neutral radicals. (3) Mass spectra show a line (peak) for each positive ion at its m/z (mass/charge) value. (4) The m/z value of the molecular ion gives the mass of the original molecule. (5) M/z values of fragment ions, and the molecular ion, aid in determination of molecular structure. (6) The m/z value of a fragment or molecular ion reflects its specific isotopic composition. (7) Natural abundance of 1% 13 C in organic compounds gives small M + 1 peaks. (8) Isotopes of other atoms also lead to characteristic "isotope" peaks. (9) Branching and functional groups cause characteristic fragmentation reactions that aid in molecular structure determination. Spectrometry Using Electromagnetic Radiation (1) NMR, IR, and UV-Vis spectrometry use energy from the electromagnetic spectrum. (2) The electromagnetic spectrum includes X-rays, ultraviolet radiation, visible light, infrared radiation (heat), microwaves, and radio and television waves listed in order of decreasing energy. (3) Electromagnetic radiation comes in bundles or packets of energy called photons. (4) Photons of electromagnetic radiation are usually described in terms of their frequency (ν) and/or wavelength (λ). (5) Energy of electromagnetic radiation is directly proportional to its frequency (ν) (E = hν), and inversely proportional to its wavelength (λ) (E = hc/λ). (6) All spectrometers using electromagnetic radiation have a source of electromagnetic radiation, a sample compartment for the organic sample, a detector to analyze electromagnetic radiation passing through or resulting from the sample, a computer to analyze the data from the detector, and a printer to print a spectrum. Nuclear Magnetic Resonance Spectrometry (1) NMR spectrometers irradiate organic compounds with electromagnetic energy corresponding to the frequency range of radio and television waves. (2) Magnetic nuclei such as 13 C and 1 H must be in a strong magnetic field in order to absorb this electromagnetic radiation. 63
65 13 C NMR Spectrometry (1) 13 C NMR spectra that are proton decoupled show a single line (peak) for each chemically non-equivalent carbon atom in an organic molecule. (2) The positions of these lines (their chemical shift values (δ)) depend on the electron density at each C. (3) The range of δ values for a specific type of C is relatively independent of the molecule. (4) 13 C signals with small chemical shifts relative to the 13 C signal of tetramethylsilane (TMS) are at "high field" (C's are shielded), while those with large chemical shifts relative to TMS are at "low field" (C's are deshielded). 1 H NMR Spectrometry (1) 1 H NMR spectra show signals with one or more lines for each chemically non-equivalent H atom in a molecule. (2) Chemical shift scales for 1 H and 13 C are both referenced to TMS (δ0), but they are not directly related to each other. (3) Chemical shifts of H's depend on electron density in the same way as the chemical shifts of their bonded C's. (4) 1 H signals are split into n + 1 lines by the n chemically identical 1 H atoms on directly adjacent C's. (5) Relative areas under signals in 1 H NMR spectra are directly proportional to the relative number of H's giving those signals. (6) NMR spectra for 13 C and for 1 H atoms are determined in separate analyses. Infrared Spectrometry (1) Infrared spectrometers irradiate organic molecules with electromagnetic radiation that includes wavelengths we sense as heat. (2) IR energy causes chemical bonds to undergo molecular vibrations such as stretching and bending. (3) Energy values of specific molecular vibrations depend on the type of bonded atoms, and whether the bond is single, double, or triple. (4) IR spectrometers use infrared radiation at wavelengths (λ) between about 2.2 and 25 µm that correspond to a "frequency" range in wavenumbers (v ) (v = 1/λ) of 4600 to 400 cm -1. (6) Stretching or bending vibrations of specific types of chemical bonds occur in characteristic regions of IR spectra. (7) The relative intensities of IR signals in a spectrum are not quantitatively related to the relative number of bonds giving the specific molecular vibrations. UV-Vis Spectrometry (1) UV-Vis spectrometers irradiate molecules with ultraviolet radiation (λ = 200 to 380 nm), and visible light (λ = 380 to 780 nm). (2) Electromagnetic radiation in these wavelength ranges usually excites π electrons in conjugated multiple bonds from bonding molecular orbitals into higher energy antibonding molecular orbitals. (3) σ electrons in C-H and C-C single bonds, and π electrons in isolated (nonconjugated) C=C and C C multiple bonds, are not excited by UV-Vis radiation in these wavelength ranges. (4) UV-Vis spectra often appear identical for different molecules if they contain the same grouping of conjugated multiple bonds. 64
Organic Chemistry Tenth Edition
 Organic Chemistry Tenth Edition T. W. Graham Solomons Craig B. Fryhle Welcome to CHM 22 Organic Chemisty II Chapters 2 (IR), 9, 3-20. Chapter 2 and Chapter 9 Spectroscopy (interaction of molecule with
13C NMR Spectroscopy
 13 C NMR Spectroscopy Introduction Nuclear magnetic resonance spectroscopy (NMR) is the most powerful tool available for structural determination. A nucleus with an odd number of protons, an odd number
Infrared Spectroscopy 紅 外 線 光 譜 儀
 Infrared Spectroscopy 紅 外 線 光 譜 儀 Introduction Spectroscopy is an analytical technique which helps determine structure. It destroys little or no sample (nondestructive method). The amount of light absorbed
Chapter 13 Spectroscopy NMR, IR, MS, UV-Vis
 Chapter 13 Spectroscopy NMR, IR, MS, UV-Vis Main points of the chapter 1. Hydrogen Nuclear Magnetic Resonance a. Splitting or coupling (what s next to what) b. Chemical shifts (what type is it) c. Integration
INFRARED SPECTROSCOPY (IR)
") INFRARED SPECTROSCOPY (IR) Theory and Interpretation of IR spectra ASSIGNED READINGS Introduction to technique 25 (p. 833-834 in lab textbook) Uses of the Infrared Spectrum (p. 847-853) Look over pages
INFRARED SPECTROSCOPY (IR) Theory and Interpretation of IR spectra ASSIGNED READINGS Introduction to technique 25 (p. 833-834 in lab textbook) Uses of the Infrared Spectrum (p. 847-853) Look over pages
Symmetric Stretch: allows molecule to move through space
 BACKGROUND INFORMATION Infrared Spectroscopy Before introducing the subject of IR spectroscopy, we must first review some aspects of the electromagnetic spectrum. The electromagnetic spectrum is composed
electron does not become part of the compound; one electron goes in but two electrons come out.
 Characterization Techniques for Organic Compounds. When we run a reaction in the laboratory or when we isolate a compound from nature, one of our first tasks is to identify the compound that we have obtained.
Nuclear Magnetic Resonance Spectroscopy
 Nuclear Magnetic Resonance Spectroscopy Nuclear magnetic resonance spectroscopy is a powerful analytical technique used to characterize organic molecules by identifying carbonhydrogen frameworks within
For example: (Example is from page 50 of the Thinkbook)
") SOLVING COMBINED SPECTROSCOPY PROBLEMS: Lecture Supplement: page 50-53 in Thinkbook CFQ s and PP s: page 216 241 in Thinkbook Introduction: The structure of an unknown molecule can be determined using
SOLVING COMBINED SPECTROSCOPY PROBLEMS: Lecture Supplement: page 50-53 in Thinkbook CFQ s and PP s: page 216 241 in Thinkbook Introduction: The structure of an unknown molecule can be determined using
Determination of Molecular Structure by MOLECULAR SPECTROSCOPY
 Determination of Molecular Structure by MOLEULAR SPETROSOPY hemistry 3 B.Z. Shakhashiri Fall 29 Much of what we know about molecular structure has been learned by observing and analyzing how electromagnetic
0 10 20 30 40 50 60 70 m/z
 Mass spectrum for the ionization of acetone MS of Acetone + Relative Abundance CH 3 H 3 C O + M 15 (loss of methyl) + O H 3 C CH 3 43 58 0 10 20 30 40 50 60 70 m/z It is difficult to identify the ions
Proton Nuclear Magnetic Resonance Spectroscopy
 Proton Nuclear Magnetic Resonance Spectroscopy Introduction: The NMR Spectrum serves as a great resource in determining the structure of an organic compound by revealing the hydrogen and carbon skeleton.
4. It is possible to excite, or flip the nuclear magnetic vector from the α-state to the β-state by bridging the energy gap between the two. This is a
 BASIC PRINCIPLES INTRODUCTION TO NUCLEAR MAGNETIC RESONANCE (NMR) 1. The nuclei of certain atoms with odd atomic number, and/or odd mass behave as spinning charges. The nucleus is the center of positive
Ultraviolet Spectroscopy
 Ultraviolet Spectroscopy The wavelength of UV and visible light are substantially shorter than the wavelength of infrared radiation. The UV spectrum ranges from 100 to 400 nm. A UV-Vis spectrophotometer
Determining the Structure of an Organic Compound
 Determining the Structure of an Organic Compound The analysis of the outcome of a reaction requires that we know the full structure of the products as well as the reactants In the 19 th and early 20 th
Solving Spectroscopy Problems
 Solving Spectroscopy Problems The following is a detailed summary on how to solve spectroscopy problems, key terms are highlighted in bold and the definitions are from the illustrated glossary on Dr. Hardinger
PROTON NUCLEAR MAGNETIC RESONANCE SPECTROSCOPY (H-NMR)
") PROTON NUCLEAR MAGNETIC RESONANCE SPECTROSCOPY (H-NMR) WHAT IS H-NMR SPECTROSCOPY? References: Bruice 14.1, 14.2 Introduction NMR or nuclear magnetic resonance spectroscopy is a technique used to determine
PROTON NUCLEAR MAGNETIC RESONANCE SPECTROSCOPY (H-NMR) WHAT IS H-NMR SPECTROSCOPY? References: Bruice 14.1, 14.2 Introduction NMR or nuclear magnetic resonance spectroscopy is a technique used to determine
MULTIPLE CHOICE. Choose the one alternative that best completes the statement or answers the question.
 Exam Name 1) Which compound would be expected to show intense IR absorption at 3300 cm-1? A) butane B) CH3CH2C CH C)CH3C CCH3 D) but-1-ene 1) 2) Which compound would be expected to show intense IR absorption
Used to determine relative location of atoms within a molecule Most helpful spectroscopic technique in organic chemistry Related to MRI in medicine
 Structure Determination: Nuclear Magnetic Resonance CHEM 241 UNIT 5C 1 The Use of NMR Spectroscopy Used to determine relative location of atoms within a molecule Most helpful spectroscopic technique in
Nuclear Structure. particle relative charge relative mass proton +1 1 atomic mass unit neutron 0 1 atomic mass unit electron -1 negligible mass
 Protons, neutrons and electrons Nuclear Structure particle relative charge relative mass proton 1 1 atomic mass unit neutron 0 1 atomic mass unit electron -1 negligible mass Protons and neutrons make up
Proton Nuclear Magnetic Resonance ( 1 H-NMR) Spectroscopy
 Spectroscopy") Proton Nuclear Magnetic Resonance ( 1 H-NMR) Spectroscopy Theory behind NMR: In the late 1940 s, physical chemists originally developed NMR spectroscopy to study different properties of atomic nuclei,
Proton Nuclear Magnetic Resonance ( 1 H-NMR) Spectroscopy Theory behind NMR: In the late 1940 s, physical chemists originally developed NMR spectroscopy to study different properties of atomic nuclei,
Organic Spectroscopy. UV - Ultraviolet-Visible Spectroscopy. !! 200-800 nm. Methods for structure determination of organic compounds:
 Organic Spectroscopy Methods for structure determination of organic compounds: X-ray rystallography rystall structures Mass spectroscopy Molecular formula -----------------------------------------------------------------------------
CHE334 Identification of an Unknown Compound By NMR/IR/MS
 CHE334 Identification of an Unknown Compound By NMR/IR/MS Purpose The object of this experiment is to determine the structure of an unknown compound using IR, 1 H-NMR, 13 C-NMR and Mass spectroscopy. Infrared
NMR SPECTROSCOPY A N I N T R O D U C T I O N T O... Self-study booklet NUCLEAR MAGNETIC RESONANCE. 4 3 2 1 0 δ PUBLISHING
 A N I N T R O D U T I O N T O... NMR SPETROSOPY NULEAR MAGNETI RESONANE 4 3 1 0 δ Self-study booklet PUBLISING NMR Spectroscopy NULEAR MAGNETI RESONANE SPETROSOPY Origin of Spectra Theory All nuclei possess
Background A nucleus with an odd atomic number or an odd mass number has a nuclear spin that can be observed by NMR spectrometers.
 NMR Spectroscopy I Reading: Wade chapter, sections -- -7 Study Problems: -, -7 Key oncepts and Skills: Given an structure, determine which protons are equivalent and which are nonequivalent, predict the
How to Quickly Solve Spectrometry Problems
 How to Quickly Solve Spectrometry Problems You should be looking for: Mass Spectrometry (MS) Chemical Formula DBE Infrared Spectroscopy (IR) Important Functional Groups o Alcohol O-H o Carboxylic Acid
Nuclear Magnetic Resonance notes
 Reminder: These notes are meant to supplement, not replace, the laboratory manual. Nuclear Magnetic Resonance notes Nuclear Magnetic Resonance (NMR) is a spectrometric technique which provides information
Mass Spectrometry. Overview
 Mass Spectrometry Overview Mass Spectrometry is an analytic technique that utilizes the degree of deflection of charged particles by a magnetic field to find the relative masses of molecular ions and fragments.2
E35 SPECTROSCOPIC TECHNIQUES IN ORGANIC CHEMISTRY
 E35 SPECTRSCPIC TECNIQUES IN RGANIC CEMISTRY TE TASK To use mass spectrometry and IR, UV/vis and NMR spectroscopy to identify organic compounds. TE SKILLS By the end of the experiment you should be able
Nuclear Magnetic Resonance Spectroscopy
 Nuclear Magnetic Resonance Spectroscopy Introduction NMR is the most powerful tool available for organic structure determination. It is used to study a wide variety of nuclei: 1 H 13 C 15 N 19 F 31 P 2
The Four Questions to Ask While Interpreting Spectra. 1. How many different environments are there?
 1 H NMR Spectroscopy (#1c) The technique of 1 H NMR spectroscopy is central to organic chemistry and other fields involving analysis of organic chemicals, such as forensics and environmental science. It
Infrared Spectroscopy
 Infrared Spectroscopy 1 Chap 12 Reactions will often give a mixture of products: OH H 2 SO 4 + Major Minor How would the chemist determine which product was formed? Both are cyclopentenes; they are isomers.
CHEM 51LB EXP 1 SPECTROSCOPIC METHODS: INFRARED AND NUCLEAR MAGNETIC RESONANCE SPECTROSCOPY
 CHEM 51LB EXP 1 SPECTRSCPIC METHDS: INFRARED AND NUCLEAR MAGNETIC RESNANCE SPECTRSCPY REACTINS: None TECHNIQUES: IR Spectroscopy, NMR Spectroscopy Infrared (IR) and nuclear magnetic resonance (NMR) spectroscopy
Mass Spec - Fragmentation
 Mass Spec - Fragmentation An extremely useful result of EI ionization in particular is a phenomenon known as fragmentation. The radical cation that is produced when an electron is knocked out of a neutral
Pesticide Analysis by Mass Spectrometry
 Pesticide Analysis by Mass Spectrometry Purpose: The purpose of this assignment is to introduce concepts of mass spectrometry (MS) as they pertain to the qualitative and quantitative analysis of organochlorine
Chapter 11 Structure Determination: Nuclear Magnetic Resonance Spectroscopy. Nuclear Magnetic Resonance Spectroscopy. 11.1 Nuclear Magnetic Resonance
 John E. McMurry http://www.cengage.com/chemistry/mcmurry Chapter 11 Structure Determination: Nuclear Magnetic Resonance Spectroscopy 11.1 Nuclear Magnetic Resonance Spectroscopy Many atomic nuclei behave
Organic Spectroscopy
 1 Organic Spectroscopy Second Year, Michaelmas term, 8 lectures: Dr TDW Claridge & Prof BG Davis Lectures 1 4 highlight the importance of spectroscopic methods in the structural elucidation of organic
Molecular Models Experiment #1
 Molecular Models Experiment #1 Objective: To become familiar with the 3-dimensional structure of organic molecules, especially the tetrahedral structure of alkyl carbon atoms and the planar structure of
DETERMINACIÓN DE ESTRUCTURAS ORGÁNICAS (ORGANIC SPECTROSCOPY) IR SPECTROSCOPY
 IR SPECTROSCOPY") DETERMINACIÓN DE ESTRUCTURAS ORGÁNICAS (ORGANIC SPECTROSCOPY) IR SPECTROSCOPY Hermenegildo García Gómez Departamento de Química Instituto de Tecnología Química Universidad Politécnica de Valencia 46022
DETERMINACIÓN DE ESTRUCTURAS ORGÁNICAS (ORGANIC SPECTROSCOPY) IR SPECTROSCOPY Hermenegildo García Gómez Departamento de Química Instituto de Tecnología Química Universidad Politécnica de Valencia 46022
Chemistry 307 Chapter 10 Nuclear Magnetic Resonance
 Chemistry 307 Chapter 10 Nuclear Magnetic Resonance Nuclear magnetic resonance (NMR) spectroscopy is one of three spectroscopic techniques that are useful tools for determining the structures of organic
Proton Nuclear Magnetic Resonance Spectroscopy
 CHEM 334L Organic Chemistry Laboratory Revision 2.0 Proton Nuclear Magnetic Resonance Spectroscopy In this laboratory exercise we will learn how to use the Chemistry Department's Nuclear Magnetic Resonance
UV-Visible Spectroscopy
 UV-Visible Spectroscopy UV-Visible Spectroscopy What is UV-Visible Spectroscopy? Molecular spectroscopy that involves study of the interaction of Ultra violet (UV)-Visible radiation with molecules What
Experiment 11. Infrared Spectroscopy
 Chem 22 Spring 2010 Experiment 11 Infrared Spectroscopy Pre-lab preparation. (1) In Ch 5 and 12 of the text you will find examples of the most common functional groups in organic molecules. In your notebook,
NMR - Basic principles
 NMR - Basic principles Subatomic particles like electrons, protons and neutrons are associated with spin - a fundamental property like charge or mass. In the case of nuclei with even number of protons
HOMEWORK PROBLEMS: IR SPECTROSCOPY AND 13C NMR. The peak at 1720 indicates a C=O bond (carbonyl). One possibility is acetone:
. One possibility is acetone:") HMEWRK PRBLEMS: IR SPECTRSCPY AND 13C NMR 1. You find a bottle on the shelf only labeled C 3 H 6. You take an IR spectrum of the compound and find major peaks at 2950, 1720, and 1400 cm -1. Draw a molecule
HMEWRK PRBLEMS: IR SPECTRSCPY AND 13C NMR 1. You find a bottle on the shelf only labeled C 3 H 6. You take an IR spectrum of the compound and find major peaks at 2950, 1720, and 1400 cm -1. Draw a molecule
Infrared Spectroscopy: Theory
 u Chapter 15 Infrared Spectroscopy: Theory An important tool of the organic chemist is Infrared Spectroscopy, or IR. IR spectra are acquired on a special instrument, called an IR spectrometer. IR is used
for excitation to occur, there must be an exact match between the frequency of the applied radiation and the frequency of the vibration
 ! = 1 2"c k (m + M) m M wavenumbers! =!/c = 1/" wavelength frequency! units: cm 1 for excitation to occur, there must be an exact match between the frequency of the applied radiation and the frequency
Nuclear Magnetic Resonance
 Nuclear Magnetic Resonance NMR is probably the most useful and powerful technique for identifying and characterizing organic compounds. Felix Bloch and Edward Mills Purcell were awarded the 1952 Nobel
CHEM 1411 Chapter 5 Homework Answers
 1 CHEM 1411 Chapter 5 Homework Answers 1. Which statement regarding the gold foil experiment is false? (a) It was performed by Rutherford and his research group early in the 20 th century. (b) Most of
ANALYSIS OF ASPIRIN INFRARED (IR) SPECTROSCOPY AND MELTING POINT DETERMINATION
 SPECTROSCOPY AND MELTING POINT DETERMINATION") Chem 306 Section (Circle) M Tu W Th Name Partners Date ANALYSIS OF ASPIRIN INFRARED (IR) SPECTROSCOPY AND MELTING POINT DETERMINATION Materials: prepared acetylsalicylic acid (aspirin), stockroom samples
Chem 306 Section (Circle) M Tu W Th Name Partners Date ANALYSIS OF ASPIRIN INFRARED (IR) SPECTROSCOPY AND MELTING POINT DETERMINATION Materials: prepared acetylsalicylic acid (aspirin), stockroom samples
Chapter 6 An Overview of Organic Reactions
 John E. McMurry www.cengage.com/chemistry/mcmurry Chapter 6 An Overview of Organic Reactions Why this chapter? To understand organic and/or biochemistry, it is necessary to know: -What occurs -Why and
Suggested solutions for Chapter 3
 s for Chapter PRBLEM Assuming that the molecular ion is the base peak (00% abundance) what peaks would appear in the mass spectrum of each of these molecules: (a) C5Br (b) C60 (c) C64Br In cases (a) and
passing through (Y-axis). The peaks are those shown at frequencies when less than
. The peaks are those shown at frequencies when less than") Infrared Spectroscopy used to analyze the presence of functional groups (bond types) in organic molecules The process for this analysis is two-fold: 1. Accurate analysis of infrared spectra to determine
Infrared Spectroscopy used to analyze the presence of functional groups (bond types) in organic molecules The process for this analysis is two-fold: 1. Accurate analysis of infrared spectra to determine
where h = 6.62 10-34 J s
 Electromagnetic Spectrum: Refer to Figure 12.1 Molecular Spectroscopy: Absorption of electromagnetic radiation: The absorptions and emissions of electromagnetic radiation are related molecular-level phenomena
Acids and Bases: Molecular Structure and Acidity
 Acids and Bases: Molecular Structure and Acidity Review the Acids and Bases Vocabulary List as needed. Tutorial Contents A. Introduction B. Resonance C. Atomic Radius D. Electronegativity E. Inductive
Survival Organic Chemistry Part I: Molecular Models
 Survival Organic Chemistry Part I: Molecular Models The goal in this laboratory experience is to get you so you can easily and quickly move between empirical formulas, molecular formulas, condensed formulas,
Time out states and transitions
 Time out states and transitions Spectroscopy transitions between energy states of a molecule excited by absorption or emission of a photon hn = DE = E i - E f Energy levels due to interactions between
The Fundamentals of Infrared Spectroscopy. Joe Van Gompel, PhD
 TN-100 The Fundamentals of Infrared Spectroscopy The Principles of Infrared Spectroscopy Joe Van Gompel, PhD Spectroscopy is the study of the interaction of electromagnetic radiation with matter. The electromagnetic
EXPERIMENT 1: Survival Organic Chemistry: Molecular Models
 EXPERIMENT 1: Survival Organic Chemistry: Molecular Models Introduction: The goal in this laboratory experience is for you to easily and quickly move between empirical formulas, molecular formulas, condensed
List the 3 main types of subatomic particles and indicate the mass and electrical charge of each.
 Basic Chemistry Why do we study chemistry in a biology course? All living organisms are composed of chemicals. To understand life, we must understand the structure, function, and properties of the chemicals
Chem 1A Exam 2 Review Problems
 Chem 1A Exam 2 Review Problems 1. At 0.967 atm, the height of mercury in a barometer is 0.735 m. If the mercury were replaced with water, what height of water (in meters) would be supported at this pressure?
NMR Nuclear Magnetic Resonance
 NMR Nuclear Magnetic Resonance Nuclear magnetic resonance (NMR) is an effect whereby magnetic nuclei in a magnetic field absorb and re-emit electromagnetic (EM) energy. This energy is at a specific resonance
WAVES AND ELECTROMAGNETIC RADIATION
 WAVES AND ELECTROMAGNETIC RADIATION All waves are characterized by their wavelength, frequency and speed. Wavelength (lambda, ): the distance between any 2 successive crests or troughs. Frequency (nu,):
Chapter Five: Atomic Theory and Structure
 Chapter Five: Atomic Theory and Structure Evolution of Atomic Theory The ancient Greek scientist Democritus is often credited with developing the idea of the atom Democritus proposed that matter was, on
Elements in the periodic table are indicated by SYMBOLS. To the left of the symbol we find the atomic mass (A) at the upper corner, and the atomic num
 at the upper corner, and the atomic num") . ATOMIC STRUCTURE FUNDAMENTALS LEARNING OBJECTIVES To review the basics concepts of atomic structure that have direct relevance to the fundamental concepts of organic chemistry. This material is essential
. ATOMIC STRUCTURE FUNDAMENTALS LEARNING OBJECTIVES To review the basics concepts of atomic structure that have direct relevance to the fundamental concepts of organic chemistry. This material is essential
MOLECULAR REPRESENTATIONS AND INFRARED SPECTROSCOPY
 MLEULAR REPRESENTATINS AND INFRARED SPETRSPY A STUDENT SULD BE ABLE T: 1. Given a Lewis (dash or dot), condensed, bond-line, or wedge formula of a compound draw the other representations. 2. Give examples
12.4 FUNCTIONAL-GROUP INFRARED ABSORPTIONS
 552 APTER 12 INTRODUTION TO SPETROSOPY. INFRARED SPETROSOPY AND MASS SPETROMETRY PROBLEM 12.9 Which of the following vibrations should be infrared-active and which should be infrared-inactive (or nearly
Nuclear Magnetic Resonance (NMR) Wade Textbook
 Wade Textbook") Nuclear Magnetic Resonance (NMR) Wade Textbook Background Is a nondestructive structural analysis technique Has the same theoretical basis as magnetic resonance imaging (MRI) Referring to MRI as nuclear
Nuclear Magnetic Resonance (NMR) Wade Textbook Background Is a nondestructive structural analysis technique Has the same theoretical basis as magnetic resonance imaging (MRI) Referring to MRI as nuclear
Chapter 5 Classification of Organic Compounds by Solubility
 Chapter 5 Classification of Organic Compounds by Solubility Deductions based upon interpretation of simple solubility tests can be extremely useful in organic structure determination. Both solubility and
Atomic Calculations. 2.1 Composition of the Atom. number of protons + number of neutrons = mass number
 2.1 Composition of the Atom Atomic Calculations number of protons + number of neutrons = mass number number of neutrons = mass number - number of protons number of protons = number of electrons IF positive
Getting the most from this book...4 About this book...5
 Contents Getting the most from this book...4 About this book....5 Content Guidance Topic 1 Atomic structure and the periodic table...8 Topic 2 Bonding and structure...14 Topic 2A Bonding....14 Topic 2B
Chapter 18: The Structure of the Atom
 Chapter 18: The Structure of the Atom 1. For most elements, an atom has A. no neutrons in the nucleus. B. more protons than electrons. C. less neutrons than electrons. D. just as many electrons as protons.
Nuclear Magnetic Resonance (NMR) Spectroscopy cont... Recommended Reading:
 Spectroscopy cont... Recommended Reading:") Applied Spectroscopy Nuclear Magnetic Resonance (NMR) Spectroscopy cont... Recommended Reading: Banwell and McCash Chapter 7 Skoog, Holler Nieman Chapter 19 Atkins, Chapter 18 Relaxation processes We need
Applied Spectroscopy Nuclear Magnetic Resonance (NMR) Spectroscopy cont... Recommended Reading: Banwell and McCash Chapter 7 Skoog, Holler Nieman Chapter 19 Atkins, Chapter 18 Relaxation processes We need
Chapter 7. Electron Structure of the Atom. Chapter 7 Topics
 Chapter 7 Electron Structure of the Atom Copyright The McGraw-Hill Companies, Inc. Permission required for reproduction or display. 1 Chapter 7 Topics 1. Electromagnetic radiation 2. The Bohr model of
Chapter 2 The Chemical Context of Life
 Chapter 2 The Chemical Context of Life Multiple-Choice Questions 1) About 25 of the 92 natural elements are known to be essential to life. Which four of these 25 elements make up approximately 96% of living
Main properties of atoms and nucleus
 Main properties of atoms and nucleus. Atom Structure.... Structure of Nuclei... 3. Definition of Isotopes... 4. Energy Characteristics of Nuclei... 5. Laws of Radioactive Nuclei Transformation... 3. Atom
NMR and other Instrumental Techniques in Chemistry and the proposed National Curriculum.
 NMR and other Instrumental Techniques in Chemistry and the proposed National Curriculum. Dr. John Jackowski Chair of Science, Head of Chemistry Scotch College Melbourne [email protected]
Name Date Class ELECTRONS IN ATOMS. Standard Curriculum Core content Extension topics
 13 ELECTRONS IN ATOMS Conceptual Curriculum Concrete concepts More abstract concepts or math/problem-solving Standard Curriculum Core content Extension topics Honors Curriculum Core honors content Options
18 electron rule : How to count electrons
 18 electron rule : How to count electrons The rule states that thermodynamically stable transition metal organometallic compounds are formed when the sum of the metal d electrons and the electrons conventionally
CHEM 51LB: EXPERIMENT 5 SPECTROSCOPIC METHODS: INFRARED AND NUCLEAR MAGNETIC RESONANCE SPECTROSCOPY
 CHEM 51LB: EXPERIMENT 5 SPECTROSCOPIC METHODS: INFRARED AND NUCLEAR MAGNETIC RESONANCE SPECTROSCOPY REACTIONS: None TECHNIQUES: IR, NMR Infrared (IR) and nuclear magnetic resonance (NMR) spectroscopy are
Studying an Organic Reaction. How do we know if a reaction can occur? And if a reaction can occur what do we know about the reaction?
 Studying an Organic Reaction How do we know if a reaction can occur? And if a reaction can occur what do we know about the reaction? Information we want to know: How much heat is generated? How fast is
Chapter 1: Moles and equations. Learning outcomes. you should be able to:
 Chapter 1: Moles and equations 1 Learning outcomes you should be able to: define and use the terms: relative atomic mass, isotopic mass and formula mass based on the 12 C scale perform calculations, including
Introduction to Nuclear Physics
 Introduction to Nuclear Physics 1. Atomic Structure and the Periodic Table According to the Bohr-Rutherford model of the atom, also called the solar system model, the atom consists of a central nucleus
Organic Functional Groups Chapter 7. Alcohols, Ethers and More
 Organic Functional Groups Chapter 7 Alcohols, Ethers and More 1 What do you do when you are in Pain? What do you do when you are in a lot of pain? 2 Functional Groups A functional group is an atom, groups
Elements, Atoms & Ions
 Introductory Chemistry: A Foundation FOURTH EDITION by Steven S. Zumdahl University of Illinois Elements, Atoms & Ions Chapter 4 1 2 Elements Aims: To learn about the relative abundances of the elements,
From lowest energy to highest energy, which of the following correctly orders the different categories of electromagnetic radiation?
 From lowest energy to highest energy, which of the following correctly orders the different categories of electromagnetic radiation? From lowest energy to highest energy, which of the following correctly
Brønsted-Lowry Acids and Bases
 Brønsted-Lowry Acids and Bases 1 According to Brønsted and Lowry, an acid-base reaction is defined in terms of a proton transfer. By this definition, the reaction of Cl in water is: Cl(aq) + Cl (aq) +
Amount of Substance. http://www.avogadro.co.uk/definitions/elemcompmix.htm
 Page 1 of 14 Amount of Substance Key terms in this chapter are: Element Compound Mixture Atom Molecule Ion Relative Atomic Mass Avogadro constant Mole Isotope Relative Isotopic Mass Relative Molecular
6. 3. Molecular spectroscopy. Unit 6: Physical chemistry of spectroscopy, surfaces and chemical and phase equilibria
 6. 3 Molecular spectroscopy Spectroscopy in its various forms is a technique with wide applications across many disciplines. From qualitative analysis in toxicology through to quantitative measurements
Southeastern Louisiana University Dual Enrollment Program--Chemistry
 Southeastern Louisiana University Dual Enrollment Program--Chemistry The Southeastern Dual Enrollment Chemistry Program is a program whereby high school students are given the opportunity to take college
9/13/2013. However, Dalton thought that an atom was just a tiny sphere with no internal parts. This is sometimes referred to as the cannonball model.
 John Dalton was an English scientist who lived in the early 1800s. Dalton s atomic theory served as a model for how matter worked. The principles of Dalton s atomic theory are: 1. Elements are made of
How to Interpret an IR Spectrum
 How to Interpret an IR Spectrum Don t be overwhelmed when you first view IR spectra or this document. We have simplified the interpretation by having you only focus on 4/5 regions of the spectrum. Do not
Nuclear Shielding and 1. H Chemical Shifts. 1 H NMR Spectroscopy Nuclear Magnetic Resonance
 NMR Spectroscopy Nuclear Magnetic Resonance Nuclear Shielding and hemical Shifts What do we mean by "shielding?" What do we mean by "chemical shift?" The electrons surrounding a nucleus affect the effective
Nucleophilic Substitution and Elimination
 Nucleophilic Substitution and Elimination What does the term "nucleophilic substitution" imply? A nucleophile is an the electron rich species that will react with an electron poor species A substitution
Spectrophotometry and the Beer-Lambert Law: An Important Analytical Technique in Chemistry
 Spectrophotometry and the Beer-Lambert Law: An Important Analytical Technique in Chemistry Jon H. Hardesty, PhD and Bassam Attili, PhD Collin College Department of Chemistry Introduction: In the last lab
History of the Atom & Atomic Theory
 Chapter 5 History of the Atom & Atomic Theory You re invited to a Thinking Inside the Box Conference Each group should nominate a: o Leader o Writer o Presenter You have 5 minutes to come up with observations
Molecular Models in Biology
 Molecular Models in Biology Objectives: After this lab a student will be able to: 1) Understand the properties of atoms that give rise to bonds. 2) Understand how and why atoms form ions. 3) Model covalent,
AP* Atomic Structure & Periodicity Free Response Questions KEY page 1
 AP* Atomic Structure & Periodicity ree Response Questions KEY page 1 1980 a) points 1s s p 6 3s 3p 6 4s 3d 10 4p 3 b) points for the two electrons in the 4s: 4, 0, 0, +1/ and 4, 0, 0, - 1/ for the three
The photoionization detector (PID) utilizes ultraviolet
 utilizes ultraviolet") Chapter 6 Photoionization Detectors The photoionization detector (PID) utilizes ultraviolet light to ionize gas molecules, and is commonly employed in the detection of volatile organic compounds (VOCs).
Chapter 6 Photoionization Detectors The photoionization detector (PID) utilizes ultraviolet light to ionize gas molecules, and is commonly employed in the detection of volatile organic compounds (VOCs).
Acids and Bases. but we will use the term Lewis acid to denote only those acids to which a bond can be made without breaking another bond
 Acids and Bases. Brønsted acids are proton donors, and Brønsted bases are proton acceptors. Examples of Brønsted acids: HCl, HBr, H 2 SO 4, HOH, H 3 O +, + NH 4, NH 3, CH 3 CO 2 H, H CH 2 COCH 3, H C CH,