ANALYSIS OF ASPIRIN INFRARED (IR) SPECTROSCOPY AND MELTING POINT DETERMINATION
|
|
|
- Henry Owens
- 9 years ago
- Views:
Transcription
1 Chem 306 Section (Circle) M Tu W Th Name Partners Date ANALYSIS OF ASPIRIN INFRARED (IR) SPECTROSCOPY AND MELTING POINT DETERMINATION Materials: prepared acetylsalicylic acid (aspirin), stockroom samples of pure salicylic acid and acetylsalicylic acid Purpose: In this laboratory activity you will use the technique of infrared spectroscopy to confirm the identity of your prepared aspirin. Introduction: An important tool of the organic chemist is infrared (IR) spectroscopy. IR spectra are acquired on a special instrument, called an IR spectrometer. IR is used to gather information about compound's structure, assess its purity, and sometimes to identify it. Infrared radiation is that part of the electromagnetic spectrum between the visible and radio wave regions. The electromagnetic spectrum consists of the family of radiant energy (xrays, UV rays, IR, microwaves, etc.). One of the common features of radiant energy its wave nature. The wavelength of a wave is the distance between two crests or two troughs. The frequency of a wave characterizes the number of cycles per second. Shorter wavelengths indicate radiant energy of higher frequency and higher energy. In IR spectroscopy, wavelengths are characterized by wavenumbers. A wavenumber is simply the inverse of the wavelength as is suggested by wavenumber units 1/cm or cm -1. (In spectroscopy, the terms wavenumber and frequency are used interchangeably.) A. B. Figure I Diagram of two waves. Which is of higher energy, wave A or wave B? Which is of lower frequency, wave A or wave B? Which would have the higher wavenumber value, wave A or wave B? The longer wavelengths of infrared radiation are commonly known as heat. The human eye cannot form images using IR rays. In other words, we can t see heat. Snakes in the pit viper family, like rattlesnakes, have IR sensory pits that are used to image infrared radiation. This 8-1

2 allows the snake to detect warm blooded animals, even in dark burrows. Heat lamps often radiate a reddish light along with heat (infrared radiation). Take a look at the figure below (Figure II) and see if you can explain why. Figure II The Electromagnetic Spectrum A molecular compound can be identified by the IR radiation it transmits or absorbs. At specific frequencies, the atoms of the molecule stretch, twist, and bend around the bonds joining them. Radiation of the wavelengths corresponding to those frequencies will be absorbed. The energy absorbed must agree in frequency with the natural frequency of vibration of the molecule. In using the IR spectrophotometer, a sample of the compound is subjected to varied wavelengths of IR radiation. Certain wavelengths will be readily absorbed by the molecule depending of the structure of the molecule. The various wavelengths absorbed by the compound are measured and recorded graphically. A unique continuous absorbtion spectrum, an IR spectrum, can be plotted for each molecular compound. Comparison with known spectra will reveal the identity of the compound just as fingerprints reveal the identity of a person. An IR spectrum is a plot of wave number (X-axis) vs. percent transmittance (Y-axis). Percent transmittance tells us how much IR energy was transmitted through the sample. It can also tell us how much energy was absorbed by the sample. For example, a high degree of transmittance indicates that little IR energy was absorbed and most of the IR energy passed through the sample. The wavenumber scale on the spectrum indicates the energy of the IR incident on the sample. The IR spectrum of hexanoic acid is shown below (Figure III). Take a minute to look over this spectrum. The deep downward peaks are areas of low IR transmittance and high IR absorbance. Notice that there are areas that are flat areas where very little IR energy was absorbed (nearly 100% transmittance). 8-2

3 Figure III IR Spectrum of Hexanoic Acid Infrared spectroscopy is very useful for qualitative analysis (identification) of organic compounds because a unique spectrum is produced by every organic substance with peaks corresponding to distinct structural features. What is it that causes the absorbtion of energy? Covalent bonds link atoms together to form molecules. Though these bonds have normal average lengths, the relative positions of the atoms are constantly changing due to bond vibrations such as bending and stretching (Figure IV). A bond can be thought of as a spring with atoms attached to each end. Figure IV Covalent Bonds Can Stretch and Bend Each molecular compound has its own infrared spectrum, different from any other compound. Also, each functional group and structural feature absorbs infrared light at a unique frequency (See Figure V and Table I). For example, a carbonyl group, C=O, always absorbs infrared light at cm-1, which causes the carbonyl bond to stretch. A carbonyl group always absorbs infrared radiation in this frequency range because the bond between the carbon atoms is constantly stretching and contracting within a range of bond lengths. When a molecule is irradiated with infrared radiation, a vibrating bond will absorb energy of the same frequency as its vibration, increasing the amplitude of the oscillation. 8-3

4 Figure V IR Absorbtion of Some Common Structural Features The region to the right-hand side of the diagram, the fingerprint region (from about 1400 to 600 cm -1 ) usually contains a very complicated series of absorptions. These are mainly due to all manner of bending vibrations within the molecule. It is much more difficult to pick out individual bonds in this region than it is in the "cleaner" region at higher wavenumbers. The importance of the fingerprint region is that each different compound produces a different pattern of troughs and peaks in this part of the spectrum. IR instruments are used for a variety of purposes. They are used in medical laboratories, crime labs, research facilities, educational institutions, and other installations for the purposes of detecting and and identifying particular molecules. Pharmaceutical manufacturers use them to check the purity of their products. They can be used to make quantitative measurements; that is, to find the concentration of a chemical substance in a solution, in a solid, or in a gas. Companies and pollution control agencies use them to monitor gaseous exhaust form smokestacks and automobiles. New medical uses for IR spectroscopy include monitoring cerebral blood flow and non-invasive blood glucose monitoring. The IR spectra of 1 butanol is shown below. 8-4

5 Interpreting Infrared Spectra: Characteristic IR Absorbtion Frequencies The interpretation of infrared spectra involves the correlation of absorption/transmission bands in the spectrum of an unknown compound with the known absorption frequencies for types of bonds. Significant for the identification of the source of an absorption band are intensity (weak, medium or strong), shape (broad or sharp), and position (cm -1 ) in the spectrum. Characteristic examples are provided in the table below to assist the user in becoming familiar with the intensity and shape absorption bands for representative absorptions Table I Characteristic IR Absorbtion Frequencies The melting point of a compound is used by the organic chemist to help establish the identity and purity of a compound. A small amount of material is heated slowly in a special apparatus (Meltemp) equipped with a thermometer, a heating element, and an eyepiece for observing the sample. Two temperatures are noted the point at which the first drop of liquid forms among the crystals and the point at which the entire sample of crystals turns to a clear liquid. The melting point is recorded by giving this range of melting. 8-5

6 Mel-temp apparatus Pure solid substances have a specific and reproducible melting point. Impurities in a solid substance lower the melting point range and make it broader. The more impurities in a solid, the more the melting point will decrease. The table below gives the melting points of several compounds. Substance Melting Point ( C) Salicylic acid Acetylsalicylic acid 135 Ibufprofen Acetominophen Procedure: Infrared (IR) Spectroscopy 1. Bring your aspirin sample to the instrument room. Your instructor will help you with acquiring the IR spectra of these samples. Attach your IR spectrum and library search results to this lab. 8-6
 Salicylic acid 157-159 Acetylsalicylic acid 135 Ibufprofen 75-77 Acetominophen 169-172 Procedure: Infrared (IR) Spectroscopy 1.")
7 2. While waiting your turn to use the spectrophotometer, use the procedure below to determine the melting point of your aspirin sample. Melting Point Procedure 1. Use a boiling water bath to calibrate the thermometer in your melting point apparatus as demonstrated by your instructor. 2. Obtain two capillary tubes that are sealed at one end. 3. Load one tube with your synthesized sample as follows. Press the open end gently into a sample of the crystalline material. Crystals will stick in the open end of the tube. The amount of solid pressed into the tube should correspond to a column no more than 2 mm high. 4. To move the solid to the closed end of the tube, drop the capillary tube down a 2/3 meter length of glass tubing, which is held upright on the desk top. The solid will pack down at the bottom of the tube. Repeat this procedure if necessary. 5. Mark the top of this tube with a Sharpie. 6. Repeat this process for the other capillary tube, loading it with a stockroom sample of acetylsalicyclic acid. 7. Make identifying marks on the capillary tubes to help you distinguish between the samples. 8. Place the two tubes in the Mel-temp and look at them through the observation window. Record the physical state of each sample (color, crystal size and shape if any, etc.) 9. Begin slowly heating your samples. Be sure to watch the sample closely. Be patient! Don t miss observing that melting range!! 10. Record the temperature at which the sample first begins to melt and when the entire sample is melted. 11. Your instructor may ask you to calibrate your thermometer before you begin. 8-7

8 IR SPECTROSCOPY AND MELTING POINT OF ACETYLSALICYLIC ACID Chem 306 Name Partner s Name s MELTING POINT OF ASPIRIN Data and Questions Substance Physical Appearance Initial Melting Temp ( C) Temp at Complete Melting ( C) Student aspirin Stockroom acetylsalicylic acid 1. How does the melting temperature of your aspirin compare with the stockroom sample. 2. Use the melting point data above to make a statement about the relative purity of your aspirin. 3. What is the most likely impurity in your aspirin? What are two sources of this contamination? 4. Stockroom samples of pure acetylsalicylic acid can have melting points below the expected melting point. Why is this so? 8-8

9 IR OF ASPIRIN - Questions General Questions 1. You are interpreting an IR spectra and find a strong absorbtion at a cm -1. What type of bond and which functional groups could be responsible for this absorbtion? b cm -1 (very broad). What type of bond and which functional groups could be responsible for this absorbtion? 2. Which of the IR regions observed in question 1 above requires the most energy for an absorbtion? IR Spectroscopy of Alcohol and Pharmaceuticals 1. The IR spectroscopy of alcohol (ethanol) is the basis for some methods of alcohol breath analysis (Ihttp://science.howstuffworks.com/breathalyzer.htm). a. Draw the structure of ethanol and acetone. Label your structures. b. Complete the following table. Bond C O C = O O H C H IR Region (cm-1) 8-9
 is the basis for some methods of alcohol breath analysis (Ihttp://science.howstuffworks.")
10 c. Look at the IR spectra below. One of these spectra is ethanol and the other is acetone. Circle and label the following regions on each spectra where appropriate: C H unsaturated, C O, C = O, and O H. Which spectrum is most likely that of ethanol? Acetone? Spectrum A = Spectrum B = 8-10

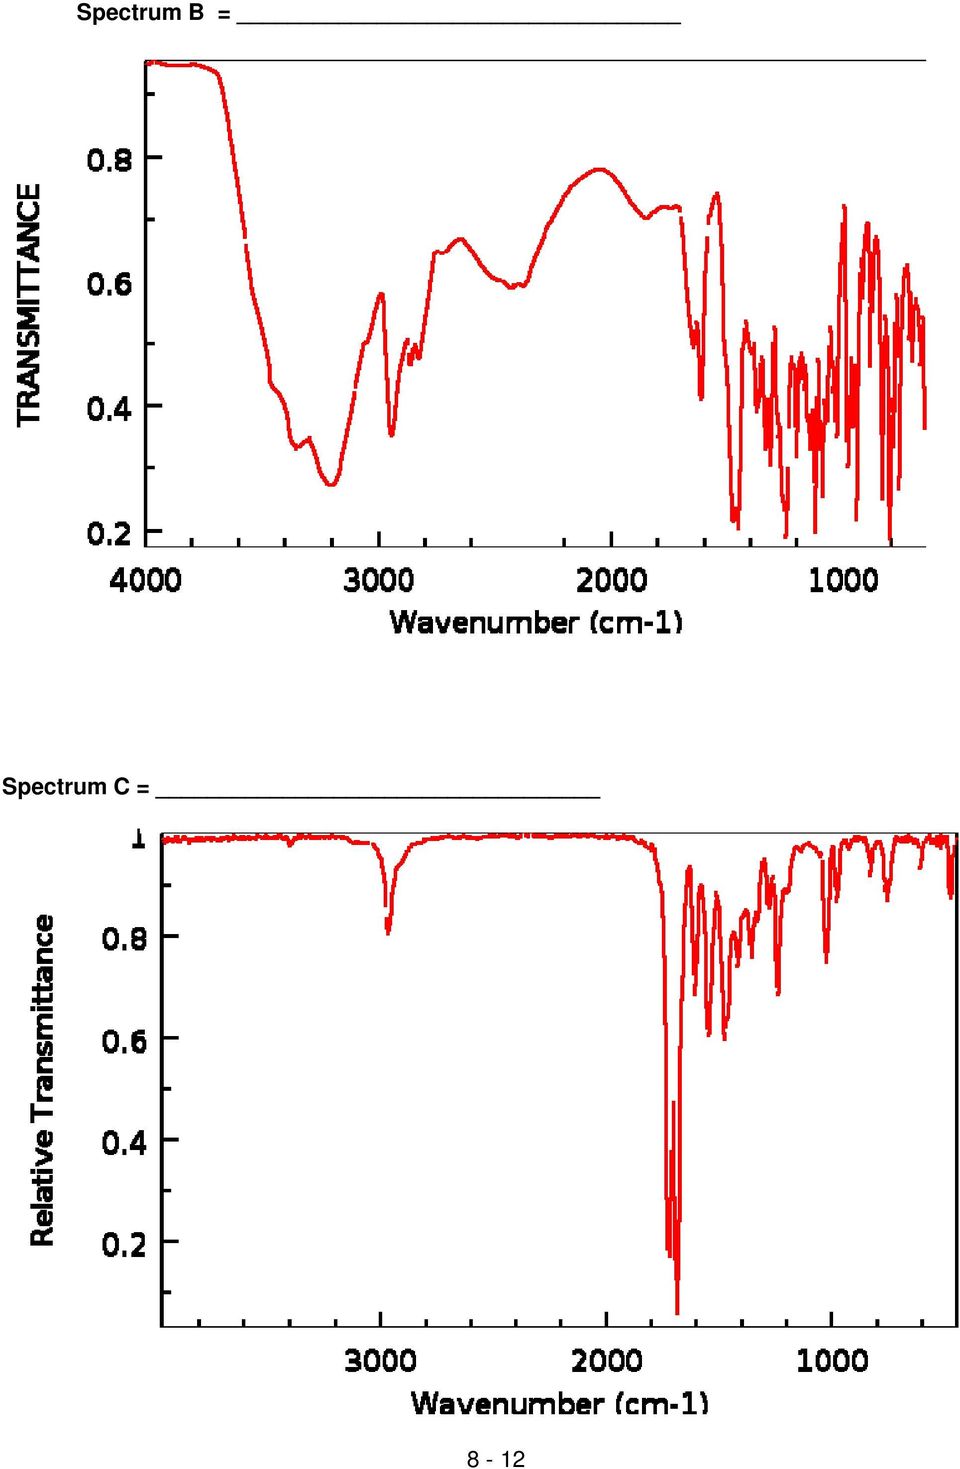
11 2. IR spectroscopy is used in law enforcement and forensics to identify substances in body fluids. Look over the structures below. Caffeine Morphine Heroin a. Both heroin and morphine contain C O bonds. Which other structural features would distinguish the IR spectra of these two structures? How would the IR spectra for these two drugs differ? b. Would you expect to find a C O IR absorbtion for caffeine? c. Use what you know about IR spectroscopy to assign a drug/substance (caffeine, morphine, or heroin) to each of the given spectra (A, B, and C). Identify (circle and label) two structural features and their characteristic IR regions on each spectra (For example, C O, C = O, O H, etc. ) Spectrum A = 8-11
 to each of the given spectra (A, B, and C).")
12 Spectrum B = Spectrum C = 8-12
13 IR Spectroscopy of Aspirin 1. Draw the structure of aspirin and state the chemical name of aspirin. 2. Indicate the regions (circle and label on your IR spectrum) of your spectrum that correspond to a carbonyl and a hydroxyl functional group. Identify two other regions that correlate with other functional groups/structural features. Indicate these regions on your spectrum (circle and label on your IR spectrum). 3. Use your IR spectrum, melting point data, and FeCl 3 test results to characterize the identity and purity of your sample. 4. Why would the IR spectrum of your aspirin not exactly match the spectrum of a crushed aspirin tablet? 5. Which of the following spectra on page 14 is most likely that of aspirin? Explain your reasoning. 6. Attach your spectra to this report sheet. 7. Turn in your report sheet with your group members. Use a paper clip to bundle the report sheets together. 8-13

14 Spectrum A Spectrum B Spectrum C 8-14

15 IR Pre-lab Chem 306 Name 1. What is IR spectroscopy used for and why it is such an important tool in organic chemistry? 2. What are some uses for IR in medicine and industry? 3. In the space below draw two waves, one with a higher energy than the other. Label your waves. 4. What is a wavenumber and how is it used in spectroscopy? 5. Calculate the wavenumber for an IR wavelength of cm. Include your units. Show your work. 6. What do the peaks represent in an IR spectrum? 7. T or F Two different compounds can have the same IR spectrum. 8. What functional group has a strong peak at 1785 cm -1? 9. What information does melting point data give about a substance? 8-15

Infrared Spectroscopy: Theory
 u Chapter 15 Infrared Spectroscopy: Theory An important tool of the organic chemist is Infrared Spectroscopy, or IR. IR spectra are acquired on a special instrument, called an IR spectrometer. IR is used
Infrared Spectroscopy 紅 外 線 光 譜 儀
 Infrared Spectroscopy 紅 外 線 光 譜 儀 Introduction Spectroscopy is an analytical technique which helps determine structure. It destroys little or no sample (nondestructive method). The amount of light absorbed
INFRARED SPECTROSCOPY (IR)
") INFRARED SPECTROSCOPY (IR) Theory and Interpretation of IR spectra ASSIGNED READINGS Introduction to technique 25 (p. 833-834 in lab textbook) Uses of the Infrared Spectrum (p. 847-853) Look over pages
INFRARED SPECTROSCOPY (IR) Theory and Interpretation of IR spectra ASSIGNED READINGS Introduction to technique 25 (p. 833-834 in lab textbook) Uses of the Infrared Spectrum (p. 847-853) Look over pages
Melting Point, Boiling Point, and Index of Refraction
 Melting Point, Boiling Point, and Index of Refraction Melting points, boiling points, and index of refractions are easily measured physical properties of organic compounds useful in product characterization
Symmetric Stretch: allows molecule to move through space
 BACKGROUND INFORMATION Infrared Spectroscopy Before introducing the subject of IR spectroscopy, we must first review some aspects of the electromagnetic spectrum. The electromagnetic spectrum is composed
CHEM 51LB EXP 1 SPECTROSCOPIC METHODS: INFRARED AND NUCLEAR MAGNETIC RESONANCE SPECTROSCOPY
 CHEM 51LB EXP 1 SPECTRSCPIC METHDS: INFRARED AND NUCLEAR MAGNETIC RESNANCE SPECTRSCPY REACTINS: None TECHNIQUES: IR Spectroscopy, NMR Spectroscopy Infrared (IR) and nuclear magnetic resonance (NMR) spectroscopy
The Fundamentals of Infrared Spectroscopy. Joe Van Gompel, PhD
 TN-100 The Fundamentals of Infrared Spectroscopy The Principles of Infrared Spectroscopy Joe Van Gompel, PhD Spectroscopy is the study of the interaction of electromagnetic radiation with matter. The electromagnetic
Determining the Structure of an Organic Compound
 Determining the Structure of an Organic Compound The analysis of the outcome of a reaction requires that we know the full structure of the products as well as the reactants In the 19 th and early 20 th
Upon completion of this lab, the student will be able to:
 1 Learning Outcomes EXPERIMENT B4: CHEMICAL EQUILIBRIUM Upon completion of this lab, the student will be able to: 1) Analyze the absorbance spectrum of a sample. 2) Calculate the equilibrium constant for
EXPERIMENT 1 (Organic Chemistry I)
") EXPERIMENT 1 (Organic Chemistry I) Melting Point Determination Purpose a) Determine the purity of a substance using melting point as physical property b) Identify an unknown compound using its melting
EXPERIMENT 1 (Organic Chemistry I) Melting Point Determination Purpose a) Determine the purity of a substance using melting point as physical property b) Identify an unknown compound using its melting
CHEM 51LB: EXPERIMENT 5 SPECTROSCOPIC METHODS: INFRARED AND NUCLEAR MAGNETIC RESONANCE SPECTROSCOPY
 CHEM 51LB: EXPERIMENT 5 SPECTROSCOPIC METHODS: INFRARED AND NUCLEAR MAGNETIC RESONANCE SPECTROSCOPY REACTIONS: None TECHNIQUES: IR, NMR Infrared (IR) and nuclear magnetic resonance (NMR) spectroscopy are
From lowest energy to highest energy, which of the following correctly orders the different categories of electromagnetic radiation?
 From lowest energy to highest energy, which of the following correctly orders the different categories of electromagnetic radiation? From lowest energy to highest energy, which of the following correctly
Infrared Spectroscopy
 Infrared Spectroscopy 1 Chap 12 Reactions will often give a mixture of products: OH H 2 SO 4 + Major Minor How would the chemist determine which product was formed? Both are cyclopentenes; they are isomers.
Introduction to Fourier Transform Infrared Spectrometry
 Introduction to Fourier Transform Infrared Spectrometry What is FT-IR? I N T R O D U C T I O N FT-IR stands for Fourier Transform InfraRed, the preferred method of infrared spectroscopy. In infrared spectroscopy,
QUANTITATIVE INFRARED SPECTROSCOPY. Willard et. al. Instrumental Methods of Analysis, 7th edition, Wadsworth Publishing Co., Belmont, CA 1988, Ch 11.
 QUANTITATIVE INFRARED SPECTROSCOPY Objective: The objectives of this experiment are: (1) to learn proper sample handling procedures for acquiring infrared spectra. (2) to determine the percentage composition
Separation of Amino Acids by Paper Chromatography
 Separation of Amino Acids by Paper Chromatography Chromatography is a common technique for separating chemical substances. The prefix chroma, which suggests color, comes from the fact that some of the
Ultraviolet Spectroscopy
 Ultraviolet Spectroscopy The wavelength of UV and visible light are substantially shorter than the wavelength of infrared radiation. The UV spectrum ranges from 100 to 400 nm. A UV-Vis spectrophotometer
DETERMINACIÓN DE ESTRUCTURAS ORGÁNICAS (ORGANIC SPECTROSCOPY) IR SPECTROSCOPY
 IR SPECTROSCOPY") DETERMINACIÓN DE ESTRUCTURAS ORGÁNICAS (ORGANIC SPECTROSCOPY) IR SPECTROSCOPY Hermenegildo García Gómez Departamento de Química Instituto de Tecnología Química Universidad Politécnica de Valencia 46022
DETERMINACIÓN DE ESTRUCTURAS ORGÁNICAS (ORGANIC SPECTROSCOPY) IR SPECTROSCOPY Hermenegildo García Gómez Departamento de Química Instituto de Tecnología Química Universidad Politécnica de Valencia 46022
Organic Chemistry Tenth Edition
 Organic Chemistry Tenth Edition T. W. Graham Solomons Craig B. Fryhle Welcome to CHM 22 Organic Chemisty II Chapters 2 (IR), 9, 3-20. Chapter 2 and Chapter 9 Spectroscopy (interaction of molecule with
Determination of Melting Points
 Determination of Melting Points This experiment consists of three parts. In the first part, you will determine the melting point range of three known compounds. This part is mostly for practice, to make
Austin Peay State University Department of Chemistry Chem 1111. The Use of the Spectrophotometer and Beer's Law
 Purpose To become familiar with using a spectrophotometer and gain an understanding of Beer s law and it s relationship to solution concentration. Introduction Scientists use many methods to determine
Energy and Energy Transformations Test Review
 Energy and Energy Transformations Test Review Completion: 1. Mass 13. Kinetic 2. Four 14. thermal 3. Kinetic 15. Thermal energy (heat) 4. Electromagnetic/Radiant 16. Thermal energy (heat) 5. Thermal 17.
Spectroscopy. Biogeochemical Methods OCN 633. Rebecca Briggs
 Spectroscopy Biogeochemical Methods OCN 633 Rebecca Briggs Definitions of Spectrometry Defined by the method used to prepare the sample 1. Optical spectrometry Elements are converted to gaseous atoms or
Organic Spectroscopy. UV - Ultraviolet-Visible Spectroscopy. !! 200-800 nm. Methods for structure determination of organic compounds:
 Organic Spectroscopy Methods for structure determination of organic compounds: X-ray rystallography rystall structures Mass spectroscopy Molecular formula -----------------------------------------------------------------------------
Experiment 8 Synthesis of Aspirin
 Experiment 8 Synthesis of Aspirin Aspirin is an effective analgesic (pain reliever), antipyretic (fever reducer) and anti-inflammatory agent and is one of the most widely used non-prescription drugs. The
electron does not become part of the compound; one electron goes in but two electrons come out.
 Characterization Techniques for Organic Compounds. When we run a reaction in the laboratory or when we isolate a compound from nature, one of our first tasks is to identify the compound that we have obtained.
Physical Properties of a Pure Substance, Water
 Physical Properties of a Pure Substance, Water The chemical and physical properties of a substance characterize it as a unique substance, and the determination of these properties can often allow one to
Experiment #5: Qualitative Absorption Spectroscopy
 Experiment #5: Qualitative Absorption Spectroscopy One of the most important areas in the field of analytical chemistry is that of spectroscopy. In general terms, spectroscopy deals with the interactions
Experiment 11. Infrared Spectroscopy
 Chem 22 Spring 2010 Experiment 11 Infrared Spectroscopy Pre-lab preparation. (1) In Ch 5 and 12 of the text you will find examples of the most common functional groups in organic molecules. In your notebook,
passing through (Y-axis). The peaks are those shown at frequencies when less than
. The peaks are those shown at frequencies when less than") Infrared Spectroscopy used to analyze the presence of functional groups (bond types) in organic molecules The process for this analysis is two-fold: 1. Accurate analysis of infrared spectra to determine
Infrared Spectroscopy used to analyze the presence of functional groups (bond types) in organic molecules The process for this analysis is two-fold: 1. Accurate analysis of infrared spectra to determine
Current Staff Course Unit/ Length. Basic Outline/ Structure. Unit Objectives/ Big Ideas. Properties of Waves A simple wave has a PH: Sound and Light
 Current Staff Course Unit/ Length August August September September October Unit Objectives/ Big Ideas Basic Outline/ Structure PS4- Types of Waves Because light can travel through space, it cannot be
Back to Basics Fundamentals of Polymer Analysis
 Back to Basics Fundamentals of Polymer Analysis Using Infrared & Raman Spectroscopy Molecular Spectroscopy in the Polymer Manufacturing Process Process NIR NIR Production Receiving Shipping QC R&D Routine
Physical Science Study Guide Unit 7 Wave properties and behaviors, electromagnetic spectrum, Doppler Effect
 Objectives: PS-7.1 Physical Science Study Guide Unit 7 Wave properties and behaviors, electromagnetic spectrum, Doppler Effect Illustrate ways that the energy of waves is transferred by interaction with
EXPERIMENT 9 (Organic Chemistry II) Pahlavan - Cherif Synthesis of Aspirin - Esterification
 Pahlavan - Cherif Synthesis of Aspirin - Esterification") EXPERIMENT 9 (rganic hemistry II) Pahlavan - herif Materials Hot plate 125-mL Erlenmeyer flask Melting point capillaries Melting point apparatus Büchner funnel 400-mL beaker Stirring rod hemicals Salicylic
EXPERIMENT 9 (rganic hemistry II) Pahlavan - herif Materials Hot plate 125-mL Erlenmeyer flask Melting point capillaries Melting point apparatus Büchner funnel 400-mL beaker Stirring rod hemicals Salicylic
Determination of Molecular Structure by MOLECULAR SPECTROSCOPY
 Determination of Molecular Structure by MOLEULAR SPETROSOPY hemistry 3 B.Z. Shakhashiri Fall 29 Much of what we know about molecular structure has been learned by observing and analyzing how electromagnetic
AZ State Standards. Concept 3: Conservation of Energy and Increase in Disorder Understand ways that energy is conserved, stored, and transferred.
 Forms of Energy AZ State Standards Concept 3: Conservation of Energy and Increase in Disorder Understand ways that energy is conserved, stored, and transferred. PO 1. Describe the following ways in which
where h = 6.62 10-34 J s
 Electromagnetic Spectrum: Refer to Figure 12.1 Molecular Spectroscopy: Absorption of electromagnetic radiation: The absorptions and emissions of electromagnetic radiation are related molecular-level phenomena
MAKING SENSE OF ENERGY Electromagnetic Waves
 Adapted from State of Delaware TOE Unit MAKING SENSE OF ENERGY Electromagnetic Waves GOALS: In this Part of the unit you will Learn about electromagnetic waves, how they are grouped, and how each group
Lab #11: Determination of a Chemical Equilibrium Constant
 Lab #11: Determination of a Chemical Equilibrium Constant Objectives: 1. Determine the equilibrium constant of the formation of the thiocyanatoiron (III) ions. 2. Understand the application of using a
Chemistry 111 Lab: Intro to Spectrophotometry Page E-1
 Chemistry 111 Lab: Intro to Spectrophotometry Page E-1 SPECTROPHOTOMETRY Absorption Measurements & their Application to Quantitative Analysis study of the interaction of light (or other electromagnetic
The photoionization detector (PID) utilizes ultraviolet
 utilizes ultraviolet") Chapter 6 Photoionization Detectors The photoionization detector (PID) utilizes ultraviolet light to ionize gas molecules, and is commonly employed in the detection of volatile organic compounds (VOCs).
Chapter 6 Photoionization Detectors The photoionization detector (PID) utilizes ultraviolet light to ionize gas molecules, and is commonly employed in the detection of volatile organic compounds (VOCs).
EXPERIMENT 11 UV/VIS Spectroscopy and Spectrophotometry: Spectrophotometric Analysis of Potassium Permanganate Solutions.
 EXPERIMENT 11 UV/VIS Spectroscopy and Spectrophotometry: Spectrophotometric Analysis of Potassium Permanganate Solutions. Outcomes After completing this experiment, the student should be able to: 1. Prepare
SOLUBILITY OF A SALT IN WATER AT VARIOUS TEMPERATURES LAB
 SOLUBILITY OF A SALT IN WATER AT VARIOUS TEMPERATURES LAB Purpose: Most ionic compounds are considered by chemists to be salts and many of these are water soluble. In this lab, you will determine the solubility,
ATOMIC ABSORTION SPECTROSCOPY: rev. 4/2011 ANALYSIS OF COPPER IN FOOD AND VITAMINS
 1 ATOMIC ABSORTION SPECTROSCOPY: rev. 4/2011 ANALYSIS OF COPPER IN FOOD AND VITAMINS Buck Scientific Atomic Absorption Spectrophotometer, Model 200 Atomic absorption spectroscopy (AAS) has for many years
experiment5 Understanding and applying the concept of limiting reagents. Learning how to perform a vacuum filtration.
 81 experiment5 LECTURE AND LAB SKILLS EMPHASIZED Synthesizing an organic substance. Understanding and applying the concept of limiting reagents. Determining percent yield. Learning how to perform a vacuum
2 Spectrophotometry and the Analysis of Riboflavin
 2 Spectrophotometry and the Analysis of Riboflavin Objectives: A) To become familiar with operating the Platereader; B) to learn how to use the Platereader in determining the absorption spectrum of a compound
Waves Sound and Light
 Waves Sound and Light r2 c:\files\courses\1710\spr12\wavetrans.doc Ron Robertson The Nature of Waves Waves are a type of energy transmission that results from a periodic disturbance (vibration). They are
Spectrophotometry and the Beer-Lambert Law: An Important Analytical Technique in Chemistry
 Spectrophotometry and the Beer-Lambert Law: An Important Analytical Technique in Chemistry Jon H. Hardesty, PhD and Bassam Attili, PhD Collin College Department of Chemistry Introduction: In the last lab
IR Applied to Isomer Analysis
 DiscovIR-LC TM Application Note 025 April 2008 Deposition and Detection System IR Applied to Isomer Analysis Infrared spectra provide valuable information about local configurations of atoms in molecules.
Using the Spectrophotometer
 Using the Spectrophotometer Introduction In this exercise, you will learn the basic principals of spectrophotometry and and serial dilution and their practical application. You will need these skills to
Name Date Class ELECTRONS IN ATOMS. Standard Curriculum Core content Extension topics
 13 ELECTRONS IN ATOMS Conceptual Curriculum Concrete concepts More abstract concepts or math/problem-solving Standard Curriculum Core content Extension topics Honors Curriculum Core honors content Options
1. At which temperature would a source radiate the least amount of electromagnetic energy? 1) 273 K 3) 32 K 2) 212 K 4) 5 K
 273 K 3) 32 K 2) 212 K 4) 5 K") 1. At which temperature would a source radiate the least amount of electromagnetic energy? 1) 273 K 3) 32 K 2) 212 K 4) 5 K 2. How does the amount of heat energy reflected by a smooth, dark-colored concrete
1. At which temperature would a source radiate the least amount of electromagnetic energy? 1) 273 K 3) 32 K 2) 212 K 4) 5 K 2. How does the amount of heat energy reflected by a smooth, dark-colored concrete
0 10 20 30 40 50 60 70 m/z
 Mass spectrum for the ionization of acetone MS of Acetone + Relative Abundance CH 3 H 3 C O + M 15 (loss of methyl) + O H 3 C CH 3 43 58 0 10 20 30 40 50 60 70 m/z It is difficult to identify the ions
Chapter 13 Spectroscopy NMR, IR, MS, UV-Vis
 Chapter 13 Spectroscopy NMR, IR, MS, UV-Vis Main points of the chapter 1. Hydrogen Nuclear Magnetic Resonance a. Splitting or coupling (what s next to what) b. Chemical shifts (what type is it) c. Integration
Can Gases Act Like a Greenhouse?
 Can Gases Act Like a Greenhouse? Activity 1 Following a discussion that enables student to express what they already know about the greenhouse effect, students conduct a controlled experiment to confirm
Preview of Period 2: Forms of Energy
 Preview of Period 2: Forms of Energy 2.1 Forms of Energy How are forms of energy defined? 2.2 Energy Conversions What happens when energy is converted from one form into another form? 2.3 Efficiency of
ILLUSTRATIVE EXAMPLE: Given: A = 3 and B = 4 if we now want the value of C=? C = 3 + 4 = 9 + 16 = 25 or 2
 Forensic Spectral Anaylysis: Warm up! The study of triangles has been done since ancient times. Many of the early discoveries about triangles are still used today. We will only be concerned with the "right
CHEM 2423 Recrystallization of Benzoic Acid EXPERIMENT 4 - Purification - Recrystallization of Benzoic acid
 EXPERIMENT 4 - Purification - Recrystallization of Benzoic acid Purpose: a) To purify samples of organic compounds that are solids at room temperature b) To dissociate the impure sample in the minimum
1. The Determination of Boiling Point
 1. The Determination of Boiling Point Objective In this experiment, you will first check your thermometer for errors by determining the temperature of two stable equilibrium systems. You will then use
What s in the Mix? Liquid Color Spectroscopy Lab (Randy Landsberg & Bill Fisher)
") What s in the Mix? Liquid Color Spectroscopy Lab (Randy Landsberg & Bill Fisher) Introduction: There is more to a color than a name. Color can tell us lots of information. In this lab you will use a spectrophotometer
What s in the Mix? Liquid Color Spectroscopy Lab (Randy Landsberg & Bill Fisher) Introduction: There is more to a color than a name. Color can tell us lots of information. In this lab you will use a spectrophotometer
HOMEWORK PROBLEMS: IR SPECTROSCOPY AND 13C NMR. The peak at 1720 indicates a C=O bond (carbonyl). One possibility is acetone:
. One possibility is acetone:") HMEWRK PRBLEMS: IR SPECTRSCPY AND 13C NMR 1. You find a bottle on the shelf only labeled C 3 H 6. You take an IR spectrum of the compound and find major peaks at 2950, 1720, and 1400 cm -1. Draw a molecule
HMEWRK PRBLEMS: IR SPECTRSCPY AND 13C NMR 1. You find a bottle on the shelf only labeled C 3 H 6. You take an IR spectrum of the compound and find major peaks at 2950, 1720, and 1400 cm -1. Draw a molecule
Suggested solutions for Chapter 3
 s for Chapter PRBLEM Assuming that the molecular ion is the base peak (00% abundance) what peaks would appear in the mass spectrum of each of these molecules: (a) C5Br (b) C60 (c) C64Br In cases (a) and
VCE CHEMISTRY 2008 2011: UNIT 3 SAMPLE COURSE OUTLINE
 VCE CHEMISTRY 2008 2011: UNIT 3 SAMPLE COURSE OUTLINE This sample course outline represents one possible teaching and learning sequence for Unit 3. 1 2 calculations including amount of solids, liquids
LIQUID CHROMATOGRAPHY HOW MUCH ASPIRIN, ACETAMINOPHEN, AND CAFFEINE ARE IN YOUR PAIN RELIEVER? USING HPLC TO QUANTITATE SUBSTANCES (Revised: 1-13-93)
") INTRODUCTION HOW MUCH ASPIRIN, ACETAMINOPHEN, AND CAFFEINE ARE IN YOUR PAIN RELIEVER? USING HPLC TO QUANTITATE SUBSTANCES (Revised: 1-13-93) Headache, sore muscles, arthritis pain... How do you spell relief?
INTRODUCTION HOW MUCH ASPIRIN, ACETAMINOPHEN, AND CAFFEINE ARE IN YOUR PAIN RELIEVER? USING HPLC TO QUANTITATE SUBSTANCES (Revised: 1-13-93) Headache, sore muscles, arthritis pain... How do you spell relief?
Fractional Distillation and Gas Chromatography
 Fractional Distillation and Gas Chromatography Background Distillation The previous lab used distillation to separate a mixture of hexane and toluene based on a difference in boiling points. Hexane boils
Chemistry 13: States of Matter
 Chemistry 13: States of Matter Name: Period: Date: Chemistry Content Standard: Gases and Their Properties The kinetic molecular theory describes the motion of atoms and molecules and explains the properties
Isolation of Caffeine from Tea
 Isolation of Caffeine from Tea Introduction A number of interesting, biologically active compounds have been isolated from plants. Isolating some of these natural products, as they are called, can require
Indiana's Academic Standards 2010 ICP Indiana's Academic Standards 2016 ICP. map) that describe the relationship acceleration, velocity and distance.
 that describe the relationship acceleration, velocity and distance.") .1.1 Measure the motion of objects to understand.1.1 Develop graphical, the relationships among distance, velocity and mathematical, and pictorial acceleration. Develop deeper understanding through representations
.1.1 Measure the motion of objects to understand.1.1 Develop graphical, the relationships among distance, velocity and mathematical, and pictorial acceleration. Develop deeper understanding through representations
Study the following diagrams of the States of Matter. Label the names of the Changes of State between the different states.
 Describe the strength of attractive forces between particles. Describe the amount of space between particles. Can the particles in this state be compressed? Do the particles in this state have a definite
Photosynthesis and Light in the Ocean Adapted from The Fluid Earth / Living Ocean Heather Spalding, UH GK-12 program
 Photosynthesis and Light in the Ocean Adapted from The Fluid Earth / Living Ocean Heather Spalding, UH GK-12 program Algae, like your Halimeda, and plants live in very different environments, but they
Overview. What is EMR? Electromagnetic Radiation (EMR) LA502 Special Studies Remote Sensing
 LA502 Special Studies Remote Sensing") LA502 Special Studies Remote Sensing Electromagnetic Radiation (EMR) Dr. Ragab Khalil Department of Landscape Architecture Faculty of Environmental Design King AbdulAziz University Room 103 Overview What
LA502 Special Studies Remote Sensing Electromagnetic Radiation (EMR) Dr. Ragab Khalil Department of Landscape Architecture Faculty of Environmental Design King AbdulAziz University Room 103 Overview What
Energy. Mechanical Energy
 Principles of Imaging Science I (RAD119) Electromagnetic Radiation Energy Definition of energy Ability to do work Physicist s definition of work Work = force x distance Force acting upon object over distance
CPI Links Content Guide & Five Items Resource
 CPI Links Content Guide & Five Items Resource Introduction The following information should be used as a companion to the CPI Links. It provides clarifications concerning the content and skills contained
Molecular Spectroscopy
 Molecular Spectroscopy UV-Vis Spectroscopy Absorption Characteristics of Some Common Chromophores UV-Vis Spectroscopy Absorption Characteristics of Aromatic Compounds UV-Vis Spectroscopy Effect of extended
Absorption by atmospheric gases in the IR, visible and UV spectral regions.
 Lecture 6. Absorption by atmospheric gases in the IR, visible and UV spectral regions. Objectives: 1. Gaseous absorption in thermal IR. 2. Gaseous absorption in the visible and near infrared. 3. Gaseous
Nuclear Magnetic Resonance Spectroscopy
 Nuclear Magnetic Resonance Spectroscopy Nuclear magnetic resonance spectroscopy is a powerful analytical technique used to characterize organic molecules by identifying carbonhydrogen frameworks within
PRE-LAB FOR YEAST RESPIRATION AND FERMENTATION
 PRE-LAB FOR YEAST RESPIRATION AND FERMENTATION PURPOSE: To identify the products of yeast cultures grown under aerobic and anaerobic conditions STUDENTS' ENTERING COMPETENCIES: Before doing this lab, students
Chemical versus Physical Changes
 Chemical versus Physical Changes Permission to Copy - This document may be reproduced for non-commercial educational purposes Copyright 2009 General Electric Company What are physical and chemical changes?
Light as a Wave. The Nature of Light. EM Radiation Spectrum. EM Radiation Spectrum. Electromagnetic Radiation
 The Nature of Light Light and other forms of radiation carry information to us from distance astronomical objects Visible light is a subset of a huge spectrum of electromagnetic radiation Maxwell pioneered
The Electromagnetic Spectrum
 INTRODUCTION The Electromagnetic Spectrum I. What is electromagnetic radiation and the electromagnetic spectrum? What do light, X-rays, heat radiation, microwaves, radio waves, and gamma radiation have
Application Note AN4
 TAKING INVENTIVE STEPS IN INFRARED. MINIATURE INFRARED GAS SENSORS GOLD SERIES UK Patent App. No. 2372099A USA Patent App. No. 09/783,711 World Patents Pending INFRARED SPECTROSCOPY Application Note AN4
Paper Chromatography: Separation and Identification of Five Metal Cations
 Paper Chromatography: Separation and Identification of Five Metal Cations Objectives Known and unknown solutions of the metal ions Ag +, Fe 3+, Co 2+, Cu 2+ and Hg 2+ will be analyzed using paper chromatography.
Convection, Conduction & Radiation
 Convection, Conduction & Radiation There are three basic ways in which heat is transferred: convection, conduction and radiation. In gases and liquids, heat is usually transferred by convection, in which
PURIFICATION TECHNIQUES
 DETERMINACIÓN DE ESTRUCTURAS ORGÁNICAS (ORGANIC SPECTROSCOPY) PURIFICATION TECHNIQUES Hermenegildo García Gómez Departamento de Química Instituto de Tecnología Química Universidad Politécnica de Valencia
Pesticide Analysis by Mass Spectrometry
 Pesticide Analysis by Mass Spectrometry Purpose: The purpose of this assignment is to introduce concepts of mass spectrometry (MS) as they pertain to the qualitative and quantitative analysis of organochlorine
v = fλ PROGRESSIVE WAVES 1 Candidates should be able to :
 PROGRESSIVE WAVES 1 Candidates should be able to : Describe and distinguish between progressive longitudinal and transverse waves. With the exception of electromagnetic waves, which do not need a material
Melting Range 1 Experiment 2
 Melting Range 1 Experiment 2 Background Information The melting range of a pure organic solid is the temperature range at which the solid is in equilibrium with its liquid. As heat is added to a solid,
CHE334 Identification of an Unknown Compound By NMR/IR/MS
 CHE334 Identification of an Unknown Compound By NMR/IR/MS Purpose The object of this experiment is to determine the structure of an unknown compound using IR, 1 H-NMR, 13 C-NMR and Mass spectroscopy. Infrared
Science In Action 8 Unit C - Light and Optical Systems. 1.1 The Challenge of light
 1.1 The Challenge of light 1. Pythagoras' thoughts about light were proven wrong because it was impossible to see A. the light beams B. dark objects C. in the dark D. shiny objects 2. Sir Isaac Newton
THIN LAYER CHROMATOGRAPHY AND MELTING POINT DETERMINATION: DETECTION OF CAFFEINE IN VARIOUS SAMPLES
 EXPERIMENT 3 THIN LAYER CHROMATOGRAPHY AND MELTING POINT DETERMINATION: DETECTION OF CAFFEINE IN VARIOUS SAMPLES Additional Resources http://orgchem.colorado.edu/hndbksupport/tlc/tlc.html http://coffeefaq.com/caffaq.html
Raman Scattering Theory David W. Hahn Department of Mechanical and Aerospace Engineering University of Florida ([email protected])
") Introduction Raman Scattering Theory David W. Hahn Department of Mechanical and Aerospace Engineering University of Florida ([email protected]) The scattering of light may be thought of as the redirection
Introduction Raman Scattering Theory David W. Hahn Department of Mechanical and Aerospace Engineering University of Florida ([email protected]) The scattering of light may be thought of as the redirection
GETTING TO THE CORE: THE LINK BETWEEN TEMPERATURE AND CARBON DIOXIDE
 DESCRIPTION This lesson plan gives students first-hand experience in analyzing the link between atmospheric temperatures and carbon dioxide ( ) s by looking at ice core data spanning hundreds of thousands
13.1 The Nature of Gases. What is Kinetic Theory? Kinetic Theory and a Model for Gases. Chapter 13: States of Matter. Principles of Kinetic Theory
 Chapter 13: States of Matter The Nature of Gases The Nature of Gases kinetic molecular theory (KMT), gas pressure (pascal, atmosphere, mm Hg), kinetic energy The Nature of Liquids vaporization, evaporation,
Experiment 6 Qualitative Tests for Alcohols, Alcohol Unknown, IR of Unknown
 Experiment 6 Qualitative Tests for Alcohols, Alcohol Unknown, I of Unknown In this experiment you are going to do a series of tests in order to determine whether or not an alcohol is a primary (1 ), secondary
EXPERIMENT 4: IONIC AND COVALENT PROPERTIES
 EXPERIMENT 4: IONIC AND COVALENT PROPERTIES PURPOSE To measure and observe properties of various substances. To arrange the substances into groups on the basis of their properties. To learn the properties
Chapter 2: Forms of Energy
 Chapter 2: Forms of Energy Goals of Period 2 Section 2.1: To describe the forms of energy Section 2.2: To illustrate conversions from one form of energy to another Section 2.3 To describe energy storage
NMR and other Instrumental Techniques in Chemistry and the proposed National Curriculum.
 NMR and other Instrumental Techniques in Chemistry and the proposed National Curriculum. Dr. John Jackowski Chair of Science, Head of Chemistry Scotch College Melbourne [email protected]
In this experiment, we will use three properties to identify a liquid substance: solubility, density and boiling point..
 Identification of a Substance by Physical Properties 2009 by David A. Katz. All rights reserved. Permission for academic use provided the original copyright is included Every substance has a unique set
STAAR Science Tutorial 30 TEK 8.8C: Electromagnetic Waves
 Name: Teacher: Pd. Date: STAAR Science Tutorial 30 TEK 8.8C: Electromagnetic Waves TEK 8.8C: Explore how different wavelengths of the electromagnetic spectrum such as light and radio waves are used to
NMR SPECTROSCOPY A N I N T R O D U C T I O N T O... Self-study booklet NUCLEAR MAGNETIC RESONANCE. 4 3 2 1 0 δ PUBLISHING
 A N I N T R O D U T I O N T O... NMR SPETROSOPY NULEAR MAGNETI RESONANE 4 3 1 0 δ Self-study booklet PUBLISING NMR Spectroscopy NULEAR MAGNETI RESONANE SPETROSOPY Origin of Spectra Theory All nuclei possess