ROAD CRASH AND CLAIMS
|
|
|
- Justina Burns
- 10 years ago
- Views:
Transcription
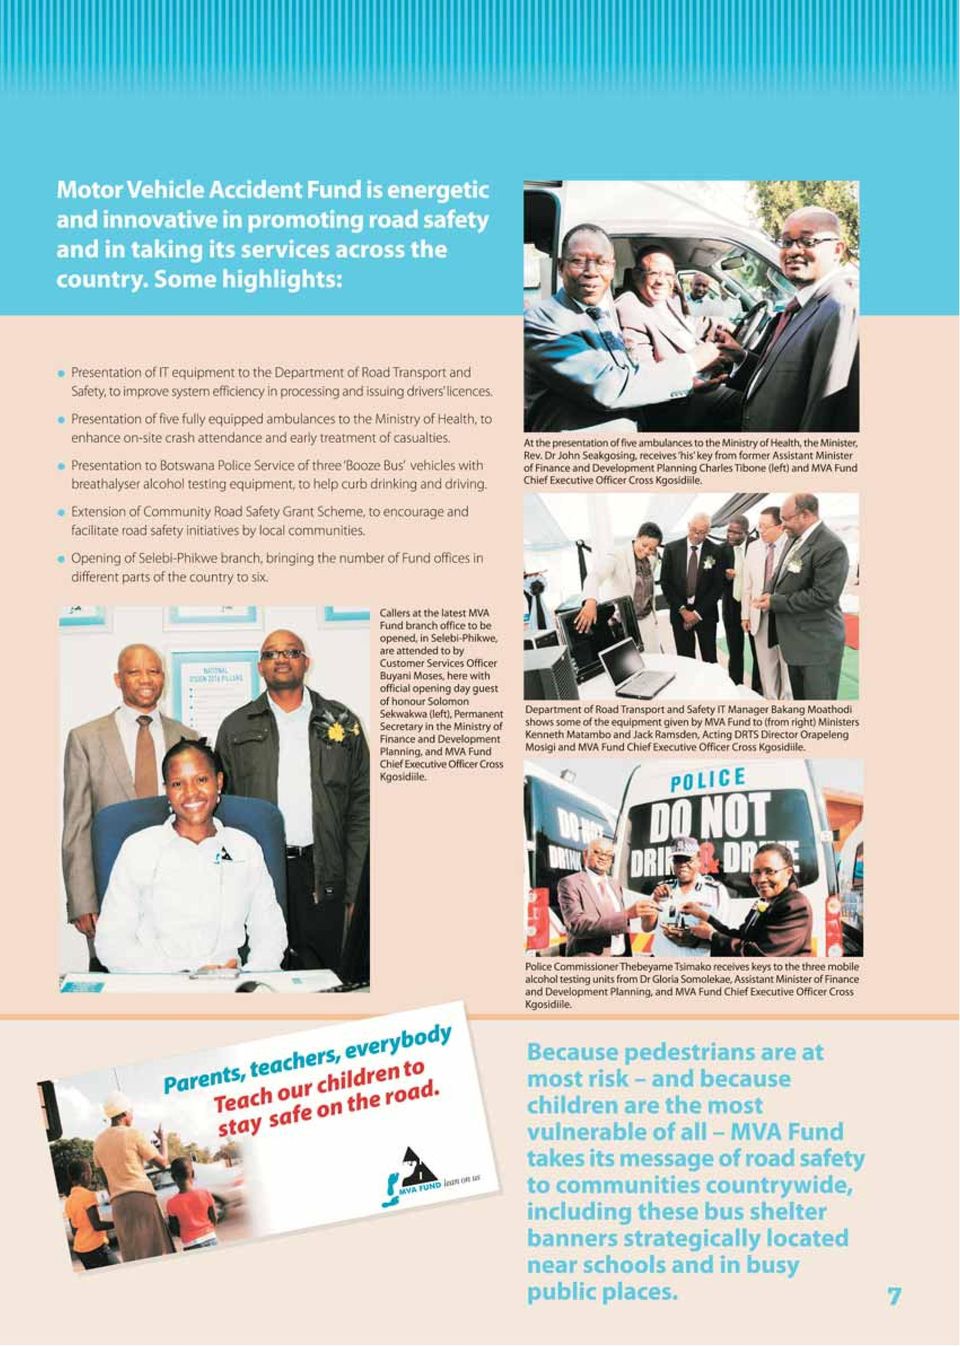
1 RE THUSA SECHABA KGATELOPELE Both the driver and the passenger were thrown into the windscreen when this car was in a high-speed collision. Wearing seatbelts would have saved them. MOTOR VEHICLE ACCIDENT FUND ROAD CRASH AND CLAIMS ANNUAL REPORT DECEMBER MVA Fund is a Botswana partner in the world Decade of Action for Road Safety -. PLAY YOUR PART TOGETHER WE CAN SAVE LIVES Proud holder of the Deloitte Best Organisation to Work For award

2 Joining the Decade of Action Each year about.3 million people die on the road and to million more are injured. Unless action is taken, road crashes are predicted to become the fifth leading cause of death in the world by the year, with.4 million fatalities a year. The United Nations Decade of Action for Road Safety - is a vital global attempt to slow this tragic trend. Botswana commits to the Decade of Action with the firm resolve to redouble its own road safety efforts. Motor Vehicle Accident Fund as the national body charged with promoting road safety, while compensating, supporting and rehabilitating those affected by crashes will play its full part in this great cause.

3 MOTOR VEHICLE ACCIDENT FUND ROAD CRASH AND CLAIMS ANNUAL REPORT 3 DECEMBER

4 MOTOR VEHICLE ACCIDENT FUND Road Crash and Claims Annual Report Contents Mission, Vision and Values Foreword Section Background 8. Data collection method. Road safety country profile.3 Current road safety trends Table : Crash trends 98- Figure : Annual trends 98- Figure : SADC safety performance Figure 3: Botswana safety performance.4 MVA Fund business. Socio-economic role of MVA Fund.6 MVA Fund offices Section Road crashes by police district. Crashes by police district Table : Crashes by police district 6-. Rank of crashes for police districts.3 Fatalities per thousand crashes Table 4: Fatalities per thousand crashes.4 Fatal crashes by police district Table : Fatal crashes by police district Table 6: Fatalities by police district Figure 6: Average fatalities by police district. Fatal crashes and fatalities Table 7: Fatal crashes and fatalities 6- Figure 7: Changes in fatal crashes and fatalities.6 Serious injuries by police district Table 8: Serious injuries by police district Figure 8: Serious injuries by police district.7 Casualties by police district Table 9: Casualties by police district.8 Crashes, fatalities and serious injuries trends Figure 9: Trends 6-.9 Casualties by junction type Table : Fatalities by junction type Table : Serious injuries by junction type. Crashes by corridor Table : Crash type by corridor Section 3 Time and environment 3. Casualties by hour of the day Table 3: Fatalities by hour of the day Table 4: Serious injuries by hour of the day 3. Crashes by hour of the day Table : Crashes by hour of the day 3.3 Fatalities by month Figure : Fatalities by month 3.4 Crashes by day of the week Table 6: Crashes by day of the week Table 7: Casualties by day of the week Table 8: Crash type by light conditions Section 4 People involved in crashes 4. Fatalities by age group

5 Table 9: Fatalities by age group 4. Fatalities by road user type and age Table : Fatalities by road user type and age Table : Serious injuries by road user type and age 4.3 Road user by class of severity Section Vehicles involved in crashes 8. Vehicle types involved in crashes Figure 4: Vehicle types in crashes. Vehicle manoeuvre Table 3: Crashes by vehicle manoeuvre Table 4: Vehicle manoeuvres by number of crashes Section 6 MVA Fund claims analysis 3 6. Claims lodged with MVA Fund 987- Figure : Claims lodged and total casualties 6. Claims lodged by MVA Fund office Figure 6: Claims lodged at offices 6.3 Claimants by region Table : Claimants by region 6.4 Claims by month and office Table 6: Claims by month and office Section 7 MVA Fund road safety initiatives 3 7. Community Road Safety Grant Scheme 7. Youth road safety clubs 7.3 Occupational road risk seminars 7.4 Public education and road safety campaigns Figure 7: Public education by MVA Fund offices Section 8 MVA Fund milestones towards pillars of the 33 Decade of Action for Road Safety - 8. Build road safety management capacity 8. Influence road user behaviour Figure 9: Activities to influence road user behaviour 8.3 Improve post-crash care Figure : Action taken by MVA Fund to improve post-crash care Section 9 Investment in road safety improvement 3 and trauma prevention Road safety investment Towards a Safe System approach Section Conclusion 36 Speed management Drinking and driving Safer roads and roadsides Annexure 37 Figure : Vehicles registered by stations Table : Vehicles registered by DRTS offices Claimants by villages Foreign claimants by country of origin Table : Crash severity by police district and station Police districts and stations Table 3: Possible causes of crashes 3

6 MOTOR VEHICLE ACCIDENT FUND Road Crash and Claims Annual Report Mission, Vision and Values Mission Mission To enhance the quality of life by promoting road safety, compensating, rehabilitating and supporting those affected by road crashes. Vision Best chance to normal life Values Customer focus Integrity Teamwork Innovation We provide support to our customers in order to heal the wounds inflicted by road crashes. We do business in a transparent way and treat everyone with respect. Our environment provides opportunities for us to develop team spirit and work together to create more value for our customers. We continually improve what we do and how we do it. 4

7 ROAD SAFETY COMPENSATION REHABILITATION SUPPORT Foreword Road crashes represent a wasteful expenditure of any nation s valuable resources. The cumulative cost to our country in terms of the loss of productive human resources, the loss and damage to material resources including vehicles, the personal and national medical, administrative, legal and other costs is huge. And it is rising. Statistics show that 397 people were killed and a further 494 were seriously injured on the road in Botswana in. These figures present a sorry picture, largely affecting the productive sector of the population. A high 6% of the road traffic fatalities during the year were people in the -44 age group the most productive of the community, largely comprising educated and trained individuals holding key positions in the workplace. These figures represent human suffering, bereavement, grief and loss which in the majority of cases are avoidable. It is of paramount importance that all road users understand their obligations, by obeying the rules of the road and giving consideration to others. We all share the road, and we have a responsibility to each other to make the road safe. Even when one has the right of way it is essential to yield in the interests of safety. After all, everybody involved in a road crash suffers, not just the wrongdoer. This report not only provides a deep insight into the magnitude of the problem of road traffic crashes in the country, but it is intended also to inspire a change of attitude and behaviour. The fact is that crashes can be prevented but to achieve this demands attention to common sense issues like speeding, use of seatbelts, drinking and driving, disregard of traffic laws, use of cell phones, carelessness, impatience, lack of courtesy, night driving and fatigue on long journeys. It is my conviction and high hope that with all the commendable efforts that continue to be made we will be able to report positively on the road traffic safety situation in subsequent reports. The goal of preventing death and injury on the road must be reached at all costs, and soon. We will achieve this because we owe it to the nation since we are accountable for it. As individuals we owe it to ourselves and our families to stay safe. As road safety stakeholders, our task is to create the context and awareness to allow Botswana to become one of the safest countries in the region. When we all take responsibility, these aspirations will be realised and we will have a real sense of pride in how we use our roads. Share the road go with Botho! CROSS KGOSIDIILE Chief Executive Officer MVA Fund

8

9
10 MOTOR VEHICLE ACCIDENT FUND Road Crash and Claims Annual Report SECTION Background. DATA COLLECTION METHOD This report was researched and compiled by Motor Vehicle Accident Fund. different data sources were used, the main one being the Botswana Police Traffic Crash Statistics Division Database. The other data sources used were the MVA Fund claims database, the Population Projections Report (Central Statistics Report), the Department of Road Transport and Safety Vehicles Database and the World Health Organisation 9 Global Status Report on Road Safety.. ROAD SAFETY COUNTRY PROFILE Road crashes continue to be among the leading causes of death and injury worldwide. They are currently ranked 9th according to the World Health Organisation Report (9). The report warns that if appropriate action is not taken now, road crashes will rise to the third leading cause of death and injury globally by. It is against this background that the World Health Organisation declared road crashes as a major public health problem. Many countries do not regard road crashes as a major problem because they do not have clear strategies to reduce traffic crashes. In March the United Nations General Assembly declared - the Decade of Action for Road Safety. The intention is to stabilise road crashes by increasing activities conducted at national, regional and global levels. The Decade of Action goal is to reduce road crashes by half a major challenge that can only be achieved through guided, coordinated and concerted action. In summary, the overall goal of the Decade of Action for Road Safety is to halt or reverse the rise in road fatalities around the world by stepping up road safety activities at the national level. This will be attained through: Setting ambitious targets for reducing deaths by ; strengthening the global architecture for road safety; increasing the level of global funding for road safety and putting in place a global funding mechanism; increasing human capacity for road safety within countries; providing technical support to countries using successful experiences from others; improving the quality of data collection at the national, regional and global levels and Monitoring progress on a number of predefined indicators at the national, regional and global levels including both the public and private sectors. To achieve these objectives, countries are encouraged to implement the Decade framework comprising five pillars road safety management, infrastructure, safe vehicles, road user behaviour and post-crash care. Road deaths and injuries impose a huge economic burden on developing economies, amounting to -3% of Gross Domestic Product (GDP) in most countries (WHO 9). Botswana loses around 48 people to road crashes annually, with another being seriously injured. Most of these deaths and injuries can be avoided if appropriate interventions are put in place. Reports from Botswana Police Traffic Division show that most of these crashes are caused by human error, which shows clearly that they can be avoided. Statistics also show that most deaths and injuries occur at the weekend, especially at month-end and over public holidays..3 CURRENT ROAD SAFETY TRENDS The high level of road trauma in Botswana imposes huge economic costs on the country. In addition, deaths and disability cause great emotional and financial stress to the thousands of families affected. Crashes are largely preventable. Each life saved and each serious injury avoided reduces pain and suffering and achieves important economic savings. Table Crash trends 98- Population Year Crashes Casualties Fatalities Registered projections Crashes Casualties Fatalities Fatalities vehicles -3 / veh / veh / veh / pop

11 BEST CHANCE TO NORMAL LIFE Table Crash trends 98- (continued) Year Crashes Casualties Fatalities Registered Estimated Crashes Casualties Fatalities Fatalities vehicles population / veh / veh / veh / pop This table illustrates Botswana s traffic safety performance for the past 9 years, showing fatalities per vehicles and fatalities per population. In 98 the number of people killed in road crashes per population was 9.9. The figure went up in the following years, peaking at 3.4 in and going down to. in. Fatalities per vehicles stood at 6.8 in 98 and went up between 98 and 99, with the highest at 4. in 989. The graph below shows that between and the two traffic safety indicators moved downwards an indication of good performance compared to the previous years. Fatalities per vehicles declined at a faster rate than fatalities per population. Two factors could be attributed to the faster decline in fatalities per vehicles. The first factor could be that there was a sharp increase in the vehicle population while fatality rates remained constant, and the second could be that the data did not allow for deregistration of scrap or inactive vehicles from the system, thereby inflating the number of vehicles on the road and as a result distorting this performance indicator. Figure Annual Trends 98- (Fatalities/ vehicles and fatalities/ population) Fatalities/ vehicles Fatalities/ population 9

12 MOTOR VEHICLE ACCIDENT FUND Road Crash and Claims Annual Report SECTION Background (continued) The 7 traffic safety performance of the countries of the Southern African Development Community (SADC) ranked Botswana second in the region for the number of people killed in road crashes per population. South Africa was at the top with 3.7 people killed. The lowest countries for road fatalities per population were Malawi, Madagascar and Democratic Republic of Congo. Figure SADC traffic safety performance 7 (Deaths/ population) DRC Madagascar. Malawi Tanzania Mozambique 7.8 Zimbabwe.6 Zambia.7. Angola Mauritius 6. Seychelles 7.7 Namibia..6 Lesotho Swaziland Botswana RSA Fatalities per population for Botswana were between 4.9 and. in the years 6-. There were fluctuations over the years, indicating that the country s performance was volatile. The movement of this traffic safety indicator did not show constant reduction or increases, these movements strongly suggests that the past road safety initiatives did not have constant impact in road safety performance of the country. Figure 3 Botswana traffic safety performance (Deaths/ population)

13 PLAY YOUR PART TOGETHER WE CAN SAVE LIVES.4 MOTOR VEHICLE ACCIDENT FUND BUSINESS The 7 MVA Fund Act changed the operation and focus of the Fund. The Act gives more emphasis to road safety education and injury prevention and medical treatment and rehabilitation. These changes were aimed at reducing costs for the Fund and enhancing the quality of life of those affected by road crashes. During MVA Fund implemented some initiatives in the Injury Prevention Department and Case Management section with the aim of reducing road traffic crashes and enhancing the quality of life for those affected by road crashes. The Injury Prevention Department intensified road safety education during the year. The implementation of major activities included media advertising, roadside education campaigns, road safety sponsorships and occupational road risk workshops for organisations with large fleets of vehicles. The Fund spent P on road safety activities during the year, compared to P in the previous year. In the Fund financed two community groups through its Community Road Safety Grant Scheme, with the aim of encouraging local road safety initiatives and educating communities on the importance of road safety. The grant scheme cultivates community participation in the prevention of road crashes within their localities. The grant scheme was born out of the fact that different parts of the country experience different road crash situations, which can best be dealt with at the local level because the communities themselves are best placed to identify specific problems in their areas. The MVA Fund Injury Prevention Department, through the research function, produced the 9 Road Crash and Claims Annual Report, the first publication of its kind in the country. Its appearance marked a critical milestone in the national effort to save lives on the road. The report presented highly detailed road crash statistics at all levels for local and regional planning, providing stakeholders with critical information for planning, implementing and monitoring. The document demonstrated that effective road safety management must be derived from thorough road safety research. The success of the first MVA Fund Road Crash and Claims Annual Report promoted the publication of this second Report, for the year.. SOCIO-ECONOMIC ROLE OF MVA FUND In the Fund intensified the process of rehabilitating those affected by road crashes. At year end the total undertaking client base was 4 7. A total of 86 seriously injured claimants, the majority of them with multiple injuries, were rehabilitated. The Case Management Department sent 8 claimants to different specialists for medical assessments and treatment. The use of money set aside for medical purposes increased from 4.% in 9 to 36.% in. This was attributed to the increase in the level of awareness of the Fund s products and services..6 GEOGRAPHIC FOOTPRINT OF THE FUND MVA Fund continues to take its services out to the people. The Fund s offices are strategically located in regions with high traffic volumes and other traffic safety indicators such as the number of crashes and the population in the region. In the Fund opened its fifth branch office, at Selebi- Phikwe. The office is assisting those affected by crashes in Selebi Phikwe and the surrounding areas. Figure 4 MVA Fund offices and support structures SHAKAWE GUMARE MAUN TOTENG KASANE SOWA MVA FUND OFFICES DISTRICT ROAD SAFETY COMMITTEES TUTUME MASUNGA FRANCISTOWN GHANZI LETLHAKANE TONOTA CHARLES HILL SELEBI-PHIKWE SEROWE PALAPYE BOBONONG KANG MAHALAPYE HUKUNTSI TSABONG LETLHAKENG MABUTSANE MOSHUPA MOLEPOLOLE MOCHUDI JWANENG GABORONE RAMOTSWA TLOKWENG KANYE LOBATSE GOODHOPE

14 MOTOR VEHICLE ACCIDENT FUND Road Crash and Claims Annual Report SECTION Road crashes by police district. CRASHES BY POLICE DISTRICT The table below shows recorded crashes for the past five years by police districts, and total and average recorded crashes for the same period. The average number of recorded crashes for the past five years was 9 83 and only two years (6 and ) during the period fell below the five-year average. The highest number of crashes, totalling 4, was recorded in 8. Police districts with all-time high crashes recorded were Gaborone West, Gaborone, Serowe and Francistown. Police districts recording the lowest number of crashes were Kasane, Ghanzi, Tsabong and Lobatse. Table Reported crashes by police district 6- Police District year total -year average Gaborone West Gaborone Serowe Francistown Kanye Molepolole Kutlwano Mochudi Selebi-Phikwe Maun Letlhakane Lobatse Tsabong Ghanzi Kasane Total Figure Total reported crashes by police districts 6- (-year average) Gaborone West Gaborone Serowe Francistown Kanye Molepolole Kutlwano Mochudi Selebi-Phikwe Maun Letlhakane Lobatse Tsabong Ghanzi Kasane

15 ROAD SAFETY COMPENSATION REHABILITATION SUPPORT. RANK OF CRASHES FOR POLICE DISTRICTS 6- The distribution of total crashes recorded annually for the past five years shows that Gaborone West, Gaborone and Serowe Police Districts were the top three. The rankings in Table 3 below were derived by dividing the total number of crashes recorded in the district by the total national recorded crashes. The rankings show that in terms of total recorded crashes the top police districts are Gaborone West, Gaborone, Serowe, Francistown and Molepolole. This points to the need for more resources to be directed to these districts in order to cut down on the rate of road crashes in the country. However, it is important to note that although these districts record high numbers of crashes it does not necessarily follow that fatalities and serious injuries are also high in these districts. Tsabong, Ghanzi and Kasane police districts recorded low annual crashes for the past five years but they are the top three districts in fatalities per recorded crashes over the same period. This indicates that although these districts are low in terms of total reported crashes, they experience a higher proportion of crashes that are fatal, or vehicle occupancy is slightly higher in them compared to other districts. Table 3 Police districts by rank of crash Police District Gaborone West Gaborone Serowe Francistown Molepolole Kanye Kutlwano Maun Mochudi Selebi-Phikwe Letlhakane Lobatse Tsabong Ghanzi Kasane.3 FATALITIES PER THOUSAND CRASHES Table 4 illustrates that in the past five years the average number of people killed per recorded crashes was 4. This means that to achieve the Decade of Action for Road Safety goal of reducing the total number of people killed by half (or ), the total annual recorded crashes should be reduced to at least 47 by the year. It is important to note that police districts have different levels of risk in terms of deaths and serious injuries. The table shows that Kasane, Maun, Lobatse, Serowe, Ghanzi and Tsabong recorded high deaths per thousand recorded crashes in. 3

16 MOTOR VEHICLE ACCIDENT FUND Road Crash and Claims Annual Report SECTION Road crashes by police district (continued) Table 4 Fatalities per thousand crashes by police district Police District Kasane Maun Lobatse Tsabong Ghanzi Serowe Molepolole Selebi-Phikwe Francistown Mochudi Kutlwano Letlhakane Kanye Gaborone West Gaborone Total FATAL CRASHES BY POLICE DISTRICT 6- The table below shows that annual recorded fatal crashes for the past five years ranged between 3 and 37 in the years 6-. A comparison of fatal crashes to fatalities shows a positive correlation between the two. When fatal crashes go up fatalities also go up. Total recorded fatal crashes in 6 were 3, resulting in 49 deaths. Total recorded fatal crashes went up to 369 in 7, resulting in 47 deaths. On average, more than one life is lost for every fatal crash. This shows a clear correlation between fatal crashes and fatalities. Police districts with high fatal crashes are Serowe, Gaborone West, Gaborone, Kutlwano, Molepolole, Kanye and Mochudi. This calls for specific interventions or road safety strategies for these districts. Table Fatal crashes by police district Police District Kutlwano Serowe Gaborone Lobatse Maun Ghanzi 9 8 Kasane Letlhakane Tsabong Selebi-Phikwe Molepolole Mochudi Gaborone West Kanye Francistown 9 9 Total

17 BEST CHANCE TO NORMAL LIFE Table 6 Fatalities by police district 6- Police District year total -year average Gaborone West Gaborone Serowe Kanye Francistown Molepolole Kutlwano Selebi-Phikwe Maun Mochudi Lobatse Letlhakane Tsabong Ghanzi Kasane Total Figure 6 Average fatalities by police district Serowe Gaborone west Mochudi Kanye Molepolole Kutkwano Gaborone Selebi-Phikwe Letlhakane Lobatse Maun Francistown Kasane Ghanzi Tsabong. FATAL CRASHES AND FATALITIES 6- This table illustrates fatal crashes, fatalities and the proportion of fatalities to fatal crashes for the past five years. It shows that on average a fatal crash claimed more than one life and the range was between.4 in and.347 in 7. The proportion of fatalities to fatal crashes shows that a slight change in fatal crashes results in a significant change in fatalities. Table 7 Fatal crashes and fatalities 6- Year Fatal crashes Fatalities Fatalities/fatal crashes Figure 7 on the following page shows that between 6 and 7 fatal crashes increased by 47, resulting in an increase of 68 deaths. Between 7 and 8 fatal crashes went down by 4 and this resulted in a reduction of 4 fatalities. Fatal crashes in 9 went up by 7, resulting in an increase of deaths, and in there were 4 fewer fatal crashes and 78 fewer deaths.

18 MOTOR VEHICLE ACCIDENT FUND Road Crash and Claims Annual Report SECTION Road crashes by police district (continued) Figure 7 Changes in fatal crashes and fatalities Change in fatal crashes Changes in fatalities.6 SERIOUS INJURIES BY POLICE DISTRICT The table below shows that Serowe Police District recorded the highest number of serious injuries in the past five years, followed by Gaborone West, Gaborone, Mochudi and Selebi-Phikwe Police Districts. The total annual recorded casualties for the period ranged between about and. Table 8 Serious injuries by police district 6- Police District year total -year average Gaborone West Gaborone Serowe Kanye Francistown Molepolole Kutlwano Selebi-Phikwe Maun Mochudi Lobatse Letlhakane Tsabong Ghanzi Kasane Total

19 PLAY YOUR PART TOGETHER WE CAN SAVE LIVES Figure 8 Total reported serious injuries by police districts 6- (-year average) Serowe Gaborone west Mochudi Gaborone Selebi-Phikwe Kutlwano Maun Kanye Molepolole Letlhakane Lobatse Francistown Kasane Ghanzi Tsabong.7: CASUALTIES BY POLICE DISTRICT The five police districts listed on the table below recorded the highest number of casualties during the years 9 and. Gaborone West led, followed by Serowe, Gaborone, Kutlwano and Mochudi. All these police districts, which accounted for more than half of all fatalities, are along the A corridor. Table 9 Casualties by police district and station FATALITIES SERIOUS MINOR Police Station Kutlwano Tatitown Matsiloje Tonota Sub total Mahalapye Palapye Serowe Machaneng Martinsdrift Shoshong Maunatlala Sub total Broadhurst Tlokweng Central Borakanelo Sub total

20 MOTOR VEHICLE ACCIDENT FUND Road Crash and Claims Annual Report SECTION Road crashes by police district (continued) Table 9 Casualties by police district and station (continued) FATALITIES SERIOUS MINOR Police Station Mochudi Dibete Sikwane Olifants 7 Sub total Mogoditshane Gaborone West Ramotswa Naledi Sir Seretse Khama Airport Sub total : CRASHES, FATALITIES AND SERIOUS INJURIES TRENDS The crash trends below show the traffic performance for the past five years. Total crashes, fatalities and serious injuries did not change significantly between 6 and. The total number of recorded crashes stood at in compared to 7 3 in 6. The number of crashes moved upwards between 6 and 8 and dropped between 8 and. Fatalities and serious injuries followed a similar trend. Although an increase in total crashes cannot result in the same increase in both fatalities and serious injuries, it is clear from the statistics that when total crashes go down both fatalities and serious injuries go down too. Figure 9 Crashes, fatalities and serious injuries trends Fatalities Serious injuries Total crashes.9 CASUALTIES BY JUNCTION TYPE 6- Sections of road without junctions accounted for most fatalities during the past five years. In 6 people killed on non-junction sections of the road accounted for 8.3% of the total, and in 7 this rose to 9.%. The non-junction sections accounted for 83.3%, 87.4% and 87.4% in 8, 9 and respectively. It is evident that more fatal crashes take place on open roads and corridors than on roads with junctions and traffic controls. This clearly points to the need to target these roads more vigorously and effectively. 8

21 ROAD SAFETY COMPENSATION REHABILITATION SUPPORT Table Fatalities by junction type Junction type Average No junction Signals (working) Signals (not working) 6 Stop sign Yield sign Police controlled areas Uncontrolled Totals Figure Casualties by junction type 6- average 87% % % % % 3% No junction Signals (Working) Signals (Not working) Stop sign Yield sign Police controlled areas Table Serious injuries by junction type 6- Junction type No junction Signals (working) Signals (not working) Stop sign 9 3 Yield sign Police controlled areas 4 Uncontrolled Total
22 MOTOR VEHICLE ACCIDENT FUND Road Crash and Claims Annual Report SECTION Road crashes by police district (continued). CRASHES BY CORRIDOR The table below shows the distribution of crashes along the main corridors of the country in 9 and. The highest number of crashes took place on the A, which accounted for 44.8% of crashes in all the major corridors. The most common crashes along the A are rear-end, domestic animals, side and roll-over. Domestic animals account for more than half of crashes on the A and A3. Most crashes on the A and A are rear-end and side collisions, followed by domestic animals. Crashes involving pedestrians increased between 9 and on all main roads except the A Table Crash type by corridor 9- ROAD A A A3 A A Collision Type Rear-end Side Head-on Hit pedestrian Wild animal Domestic animal Obstacle on road Obstacle off road Roll-over Other Total KASANE CRASH HOT-SPOTS SHAKAWE ROAD CASUALTIES MVA FUND OFFICES MAUN NATA TUTUME MASUNGA TOTENG A3 RAMOKGWEBANA ORAPA FRANCISTOWN GHANZI LETLHAKANE A4 TONOTA SELEBI-PHIKWE CHARLES HILL SEROWE PALAPYE BOBONONG MAHALAPYE HUKUNTSI TSABONG KANG A A LETLHAKENG MOLEPOLOLE A MOCHUDI JWANENG A GABORONE TLOKWENG KANYE LOBATSE RAMATLABAMA
23 BEST CHANCE TO NORMAL LIFE SECTION 3 Time and environment This section focuses on road crashes and casualties by hour, day, month and light conditions. The stated parameters are critical indicators for the design and management of road safety activities. To come up with appropriate road safety initiatives we need to know when most crashes occur and on what day of the week. 3. CASUALTIES BY HOUR OF THE DAY 6- The table below shows that most fatal and serious injury crashes occur between the hours of 6pm and pm followed by 4pm qnd 6pm. Most of these crashes take place over weekends and at month ends. It is important therefore to devise and implement programmes or strategies to address these conditions. Table 3 Fatalities by hour of the day Time Total Table 4 Serious injuries by hour of the day Time Total
24 MOTOR VEHICLE ACCIDENT FUND Road Crash and Claims Annual Report SECTION 3 Time and environment (continued) 3. CRASHES BY HOUR OF THE DAY The table below shows that in most crashes occurred between pm and pm, for fatalities, serious and minor injuries and total reported crashes. More crashes were recorded between the hours 6pm and 8pm than at any other time. Table Crashes by hour of the day TIME Fatalities Serious Minor Total % Fatalities % Serious % Minor % Total Total FATALITIES BY MONTH Fatalities by month in the five years 6- show a similar yearly pattern. Fatalities are usually low in January and February, increase in March and remain constant between March and May. The trend is also for fatalities to be low during winter in May, June and July and then increase in August, September and October. Fatalities are highest in December every year. These trends demonstrate that traffic crashes do not simply occur by mistake, but can be attributed to certain conditions, behaviour and many other factors. It is important for all road safety public education officials and stakeholders to understand these underlying factors, in order to effectively address them. Figure Monthly fatalities January February March April May June July August September October November December 7 8 9
25 PLAY YOUR PART TOGETHER WE CAN SAVE LIVES 3.4 CRASHES BY DAY OF THE WEEK The table below shows that on average between 4 and 9 crashes occur every week. For the past five years above-average crashes have taken place on Friday and Saturday, with Thursday not far behind. Although there is no significant variation in crashes by day of the week, Thursday, Friday and Saturday are slightly higher than other days. Factors that can be attributed to this are increased travel, consumption of alcohol, speed and careless driving. Saturday is the day for most casualties on the road, at 6 8 for the period, followed by Friday at 6 77 and Sunday at 3. Tuesday recorded the lowest number of casualties at 7, followed by Wednesday at 38 and Monday at 83. These figures show the low and high risk days for road crash casualties. Table 6 Crashes by day of the week 6- Day of the week Total Sunday Monday Tuesday Wednesday Thursday Friday Saturday Total Average crashes by day Fatalities occur mainly over weekends. The table below shows that most fatal crashes (9%) take place on Friday, Saturday and Sunday, with serious and minor injuries following the same trend. It follows that road safety initiatives should target days of the week with more casualties, but because radio listenership is lower at weekends than during the week (Botswana Telecommunications Authority audience research), radio road safety campaigns should target mainly week days. Table 7 Casualties by day of the week Fatalities Serious injuries Minor injuries Day of the week Sunday Monday Tuesday Wednesday Thursday Friday Saturday Total Average
26 MOTOR VEHICLE ACCIDENT FUND Road Crash and Claims Annual Report SECTION 3 Time and environment (continued) Table 8 Crash type by light conditions Fatal Serious Minor Damage only Total Light conditions Daylight Dusk Night street lit Night bright moon Dark Total Figure Road crash type by light conditions Daylight Dusk Night street lit Night bright moon 839 Dark 4
27 ROAD SAFETY COMPENSATION REHABILITATION SUPPORT SECTION 4 People involved in crashes 4. FATALITIES BY AGE GROUP This section focuses on identifying categories of people who are most involved in road crashes, the important indicators being age, sex and road user. They are important because there are disparities in terms of risk between age groups, sex and road user category. In most countries young people, especially young men, are most likely to be involved in road crashes. The risk perception varies between age groups, sex and road user category, and it is necessary to establish these differentials to allow for specific interventions for different age groups and other categories. The table and graph below show fatalities by age group for the past five years. In the period 6- people between -4 years accounted for around 7% of all those killed annually. The age group up to 9 follows with 8% and the least affected group is and above, accounting for about % of deaths during the period. Table 9 Fatalities by age group 6- Number of fatalities Percentages Age group > Unknown..... Total Figure 3 Fatalities by age group % 69.8% 7.8% 7.4% 7% 3 7.9% 8.9%.% 3.% 8.4%.3%.3% 9%.6%.6% years -4 years + years
28 MOTOR VEHICLE ACCIDENT FUND Road Crash and Claims Annual Report SECTION 4 People involved in crashes (continued) Table Risk by age group 996- (percentage) Year FATALITIES BY ROAD USER CLASS AND AGE GROUP Passengers in vehicles accounted for most fatalities in, at 43.8% of the total, followed by pedestrians at 9.7% and drivers at 6.4%. The distribution also shows that most road users killed are between the age of and 4. The same pattern applies for serious injuries. Table Fatalities by road user class and age Fatalities Percentages Age group Drivers Passengers Pedestrians Total Drivers Passengers Pedestrians Total Total
29 BEST CHANCE TO NORMAL LIFE Table Serious injuries by class and age Casualties Percentages Age group Drivers Passengers Pedestrians Total Drivers Passengers Pedestrians Total Total ROAD USER BY CLASS OF SEVERITY Passengers are the most affected in crashes, followed by pedestrians and then drivers. Fatalities Serious Minor Total Casualty class Driver Passenger Pedestrian Total
30 MOTOR VEHICLE ACCIDENT FUND Road Crash and Claims Annual Report SECTION Vehicles involved in crashes. VEHICLE TYPES INVOLVED IN CRASHES The figure below presents statistics of vehicles involved in crashes drawn from the MVA Fund claims database for 9 and. Most vehicles involved in crashes were cars, followed by pickups and mini-buses. These distributions were similar to national registered cars by make or model. Figure 4 Vehicle types involved in crashes (MVA Fund database 9 and ) Vehicles involved Claims received Car 9 Pick-up 6 48 Mini-bus x Light utility 7 4 Lorry Other 9 Taxi 8 67 Bicycle 6 73 Animal drawn 86 6 Bus 8 6 Lorry/trailer 7 8 Motorcycle 8 7 Tractor Unknown. VEHICLE MANOEUVRE Most vehicles involved in crashes are travelling forward and straight. Turning to the right is the most common action of drivers involved in crashes. Table 3 Vehicle manoeuvres 9- Number Percentage Manoeuvres 9 9 Going straight Turning right Turning left Crossing Stream Overtaking U-Turning 8.. Merging Diverging 7..4 Reversing Sudden start Sudden stop Parked off road Parked on road Other Total The majority of crashes in involved two vehicles, with 9 3 out of 3 3 vehicles. The others were mainly single vehicle crashes. 8
31 PLAY YOUR PART TOGETHER WE CAN SAVE LIVES Table 4 Vehicle manoeuvres by number of collisions Vehicle manoeuvres Totals Going straight Turning right Turning left Crossing stream Overtaking U-Turning 3 8 Merging 6 7 Diverging Reversing Sudden start Sudden stop Parked off road Parked on road Other Total
32 MOTOR VEHICLE ACCIDENT FUND Road Crash and Claims Annual Report SECTION 6 MVA Fund claims analysis 6. CLAIMS LODGED WITH MVA FUND 987- Road users who are involved in crashes are able to lodge claims for assistance from MVA Fund. The total number of such claims from 987 to the end of was 39 87, out of a total of casualties. Claims lodged represent 6.6% of all casualties for the period. The number of claims lodged with the Fund in 987 was low, only 3.% of the total reported casualties in that year. Claims increased from 988 to 8 and decreased in 9-, with claims and 6 43 recorded casualties. Figure Claims lodged and total casualties Claims lodged Casualties 6. CLAIMS LODGED BY MVA FUND OFFICE 9- The figure below shows claims lodged at MVA Fund offices in 9 and. Gaborone office received most claims in both years, but with fewer in than the year before. Francistown office received the second highest number, but there was a big drop from 9 to. All MVA Fund offices received fewer claims in than the year before except Kang which handled 67 compared to 4 in 9. Figure 6 Claims lodged at MVA Fund offices Gaborone Francistown Palapye Maun Selebi-Phikw Kang 9 3
33 ROAD SAFETY COMPENSATION REHABILITATION SUPPORT 6.3 CLAIMANTS BY REGION The table below shows the distribution of claims lodged with the Fund in 9 and. Gaborone region received the highest number in both years, followed by Francistown, Molepolole and Kanye. Kasane region recorded the lowest with only seven claims lodged in, followed by Ghanzi (34), Ramotswa (37) and Tutume (4). The number of claims dropped by 37.% between 9 and, with fewer claims lodged in all regions. Those regions in which there was a drop of more than half were Kasane (74.%), Tutume (7.6%) and Francistown (6.%). The remaining regions recorded decreases of less than half. Claims by foreigners did not change significantly between the two years. Table Claims received by region Region 9 % Change Gaborone (3.4) Francistown (6.) Molepolole 88 4 (.) Kanye (6.) Maun 8 4 (4.9) Selebi-Phikwe 7 8 (48.4) Lobatse (44.3) Mochudi 9 9 (9.) Serowe 7 8 (3.4) Palapye 84 4 (3.6) Mahalapye 4 9 (38.3) Tutume 99 4 (9.6) Ramotswa 8 37 (36.) Tsabong (4.9) Letlhakane 94 7 (39.4) Ghanzi (6.9) Kasane 7 7 (74.) Foreign 4 44 (.) Total 3 7 (37.) 6.4 CLAIMS BY MONTH AND OFFICE Gaborone office received more claims than other MVA Fund offices, followed by Francistown and Palapye. The number of claims did not vary significantly between the months of the year. Table 6 Claims lodged by month and office Month Gaborone F/town Palapye Maun S/Phikwe Kang Total January February March April May June July August September 7 7 October November December Total
34 MOTOR VEHICLE ACCIDENT FUND Road Crash and Claims Annual Report SECTION 7 MVA Fund road safety initiatives During MVA Fund continued with a range of activities throughout the country, in its ongoing efforts to raise awareness of the urgent need for road safety. These included roadside education campaigns, road safety youth clubs, corporate presentations and the Community Road Safety Grant Scheme. The Fund s expenditure on road safety initiatives during the year totalled P COMMUNITY ROAD SAFETY GRANT SCHEME This outstanding initiative has the primary objective of involving the general public in the promotion of road safety. The programme sponsors community groups whose project proposals demonstrate the capability of making a positive impact on road safety in their areas. The first two beneficiaries of the grant scheme in 9/ were Reetsanang Association of Community Drama Groups and Youth Health Organisation, which were selected from 34 applicants. Both organisations disseminated information on road safety through drama, with the latter targeting school children in Francistown. Reetsanang s project targeted Gaborone and the surrounding villages of Tlokweng, Ramotswa, Otse, Lobatse and Kumakwane. Another call for the submission of proposals in attracted 36 applications. Three were considered suitable for funding: Kgaitsadi Society of Botswana in Gaborone (which develops interactive traffic safety board games for schools and traffic safety clubs), Tlhare Segolo based in Maun (which operates pupil patrols at selected schools in Maun) and Sedibelo Choir in Mochudi (which puts across in music and dance the message of drinking and driving the project is called Boifa Bojalwa Go Ipabalela Tseleng). 7. YOUTH ROAD SAFETY CLUBS In its efforts to cultivate a road safety culture among children, the Fund helped eight schools to set up and run road safety clubs during the year. Clubs formed included Iphutheng, Chichi and Mosetlha Junior Secondary Schools, Tlokweng Brigade and University of Botswana. Young people make up the majority of road crash casualties, and the Fund will continue to initiate and support programmes to address this situation. 7.3 OCCUPATIONAL ROAD RISK SEMINARS In March the Fund organised two-day seminars on workplace road safety for drivers at Central Transport Organisation and for technicians at Botswana Power Corporation. The aim was to sensitise the organisations, which have large fleets of vehicles, on the importance of addressing road safety as a workplace welfare matter that should be incorporated in the Corporate Occupational Health and Safety Programme. The seminars covered ergonomics, safety engineering, occupational road risk, and crash statistics. 7.4 PUBLIC EDUCATION AND ROAD SAFETY CAMPAIGNS The Fund s road safety promotion initiatives during the year took many forms and reached a great many people. Activities took place countrywide and included corporate presentations, exhibitions, kgotla meetings, road safety campaigns, and interaction with school children and young people. During the FIFA World Cup in South Africa the Fund set up safety education stations at the Tlokweng, Ramatlabama and Pioneer border gates, to encourage safe driving by the many fans who travelled to the matches. This initiative was mounted in collaboration with Lobatse and Tlokweng District Road Safety Committees. Figure 7 Public education interactions by MVA Fund offices Gaborone Francistown Palapye Maun Selebi-Phikwe Kang 3
35 BEST CHANCE TO NORMAL LIFE SECTION 8 MVA Fund milestones towards the Decade of Action for Road Safety - With its mandate to save lives on the road as well as compensating, supporting and rehabilitating those affected by crashes MVA Fund is committed to playing its part in wholehearted support of the Decade of Action for Road Safety -. The Fund s activities and services demonstrate that it is operating in harmony with the five pillars of the global campaign. These pillars are: Road management, Safer roads and safer transport systems, Safer vehicles, Safer road users, and Improving post-crash care. 8. PILLAR : BUILD ROAD SAFETY MANAGEMENT CAPACITY This pillar of the Decade of Action advocates the creation of multi-sectoral partnerships and the designation of lead agencies with the capacity to develop national road safety strategies, plans and targets, supported by data collection and evidential research to assess, countermeasure, design and monitor implementation and effectiveness. The Fund conducts countrywide road safety education in collaboration with a range of partner organisations in the public and private sectors. The Fund has also given substantial IT equipment to the Department of Road Transport and Safety to make the Department more efficient and rigorous in the issuing of driving licences and permits. MVA Fund Facilitated Collaborations Botswana National Youth Council Roads Department Emergency Medical Services Department of Road Transport and Safety Botswana Police Service UB Trauma Group Community Bots/US Centre for Disease Control Botswana Red Cross Society Men s Sector Shell Oil Botswana Kgalagadi Breweries Bomaid Ministry of Health 8. PILLAR 4: INFLUENCE ROAD USER BEHAVIOUR This pillar advocates the sustained enforcement of laws and standards combined with public awareness/education activities that will raise compliance with regulations that reduce the impact of the key risk factors such as speeding and drink driving. The chart on the following page shows the Fund s progress in this regard. A highlight is the Fund s purchase of three fully equipped mobile alcohol testing vehicles (dubbed booze buses ) for Botswana Police Service. 33
36 MOTOR VEHICLE ACCIDENT FUND Road Crash and Claims Annual Report SECTION 8 MVA Fund milestones towards the Decade of Action for Road Safety - (continued) Figure 9: Activities to influence road user behaviour Print media Electronic media Roadside education campaigns School visits Corporate presentations Kgotla presentations MEDIA CAMPAIGNS ROAD SAFETY AWARENESS CAMPAIGNS Drama Scholar patrols Interactive traffic safety games COMMUNITY ROAD SAFETY PROJECTS OCCUPATIONAL ROAD RISK Ergonomics Fleet management Incorporation of road safety in HSE policies 8.3 PILLAR : IMPROVING POST-CRASH CARE Formal agreements have been developed with Emergency Medical Service providers to enhance post-crash response and care. The Fund has bought five fully equipped ambulances for the Ministry of Health, to complement private EMS providers. The Fund has also trained personnel in Botswana s referal hospitals in basic, intermediate and advanced life support programmes. It has also provided equipment for private rehabilitation centres. Figure : Action taken by MVA Fund to improve post-crash care CONTRACT WITH EMERGENCY MEDICAL SERVICES PROVIDERS TRAINING OF PERSONNEL IN MAJOR REFERAL HOSPITALS BASIC, INTERMEDIATE AND ADVANCED LIFE SUPPORT CAPACITY BUILDING REHABILITATION CENTRES LOAN EQUIPMENT TO REHABILITATION CENTRES FIVE AMBULANCES DONATED TO THE MINISTRY OF HEALTH 34
37 PLAY YOUR PART TOGETHER WE CAN SAVE LIVES SECTION 9 Investment in road safety improvement and trauma prevention The Fund will continue investing in road safety initiatives and activities in the next financial year. In the Fund will continue with most of the current road safety initiatives, such as the Occupational Road Risk Programme and the Community Road Safety Grant Scheme. The Fund will partner with other key stakeholders on its mission to improve the road safety status of the country. Figure Road safety investment MILLION PULA TOWARDS A SAFE SYSTEM APPROACH It is imperative that those involved in road safety in Botswana, regardless of their level of road safety performance, move to what is known as the Safe System approach. This approach builds on existing road safety interventions but reframes the way in which road safety is viewed and managed in the community. It addresses all elements of the road transport system in an integrated way, with the aim of ensuring that crash impact levels are below what would cause fatal or serious injury. It requires acceptance of shared overall responsibility and accountability between system designers and road users. It stimulates the development of the innovative interventions and new partnerships necessary to achieve ambitious long-term targets. Driving at night on the open road is particularly dangerous with the dazzle of oncoming lights adding to the fatal factors of driver fatigue on long journeys and animals on the road. 3
38 MOTOR VEHICLE ACCIDENT FUND Road Crash and Claims Annual Report SECTION Conclusion Current road safety interventions can only be effective if they are implemented with a high degree of intensity. Effective implementation takes on board management processes that include analysing data to identify key problems areas. This report shows that speeding, drinking and driving, road condition, loss of vehicle control, and disregard for traffic laws contributed immensely to road crashes. Key measures to address these risks are: SPEED MANAGEMENT Enforcement of speed limits can provide immediate safety benefits perhaps more quickly than any other single safety measure. Effective speed management also requires that speed limits are appropriate for the standard of the road, the roadside risks, road design, traffic volumes and mix and presence of vulnerable people. Public support for reduced speed limits must be fostered, as there is generally little understanding that even a small drop in speed can produce a substantial reduction in road trauma DRINKING AND DRIVING Best practice points to highly visible enforcement using random breath testing as key to enforcing blood alcohol limits. Enforcement should be backed by extensive publicity for it to be effective. SAFER ROADS AND ROADSIDES At least in the short term, appropriate measures should include targeted road improvements that identify and treat the highest crash locations, clearing roadside vegetation and the construction of passing lanes. With these key measures in mind, the adoption of the Safe System approach to road safety is highly recommended. This system views road transport holistically, by seeking to manage the interaction between road users, roads and roadsides, travel speeds and vehicles. It aims to reduce the likelihood that crashes will occur, and to minimise the severity of those that do happen. Central to the Safe System approach is the recognition that humans make mistakes, and are fragile. 36
39 ROAD SAFETY COMPENSATION REHABILITATION SUPPORT ANNEXURE Figure Vehicles registered by station Kang Gumare 9 Bobonong Sowa Tsabong Tutume Jwaneng Kanye Letlhakane Molepolole Mochudi Ramotswa Kasane Ghanzi Mahalapye 384 Serowe Palapye Maun F/town Gold Valley Selebi-Phikwe Road Transport HQ Francistown 33 Lobatse Mogoditshane 3 4 Gaborone VTC 3 98 Water Affairs Fairgrounds Table Vehicles registered by Department of Road Transport and Safety offices Station Total Bobonong Fairgrounds F town Gold Valley Francistown Gaborone HQ Gaborone VTS Water Affairs Ghanzi Gumare Jwaneng Kang Kanye Kasane Letlhakane Lobatse Mahalapye
40 MOTOR VEHICLE ACCIDENT FUND Road Crash and Claims Annual Report ANNEXURE (Continued) Table Vehicles registered by Department of Road Transport and Safety offices Station Total Maun Mochudi Mogoditshane Molepolole Palapye Ramotswa Serowe Sowa Selebi-Phikwe Tsabong Tutume Masunga 4 4 Total CLAIMANTS BY VILLAGES Figure Gaborone region claimants by villages Gaborone 66 Mogoditshane 4 3 Thamaga 36 3 Tlokweng 8 8 Gabane 4 Mmankgodi 7 Kopong 4 Kumakwane 7 8 Oodi 7 Mmopane Metsimotlhabe 3 Modipane 4 Manyana 9 Figure 3 Francistown region claimants by villages Francistown Tonota Mathangwane Shashe Tati Siding Ramokgwebana Sebina Tshesebe Zwenshambe Chadibe 3 4 Marapong Tsamaya Makaleng Siviya Borolong Mapoka Marobela Mukubilo Mmandunhyane 38
41 BEST CHANCE TO NORMAL LIFE Figure 4 Molepolole region claimants by villages Molepolole Letlhakeng Thebephatshwa 4 Letsweletau 7 Motokwe Sojwa 3 Khudumelapye Botlhapatlou Ditshegwane Dutlwe Kaudwane Medie Figure Kanye region claimants by villages Kanye Motshupa Jwaneng Lotlhakane Ranaka Kgomokasitwa Figure 6 Maun region claimants by villages Maun Gumare Shakawe Sehithwa Gweta 6 Mahotshwane 9 Mmathethe 9 Sepopa 3 Etsha 6 Seronga Kareng Phuduhudu Tsau 39
42 MOTOR VEHICLE ACCIDENT FUND Road Crash and Claims Annual Report ANNEXURE (Continued) Figure 7 Selebi-Phikwe region claimants by villages Selebi-Phikwe Bobonong 9 Mmadinare Serule Tsetsebjwe 3 Robelela 3 Sefhophe Molalatau Mathathane Kobojango Lentswelemoriti Moletemane Semolale Sese Tobane Figure 8 Lobatse region claimants by villages Lobatse 4 7 Goodhope 9 3 Pitsane 6 Digawana Mmathethe 4 Mabule 4 Otse 3 Sedibeng Magotlhwane Metlobo Dinatshana Hebron Mogobane Molapowabojang Ntlhantlhe Pitsane Molopo Metlojane 3 Figure 9 Mochudi region claimants by villages Mochudi 9 4 Bokaa Sikwane 6 Mmathubudukwane Malotwane 3 Artesia Matebeleng Morwa Pilane Rasesa
43 3 PLAY YOUR PART TOGETHER WE CAN SAVE LIVES Figure Serowe region claimants by villages Serowe 7 Moiyabana Mmashoro 3 Dimajwe Mabeleapudi 6 Mogorosi Paje 6 Thabala 9 Figure Palapye region claimants by villages Palapye Sefhare Pilikwe Lerala 4 4 Lecheng Maokatumo Maunatlala 7 6 Ramokgonami Moremi Tumasera Mogapi Sherwood Majwaneng Mogopinyana Ratholo Mhalapitsa Moeng Mokobeng 3 Tamasane Figure Mahalapye region claimants by villages Mahalapye 9 Shoshong Radisele 7 Dibete 6 Machaneng Mookane Kudumatse Kalamare Mmaphashalala Makwate Mmutlane 4
44 MOTOR VEHICLE ACCIDENT FUND Road Crash and Claims Annual Report ANNEXURE (Continued) Figure 3 Tutume region claimants by villages Mashunga Tutume Nata 9 Maitengwe Nswazwi Dukwi Hobona Nkange Nshakashongwe Sowa Town Gambule Kutamogore Mosetse Nlaphkwane Figure 4 Ramotswa region claimants by villages Ramotswa Mogobane Zwenshambe Makaleng Marobela 9 Figure Tsabong region claimants by villages Tsabong Kang Hukuntsi Mabutsane Tshane Middlepits Inalegolo Werda Bokspits 3 8 Hereford Khakhea Khawa Kokong Lehututu Lekgwabe Makopong Sekoma Bogogobo 9 4
45 ROAD SAFETY COMPENSATION REHABILITATION SUPPORT Figure 6 Letlhakane region claimants by villages Letlhakane Orapa Rakops Mopipi Figure 7 Ghanzi region claimants by villages Ghanzi 9 Figure 8 Kasane region claimants by villages Kasane 9 Satau Kachikau Matshumo Mosu Toromoja Xhumo Khumaga Charles Hill Ncojane Karakubis East Hanahai Kalkfontein Kole Pandamatenga 43
46 MOTOR VEHICLE ACCIDENT FUND Road Crash and Claims Annual Report ANNEXURE (Continued) FOREIGN CLAIMANTS BY COUNTRY OF ORIGIN Figure 9 Foreign claimants by country of origin Zimbabwe South Africa Namibia Giyani USA Zambia UK Finland
47 BEST CHANCE TO NORMAL LIFE Table Crash severity by police district and police station 9- Fatalities Serious Minor District Station KUTLWANO Kutlwano Tatitown Matsiloje Tonota Sub total SEROWE Machaneng Mahalapye Martindsrift Palapye Serowe Shoshong Maunatlala Sub total GABORONE Broadhurst Central Borakanelo Tlokweng Sub total LOBATSE Lobatse Ramatlabama Woodhall Goodhope Sub total MAUN Gweta Maun Sehitwa Seronga 6 Shakawe Gumare Sub total GHANZI Gantsi Kalkfontein Charleshill Nojane Sub total
48 MOTOR VEHICLE ACCIDENT FUND Road Crash and Claims Annual Report ANNEXURE (Continued) Table Crash severity by police district and police station 9- (Continued) Fatalities Serious Minor District Station KASANE Kasane Kachikau 3 3 Pandamatenga Sub total LETLHAKANE Dukwi Letlhakane Nata Orapa Rakops Sua Pan Sub total TSABONG Bokspits 8 9 Kang Tsabong Tshane Werda 4 36 Middlepits Sub total SELEBI-PHIKWE Bainsdrift Bobonong Botshabelo S/Phikwe Semolale Serule Sub total MOLEPOLOLE Letlhakeng Molepolole Thamaga Takatokwane 8 8 Sojwe 4 Sub total MOCHUDI Dibete Mochudi Olifants 7 Sikwane Sub total
49 PLAY YOUR PART TOGETHER WE CAN SAVE LIVES Table Crash severity by police district and police station 9- (Continued) Fatalities Serious Minor District Station GABORONE WEST Gaborone West Naledi Ramotswa SSK Airport Mogoditshane Sub total KANYE Sejelo Jwaneng Moshupa P/ Molopo Mabutsane Kanye Sub total FRANCISTOWN Francistown Tshesebe Tutume Masunga Sub total TOTAL Police districts and stations FRANCISTOWN KUTLWANO SEROWE GABORONE MOCHUDI GABORONE WEST LETLHAKANE TSABONG SELEBI-PHIKWE LOBATSE MOLEPOLOLE MAUN GHANZI KASANE KANYE Francistown, Tshesebe, Tutume, Masunga Kutlwano, Tatitown, Matsiloje, Tonota Mahalapye, Palapye, Serowe, Machaneng, Martinsdrift, Shoshong, Maunatlala Broadhurst, Tlokweng, Central, Borakanelo Mochudi, Dibete, Sikwane, Olifants Mogoditshane, Gaborone West, Ramotswa, Naledi, Sir Seretse Khama Airport Dukwi, Letlhakane, Nata, Orapa, Rakops, Sua Pan Bokspits, Kang, Mabutsane, Tsabong, Tshane, Werda Bainesdrift, Bobonong, Botshabelo, Selebi-Phikwe, Semolale, Mmadinare Goodhope, Lobatse, Ramotswa, Woodhall Letlhakeng, Molepolole, Thamaga Gweta, Maun, Sehithwa, Seronga, Shakawe, Gumare Gantsi, Kalkfontein, Mamuno, Ncojane Kasane, Kavimba, Kazungula, Pandamatenga, Kasane Kanye, Jwaneng, Moshupa, Phitshane, Molopo 47
50 MOTOR VEHICLE ACCIDENT FUND Road Crash and Claims Annual Report ANNEXURE (Continued) Table 3 Possible causes of crashes Category Causes NumberDR DRIVER Following too closely 86 Reversing negligently 63 Losing control 4 Failing to comply with traffic sign or signal 7 Unlicensed driver 9 Under influence of alcohol or drugs 49 Overtaking improperly 43 Speeding 384 Turning without care 97 U- turning 3 Fatigued or asleep 83 Swerving carelessly 3 Cyclist error 3 Dazzled by oncoming lights Overloading 9 Stopping suddenly 7 Negligence of public service vehicle driver 7 Pulling off the road without care 6 Opening vehicle door negligently 3 Hampered by passenger, animal or luggage in the vehicle Other driver negligence 7 6 PEDESTRIAN Crossing without care 37 Under influence of alcohol or drugs 49 Walking or standing on the road 9 Playing on the road 7 Slipping or falling when crossing the road 3 Sudden illness Holding on to a vehicle Other pedestrian negligence 4 PASSENGER Falling from a vehicle Boarding or alighting without care Under influence of alcohol or drugs 3 Stealing a ride Other passenger negligence ANIMALS Cattle on road 883 Dog on road 67 Animal in the vehicle 6 Other animal on the road 39 OBSTRUCTIONS Stationary vehicle dangerously placed 3 Collision with vehicle already involved in an accident 4 Other obstructions 67 DEFECTS Tyre burst Defective unattended vehicle running away Physical defects 8 Other defects 49 ROAD CONDITION Road surface type 8 Potholes 8 WEATHER Heavy rain 3 Strong wind 6 Other weather factors CELL PHONE Use of cell phone while driving 7 TOTAL
51 ROAD SAFETY COMPENSATION REHABILITATION SUPPORT Count us in! say the staff of Motor Vehicle Accident Fund, who are taking up the challenges of making their contribution to the vital goals of the global Decade of Action for Road Safety -.
52 PLAY YOUR PART TOGETHER WE CAN SAVE LIVES MVA Fund joins the worldwide ranks of the Decade of Action for Road Safety - wholeheartedly. We are committed to making a significant contribution together with our stakeholders and partners in the public and private sectors in this great task, the success of which is so critical for the future of our country. We will not flinch from our duty to help make our roads safer, and we urge individuals, organisations and communities to come together in this vital service to the nation. CROSS KGOSIDIILE Chief Executive Officer
2011 Population & Housing Census
 2011 Population & Housing Census Preliminary Results Brief For further details contact Census Office, Private Bag 0024 Gaborone: Tel 3188500; Fax 3188610 1. Botswana Population at 2 Million Botswana s
Road Safety Authority Provisional Review of Road Crashes 2013
 A review of 2013 fatal collision statistics December 31 st 2013 The following report summarises the main trends that have emerged in 2013. This has been prepared by the Road Safety Authority following
Title. Pedal cyclist casualties, 2013
 Title SB 57/2014 2 July 2014 Pedal cyclist casualties, 2013 This Statistical Bulletin looks at pedal cyclist road traffic casualties in Wales. It looks both at all pedal cyclist casualties and at child
STATISTICS OF FATAL AND INJURY ROAD ACCIDENTS IN LITHUANIA,
 Vilnius 215 STATISTICS OF FATAL AND INJURY ROAD ACCIDENTS IN LITHUANIA, 211 214 TABLE OF CONTENTS INTRODUCTION... 9 GENERAL INFORMATION... 1 1. VEHICLE FLEET... 11 1.1. Number of vehicles, 1995 214...
Reported road accidents involving young car drivers: Great Britain 2011
 Reported road accidents involving young car drivers: Great Britain 211 Road Accident Statistics Factsheet No. 1 August 212 Introduction This factsheet presents summary information relating to the casualties
The characteristics of fatal road accidents during the end of year festive period
 The characteristics of fatal road accidents during the end of year festive period 1994-2003 March 2004 Traffic Management and Road Safety Unit Ministry of Public Infrastructure, Land Transport and Shipping
1. The consultation seeks views on the vision, targets and measures for improving road safety in Great Britain for the period beyond 2010.
 Executive Summary 1. The consultation seeks views on the vision, targets and measures for improving road safety in Great Britain for the period beyond 2010. 2. We have made good progress in reducing road
Oxfordshire Local Transport Plan 2011-2030 Revised April 2012. Objective 3 Reduce casualties and the dangers associated with travel
 6. Road Safety Objective 3 Reduce casualties and the dangers associated with travel Road safety continues to be a core priority both nationally and locally reflecting the very high human and other costs
Welsh Fire and Rescue Services Road Safety Strategy 2015-2020
 All Wales Call Challenge Welsh Fire and Rescue Services Road Safety Strategy 2015-2020 GWASANAETH TÂN AC ACHUB Canolbarth a Gorllewin Cymru Mid and West Wales FIRE AND RESCUE SERVICE 2 Contents Executive
East Ayrshire Council Road Safety Plan
 East Ayrshire Council Road Safety Plan Foreword Road crashes are not inevitable - the deaths and injuries which occur each year need not happen. However, in order to reduce these incidents a major effort
Characteristics of High Injury Severity Crashes on 80 110 km/h Rural Roads in South Australia
 Characteristics of High Injury Crashes on 80 110 km/h Rural Roads in South Australia, J. R. R. Centre for Automotive Safety Research, University of Adelaide, SOUTH AUSTRALIA, 5005 email: [email protected]
Speeding. Probability of death at different impact speeds
 Speeding CRASH FACTSHEET 2012 CRASH STATISTICS FOR THE YEAR ENDED 31 DECEMBER 2011 Prepared by the Ministry of Transport In this fact sheet speeding is defined as driving too fast for the conditions. The
Community Motor Vehicle Collision Priority Setting Toolkit Part One
 Community Motor Vehicle Collision Priority Setting Toolkit Part One Table of Contents Introduction! 3 How to use this resource! 3 The Issue of Injury! 4 General information! 4 Motor Vehicle Collisions!
Executive Summary ABI.ORG.UK. Association of British Insurers 51 Gresham Street London EC2V 7HQ Telephone 020 7600 3333
 Association of British Insurers response to the Northern Ireland Assembly Environment Committee s Consultation on The Road Traffic (Amendment Bill) About the ABI 1.1 The Association of British Insurers
Pedestrian and Bicycle Crash Data Analysis: 2005-2010
 MICHIGAN DEPARTMENT OF TRANSPORTATION Pedestrian and Bicycle Crash Data Analysis: 2005-2010 FINAL REPORT Prepared by: T.Y. Lin International and Western Michigan University 4/3/2012 TABLE OF CONTENTS List
Legislation and Enforcement
 Legislation and Enforcement Legislation and Enforcement INTRODUCTION 6.1 To cultivate a considerate and responsible driving culture, enforcement and public education have to go hand-in-hand. Apart from
Code of Conduct for Commercial Drivers
 Code of Conduct for Commercial Drivers RoadDriver 2011 Safe Use of Vehicles Watch your Speed Drive within the speed limit at all times. You should drive at speeds that are safe for the conditions, recognising
Global Plan. Decade of Action for Road Safety 2011 2020
 Global Plan for the Decade of Action for Road Safety 2011 2020 1 I call on Member States, international agencies, civil society organizations, businesses and community leaders to ensure that the Decade
National Directory of HIV AND AIDS STAKEHOLDERS in BOTSWANA
 National Directory of HIV AND AIDS STAKEHOLDERS in BOTSWANA April 2008 MISSION To lead and coordinate the national multisectoral response to the HIV and AIDS Epidemic. VISION NACA will be the leader in
Road fatalities in 2012
 Cambodia Source: IRTAD, National Road Safety Committee Inhabitants Vehicles/1 000 inhabitants Road fatalities in 2012 Fatalities /100 000 inhabitants in 2012 14.7 million 148 1 966 13.4 Cambodia joined
SAFETY PROCESS. Martin Small
 SAFETY PROCESS Martin Small With a broad transport policy background including extensive work in the maritime sector, Martin Small has been working in road safety for five years, in a variety of roles
Overview of Road Safety in Africa & AfDB ssupport. Girma Berhanu BEZABEH (Dr.-Ing.) Transport Engineer African Development Bank
 Transport Engineer African Development Bank") Overview of Road Safety in Africa & AfDB ssupport Girma Berhanu BEZABEH (Dr.-Ing.) Transport Engineer African Development Bank I. Road Safety in Africa II. Progresses & Challenges III. AfDB s Road Safety
Overview of Road Safety in Africa & AfDB ssupport Girma Berhanu BEZABEH (Dr.-Ing.) Transport Engineer African Development Bank I. Road Safety in Africa II. Progresses & Challenges III. AfDB s Road Safety
the Ministry of Transport is attributed as the source of the material
 Disclaimer All reasonable endeavours are made to ensure the accuracy of the information in this report. However, the information is provided without warranties of any kind including accuracy, completeness,
STOP ROAD CARNAGE NOW!
 THE INSTITUTION OF ENGINEERS OF IRELAND STOP ROAD CARNAGE NOW! SUBMISSION TO MR SEAMUS BRENNAN TD MINISTER FOR TRANSPORT December 2002 STOP ROAD CARNAGE NOW IEI SUBMISSION ON ROAD SAFETY PG. 01 1. STOP
Sesigo Project Report on the First Annual Impact Assessment Study 2010
 Sesigo Project Report on the First Annual Impact Assessment Study 2010 March 2011 Authors: Dr Rebecca Nthogo Lekoko Mr Kgosinkwe Moesi Mr Charles Okori Mr Joseph Mukasa How to cite this report Lekoko,
the Ministry of Transport is attributed as the source of the material
 Disclaimer All reasonable endeavours are made to ensure the accuracy of the information in this report. However, the information is provided without warranties of any kind including accuracy, completeness,
MOTORBIKE RIDERS AND CYCLISTS
 HSRC MOTORBIKE RIDERS AND CYCLISTS 113 8 MOTORBIKE RIDERS AND CYCLISTS 8.1 INTRODUCTION Motorbike and bicycle riders constitute only a small portion of road accident victims. In the RAF system only 1%
Deaths/injuries in motor vehicle crashes per million hours spent travelling, July 2008 June 2012 (All ages) Mode of travel
 Mode of travel") Cyclists CRASH STATISTICS FOR THE YEAR ENDED 31 DECEMBER 212 Prepared by the Ministry of Transport CRASH FACTSHEET November 213 Cyclists have a number of risk factors that do not affect car drivers. The
Cyclists CRASH STATISTICS FOR THE YEAR ENDED 31 DECEMBER 212 Prepared by the Ministry of Transport CRASH FACTSHEET November 213 Cyclists have a number of risk factors that do not affect car drivers. The
A Review of Serious Casualty Motorcycle Crashes in Tasmania
 A Review of Serious Casualty Motorcycle Crashes in Tasmania D epart ment of Infrastructure, Energy and Resources A Review of Serious Casualty Motorcycle Crashes in Tasmania Traffic and Infrastructure Branch
for Taxi Drivers Mr. Sibusiso Ndebele, MP Minister of Transport 28 th May 2012 Johannesburg
 Address at the media Launch of the First Aid Programme for Taxi Drivers By Mr. Sibusiso Ndebele, MP Minister of Transport 28 th May 2012 Johannesburg Programme Director: Mr. Thabo Matime Netcare 911: Managing
Relative risk of fatal crash by blood alcohol level. 0 10 20 30 40 50 60 70 80 90 100 110 120 130 140 150 BAC (mg/100ml)
") Alcohol/drugs CRASH FACTSHEET November 2013 CRASH STATISTICS FOR THE YEAR ENDED 31 DECEMBER 2012 Prepared by the Ministry of Transport In 2012 driver alcohol/drugs were a contributing factor 1 in 82 fatal
Alcohol/drugs CRASH FACTSHEET November 2013 CRASH STATISTICS FOR THE YEAR ENDED 31 DECEMBER 2012 Prepared by the Ministry of Transport In 2012 driver alcohol/drugs were a contributing factor 1 in 82 fatal
How To Understand The Safety Of A Motorcycle
 Disclaimer All reasonable endeavours are made to ensure the accuracy of the information in this report. However, the information is provided without warranties of any kind including accuracy, completeness,
Motor Vehicle Collisions in Eastern Ontario. Supplement to the Eastern Ontario Health Unit Injury Report
 Motor Vehicle Collisions in Eastern Ontario Supplement to the Eastern Ontario Health Unit Injury Report September 8, 2009 For more information: Eastern Ontario Health Unit www.eohu.ca Bureau de santé de
The facts about road accidents and children
 A The AA Motoring Trust The facts about road accidents and children Around 5, children under the age of 16 die or are seriously injured on Britain s roads each year Nearly two in three road accidents happen
Children and road safety: a guide for parents
 Child Safety Week Report Children and road safety: a guide for parents What are the facts? The number of children aged up to 19 years who are killed or seriously injured each year on Britain's roads has
AHIS Road safety project Student Council THINK!
 AHIS Road safety project Student Council 2013 THINK! Today, we drive safer cars on safer roads; decades of advertisements and public information campaigns have made most of us safer drivers. Improvements
For further information contact: Alberta Transportation Office of Traffic Safety Main Floor, Twin Atria Building 4999 98 Avenue Edmonton, Alberta T6B
 Alberta Traffic Collision Statistics 2013 Alberta Traffic Collision Statistics 2013 For further information contact: Alberta Transportation Office of Traffic Safety Main Floor, Twin Atria Building 4999
How To Know If A Motorcyclist Is Safe
 Motorcyclists CRASH FACTSHEET November 2013 CRASH STATISTICS FOR THE YEAR ENDED 31 DECEMBER 2012 Prepared by the Ministry of Transport In 2012, 50 motorcyclists 1 died and a further 1,138 were injured
the Ministry of Transport is attributed as the source of the material
 Disclaimer All reasonable endeavours are made to ensure the accuracy of the information in this report. However, the information is provided without warranties of any kind including accuracy, completeness,
ITARDAInstitute for Traffic Accident
 972 972 972 972 972 972 972 972 ITARDAInstitute for Traffic Accident Research and Data Analysis ( 財 ) 交 通 事 故 総 合 分 析 センター ITARDA INFORMATION No. 211 9SEPTEMBER 1, 2, 3, 4, 5, 1 1 1km/h or less 1,42 2
Accident configurations and injuries for bicyclists based on the German In-Depth Accident Study. Chiara Orsi
 Accident configurations and injuries for bicyclists based on the German In-Depth Accident Study Chiara Orsi Centre of Study and Research on Road Safety University of Pavia State of the art Vulnerable road
NATIONAL ROAD SAFETY ACTION PLAN 2015 2017
 NATIONAL ROAD SAFETY ACTION PLAN 2015 2017 The Action Plan outlined in this document is intended to support the implementation of the National Road Safety Strategy 2011 2020 (NRSS). It addresses key road
Traffic Accidents Trends and Characteristics in Jordan
 International Journal of Civil & Environmental Engineering IJCEE-IJENS Vol:13 No:5 9 Traffic Accidents Trends and Characteristics in Jordan Bashar AL-Omari 1, Khalid Ghuzlan 2*, Hala Hasan 3 1 Associate
For further information contact: Alberta Transportation Office of Traffic Safety Main Floor, Twin Atria Building 4999 98 Avenue Edmonton, Alberta T6B
 Alberta Traffic Collision Statistics 2012 Alberta Traffic Collision Statistics 2012 For further information contact: Alberta Transportation Office of Traffic Safety Main Floor, Twin Atria Building 4999
Traffic accidents in Hanoi: data collection and analysis
 Traffic accidents in Hanoi: data collection and analysis Nguyen Hoang Hai Vietnam, Hanoi Department of Transport, [email protected] 1. Introduction Hanoi, the capital and administrative center of Vietnam,
ALCOHOL AND DRUGS IN ROAD CRASHES IN SOUTH AUSTRALIA
 Relative Risk FACT SHEET ALCOHOL AND DRUGS IN ROAD CRASHES IN SOUTH AUSTRALIA August 2014 Alcohol remains the most important drug in terms of its contribution to crash involvement. Alcohol impairs skill
Child Road Safety Audit for South Gloucestershire 2009-2011
 Child Road Safety Audit for South Gloucestershire 9 - August 9 Contents Page Foreword Executive Summary. Introduction. Review of the Action Plan. Summary of Casualty Statistics 9. Child Casualty Trends.
Differences between CTP Insurance Statistics and Crash Statistics
 Differences between CTP Insurance Statistics and Crash Statistics Ross McColl 1 (Presenter) 1 representing the Motor Accident Commission Biography Mr McColl has worked in the road safety field for over
FMCSA Webinar Nov.18th to Examine Large Truck Crash Fatalities Involving Pedestrians & Bicyclists. New Technology for Better Fleet Management
 In This Issue: FMCSA Webinar Nov.18th to Examine Large Truck Crash Fatalities Involving Pedestrians & Bicyclists Help Prevent Roadway Accidents involving Pedestrians How to Steer Clear of Accidents with
Drinking and Driving: Global Status
 Drinking and Driving: Global Status Ward Vanlaar, Ph.D. Vice President Research Traffic Injury Research Foundation Bogotá, Colombia November 19th, 2013 1 One million dollar question How is Colombia doing
Young drivers where and when are they unsafe: analysis of road accidents in Great Britain 2000 2006
 Young drivers where and when are they unsafe: analysis of road accidents in Great Britain 2000 2006 Original research by Email: [email protected] August 2008 Copyright the IAM Motoring Trust Extracts
Drink driving European Commission Guidelines
 Drink driving European Commission Guidelines Roberto FERRAVANTE Rome, 3 April 2014 Deputy Head of the Road Safety Unit Directorate-General for Mobility and European Commission Road fatalities in EU-28
INCREASING MOTORCYCLE HELMET USE
 INCREASING MOTORCYCLE HELMET USE Head injuries among motorcyclists are a growing concern Rapid growth in the use of motorized twowheeled vehicles in many countries has been accompanied by increases in
CAMPAIGN ASSETS THINK CYCLIST STAKEHOLDER TOOLKIT
 STAKEHOLDER TOOLKIT INTRODUCTION The Department for Transport s campaign provides road safety information for road users. Our aim is to encourage safer behaviour to reduce the number of people killed and
Risk Management Guidelines
 Driving - Drugs & Alcohol The Problem Drug Driving Around 18% of people killed in road crashes have traces of illegal drugs in their blood, with cannabis being the most common. Although the risks of drug
Regional Road Safety Strategy September 2004
 Regional Road Safety Strategy September 2004 Regional Road Safety Strategy September 2004 Cover photo courtesy of St Mark s Church School Executive Summary The vision of the Regional Road Safety Strategy
The Role of public libraries in the attainment of Botswana s vision 2016
 Submitted on: August 8, 2013 The Role of public libraries in the attainment of Botswana s vision 2016 Kgomotso Radijeng Botswana National Productivity Centre, Gaborone, Botswana E-mail address: [email protected]
Strategic targets board as a management tool for Spanish road safety
 Road safety data: collection and analysis for target setting and monitoring performances and progress Strategic targets board as a management tool for Spanish road safety Pilar Zori Bertolin Spain Spanish
Road Accidents in Namibia
 Road Accidents in Namibia Statistical Report 2009 Pedestrians Passengers Drivers Fatalities Launch of Pedestrian Crossing at Kandjengedi, Oshakati Data analysed 2012 Report published: 2013 FOREWORD IT
CAMPAIGN ASSETS THINK CYCLIST STAKEHOLDER TOOLKIT
 STAKEHOLDER TOOLKIT INTRODUCTION The Department for Transport s campaign provides road safety information for road users. Our aim is to encourage safer behaviour to reduce the number of people killed and
CHAPTER 1 Land Transport
 Section 1 Road Transport - PART I - Summary of the Present Situation 1 Road Traffic Accident Trends 1-1 Long-term trends fell to below 6,000 for the first time in 54 years since 1953 Number of road traffic
STAFFORDSHIRE COUNTY COUNCIL ROAD CASUALTY REVIEW
 223/9/213 STAFFORDSHIRE COUNTY COUNCIL ROAD CASUALTY REVIEW 212 STAFFORDSHIRE COUNTY COUNCIL ROAD CASUALTY REVIEW 212 Contents 1. Accident and Casualty Statistics 2. Introduction 3. Long Term Progress/Casualty
SAFE Streets for CHICAGO
 Overview Each day, hundreds of thousands of Chicagoans walk or drive in the city. Ensuring their safety is the City s top priority. Over the past several years, Chicago has developed many successful strategies
ITARDAInstitute for Traffic Accident
 ITARDAInstitute for Traffic Accident Research and Data Analysis ( 財 ) 交 通 事 故 総 合 分 析 センター ITARDA INFORMATION No. 2011 88APRIL Fatality rate (%) 0 2 4 6 Head-on 0.70% Rear-end 4.7% Rear-end 0.70% Crossing
Reported Road Casualties Great Britain: 2012. Annual Report
 Reported Road Casualties Great Britain: 2012 Annual Report DEPARTMENT FOR TRANSPORT SCOTTISH GOVERNMENT WELSH ASSEMBLY GOVERNMENT REPORTED ROAD CASUALTIES GREAT BRITAIN 2012 Published : September 2013
Legislative Council Panel on Transport. Cycling Safety and Use of Safety Equipment for Cyclists
 LC Paper No. CB(1)1130/10-11(05) For Discussion 28 January 2011 Legislative Council Panel on Transport Cycling Safety and Use of Safety Equipment for Cyclists Purpose This paper briefs members on Government
ALCOHOL, 2013 HIGHLIGHTS
 ALCOHOL, 2013 JUNE 2014 ISSUE 14-C08 HIGHLIGHTS During 2013, there were 114 fatal alcohol-impaired collisions in the state (16 percent of all fatal collisions). Alcohol-impaired fatal collisions decreased
Traffic Collision Statistics Report
 Traffic Collision Statistics Report 2012 EXECUTIVE SUMMARY Executive Summary 2012 Traffic Collision Statistics Report Executive Summary Motor vehicle collisions resulting in a fatality, injury or property
Traffic Accident Trends in Hong Kong
 Traffic Accident Trends in Hong Kong Traffic Accident Trends in Hong Kong INTRODUCTION 4.1 With a total area of 1 102 km 2, Hong Kong has a population of 6.8 million and 522 912 licensed vehicles as at
GEICO produced DVD REAL TEEN DRIVING. 4 real teens in real driving situations in-car cameras no scripts it s all very, very real
 GEICO is: proud to be the nation s fastest growing auto insurer proud to serve more than 10 million policyholders proud to help spread the message on safe driving to new drivers and their families GEICO
road safety issues 2001 road toll for the WBOP/Tauranga Police area JULY 2002 Regional crash causes 1997 2001 Major road safety issues:
 WESTERN BAY OF PLENTY/TAURANGA POLICE AREA road safety issues JULY 22 The Land Transport Safety Authority (LTSA) has prepared this Road Safety Issues Report. It is based on reported crash data and trends
Analysis of Accidents by Older Drivers in Japan
 Analysis of Accidents by Older Drivers in Japan Kazumoto Morita 1, Michiaki Sekine 1 1 National Traffic Safety and Environment Laboratory, Japan Abstract Since Japan is a rapidly aging society, ensuring
Pedal cyclist collisions and casualties in Greater London
 Transport for London Surface Transport Factsheet Better Routes and Places Directorate Topic Factsheet 211-1 September 211 Pedal cyclist collisions and casualties in Greater London This factsheet looks
ROAD SAFETY GUIDELINES FOR TAH ROAD INFRASTRUCTURE SAFETY MANAGEMENT
 I. GENERAL ROAD SAFETY GUIDELINES FOR TAH ROAD INFRASTRUCTURE SAFETY MANAGEMENT ANNEX III B i. The setting up and implementing of appropriate management procedures is an essential tool for improving the
DOT HS 809 360 October 2001
 U.S. Department of Transportation National Highway Traffic Safety Administration DOT HS 809 360 October 2001 Technical Report This document is available to the public from the National Technical Information
CONTACTS & WORKING HOURS
 MOTOR INSURANCE CONTACTS & WORKING HOURS Head office BNH Tower, Seef District P.O. Box 843, Manama, Kingdom of Bahrain Tel.: 17587444, Fax: 17583477 E-mail: [email protected] Website: www.bnidirect.com
Road fatalities in 2012. Road fatality: person killed in a traffic crash or deceased because of an injury within 30 days after the crash.
 Norway Source: IRTAD, Public Roads Administration Inhabitants Vehicles/1 000 inhabitants Road fatalities in 2012 Fatalities /100 000 inhabitants in 2012 5.0 million 703 145 2.9 1. Road safety data collection
MetLife Auto & Home. Driver Improvement Course Discount
 MetLife Auto & Home Driver Improvement Course Discount We re Ready to Hit the Road to Safety and Savings! Although safer vehicles and highway designs may save lives, even transportation safety engineers
OREGON TRAFFIC ACCIDENT AND INSURANCE REPORT
 DMV OREGON TRAFFIC ACCIDENT AND INSURANCE REPORT Tear this sheet off your report, read and carefully follow the directions. ONLY drivers involved in an accident resulting in any of the following MUST file
SAFER JOURNEYS. DISCUSSION DOCUMENT Have your say on our next road safety strategy AUGUST 2009
 22 SAFER JOURNEYS DISCUSSION DOCUMENT Have your say on our next road safety strategy AUGUST 29 11 Reducing the impact of alcohol/drug impaired driving What is the problem? Alcohol/drug impaired driving
Cycling Safety Action Plan 2014 2016
 Cycling Safety Action Plan 2014 2016 May 2014 CONTENTS 1. OVERVIEW OF CYCLING ROAD TRAUMA IN NSW LOCATION SERIOUS INJURIES WHEN TYPES OF CRASHES WHO HELMET USAGE SUMMARY OF NSW CYCLING ROAD TRAUMA 3 3
Safety-conscious Drivers Prevent Crashes. Defensive Driving: Managing Visibility, Time and Space. Improve Your Defensive Driving Skills
 Defensive Driving: Managing Visibility, Time and Space Motor vehicle travel is the primary means of travel in the United States. With all the benefits that come along with mobility, there are thousands
ATSB RESEARCH AND ANALYSIS REPORT ROAD SAFETY. Characteristics of Fatal Road Crashes During National Holiday Periods
 ATSB RESEARCH AND ANALYSIS REPORT ROAD SAFETY Characteristics of Fatal Road Crashes During National Holiday Periods July 2006 ATSB RESEARCH AND ANALYSIS REPORT ROAD SAFETY Characteristics of Fatal Road
25 February 2005 Our ref Jane Sanders Mobile 0418 407 290 Email [email protected] Doc no Sydney\004804925
 25 February 2005 Our ref Jane Sanders Mobile 0418 407 290 Email [email protected] Doc no Sydney\004804925 Improving Safety for Young Drivers Reply Paid 80764 HAYMARKET NSW 1239 Improving Safety
The spectrum of motorcycle research in Maryland
 The spectrum of motorcycle research in Maryland Cynthia Burch MPH, Timothy Kerns MS National Study Center for Trauma & EMS, University of Maryland School of Medicine Abstract Motorcycle riders experience
New Zealand all-age mandatory bicycle helmet law
 New Zealand all-age mandatory bicycle helmet law A public health and safety disaster New Zealand is one of only three countries in the world with national all-age mandatory bicycle helmet laws, the others
Atlanta, Georgia Road Test
 1. When driving your car Into traffic from a parked position, you should: A. Sound your horn and pull Into the other lane. B. Signal and proceed when safe. C. Signal other traffic and pull directly into
DETERMINATION OF ECONOMIC LOSSES DUE TO ROAD CRASHES IN THAILAND
 DETERMINATION OF ECONOMIC LOSSES DUE TO ROAD CRASHES IN THAILAND Paramet LUATHEP Research Associate Asian Institute of Technology PO Box 4, Klong Luang, Pathumthani 12120 THAILAND Fax: +66-2-524-5509 E-mail: