System Dynamics Modelling using Vensim
|
|
|
- Frederica McLaughlin
- 9 years ago
- Views:
Transcription
1 System Dynamics Modelling using Vensim 3 December 2015 Prof Mikhail Prokopenko

2
3
4 System: structure

5 System: behaviour

6 System: interconnectivity

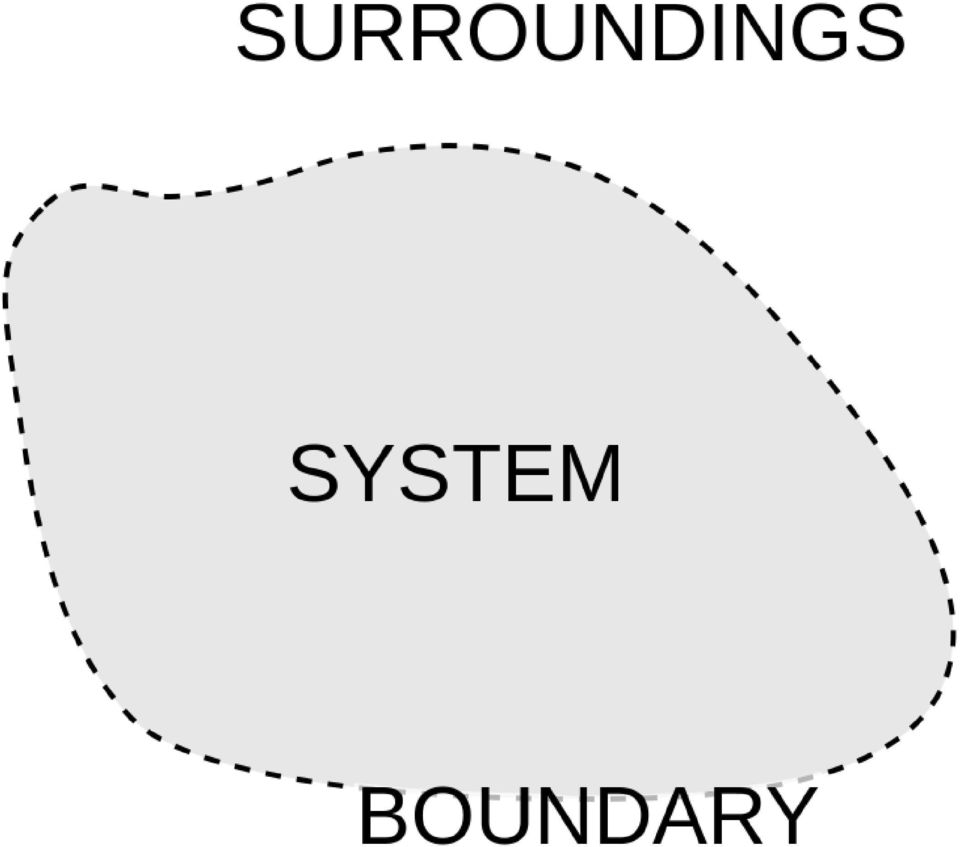
7 System Dynamics Definition An approach to understanding the behaviour of complex systems over time. It deals with internal feedback loops and time delays that affect the behaviour of the entire system. What makes system dynamics different from other approaches to studying complex systems is the use of feedback loops and stocks and flows.

8 Stock and Flow Diagram

9
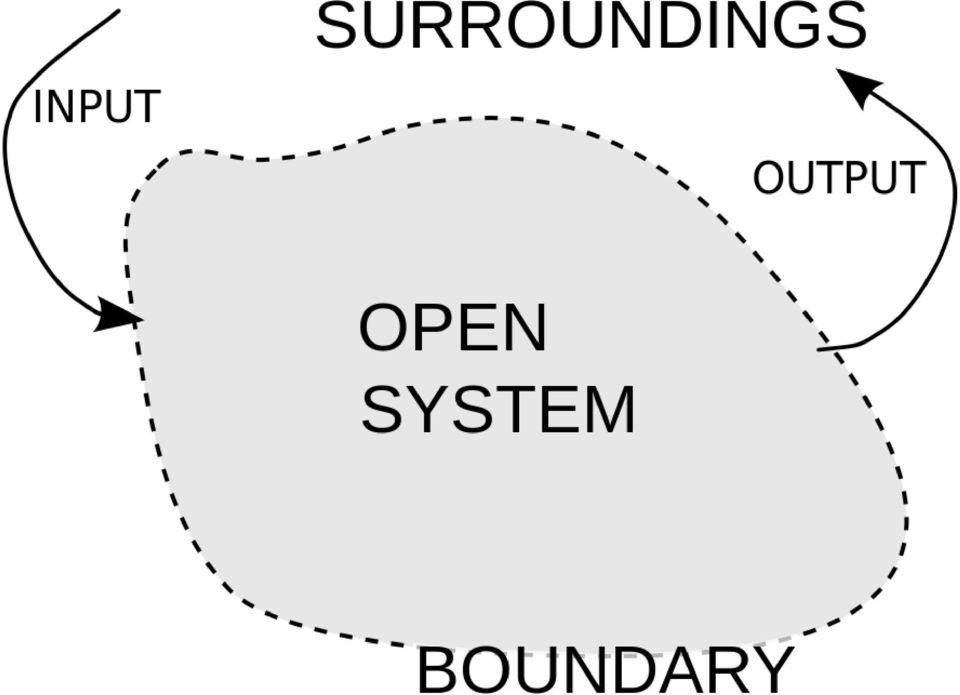
10 Black box diagram

11 Feedback loops

12 Positive Feedback - Exponential growth More begets more Less begets less - The vicious cycle - Snowball rolling down a hill - Bank account interest - Unlimited population growth

13 Negative Feedback - Goal seeking behaviour - Pouring water into a glass - Initial growth leads to an undersupply of resources

14 Dynamics of real systems - Systems often combine feedbacks - Growth and limitation - Populations

15 Questions?

16 Modelling: sensitivity to initial conditions

17 Butterfly effect: sensitivity to initial conditions

18 Core Concepts Simple processes can generate complicated behaviour System dynamics provides unified approach for understanding problems Assists with your own mental models by making dynamic problems explicit Accumulations (Stocks), Change (Flows), Feedback (interactions between the two)
, Change (Flows), Feedback (interactions between")
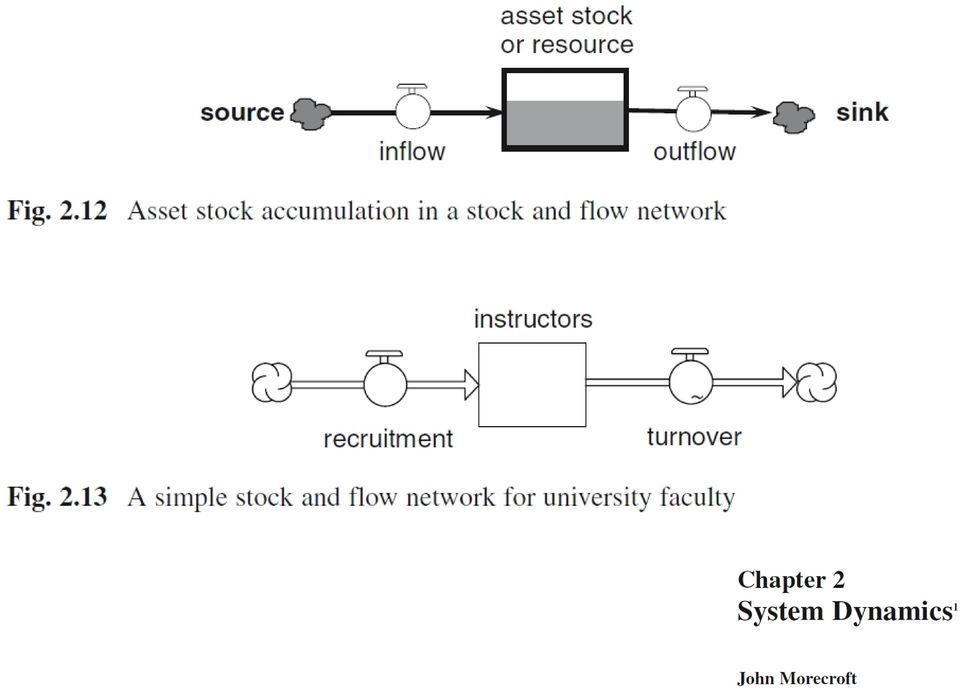
19 How assets build and decay - Accumulation itself changes according to inflow and outflow - inflow > outflow: level rises - outflow > inflow: level sinks - outflow = inflow: no change image:

20 Identifying Stocks and Flows - How can you tell which concepts are stocks and which are flows? - Stocks are quantities of material or other accumulations. They are the states of the system. - The flows are the rates at which these system states change. Imagine a river flowing into a reservoir. The quantity of water in the reservoir is a stock. - If you drew an imaginary line across the point where the river enters the reservoir, the flow is the rate at which water passes the line.

21 Identifying Stocks and Flows - In epidemiology, prevalence measures the number or stock of people who have a particular condition at any given time, while incidence is the rate at which people come down with the disease or condition. - In December 1998 the prevalence of HIV/AIDS worldwide was estimated by the United Nations AIDS program to be 33.4 million and the incidence of HIV infection was estimated to be 5.8 million/year. That is, a total of 33.4 million people were estimated to be HIV-positive or to have AIDS; the rate of addition to this stock was 5.8 million people per year (16,000 new infections per day). - - The net change in the population of HIV-positive individuals was estimated to be 3.3 million people per year due to the death rate from AIDS, estimated to be 2.5 million people per year in 1998.
22 The Snapshot Test - Stocks characterise the state of the system. To identify key stocks in a system, imagine freezing the scene with a snapshot. Stocks would be those things you could count or measure in the picture, including psychological states and other intangible variables. - stock of water in a reservoir from a set of satellite images and topographic data, but cannot determine whether the water level is rising or falling. - bank statement tells you how much money is in your account but not the rate at which you are spending it now. - If time stopped, it would be possible to determine how much inventory a company has or the price of materials but not the net rate of change in inventory or the rate of inflation in materials prices.
23 Units - Units of measure can help distinguish stocks from flows. Stocks are usually a quantity such as widgets of inventory, people employed, or Yen in an account. - The associated flows must be measured in the same units per time period e.g., the rate at which widgets are added per week to inventory, the hiring rate in people per month, or the rate of expenditure from an account in $/hour. - You are free to select any measurement system you like as long as you remain consistent. You can measure the flow of production into inventory as widgets per week, widgets per day, or widgets per hour.
24 Stocks Change Only Through Their Rates - Stocks change only through their rates of flow, no causal link directly into a stock. - A model for customer service: Customers arrive at some rate and accumulate in a queue of Customers Awaiting Service (e.g., a restaurant) - When service is completed customers depart from the queue, decreasing the stock of customers waiting for service. - Rate at which customers can be processed depends on the number of service personnel, their productivity (in customers processed per hour per person), and the number of hours they work (the workweek). - If the number of people waiting for service increases, employees increase their workweek as they stay an extra shift, skip lunch, or cut down on breaks.
25 The only way a stock can change is via its inflows and outflows. In turn, the stocks determine the flows.
26 Stock change only through rates
27 Stock change only through rates
28 Auxiliary Variables - It is often helpful to define intermediate or auxiliary variables. - Auxiliaries consist of functions of stocks (and constants or exogenous inputs). - For example, a population model might represent the net birth rate as depending on population and the fractional birth rate; fractional birth rate in turn can be modelled as a function of food per capita. - Ideally, each equation in your models should represent one main idea. Don t try to economise on the number of equations by writing long ones that embed multiple concepts, they will be hard to understand. - Equations with multiple components and ideas are hard to change if your client disagrees with one of the ideas.
29 System Dynamics (Vensim): vensim.com/download
30 System Dynamics (Vensim): vensim.com/download
31 Break?
32 Vensim first steps - Vensim PLE Quick Reference and Tutorial management/ system-dynamics-self-study- fall-1998-spring-1999/readings/formulating.pdf
33
34
35
36
37
38
39
40 Developing Stock, Flow and Feedback Structure
41
42
43
44
45
46
47
48
49
50
51
52 Questions?
53 Equations
54
55
56
57
58
59
60
61
62
63
64 Using model analysis tools
65
66
67
68
69 Simulating the model
70
71
72
73
74
75
76
77
78
79
80
81
82 Break?
83 Predator prey model
84 Predator prey model
85 Predator prey model
86 Predator prey model rabbit births = Rabbits * birth rate c
87 Predator prey model rabbit birth rate c? rabbit births = Rabbits * birth rate c
88 Predator prey model rabbit birth rate c d Foxes rabbit births = Rabbits * birth rate c rabbit deaths = Rabbits * Foxes * catching rate d
89 Predator prey model rabbit birth rate c d Foxes rabbit births = Rabbits * birth rate c rabbit deaths = Rabbits * Foxes * catching rate d change in Rabbits = rabbit births - rabbit deaths R = c R d R F
90 Predator prey model fox birth rate fox death rate fox births Fox population fox deaths
91 Predator prey model fox birth? rate fox death rate b fox growth Fox population fox deaths
92 Predator prey model a Rabbits fox birth rate fox death rate b fox growth Fox population fox deaths fox growth = Foxes * Rabbits * growth rate a
93 Predator prey model a Rabbits fox fox birth birth rate rate fox death rate b fox growth Fox population fox deaths fox growth = Foxes * Rabbits * growth rate a fox deaths = Foxes * death rate b
94 Predator prey model a Rabbits fox fox birth birth rate rate fox death rate b fox growth Fox population fox deaths fox growth = Foxes * Rabbits * growth rate a fox deaths = Foxes * death rate b change in Foxes = fox growth fox deaths F = a F R b F
95 Predator prey model c d a b
96 Predator prey model R = c R d R F c d F = a F R b F a b
97 Predator prey model: Lotka-Volterra model R = c R d R F F = a F R b F the simplest model of predator-prey interactions one of the earliest models in mathematical ecology
98 Predator prey model: Equilibrium R = c R d R F F = a F R b F
99 Predator prey model: Equilibrium 0 = R = c R d R F 0 = F = a F R b F
100 Predator prey model: Equilibrium 0 = R = c R d R F 0 = F = a F R b F c R = d R F a F R = b F
101 Predator prey model: Equilibrium c R = d R F a F R = b F F = c / d R = b / a
102 Predator prey model R = b / a c d F = c / d a b
103 Model parameters
104 Questions?
105 Equilibrium population sizes
106 Building the model c d a b
107 Equilibrium population 300 Population Time (seasons) Foxes : Current "eq-foxes" : Current
108 Equilibrium population 1500 Population Time (seasons) Rabbits : Current "eq-rabbits" : Current
109 Equilibrium population Selected Variables Time (seasons) Foxes : Current Rabbits : Current
110 Equilibrium population 1500 Population Time (seasons) Rabbits : Current Foxes : Current "eq-rabbits" : Current "eq-foxes" : Current
111 Equilibrium population Oscillations are observed in both population sizes Oscillations occur around the equilibrium population values Dynamic equilibrium (not static) Oscillatory behaviour is similar to many natural, sociotechnological, and socio-economic systems (Pure) competition between the species, when one species (predator) grows at the expense of the other (prey) Dynamics and equilibria of each population are affected by dynamics of the others
112 Equilibrium population: phase diagrams 300 Phases Rabbits Foxes : Current
113 Equilibrium population: phase diagrams
114 Equilibrium population: phase diagrams 300 Phases Rabbits Foxes : Current
115 Equilibrium population: phase diagrams 300 Phases Rabbits Foxes : Current
116 The End?
117 Thank you! Prof. Mikhail Prokopenko Faculty of Engineering and IT: Complex Systems Research Cluster Starting in 2017: Master of Complex Systems (MCXS) University of Sydney 117
118 Two PhD Scholarships One Post-doc ARC Discovery Project: Large-scale computational modelling of epidemics in Australia University of Sydney & Monash University 118
Guided Study Program in System Dynamics System Dynamics in Education Project System Dynamics Group MIT Sloan School of Management 1
 Guided Study Program in System Dynamics System Dynamics in Education Project System Dynamics Group MIT Sloan School of Management 1 Solutions to Assignment #4 Wednesday, October 21, 1998 Reading Assignment:
Beginner Modeling Exercises Section 2 Mental Simulation of Simple Positive Feedback
 D-4487 Beginner Modeling Exercises Section 2 Mental Simulation of Simple Positive Feedback Stock Flow Growth Factor Prepared for the MIT System Dynamics in Education Project Under the Supervision of Dr.
ESD.36 System Project Management. Lecture 6. - Introduction to Project Dynamics. Instructor(s) Dr. James Lyneis. Copyright 2012 James M Lyneis.
 Dr. James Lyneis. Copyright 2012 James M Lyneis.") ESD.36 System Project Management Lecture 6 Introduction to Project Dynamics Instructor(s) Dr. James Lyneis Copyright 2012 James M Lyneis. System Dynamics Experience Survey Have you taken ESD.74, or 15.871
ESD.36 System Project Management Lecture 6 Introduction to Project Dynamics Instructor(s) Dr. James Lyneis Copyright 2012 James M Lyneis. System Dynamics Experience Survey Have you taken ESD.74, or 15.871
Structural Transparency of a
 Structural Transparency of a Factory Simulation Model Oleg Pavlov, WPI Khalid Saeed, WPI Larry Robinson, Cornell University Webinar at Department of International Finance, Financial University, Moscow,
Introduction to functions and models: LOGISTIC GROWTH MODELS
 Introduction to functions and models: LOGISTIC GROWTH MODELS 1. Introduction (easy) The growth of organisms in a favourable environment is typically modeled by a simple exponential function, in which the
Chapter 2. Software: (preview draft) Getting Started with Stella and Vensim
 Getting Started with Stella and Vensim") Chapter. Software: (preview draft) Getting Started with Stella and Vensim Stella and Vensim are icon-based programs to support the construction and testing of system dynamics models. I use these programs
Chapter. Software: (preview draft) Getting Started with Stella and Vensim Stella and Vensim are icon-based programs to support the construction and testing of system dynamics models. I use these programs
Graphical Integration Exercises. Part One: Exogenous Rates
 D-4547- Graphical Integration Exercises Part One: Exogenous Rates 47.9 8.00 3.59 3.00 0.00 -.00 0.00 3.00 6.00 9.00.00 Prepared for the MIT System Dynamics in Education Project Under the Supervision of
Graphical Integration Exercises Part Four: Reverse Graphical Integration
 D-4603 1 Graphical Integration Exercises Part Four: Reverse Graphical Integration Prepared for the MIT System Dynamics in Education Project Under the Supervision of Dr. Jay W. Forrester by Laughton Stanley
Cosumnes River College Principles of Macroeconomics Problem Set 3 Due September 17, 2015
 Cosumnes River College Principles of Macroeconomics Problem Set 3 Due September 17, 2015 Name: Solutions Fall 2015 Prof. Dowell Instructions: Write the answers clearly and concisely on these sheets in
MEASURING A NATION S INCOME
 10 MEASURING A NATION S INCOME WHAT S NEW IN THE FIFTH EDITION: There is more clarification on the GDP deflator. The Case Study on Who Wins at the Olympics? is now an FYI box. LEARNING OBJECTIVES: By the
System Dynamics (SD) and its Applications
 and its Applications") System Dynamics (SD) and its Applications Dr Zhiming Cai AMEC, Knutsford, Cheshire [email protected] Contents What is System Dynamics? SD Modelling Process Stock and Flow Model Building Checklist SD
System Dynamics (SD) and its Applications Dr Zhiming Cai AMEC, Knutsford, Cheshire [email protected] Contents What is System Dynamics? SD Modelling Process Stock and Flow Model Building Checklist SD
8.7 Exponential Growth and Decay
 Section 8.7 Exponential Growth and Decay 847 8.7 Exponential Growth and Decay Exponential Growth Models Recalling the investigations in Section 8.3, we started by developing a formula for discrete compound
Maintenance performance improvement with System Dynamics:
 Maintenance performance improvement with System Dynamics: A Corrective Maintenance showcase R.E.M. Deenen 1,2, C.E. van Daalen 1 and E.G.C. Koene 2 1 Delft University of Technology, Faculty of Technology,
System Behavior and Causal Loop Diagrams
 C H A P T E R 1 System Behavior and Causal Loop Diagrams Human beings are quick problem solvers. From an evolutionary standpoint, this makes sense if a sabertooth tiger is bounding toward you, you need
Biology Chapter 5 Test
 Name: Class: _ Date: _ Biology Chapter 5 Test Multiple Choice Identify the choice that best completes the statement or answers the question. 1. What does the range of a population tell you that density
Process management (2)
") Process management (2) International Business Program prof. UW dr hab. Krzysztof Klincewicz [email protected] TiMO (Department of Organization Theory and Methods) www.timo.wz.uw.edu.pl The Fifth
Process management (2) International Business Program prof. UW dr hab. Krzysztof Klincewicz [email protected] TiMO (Department of Organization Theory and Methods) www.timo.wz.uw.edu.pl The Fifth
The Credit Card Model
 D-4683-2 1 The Credit Card Model Prepared for the MIT System Dynamics in Education Project Under the Supervision of Prof. Jay W. Forrester by Manas Ratha June 16, 1997 Vensim Examples added October 2001
APPLICATION OF SIMULATION IN INVENTORY MANAGEMENT OF EOL PRODUCTS IN A DISASSEMBLY LINE
 APPLICATION OF SIMULATION IN INVENTORY MANAGEMENT OF EOL PRODUCTS IN A DISASSEMBLY LINE Badr O. Johar, Northeastern University, (617) 3737635, [email protected] Surendra M. Gupta, Northeastern University,
The Credit Card Model
 D-4683-2 1 The Credit Card Model Prepared for the MIT System Dynamics in Education Project Under the Supervision of Prof. Jay W. Forrester by Manas Ratha June 16, 1997 Vensim Examples added October 2001
Applying System Dynamics to Business: An Expense Management Example
 Applying System Dynamics to Business: An Expense Management Example Bill Harris Facilitated Systems http://facilitatedsystems.com/ May 17, 2000 Abstract If you re new to system dynamics, it may be hard
Cholera / Response / 1. Response to an Epidemic of Cholera
 Cholera / Response / 1 Response to an Epidemic of Cholera Goal of Response Activities Reduce deaths good case management mobilizing staff and supplies increasing access to care Prevent new cases intensive
Using System Dynamics to Model and Analyze a Distance Education Program
 Using System Dynamics to Model and Analyze a Distance Education Program Sahana Murthy, Rohit Gujrati and Sridhar Iyer Abstract Significant investments are being made into distance education programs around
ECONOMIC SUPPLY & DEMAND
 D-4388 ECONOMIC SUPPLY & DEMAND by Joseph Whelan Kamil Msefer Prepared for the MIT System Dynamics in Education Project Under the Supervision of Professor Jay W. Forrester January 4, 996 Copyright 994
Econ 202 Final Exam. Table 3-1 Labor Hours Needed to Make 1 Pound of: Meat Potatoes Farmer 8 2 Rancher 4 5
 Econ 202 Final Exam 1. If inflation expectations rise, the short-run Phillips curve shifts a. right, so that at any inflation rate unemployment is higher. b. left, so that at any inflation rate unemployment
PART 3 Dimensionless Model
 PART 3 Dimensionless Model In order to make a further analysis on stability of the system, sensitivity of parameters, feedback factors-we manipulate all the arguments and parameters to make them dimensionless.
Simple epidemic models
 Simple epidemic models Construct ODE (Ordinary Differential Equation) models Relationship between the diagram and the equations Alter models to include other factors. Simple epidemics SIS model Diagram
Unit 4: Measuring GDP and Prices
 Unit 4: Measuring GDP and Prices ECO 120 Global Macroeconomics 1 1.1 Reading Reading Module 10 - pages 106-110 Module 11 1.2 Goals Goals Specific Goals: Understand how to measure a country s output. Learn
Dynamic Systems Applied to Bed Management in a Public Hospital Specialized in Cardiology
 Dynamic Systems Applied to Bed Management in a Public Hospital Specialized in Cardiology João Chang Junior ([email protected]) Centro Universitário da FEI Suzana Bierrenbach de Souza Santos Centro Universitário
This means there are two equilibrium solutions 0 and K. dx = rx(1 x). x(1 x) dt = r
. x(1 x) dt = r") Verhulst Model For Population Growth The first model (t) = r is not that realistic as it either led to a population eplosion or to etinction. This simple model was improved on by building into this differential
Verhulst Model For Population Growth The first model (t) = r is not that realistic as it either led to a population eplosion or to etinction. This simple model was improved on by building into this differential
Macroeconomics 2301 Potential questions and study guide for exam 2. Any 6 of these questions could be on your exam!
 Macroeconomics 2301 Potential questions and study guide for exam 2 Any 6 of these questions could be on your exam! 1. GDP is a key concept in Macroeconomics. a. What is the definition of GDP? b. List and
Macroeconomia Capitolo 7. Seguire l andamento della macroeconomia. What you will learn in this chapter:
 Macroeconomia Capitolo 7 Seguire l andamento della macroeconomia PowerPoint Slides by Can Erbil 2006 Worth Publishers, all rights reserved What you will learn in this chapter: How economists use aggregate
Business and Economics Applications
 Business and Economics Applications Most of the word problems you do in math classes are not actually related to real life. Textbooks try to pretend they are by using real life data, but they do not use
7 AGGREGATE SUPPLY AND AGGREGATE DEMAND* Chapter. Key Concepts
 Chapter 7 AGGREGATE SUPPLY AND AGGREGATE DEMAND* Key Concepts Aggregate Supply The aggregate production function shows that the quantity of real GDP (Y ) supplied depends on the quantity of labor (L ),
Inventory Control in Closed Loop Supply Chain using System Dynamics
 Inventory Control in Closed Loop Supply Chain using System Dynamics Roberto Poles RMIT University, School of Business Information Technology 239 Bourke Street, Melbourne Vic 3000, Australia Tel. 61399255597
EXPONENTIAL FUNCTIONS 8.1.1 8.1.6
 EXPONENTIAL FUNCTIONS 8.1.1 8.1.6 In these sections, students generalize what they have learned about geometric sequences to investigate exponential functions. Students study exponential functions of the
Positive Feedback and Oscillators
 Physics 3330 Experiment #6 Fall 1999 Positive Feedback and Oscillators Purpose In this experiment we will study how spontaneous oscillations may be caused by positive feedback. You will construct an active
4 The M/M/1 queue. 4.1 Time-dependent behaviour
 4 The M/M/1 queue In this chapter we will analyze the model with exponential interarrival times with mean 1/λ, exponential service times with mean 1/µ and a single server. Customers are served in order
For additional information, see the Math Notes boxes in Lesson B.1.3 and B.2.3.
 EXPONENTIAL FUNCTIONS B.1.1 B.1.6 In these sections, students generalize what they have learned about geometric sequences to investigate exponential functions. Students study exponential functions of the
BADM 527, Fall 2013. Midterm Exam 2. Multiple Choice: 3 points each. Answer the questions on the separate bubble sheet. NAME
 BADM 527, Fall 2013 Name: Midterm Exam 2 November 7, 2013 Multiple Choice: 3 points each. Answer the questions on the separate bubble sheet. NAME 1. According to classical theory, national income (Real
Name: Date: 3. Variables that a model tries to explain are called: A. endogenous. B. exogenous. C. market clearing. D. fixed.
 Name: Date: 1 A measure of how fast prices are rising is called the: A growth rate of real GDP B inflation rate C unemployment rate D market-clearing rate 2 Compared with a recession, real GDP during a
1. a. Interest-bearing checking accounts make holding money more attractive. This increases the demand for money.
 Macroeconomics ECON 2204 Prof. Murphy Problem Set 4 Answers Chapter 10 #1, 2, and 3 (on pages 308-309) 1. a. Interest-bearing checking accounts make holding money more attractive. This increases the demand
How Curve Shape Can Influence Pump Selection
 Pump ED 101 How Curve Shape Can Influence Pump Selection Joe Evans, Ph.D http://www.pumped101.com If you are new to the pump arena, you may be a bit taken back by the number of pump models offered by various
Diána H. Knipl PhD student University of Szeged, Hungary
 ANTI-GRAVITY MODELS FOR EPIDEMIC SPREAD OF INFECTIOUS DISEASES ON LONG DISTANCE TRAVEL NETWORKS Diána H. Knipl PhD student University of Szeged, Hungary Based on the joint work with G. Röst (U of Szeged)
Do You Want Fries with That? Learning about Connection Circles: The Shape of Change
 Do You Want Fries with That? Learning about Connection Circles: The Shape of Change The text of Lesson 10: Do You Want Fries with That? Learning about Connection Circles From the books The Shape of Change
FIRST GRADE 1 WEEK LESSON PLANS AND ACTIVITIES
 FIRST GRADE 1 WEEK LESSON PLANS AND ACTIVITIES UNIVERSE CYCLE OVERVIEW OF FIRST GRADE UNIVERSE WEEK 1. PRE: Describing the Universe. LAB: Comparing and contrasting bodies that reflect light. POST: Exploring
Einführung in die Mathematische Epidemiologie: Introduction to Mathematical Epidemiology: Deterministic Compartmental Models
 Einführung in die Mathematische Epidemiologie: Introduction to Mathematical Epidemiology: Deterministic Compartmental Models Nakul Chitnis Universität Basel Mathematisches Institut Swiss Tropical and Public
Economics 212 Principles of Macroeconomics Study Guide. David L. Kelly
 Economics 212 Principles of Macroeconomics Study Guide David L. Kelly Department of Economics University of Miami Box 248126 Coral Gables, FL 33134 [email protected] First Version: Spring, 2006 Current
SHORT-RUN FLUCTUATIONS. David Romer. University of California, Berkeley. First version: August 1999 This revision: January 2012
 SHORT-RUN FLUCTUATIONS David Romer University of California, Berkeley First version: August 1999 This revision: January 2012 Copyright 2012 by David Romer CONTENTS Preface vi I The IS-MP Model 1 I-1 Monetary
The Dynamics of Software Project Staffing: A System Dynamics Based Simulation Approach
 The Dynamics of Software Project Staffing: A System Dynamics Based Simulation Approach IEEE Transactions on Software Engineering(TSE, 1989) TAREK K. ABDEL-HAMID Park, Ji Hun 2010.5.10 Contents Introduction
CHAPTER 6. Accounting and the Time Value of Money. 2. Use of tables. 13, 14 8 1. a. Unknown future amount. 7, 19 1, 5, 13 2, 3, 4, 7
 CHAPTER 6 Accounting and the Time Value of Money ASSIGNMENT CLASSIFICATION TABLE (BY TOPIC) Topics Questions Brief Exercises Exercises Problems 1. Present value concepts. 1, 2, 3, 4, 5, 9, 17 2. Use of
MAT12X Intermediate Algebra
 MAT12X Intermediate Algebra Workshop I - Exponential Functions LEARNING CENTER Overview Workshop I Exponential Functions of the form y = ab x Properties of the increasing and decreasing exponential functions
Millennium Development Goals Millennium Development Goal 6 To combat HIV/AIDS, malaria and other diseases
 1 Millennium Development Goals Millennium Development Goal 6 To combat HIV/AIDS, malaria and other diseases Information and activities Target To have halted and begun to reverse the spread of HIV/AIDS
Maths Workshop for Parents 2. Fractions and Algebra
 Maths Workshop for Parents 2 Fractions and Algebra What is a fraction? A fraction is a part of a whole. There are two numbers to every fraction: 2 7 Numerator Denominator 2 7 This is a proper (or common)
The Solow Model. Savings and Leakages from Per Capita Capital. (n+d)k. sk^alpha. k*: steady state 0 1 2.22 3 4. Per Capita Capital, k
k. sk^alpha. k*: steady state 0 1 2.22 3 4. Per Capita Capital, k") Savings and Leakages from Per Capita Capital 0.1.2.3.4.5 The Solow Model (n+d)k sk^alpha k*: steady state 0 1 2.22 3 4 Per Capita Capital, k Pop. growth and depreciation Savings In the diagram... sy =
Savings and Leakages from Per Capita Capital 0.1.2.3.4.5 The Solow Model (n+d)k sk^alpha k*: steady state 0 1 2.22 3 4 Per Capita Capital, k Pop. growth and depreciation Savings In the diagram... sy =
MULTIPLE CHOICE. Choose the one alternative that best completes the statement or answers the question.
 Econ 111 Summer 2007 Final Exam Name MULTIPLE CHOICE. Choose the one alternative that best completes the statement or answers the question. 1) The classical dichotomy allows us to explore economic growth
Lesson 7 - The Aggregate Expenditure Model
 Lesson 7 - The Aggregate Expenditure Model Acknowledgement: Ed Sexton and Kerry Webb were the primary authors of the material contained in this lesson. Section : The Aggregate Expenditures Model Aggregate
27Forecasting cash flows 27Activity 27.1 open-ended question.
 27Forecasting cash flows 27Activity 27.1 open-ended question. Activity 27.2 (page 497): April cash flow 1 Draw up a revised cash-flow forecast for April assuming: cash sales are forecast to be $1,000 higher
Chapter 54: Community Ecology
 Name Period Concept 54.1 Community interactions are classified by whether they help, harm, or have no effect on the species involved. 1. What is a community? List six organisms that would be found in your
Systems Dynamics Using Vensim Personal Learning Edition (PLE) Download Vensim PLE at http://vensim.com/freedownload.html
 Download Vensim PLE at http://vensim.com/freedownload.html") Systems Dynamics Using Personal Learning Edition (PLE) Download PLE at http://vensim.com/freedownload.html Quick Start Tutorial Preliminaries PLE is software designed for modeling one or more quantities
Systems Dynamics Using Personal Learning Edition (PLE) Download PLE at http://vensim.com/freedownload.html Quick Start Tutorial Preliminaries PLE is software designed for modeling one or more quantities
Thank You for Attention
 Thank You for Attention Explain how the foreign exchange market works. Examine the forces that determine exchange rates. Consider whether it is possible to predict future rates movements. Map the business
HIV case management helps you put the pieces together.
 HIV case management helps you put the pieces together. When you have HIV or AIDS, you have to take care of many things. It s like putting together a big puzzle and the pieces of the puzzle are things like
In this chapter we learn the potential causes of fluctuations in national income. We focus on demand shocks other than supply shocks.
 Chapter 11: Applying IS-LM Model In this chapter we learn the potential causes of fluctuations in national income. We focus on demand shocks other than supply shocks. We also learn how the IS-LM model
Basics of Causal Loop Diagrams: Structure & Behavior
 Basics of Causal Loop Diagrams: Structure & Behavior Nathaniel Osgood ([email protected]) Institute for System Science & Health Causal Loop Diagram Food Ingested Hunger Focuses on capturing causality
Cost-Effectiveness Analysis (CEA)
") Regional Training on Strategic and Operational Planning in HIV & AIDS Cost-Effectiveness Analysis (CEA) Julian Naidoo Barry Kistnasamy The Cost-Effectiveness Analysis A form of economic evaluation that
Regional Training on Strategic and Operational Planning in HIV & AIDS Cost-Effectiveness Analysis (CEA) Julian Naidoo Barry Kistnasamy The Cost-Effectiveness Analysis A form of economic evaluation that
MBA Data Analysis Pad John Beasley
 1 Marketing Analysis Pad - 1985 Critical Issue: Identify / Define the Problem: Objectives: (Profitability Sales Growth Market Share Risk Diversification Innovation) Company Mission: (Source & Focus for
Econ 202 Section 2 Midterm 1
 Douglas, Fall 2009 September 29, 2009 A: Special Code 0000 21 PLEDGE: I have neither given nor received unauthorized help on this exam. SIGNED: PRINT NAME: Econ 202 Section 2 Midterm 1 1. What will happen
Sample Fraction Addition and Subtraction Concepts Activities 1 3
 Sample Fraction Addition and Subtraction Concepts Activities 1 3 College- and Career-Ready Standard Addressed: Build fractions from unit fractions by applying and extending previous understandings of operations
Selected Homework Answers from Chapter 3
 elected Homework Answers from Chapter 3 NOTE: To save on space, I have not given specific labels to my axis, but rather stuck with just and. Ideally, you should put specific labels. For example, the vertical
7. Latches and Flip-Flops
 Chapter 7 Latches and Flip-Flops Page 1 of 18 7. Latches and Flip-Flops Latches and flip-flops are the basic elements for storing information. One latch or flip-flop can store one bit of information. The
Econ 303: Intermediate Macroeconomics I Dr. Sauer Sample Questions for Exam #3
 Econ 303: Intermediate Macroeconomics I Dr. Sauer Sample Questions for Exam #3 1. When firms experience unplanned inventory accumulation, they typically: A) build new plants. B) lay off workers and reduce
SIGNAL PROCESSING & SIMULATION NEWSLETTER
 1 of 10 1/25/2008 3:38 AM SIGNAL PROCESSING & SIMULATION NEWSLETTER Note: This is not a particularly interesting topic for anyone other than those who ar e involved in simulation. So if you have difficulty
Incidence and Prevalence
 Incidence and Prevalence TABLE OF CONTENTS Incidence and Prevalence... 1 What is INCIDENCE?... 1 What is PREVALENCE?... 1 Numerator/Denominator... 1 Introduction... 1 The Numerator and Denominator... 1
CHAPTER 5. CIRCULAR FLOW MODELS
 HAPTER 5. RULAR FLOW MODEL The behavior of a macroeconomic system is determined by the interactions of a great many actors and institutions. The first step in studying an economy is to simplify the picture
Econ 102 Aggregate Supply and Demand
 Econ 102 ggregate Supply and Demand 1. s on previous homework assignments, turn in a news article together with your summary and explanation of why it is relevant to this week s topic, ggregate Supply
Ecosystems and Food Webs
 Ecosystems and Food Webs How do AIS affect our lakes? Background Information All things on the planet both living and nonliving interact. An Ecosystem is defined as the set of elements, living and nonliving,
Managerial Economics Prof. Trupti Mishra S.J.M. School of Management Indian Institute of Technology, Bombay. Lecture - 13 Consumer Behaviour (Contd )
") (Refer Slide Time: 00:28) Managerial Economics Prof. Trupti Mishra S.J.M. School of Management Indian Institute of Technology, Bombay Lecture - 13 Consumer Behaviour (Contd ) We will continue our discussion
(Refer Slide Time: 00:28) Managerial Economics Prof. Trupti Mishra S.J.M. School of Management Indian Institute of Technology, Bombay Lecture - 13 Consumer Behaviour (Contd ) We will continue our discussion
Chapter 11. MRP and JIT
 Chapter 11 MRP and JIT (Material Resources Planning and Just In Time) 11.1. MRP Even if MRP can be applied among several production environments, it has been chosen here as a preferential tool for the
How To Understand Network Security
 Network Security: an Economic Perspective Marc Lelarge (INRIA-ENS) currently visiting STANFORD TRUST seminar, Berkeley 2011. Threats and Vulnerabilities Attacks are exogenous Contribution (1) Optimal security
2. More important - provide a profile of firm s economic characteristics and competitive strategies.
 RATIO ANALYSIS-OVERVIEW Ratios: 1. Provide a method of standardization 2. More important - provide a profile of firm s economic characteristics and competitive strategies. C Company Sales $ 100,000 $ 125,000
MATHEMATICS TEST. Paper 1 calculator not allowed LEVEL 6 TESTS ANSWER BOOKLET. First name. Middle name. Last name. Date of birth Day Month Year
 LEVEL 6 TESTS ANSWER BOOKLET Ma MATHEMATICS TEST LEVEL 6 TESTS Paper 1 calculator not allowed First name Middle name Last name Date of birth Day Month Year Please circle one Boy Girl Year group School
oil liquid water water liquid Answer, Key Homework 2 David McIntyre 1
 Answer, Key Homework 2 David McIntyre 1 This print-out should have 14 questions, check that it is complete. Multiple-choice questions may continue on the next column or page: find all choices before making
Long Run Growth Solow s Neoclassical Growth Model
 Long Run Growth Solow s Neoclassical Growth Model 1 Simple Growth Facts Growth in real GDP per capita is non trivial, but only really since Industrial Revolution Dispersion in real GDP per capita across
The Basics of System Dynamics: Discrete vs. Continuous Modelling of Time 1
 The Basics of System Dynamics: Discrete vs. Continuous Modelling of Time 1 Günther Ossimitz 2 Maximilian Mrotzek 3 University of Klagenfurt Department of Mathematics Universitätsstrasse 65 9020 Klagenfurt,
APEX Robot Rabbit. www.empyrion.demon.co.uk/apex/ Tel: 07786 637286 e-mail: [email protected]
 APEX Robot Rabbit Television programmes such as Robot Wars and Techno Games have inspired many people to have a go at building their own robots. Some of these robots are fantastically complicated, and
CHAPTER 6 FINANCIAL FORECASTING
 TUTORIAL NOTES CHAPTER 6 FINANCIAL FORECASTING 6.1 INTRODUCTION Forecasting represents an integral part of any planning process that is undertaken by all firms. Firms must make decisions today that will
Eigenvalues, Eigenvectors, and Differential Equations
 Eigenvalues, Eigenvectors, and Differential Equations William Cherry April 009 (with a typo correction in November 05) The concepts of eigenvalue and eigenvector occur throughout advanced mathematics They
Integer Operations. Overview. Grade 7 Mathematics, Quarter 1, Unit 1.1. Number of Instructional Days: 15 (1 day = 45 minutes) Essential Questions
 Essential Questions") Grade 7 Mathematics, Quarter 1, Unit 1.1 Integer Operations Overview Number of Instructional Days: 15 (1 day = 45 minutes) Content to Be Learned Describe situations in which opposites combine to make zero.
Grade 7 Mathematics, Quarter 1, Unit 1.1 Integer Operations Overview Number of Instructional Days: 15 (1 day = 45 minutes) Content to Be Learned Describe situations in which opposites combine to make zero.
14 ARITHMETIC OF FINANCE
 4 ARITHMETI OF FINANE Introduction Definitions Present Value of a Future Amount Perpetuity - Growing Perpetuity Annuities ompounding Agreement ontinuous ompounding - Lump Sum - Annuity ompounding Magic?
Analyzing the Statement of Cash Flows
 Analyzing the Statement of Cash Flows Operating Activities NACM Upstate New York Credit Conference 2015 By Ron Sereika, CCE,CEW NACM 1 Objectives of this Educational Session u Show how the statement of
This material is based on work supported by the U.S. Department of Agriculture, Extension Service & the U.S. EPA
 Revised April 1992 (reformatted May 2000) A Workbook for Certified Pesticide Applicators To accompany the VHS tape "Pesticides in the Environment" Based on materials developed by: Colorado State University